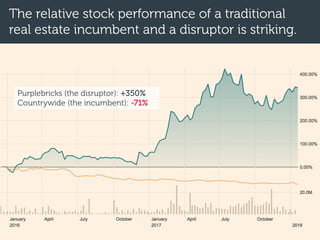
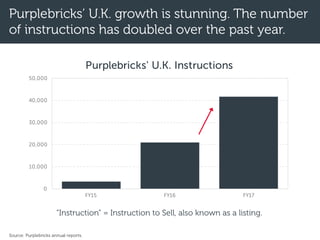
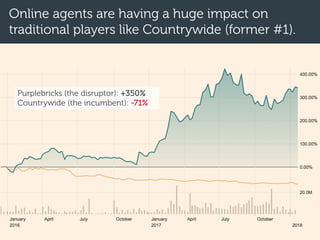
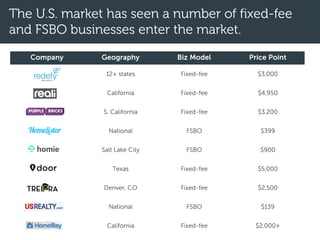
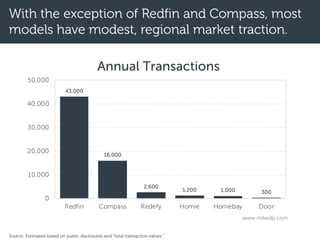
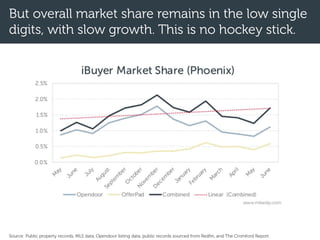
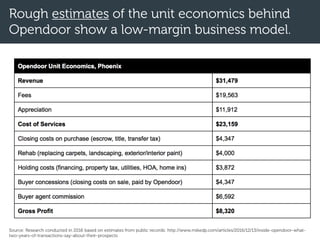
This document provides an overview and analysis of emerging models in the global real estate industry. It covers trends seen in markets like the UK, US, Australia, and Canada. In the UK, online fixed-fee agencies like Purplebricks have gained significant market share, with Purplebricks becoming the largest overall agency. Traditional incumbents like Countrywide have struggled with falling revenues and profits as their business model is disrupted. In the US, there is fragmentation with many new models testing different approaches, though Redfin and Compass have more substantial market share. A new model called iBuyers, led by Opendoor, is also emerging, providing certainty by purchasing homes directly from sellers for a fee. Overall the industry is being innovated through
2021 Emerging Models in Real Estate ReportMike DelPrete
The 2021 Emerging Models in Real Estate Report is focused on the fastest moving, biggest trends in residential real estate tech.
Follow the story of digital disruption, from the rise of online agencies in the U.K. to iBuyers and Power Buyers in the U.S. Track which models are disrupting traditional brokerage businesses, what's driving them on, what's holding them back, and how smart agents are responding.
Compass, the self-styled tech-enabled brokerage, recently went public with a valuation of $6.5 billion. If you're in real estate, it's a business worth paying attention to. I'm pleased to offer all of my thoughts, observations, and insights on the recent IPO into a new (free) report!
PropTech Applications Innovation and The Future of Real Estate PlatformPaul Nguyen
PropTech Applications Innovation and The Future of Real Estate Platform
P1. Introduction To Global PropTech Market & Investment Activity
P2. PropTech Overview
P3. Real Estate FinTech Applications Innovation
P4. The Future of A Real Estate Platform
P5. Q&A
Trulia Founder & NFX (www.nfx.com) Managing Partner Pete Flint uncovers what's really happening in PropTech and why you should care (hint: it will be a massive opportunity).
The Future of Real Estate Portals (Preview)Mike DelPrete
This all-new, global research takes a deep look into the future of real estate portals. The focus areas include portals’ expansion into adjacent revenue streams, closer to the transaction vs. more of the transaction, a deep dive into Rightmove’s growth dilemma, the implications for investors, and more.
Proptech - disruptive technologies and their impact on the real estate indust...Gyula Bajkai
An overview on PropTech and how it will impact the Real Estate Industry. PropTech brings us innovative business models, new technologies and better customer experiences.
The more customers meet these new kinds of experiences, the more important it will be for real estate players to put CX in focus when building digital products and services.
The presentation was held in Cyprus, at the 13th Real Estate Conference in Nicosia.
www.carangid.net
With so many options to choose from, real estate investors are regarded as "easiest to find, most difficult to close". If you want your pitch to stand out, you've got to generate credibility, trust and a professional connection - within the space of an 8-minute pitch.
Luckily, Unicorn's here to help. Because we've pitched hundreds of investors and (unlike others) actually raised capital for both publicly-listed and private companies, we know how to get a deal across the table in a way that's concise, clear and effective.
An evidence-based, 100+ slide presentation looking at the top real estate portals from around the globe. It gives an illuminating view of best practices, emerging trends, growth strategies, and common insights and challenges.
Real estate is the largest asset class in the world and archaic systems and processes establish opportunities for disruption across the ecosystem. Today’s catalysts, which include a macro digital shift, the arrival of 5G, and COVID’s lasting impact on how we live and work, position PropTech for accelerated growth.
Beyond Uber: How the Platform Business Model Connects the WorldApplicoInc
What do Airbnb, Alibaba, and Uber all have in common (besides multibillion-dollar valuations)? None of these companies directly create the value that their users consume. They all operate with a different business model: the platform. This talk explains the platform business model and how it works. It also looks at why this phenomenon is much bigger than consumer ecommerce and is starting to disrupt more traditional enterprise markets, including everything from enterprise software and CRM systems to healthcare and finance.
An evidence-based, 130+ slide presentation looking at the top real estate portals from around the world. There's new content, updated data, and plenty of new analysis and insights on the global real estate portal space.
Mapme Investor Deck.
The deck we originally used to raise our seed round of $1M. See the progress we've made at www.mapme.com. Welcome to try it out and create a map.
Any questions? I'm at ben@mapme.com
The 2022 iBuyer Report is 200+ slides of smart, crisp, evidence-based analysis of the evolving world of instant home buyers. Unmatched in its breadth and depth, it explores behind-the-scenes, national data and presents an unbiased strategic analysis of the sector, the players, and implications for the industry.
The iBuyer Report is a 160+ slide, evidence-based look at the world of instant home buyers. Unmatched in its breadth and depth, it explores behind-the-scenes, national data and presents an unbiased strategic analysis of the sector, the players, and the implications for the industry.
UKUPA Jan 09: User Experience In A DownturnUXPA UK
Gerred Blyth (Lighthouse Experience) and Be Kaler Blake (Aquent) presented on their perspective on the user experience industry and how companies and individuals can cope and find opportunities during the economic downturn. Discussions and pop quiz results from the evening are incorporated in the slides.
Everywhere you look this is significant innovation occurring in the real estate space. In this session, Mike DelPrete looks at new models that are gaining traction and disrupting real estate agents, and how property portals around the world are adapting to these changes. Finally, Mike dusts off the crystal ball and looks at the future of the online real estate industry.
An evidence-based, 100+ slide presentation looking at the top real estate portals from around the globe. It gives an illuminating view of best practices, emerging trends, growth strategies, and common insights and challenges.
2014 Tech M&A Monthly - New World of BuyersCorum Group
The world of buyers for technology companies is very different than it was just a few years ago. The rise of Private Equity, a new generation of international buyers, disruptive change creating new tech giants and destabilizing old ones – today, your ultimate buyer may be someone you've never heard of, in a country you've never visited. In the August edition of the Tech M&A Monthly webcast, join Corum Group dealmakers and experts as they examine the new classes of buyers that you need to be aware of as you consider your company’s future. Plus the key deals trends and valuations of the last month, and a special report on M&A in the gaming sector.
Terry naber. RE/MAX Properties, Colorado Springs, CO., 2014 Home Marketing Pr...excell4him
There is a reason why we sell homes faster for more value than most other generic real estate firms in Colorado Springs. Put our 24+ years of expertise to work for you.
We provide comprehensive Real Estate Services and implement a powerful marketing plan! This sets us apart as a dedicated Real Estate Company that is committed to your satisfaction. We work hard to assist you in showcasing your home, attract more qualified buyers, and sell your home successfully for more value in less time.
There is so much thought, knowledge and preparation that goes into a successful home-selling campaign. We will be your resourceful guide through every step. Let’s get started on formulating our strategic plan to get your home sold.
Terry Naber, Real Estate Agent
RE/MAX Properties, Colorado Springs, CO
www.TerrySellsColorado.com
Let's dive deeper into the world of ODC! Ricardo Alves (OutSystems) will join us to tell all about the new Data Fabric. After that, Sezen de Bruijn (OutSystems) will get into the details on how to best design a sturdy architecture within ODC.
JMeter webinar - integration with InfluxDB and GrafanaRTTS
Watch this recorded webinar about real-time monitoring of application performance. See how to integrate Apache JMeter, the open-source leader in performance testing, with InfluxDB, the open-source time-series database, and Grafana, the open-source analytics and visualization application.
In this webinar, we will review the benefits of leveraging InfluxDB and Grafana when executing load tests and demonstrate how these tools are used to visualize performance metrics.
Length: 30 minutes
Session Overview
-------------------------------------------
During this webinar, we will cover the following topics while demonstrating the integrations of JMeter, InfluxDB and Grafana:
- What out-of-the-box solutions are available for real-time monitoring JMeter tests?
- What are the benefits of integrating InfluxDB and Grafana into the load testing stack?
- Which features are provided by Grafana?
- Demonstration of InfluxDB and Grafana using a practice web application
To view the webinar recording, go to:
https://www.rttsweb.com/jmeter-integration-webinar
Smart TV Buyer Insights Survey 2024 by 91mobiles.pdf91mobiles
91mobiles recently conducted a Smart TV Buyer Insights Survey in which we asked over 3,000 respondents about the TV they own, aspects they look at on a new TV, and their TV buying preferences.
Dev Dives: Train smarter, not harder – active learning and UiPath LLMs for do...UiPathCommunity
💥 Speed, accuracy, and scaling – discover the superpowers of GenAI in action with UiPath Document Understanding and Communications Mining™:
See how to accelerate model training and optimize model performance with active learning
Learn about the latest enhancements to out-of-the-box document processing – with little to no training required
Get an exclusive demo of the new family of UiPath LLMs – GenAI models specialized for processing different types of documents and messages
This is a hands-on session specifically designed for automation developers and AI enthusiasts seeking to enhance their knowledge in leveraging the latest intelligent document processing capabilities offered by UiPath.
Speakers:
👨🏫 Andras Palfi, Senior Product Manager, UiPath
👩🏫 Lenka Dulovicova, Product Program Manager, UiPath
Transcript: Selling digital books in 2024: Insights from industry leaders - T...BookNet Canada
The publishing industry has been selling digital audiobooks and ebooks for over a decade and has found its groove. What’s changed? What has stayed the same? Where do we go from here? Join a group of leading sales peers from across the industry for a conversation about the lessons learned since the popularization of digital books, best practices, digital book supply chain management, and more.
Link to video recording: https://bnctechforum.ca/sessions/selling-digital-books-in-2024-insights-from-industry-leaders/
Presented by BookNet Canada on May 28, 2024, with support from the Department of Canadian Heritage.
Connector Corner: Automate dynamic content and events by pushing a buttonDianaGray10
Here is something new! In our next Connector Corner webinar, we will demonstrate how you can use a single workflow to:
Create a campaign using Mailchimp with merge tags/fields
Send an interactive Slack channel message (using buttons)
Have the message received by managers and peers along with a test email for review
But there’s more:
In a second workflow supporting the same use case, you’ll see:
Your campaign sent to target colleagues for approval
If the “Approve” button is clicked, a Jira/Zendesk ticket is created for the marketing design team
But—if the “Reject” button is pushed, colleagues will be alerted via Slack message
Join us to learn more about this new, human-in-the-loop capability, brought to you by Integration Service connectors.
And...
Speakers:
Akshay Agnihotri, Product Manager
Charlie Greenberg, Host
Neuro-symbolic is not enough, we need neuro-*semantic*Frank van Harmelen
Neuro-symbolic (NeSy) AI is on the rise. However, simply machine learning on just any symbolic structure is not sufficient to really harvest the gains of NeSy. These will only be gained when the symbolic structures have an actual semantics. I give an operational definition of semantics as “predictable inference”.
All of this illustrated with link prediction over knowledge graphs, but the argument is general.
LF Energy Webinar: Electrical Grid Modelling and Simulation Through PowSyBl -...DanBrown980551
Do you want to learn how to model and simulate an electrical network from scratch in under an hour?
Then welcome to this PowSyBl workshop, hosted by Rte, the French Transmission System Operator (TSO)!
During the webinar, you will discover the PowSyBl ecosystem as well as handle and study an electrical network through an interactive Python notebook.
PowSyBl is an open source project hosted by LF Energy, which offers a comprehensive set of features for electrical grid modelling and simulation. Among other advanced features, PowSyBl provides:
- A fully editable and extendable library for grid component modelling;
- Visualization tools to display your network;
- Grid simulation tools, such as power flows, security analyses (with or without remedial actions) and sensitivity analyses;
The framework is mostly written in Java, with a Python binding so that Python developers can access PowSyBl functionalities as well.
What you will learn during the webinar:
- For beginners: discover PowSyBl's functionalities through a quick general presentation and the notebook, without needing any expert coding skills;
- For advanced developers: master the skills to efficiently apply PowSyBl functionalities to your real-world scenarios.
PHP Frameworks: I want to break free (IPC Berlin 2024)Ralf Eggert
In this presentation, we examine the challenges and limitations of relying too heavily on PHP frameworks in web development. We discuss the history of PHP and its frameworks to understand how this dependence has evolved. The focus will be on providing concrete tips and strategies to reduce reliance on these frameworks, based on real-world examples and practical considerations. The goal is to equip developers with the skills and knowledge to create more flexible and future-proof web applications. We'll explore the importance of maintaining autonomy in a rapidly changing tech landscape and how to make informed decisions in PHP development.
This talk is aimed at encouraging a more independent approach to using PHP frameworks, moving towards a more flexible and future-proof approach to PHP development.
UiPath Test Automation using UiPath Test Suite series, part 3DianaGray10
Welcome to UiPath Test Automation using UiPath Test Suite series part 3. In this session, we will cover desktop automation along with UI automation.
Topics covered:
UI automation Introduction,
UI automation Sample
Desktop automation flow
Pradeep Chinnala, Senior Consultant Automation Developer @WonderBotz and UiPath MVP
Deepak Rai, Automation Practice Lead, Boundaryless Group and UiPath MVP
Search and Society: Reimagining Information Access for Radical FuturesBhaskar Mitra
The field of Information retrieval (IR) is currently undergoing a transformative shift, at least partly due to the emerging applications of generative AI to information access. In this talk, we will deliberate on the sociotechnical implications of generative AI for information access. We will argue that there is both a critical necessity and an exciting opportunity for the IR community to re-center our research agendas on societal needs while dismantling the artificial separation between the work on fairness, accountability, transparency, and ethics in IR and the rest of IR research. Instead of adopting a reactionary strategy of trying to mitigate potential social harms from emerging technologies, the community should aim to proactively set the research agenda for the kinds of systems we should build inspired by diverse explicitly stated sociotechnical imaginaries. The sociotechnical imaginaries that underpin the design and development of information access technologies needs to be explicitly articulated, and we need to develop theories of change in context of these diverse perspectives. Our guiding future imaginaries must be informed by other academic fields, such as democratic theory and critical theory, and should be co-developed with social science scholars, legal scholars, civil rights and social justice activists, and artists, among others.
GraphRAG is All You need? LLM & Knowledge GraphGuy Korland
Guy Korland, CEO and Co-founder of FalkorDB, will review two articles on the integration of language models with knowledge graphs.
1. Unifying Large Language Models and Knowledge Graphs: A Roadmap.
https://arxiv.org/abs/2306.08302
2. Microsoft Research's GraphRAG paper and a review paper on various uses of knowledge graphs:
https://www.microsoft.com/en-us/research/blog/graphrag-unlocking-llm-discovery-on-narrative-private-data/
2. I’m fascinated by the opportunity in real estate tech. The process
of buying and selling houses is complex and uncertain, with
many opportunities for improvement. A number of smart
entrepreneurs and innovative companies around the world are
trying new things, and a certain few are nailing it.
In this report, I cover the trends that are changing the industry
and the major players gaining traction around the world. The
scope is global, because we all have a lot to learn no matter
where we live.
I'm a strategic advisor and global expert in real estate tech. I’m a
former tech entrepreneur and head of strategy at a major real
estate portal. Now I travel the world engaging with leading
property portals and real estate tech businesses, working on
strategy, sharing insights, and helping them grow.
Mike DelPrete
March 2018
An introduction
3. 2018 Emerging Models in Real Estate Report
A global snapshot
The U.K. market: the front line of
disruption
A leader in disruption: Purplebricks in
the U.K.
How the U.K.’s biggest incumbent is
reacting to digital disruption
U.S. market overview: fragmentation
and innovation
Inside Opendoor and the rise of
iBuyers
Highlights and trends from Australia
and Canada
Comparing some of the top emerging
models
Homepage analysis and customer
propositions
Product pricing and packaging
Tech platforms of the most successful
models
Tech-led or tech-enabled: staffing
breakdowns
The role of traditional real estate
agents
Key learnings and insights from the
global leaders
4
9
19
29
39
44
64
74
87
140
151
164
176
182
5. This report -- and two years of research -- started
with one key question.
What are the new
models gaining traction
that are changing the
way people buy and sell
residential real estate?
6. The global landscape is large and varied. There
are hundreds of players, but not all are successful.
This report is a market scan that pulls
out facts, highlights insights and
draws conclusions. It’s meant to be
representative, not comprehensive.
As with all of my work, there is a
specific focus on data and evidence.
I attempt to let the charts speak for
themselves.
I’ve spent the past two years focused
on this market opportunity. This
report is based on speaking to,
analyzing, and working with over
100 different companies, and talking
to dozens of global leaders.
7. This summary focuses on a set of businesses that
I’ve deemed to be successful.
I have focused on models that:
• Are gaining meaningful market traction (and
not just early adopters).
• Have business models and unit economics that
support a profitable, long-term business.
• Are operating in developed, mature markets.
Why? Because during my analysis it became apparent that almost
all of the new model innovation originated in developed markets
(specifically the U.K., Australia, and North America).
8. There are so many active players in this space
because the opportunity is huge.
Country Transactions
Avg. sale
price
Avg.
commission
Annual
commission pool
United States 5,600,000 $223,000 5.0% $62B
Australia 500,000 $471,000 2.0% $4.7B
United Kingdom 1,200,000 $275,000 1.4% $4.6B
New Zealand 90,000 $318,000 2.8% $801M
The amount of commission paid to
real estate agents annually.
10. The relative stock performance of a traditional
real estate incumbent and a disruptor is striking.
Purplebricks (the disruptor): +350%
Countrywide (the incumbent): -71%
11. One of the most prominent new models is the
fixed-fee online agency.
• Customers pay a fixed-fee (Purplebricks charges
£849 in the U.K.).
• Customers typically pay up-front, regardless of
whether the home sells.
• Online agents offer broadly the same services
as a traditional agent, backed by customer-
friendly tech platforms.
12. Part of their customer proposition is saving home
sellers money.
$0
$2,000
$4,000
$6,000
$8,000
$10,000
$12,000
$14,000
$16,000
New Zealand Australia
(Purplebricks)
Australia UK USA
Average Customer Savings with
Fixed-Fee Models
Typical Agent Commission Fixed-fee Price www.mikedp.com
13. £0
£1,000
£2,000
£3,000
£4,000
Typical Agent Tepilo Purplebricks Yopa Emoov HouseSimple
Estate Agent Fees (U.K.)
www.mikedp.com
In the U.K., fixed-fee services offer to save
consumers an average of £2,000.
Note: Assumes £225,000 home price and 1.3% commission.
14. Several online agents are now offering a “no sale,
no fee” service at a higher price point.
Note: Assumes £225,000 home price and 1.3% commission.
£0
£1,000
£2,000
£3,000
£4,000
Typical Agent Tepilo Purplebricks Yopa Emoov HouseSimple
Estate Agent Fees (U.K.)
www.mikedp.com
15. Measured by the number of live listings, it appears
to be a “winner take most” market dynamic.
Live listings are a snapshot of overall activity, and are not
a reflection of total sales or listings throughout the year.
0
2,000
4,000
6,000
8,000
10,000
12,000
14,000
16,000
18,000
Purplebricks Yopa Emoov HouseSimple Tepilo EasyProperty Doorsteps Settled
Live For Sale Listings (February 2018)
www.mikedp.com
Source: Zoopla, MDP analysis.
Purplebricks is winning
16. This dynamic is unsurprising due to the lack of
product differentiation and network effects.
• No product
differentiation
• No network
effects
Source Purplebricks half-year results.
17. The online agencies are growing at vastly
different rates, with Purplebricks leading the pack.
Source: Zoopla.
0
2,000
4,000
6,000
8,000
10,000
12,000
14,000
16,000
18,000
Purplebricks Yopa eMoov
Yearly Growth in Live Listings
Listings (Oct 2016) Listings (Oct 2017)
www.mikedp.com
18. Raising a lot of money doesn’t guarantee success,
but it sure helps.
Note: Live listings as of Feb 2018.
£0
£20,000,000
£40,000,000
£60,000,000
£80,000,000
£100,000,000
0
4,000
8,000
12,000
16,000
20,000
Purplebricks Yopa Emoov HouseSimple EasyProperty Settled
Market traction relative to money raised (U.K.)
Live Listings Money Raised (pounds) www.mikedp.com
19. A leader in disruption:
Purplebricks in the U.K.
20. Purplebricks is the largest of a new breed of fixed-
fee online agency, based in the U.K.
• The business model combines FSBO and
traditional agency with a lower price point and
better customer experience.
• Around 5% market share in the U.K. market
(~60K houses annually).
• Has an online platform and service centre to
support its local property experts.
• Expanded to Australia (September 2016) and
U.S. (September 2017).
21. Purplebricks’ has become the largest overall U.K.
estate agency and the largest online agency.
Source: Purplebricks annual report.
22. Purplebricks’ U.K. growth is stunning. The number
of instructions has doubled over the past year.
0
10,000
20,000
30,000
40,000
50,000
FY15 FY16 FY17
Purplebricks' U.K. Instructions
Source: Purplebricks annual reports.
“Instruction” = Instruction to Sell, also known as a listing.
23. The business is scaling well. Revenues more than
doubled with a small marketing increase.
£0
£10,000,000
£20,000,000
£30,000,000
£40,000,000
£50,000,000
FY16 FY17
Revenue and Sales and Marketing
Expense Growth
Revenue Sales and Marketing
www.mikedp.com
Source: Purplebricks annual reports.
24. Revenues increased by £24.6 million while sales
and marketing expenses increased by £1.5 million.
Source: Purplebricks annual reports.
25. Each £ spent on sales and marketing is generating
more revenue and a higher ROI.
2.8x
3.2x
4.0x
0.0x
1.0x
2.0x
3.0x
4.0x
5.0x
H1 17 H2 17 H1 18
Purplebricks' Marketing ROI (U.K.)
Marketing ROI (Revenue per £ Spent) www.mikedp.com
Source: Purplebricks annual reports, MDP calculations.
26. Customer acquisition costs are dropping
significantly as the business reaches scale.
£0
£100
£200
£300
£400
£500
£600
£700
FY16 FY17
Customer Acquisition Costs
www.mikedp.com
Overall market traction
and dropping acquisition
costs are justifying
Purplebricks’ huge initial
(and ongoing) marketing
spend.
It also proves that the
model works and can
scale, with customer
acquisition costs roughly
a third of the average
ticket size.
Source: company data and MDP estimates.
27. Each local property expert (LPE) is listing nearly
100 properties each year. Efficiency is key.
Source: company data and MDP estimates using year-end figures.
0
50
100
150
200
250
300
350
400
450
500
FY16 FY17
Purplebricks' Instructions per Local
Property Expert (LPE)
LPEs Instructions/LPE
www.mikedp.com
28. As the business scales, the average revenue and
cost per instruction (listing) are equalizing.
Source: company data and MDP estimates.
£0
£200
£400
£600
£800
£1,000
£1,200
£1,400
£1,600
FY16 FY17
Average Revenue and Cost per
Instruction
Average Cost per Instruction Average Revenue per Instruction
www.mikedp.com
29. How the U.K.’s biggest
incumbent is reacting to
digital disruption
30. Online agents are having a huge impact on
traditional players like Countrywide (former #1).
Purplebricks (the disruptor): +350%
Countrywide (the incumbent): -71%
31. Revenues suffered as home sales fell from 33,940
in the first half of last year to 27,100 this year.
£0
£100,000,000
£200,000,000
£300,000,000
£400,000,000
Total Revenue Estate Agency Revenue
Countrywide's Dropping Revenues
2016 H1 2017H1
www.mikedp.com
Source: company data.
32. Pre-tax profits were down an incredible 98% in
the six months to June 2017.
£24,300,000
£447,000
£0
£5,000,000
£10,000,000
£15,000,000
£20,000,000
£25,000,000
£30,000,000
2016 H1 2017H1
Countrywide's Pre-tax Profits
www.mikedp.com
Source: company data.
33. Countrywide’s average fee is dropping and
showing evidence of compression.
Source: Exane BNP Paribas Research
Countrywide’s Average Fee
34. Countrywide launched its own online offering to
try and compete with the online agencies.
This initiative is currently “on hold.”
35. But it suffers from a lack of strategic advantage as
a brand extension, instead of a new fighter brand.
By launching a brand extension,
Countrywide is missing out on
the classic benefits of a fighter
brand: eliminating competition,
protecting the existing premium
offering, and opening up new,
lower-end markets for the
organization.
Countrywide’s approach begs
the question: Is the offering
truly meant to succeed?
36. Meanwhile, its investment bank, Jefferies,
continued to boost the stock as it fell last year…
Buy
Hold
Buy
Buy Buy
Hold Hold
Purplebricks
launches
Purplebricks
floats on stock
exchange
Buy
Buy
Buy
Buy
Countrywide’s Stock Price
37. …while at the same time maintaining a negative
view of Purplebricks during its rise.
Underperform
Underperform
Underperform
Underperform
Purplebricks’ Stock Price
38. Which highlights the risk of institutional bias
when disruptive models threaten the status quo.
0
200
400
600
800
1000
Countrywide LSL ZPG Rightmove Foxtons Purplebricks
DaysRecommended
Jefferies Stock Recommendations
August 2013 - March 2017
Buy Hold Sell
Corporate Clients
of Jefferies
Direct Competitors of
Corporate Clients
40. Company Geography Biz Model Price Point
12+ states Fixed-fee $3,000
California Fixed-fee $4,950
S. California Fixed-fee $3,200
National FSBO $399
Salt Lake City FSBO $900
Texas Fixed-fee $5,000
Denver, CO Fixed-fee $2,500
National FSBO $139
California Fixed-fee $2,000+
The U.S. market has seen a number of fixed-fee
and FSBO businesses enter the market.
41. These models offer a wide range of sell-side price
points for varying degrees of service.
$- $1,000 $2,000 $3,000 $4,000 $5,000 $6,000 $7,000
USRealty
Homelister
Homie
Homebay
Trelora
Redefy
Purplebricks
Redfin
Reali
Door
Compass
Traditional agent
Selling Costs
www.mikedp.com
Notes: all based on a $250k transaction. Traditional agent 2.5% sale fee, Compass 2.5% sale fee, Redfin 1.5% sale fee.
42. With the exception of Redfin and Compass, most
models have modest, regional market traction.
43,000
16,000
2,600
1,200 1,000 300
0
10,000
20,000
30,000
40,000
50,000
Redfin Compass Redefy Homie Homebay Door
Annual Transactions
www.mikedp.com
Source: Estimated based on public disclosures and “total transaction values.”
43. But new players like Opendoor, called iBuyers, are
turning the home selling process on its head.
45. Opendoor is one of the most high-profile real
estate disruptors in the U.S. market.
• Opendoor buys and flips houses.
• It has raised over $355 million and is valued at
over $1 billion.
• Incredible customer proposition focused on
reducing friction and delivering certainty.
• Charges a fee of around 7% -- slightly higher
than the 6% average in the U.S.
46. $30M
$32.5M
Phoenix, Las Vegas, Orlando
Phoenix, Tampa, Las Vegas,
Orlando, Atlanta, SLC
Atlanta
San Diego, Inland Empire
In 2017, a number of iBuyers raised significant
money and launched competing services.
$65M London
48. Opendoor is buying and selling hundreds of
houses each month in a handful of markets.
0
40
80
120
160
200
240
280
320
January
February
M
arch
April
M
ay
June
July
AugustSeptem
ber
O
ctoberN
ovem
berD
ecem
ber
Opendoor Home Sales (PHX+DFW)
2016 2017
www.mikedp.com
Source: Public property records, MLS data, Opendoor listing data, public records sourced from Redfin.
49. But overall market share remains in the low single
digits, with slow growth. This is no hockey stick.
Source: Public property records, MLS data, Opendoor listing data, public records sourced from Redfin, and The Cromford Report.
50. In Phoenix, the overall market share (for sales)
grew 48% from 2016 to 2017 YTD.
1.1%
1.6%
0.0%
0.4%
0.8%
1.2%
1.6%
2.0%
2016 2017YTD
iBuyer Market Share
www.mikedp.com
The market is growing. No matter your
personal opinion of the model, consumers are
drawn to iBuyers in increasing numbers.
48%
Market share is defined as total units bought and sold.
51. The price paid by Opendoor when purchasing
homes is tightly clustered. This is its sweet spot.
Source: Public property records, MLS data, Opendoor listing data, and public records sourced from Redfin.
52. In 2016, Opendoor resold houses for an average
of a 5.5% higher price, before expenses.
Source: Public property records, MLS data, Opendoor listing data, and public records sourced from Redfin.
53. During 2017, this number increased to an average
of 7.4% per home, an important gain.
Gross margin is a top line number (hence “gross” and not “net”),
meaning it does not include the numerous costs associated
with holding, repairing, and reselling a house.
Source: Public property records, MLS data, Opendoor listing data, public records sourced from Redfin, and The Cromford Report.
54. In Phoenix, Opendoor’s largest market, it
continues to buy more houses year over year.
Source: Public property records, MLS data, Opendoor listing data, and public records sourced from Redfin.
0
40
80
120
160
200
240
280
January
February
M
arch
April
M
ay
June
July
August
Septem
ber
O
ctober
N
ovem
ber
D
ecem
ber
Opendoor Home Purchases (Phoenix)
2016 2017 www.mikedp.com
55. Viewed another way, the significant uptick in Q4
purchases becomes clear. It’s ramping up.
Source: Public property records, MLS data, Opendoor listing data, and public records sourced from Redfin.
47
122
142
152
62
132
156
220
0
40
80
120
160
200
240
Q1 Q2 Q3 Q4
Opendoor's Average Home
Purchases Per Month (Phoenix)
2016 2017
www.mikedp.com
56. And compared to its top competitor, both
companies are growing market share.
Source: Public property records, MLS data, Opendoor listing data, and public records sourced from Redfin.
116
143
21
83
0
40
80
120
160
200
240
2016 2017
Average Home Purchases Per
Month (Phoenix)
Opendoor OfferPad www.mikedp.com
57. Opendoor is also selling 40% more homes year-
on-year in Phoenix.
Source: Public property records, MLS data, Opendoor listing data, and public records sourced from Redfin.
0
40
80
120
160
200
January
February
M
arch
April
M
ay
June
July
August
Septem
ber
O
ctober
N
ovem
ber
D
ecem
ber
Opendoor Home Sales (Phoenix)
2016 2017 www.mikedp.com
58. Average monthly home sales are up 82%, again
with a growing market share for both companies.
Source: Public property records, MLS data, Opendoor listing data, and public records sourced from Redfin.
90
126
14
63
0
40
80
120
160
200
2016 2017
Average Home Sales Per
Month (Phoenix)
Opendoor OfferPad www.mikedp.com
59. A summary of all Phoenix activity shows
Opendoor accelerating at the end of the year.
Source: Public property records, MLS data, Opendoor listing data, and public records sourced from Redfin.
0
50
100
150
200
250
300
350
400
450
January
February
M
arch
April
M
ay
June
July
AugustSeptem
ber
O
ctober
N
ovem
ber
D
ecem
ber
Opendoor vs. OfferPad Activity (PHX)
Opendoor OfferPad
www.mikedp.com
60. On average, it takes Opendoor 13 days to prep a
purchased home for resale.
This number is down 35 percent
from 20 days in 2016, a reflection
of improving operational efficiency.
Source: Public property records, MLS data, Opendoor listing data, and public records sourced from Redfin.
Opendoor Prep Days
61. This compares favorably to its top competitor,
OfferPad, where the average is 3x higher: 41 days.
Source: Public property records, MLS data, Opendoor listing data, and public records sourced from Redfin.
OfferPad Prep Days
62. Rough estimates of the unit economics behind
Opendoor show a low-margin business model.
Source: Research conducted in 2016 based on estimates from public records: http://www.mikedp.com/articles/2016/12/13/inside-opendoor-what-
two-years-of-transactions-say-about-their-prospects
63. Only a small portion of Opendoor’s sales occur
off the MLS, and even then still include agents.
2016 2017
9%
95 sales
6%
41 sales
Non-MLS sales are in part driven by Opendoor emailing
new homes to agents to give their buyers early access.
65. The Australian market is getting more crowded
with FSBO and online agents.
Company Annual Listings Biz Model Price Point
1,800 FSBO $600
1,900 FSBO $700
60
(just launched)
Fixed-fee $7,500
<10
(just launched)
Fixed-fee $7,500
Have been
around for a
number of
years.
Recently
launched on
the back of
Purplebricks’
success.
66. Australia even has its own Opendoor iBuyer
model, Sellable, which launched in late 2017.
67. Listings growth at the Australian FSBO operators
is slow, while Purplebricks is growing strong.
Source: Listing data from realestate.com.au.
0
500
1,000
1,500
2,000
2,500
11/16 2/17 5/17 8/17 11/17 2/18
Listings Growth in Australia
PropertyNow Forsalebyowner Purplebricks Buymyplace
www.mikedp.com
Strong start, but
slowing a bit.
68. Purplebricks’ average number of sales has nearly
doubled in two subsequent 6 month periods.
0
10
20
30
40
50
60
70
80
Queensland Victoria
Average Sales per Month
Nov 2016-Apr2017 May-Oct 2017
www.mikedp.com
Source: Sold data from realestate.com.au.
Up 79%
Up 97%
69. My April ‘17 analysis shows the Purplebricks
proposition appealing to lower-end customers.
Source: Sold data from realestate.com.au.
Overall Market Median
Home Value
Purplebricks Home Values in Victoria
70. Which is consistent across the various Australian
regional markets.
Source: Sold data from realestate.com.au.
Overall Market Median
Home Value
Purplebricks Home Values in Queensland
71. At any one time, Purplebricks is averaging 12.7
active listings per local property expert (LPE).
Source: Listing data from realestate.com.au.
0 2 4 6 8 10 12 14 16 18 20
South Australia
Western Australia
Queensland
Victoria
NSW
Active Listings per LPE
www.mikedp.com
72. Meanwhile, in Canada, ComFree has become a
world leader in FSBO operations.
• Comfree is a FSBO operation in Canada.
• 25% total market share in Quebec.
• Lists over 40,000 houses annually.
• Average revenue of ~$1,000 USD per customer.
• Around 400 staff, mainly in call centres
(centralized support services).
73. ComFree combines its anti-agent proposition
with high-touch support and a leading portal.
75. Each business has grown well in its own right, all
darlings of the venture community.
Year Launched 2012 2004 2014
Valuation
(USD)
$2.2 billion $1.98 billion $1.5 billion
Money Raised
(USD)
$775 million $305 million $190 million
Source: Valuations as of January 2018. Includes proceeds from Redfin and Purplebricks IPOs.
76. Each dollar of investment raised has resulted in
varied revenues. Low-cost model = lower revenue.
Note: 2017 or FY17 Revenues. Compass (pre-Softbank) excludes the $450 million raised from Softbank in December 2017.
$0.00
$0.20
$0.40
$0.60
$0.80
$1.00
$1.20
$1.40
Compass Compass (pre-
Softbank)
Redfin Purplebricks
Revenue per Each Dollar Raised
www.mikedp.com
77. Each business is quite different when it comes to
fees, average home value, and market traction.
Transactions 16,000 45,000 50,000
Listing fee 2.5% - 3% 1% - 1.5% $1,100
Annual Value of
Homes Sold
$14 billion $19.8 billion $7.65 billion
Annual Gross
Revenues $350 million $370 million $117 million
Average
Transaction Sale
Price
$875,000 $459,000 $221,000
Source: Compass numbers provided by Compass, Redfin numbers are FY17 actuals, and Purplebricks are based on 8 months of actuals.
High fee, high value
(luxury)
Goldilocks? Low fee, high volume
78. In the U.S., Redfin is demonstrating consistent
growth in transactions and market share.
Source: Redfin’s public disclosures.
0.0%
0.1%
0.2%
0.3%
0.4%
0.5%
0.6%
0.7%
0.8%
0
2,000
4,000
6,000
8,000
10,000
12,000
14,000
16,000
Q3 15 Q4 15 Q1 16 Q2 16 Q3 16 Q4 16 Q1 17 Q2 17 Q3 17 Q4 17
Redfin's Market Share by Quarter
# Transactions U.S. Market Share
www.mikedp.com
79. With corresponding revenue growth, up around
45% per year.
Source: Redfin’s public disclosures.
$0
$50
$100
$150
$200
$250
$300
$350
$400
2014 2015 2016 2017
Millions
Redfin's Revenue Growth
www.mikedp.com
80. $0
$50
$100
$150
$200
$250
$300
$350
$400
2014 2015 2016 2017
Millions
Revenue Growth
Redfin Purplebricks (U.K.) www.mikedp.com
As a percentage, Purplebricks is growing revenue
much faster, but from a smaller base.
The timing isn’t directly comparable. Redfin is calendar year, while Purplebricks 2017 is eight months of 2017 and four months of 2018.
Up 195% from 2014
Up 1,906% from 2014
81. Purplebricks’ transaction volume is growing faster
than Redfin, both absolutely and relatively.
0
10,000
20,000
30,000
40,000
50,000
60,000
2014 2015 2016 2017
Transaction Volumes
Redfin Purplebricks (U.K.) www.mikedp.com
Source: Public disclosures. 2017 actuals for Redfin and two actual quarters for Purplebricks. Purplebricks based on 78% listing-to-sale completion
ratio.
82. A big part of Compass’ value proposition to agents
& investors is tech to make agents more efficient.
Compass is currently working to assemble the
first modern real estate platform in an effort to
reduce friction and frustration associated with
selling, buying or renting property by providing
real estate agents tools that increase efficiency
and sales volume.
“
”
The efficiency gain from a technology platform should be
evident by the number of transactions each agent
completes per year, commonly called “production.”
83. 0
15
30
45
60
Industry Average Compass Redfin Purplebricks (U.K.)
Avg. # of Transactions/Agent/Year
www.mikedp.com
Production (the average number of transactions
per agent per year) is a reflection of efficiency.
Actually more efficient
More efficient?
Source: Public statements and disclosures, based on full year results and number of agents at the midpoint of that year. Industry average of 7/year
based on various Inman reports and Real Trends report for 2016. Purplebricks based on 78% listing-to-sale completion ratio.
84. Compass has announced plans to achieve 20
percent market share in 20 cities by 2020.
Transactions 16,000 43,000 42,000
Listing fee 2.5% - 3% 1% - 1.5% $1,100
Annual Value of
Homes Sold
$14 billion $19.8 billion $7.65 billion
Annual Revenues $350 million $365 million $57 million
Average
Transaction Sale
Price
$875,000 $459,000 $221,000
The economics will completely
change if Compass wants to
reach mass-market appeal at
anything close to 20 percent
market share.
Average sale price will be cut in
half, with a corresponding drop in
incremental revenues.
The model works for luxury
homes, but can it translate to a
more mainstream audience?
85. Customer acquisition costs continue to drop,
making each marketing dollar more efficient.
Source: H1 2018 vs H1 2017 for Purplebricks, quarter ending Sept 30 2017 vs Sept 30 2016 for Redfin.
$0
$100
$200
$300
$400
$500
$600
Purplebricks (U.K.) Redfin
Customer Acquisiton Costs
2016 2017
www.mikedp.com
86. While all leaders, each is achieving success in its
own way.
• Strong correlation between price point and
transaction volumes.
• Higher the fee, higher the revenue.
• Compass faces growth challenges; not actually
a more efficient playform for agents.
• Hats off to Purplebricks for the incredible
volume growth in such a short time, to
Compass for its fundraising prowess, and Redfin
for slow(er) and steady growth.
89. Purplebricks: the leading U.K. online agency.
A valuation is the primary
call to action.
Customer reviews to build
credibility and reflect
mass-market appeal.
103. PropertyNow: an Australian FSBO operation.
A prominent call to action, but “get started” with what? A
valuation, how much I can save, choose a product package?
107. Upside: an Australian online agency.
The same, clear call to action to book a valuation.
Reviews (but significantly
less than similar U.K.
players).
109. DuProprio / ComFree: a leading Canadian FSBO
business.
With a property portal as part of its core business, the home
search process is also highlighted.
An interesting twist on initial engagement, DuProprio
offers introductory info sessions to learn more.
111. Redfin: a leading online agency in the U.S.
The headline is
about selling, but the
default call to action
is a home search.
Valuations are
accessible here.
117. Trelora: a fixed-fee online agency in the U.S.
Super tiny call to
action.
A lovely photo, but this page is
just begging for clear user
guidance and a call to action.
129. Homie: a fixed-fee online agency in the U.S.
The most valuable real estate on the page,
the text raises more questions than it
answers. What does this company do?
Focus on finding a home.
131. Opendoor: the largest iBuyer in the U.S.
Keeping things simple and
straightforward with one
clear call to action.
Clearly summarizing the business
model in one sentence.
137. Nested: an iBuyer in the U.K.
One clear call to action.
This makes sense if
you live in the U.K.
138. The new model customer proposition is focused
on saving money by avoiding a commission.
0
2
4
6
8
10
12
14
16
No commission Customer reviews We're agents Sell for more
#ofcompanies
Customer Proposition
U.K. Australia Canada U.S.
www.mikedp.com
139. This global survey of new models reveals several
user interface and proposition best practices.
• Explain your customer proposition clearly and
concisely.
• Have one clear call to action (typically valuation).
• Less is more. Keep it simple. Don’t confuse users
by offering too many options.
• Showcase customer reviews and testimonials as
social proof to establish credibility.
144. …and even goes so far to claim it offers more
services than traditional real estate agents.
145. Most of the big online agents offer only one
package to keep the proposition simple.
Some online
agents have
started offering a
success-only fee if
and when the
home sells.
Source: Emoov
Source: HouseSimple
146. Tepilo offers the classic good, better, and best
packages. This is less common.
The more options presented to consumers, the more
difficult a decision it becomes.
147. In Canada, ComFree offers package offerings in
Quebec, but fixed-fee everywhere else.
Good, better, best
in Quebec.
A new, simple,
fixed-fee price
point everywhere
else.
148. buyMyplace offers a real hodgepodge of options.
It’s a wonder anyone makes it past this page.
149. Many online agents offer optional services, which
typically include viewing packages.
Source: Yopa
Source: HouseSimple
150. The most successful emerging models have a
simple, full-service offering.
• Keep it simple: the most successful models offer
just one package to streamline decision-making.
• Online agents highlight comprehensive, full-
service offerings with a strong human touch.
• Some online agents are starting to flip the pay
upfront model with success-based fees (similar to
traditional agents).
152. Online agents offer tech products as platforms for
greater transparency in property transactions.
153. One of the best ways to offer transparency is with
comprehensive online dashboards for sellers.
The dashboards typically provide
customers (home sellers) 24/7
access to their listing.
They typically show listing
performance, feedback from
potential buyers, and a record of
all communication with the
customer service team.
Some of them also allow home
sellers to change pricing, photos,
and listing details online.
154. A key point of differentiation for online agents is
the convenience of 24/7 access.
asasbsjdbs
And this access is provided through their tech platforms.
155. Online agents focus on automating the mundane,
where tech can provide a superior experience.
The most
successful tech
products focus on
three key areas:
dashboards,
booking viewings
and onboarding
new customers
(with checklists
and wizards).
Over 90 percent of eMoov’s customers complete the onboarding process on their
own, saving the company effort and reducing the time it takes to list a new home.
156. Technology platforms are not a panacea; it is part
of an overall offering, not the entire offering.
The models with the most
traction often include
technology last in a list of
features and benefits.
157. Some platforms offer messaging between buyers,
sellers, and agents – but it’s not ubiquitous.
Just because you can doesn’t
mean you should.
When it comes to real estate,
the majority of consumers
still prefer human interaction
via phone or in-person
(hence the high proportion of
support staff in all of the most
successful models).
158. Technology case study: The Settled pivot
In early 2018, a relatively new
entrant in the U.K. market,
Settled, underwent a pivot
from do-it-yourself tech
platform to full-service online
agency.
This pivot illustrates the
difficultly of achieving market
traction with a tech-only
product.
159. The premise of a tech platform to connect buyers
and sellers has evolved to one of heavy support.
“an online platform that directly
connects buyers and sellers”
“The company…offers a software
platform which connects every step
in the home moving journey…”
Settled was founded…on the
premise that it would "remove the
need for an estate agent entirely".
“Further, recent research
commissioned by Settled
indicates that actually consumers
don't want a middleman…”
"Settled does the opposite of
traditional or hybrid models…”
20182016
160. Along with the change in proposition came a
significant change in pricing (and still changing).
20182016
January
February 12
161. Along with the change in proposition came a
significant change in pricing (and still changing).
February 27
2018
162. Meanwhile, its number of active listings has
steadily declined over the past five months.
0
50
100
150
200
250
300
350
400
450
9/12/17
9/24/17
10/6/17
10/18/17
10/30/17
11/11/17
11/23/17
12/5/17
12/17/17
12/29/17
1/10/18
1/22/18
2/3/18
2/15/18
Settled's Live Listings
www.mikedp.com
Source: Zoopla live-to-site listing numbers.
163. The winning formula is technology + people.
Both are needed to succeed.
• The tech products don’t automate the entire
process, only parts of it.
• The focus is on providing transparency and
control over the transaction.
• Successful tech reduces cost at scale by making
agents more efficient.
• The most successful new models in real estate
are not technology companies, but technology-
enabled companies.
165. Technical Staff
Are these new breed of online agents and
disruptive players technology companies or not?
10%
On average, I’ve found that the most
successful real estate tech businesses
have around 10% technical staff.
There is a direct correlation between a
higher proportion of tech staff and
lower market traction.
Consumers still want people (agents,
advisors) as part of the process. The
companies that up-weight the
importance of customer-facing staff
have the most market traction.
Note: the following data is from
LinkedIn, so it should be treated as a
data point rather than absolute truth
(which is likely a few points higher).
166. At scale, the players with the most traction have
around 10% technical staff.
Purplebricks
7%
Source: LinkedIn company stats, February 2018.
Redfin
Compass
10%
4%
Duopropio
10%
Comfree Compass often describes
itself (and is valued) as a
technology company. Is it?
167. HouseSimpleHouseSimple
Yopa
The next tier of U.K. online agents have a more
varied amount of tech staff as they scale.
Emoov
16%12%
Tepilo
EasyProperty
9%
13%40%
Settled
41%
Source: LinkedIn company stats, February 2018.
168. iBuyers have a higher proportion of tech staff
given their focus on automated valuations.
Nested
28%
Opendoor OfferPad
13%20%
Source: LinkedIn company stats, February 2018.
169. Purplebricks: strong, fast growth -- with 5x-10x
the employees of its U.K. competitors.
Source: LinkedIn company stats, February 2018.
Purplebricks’ Employee Growth
170. Redfin: more modest employee growth, but a big
business in terms of staff.
Source: LinkedIn company stats, February 2018.
Redfin’s Employee Growth
171. Compass: similar to Purplebricks’ fast growth,
with a large employee base.
Source: LinkedIn company stats, February 2018.
Compass’ Employee Growth
172. Emoov: Slow, sustainable growth while building
its business in the U.K.
Emoov’s Employee Growth
Source: LinkedIn company stats, February 2018.
173. Yopa: more aggressive U.K. scaling, especially
recently.
Yopa’s Employee Growth
Source: LinkedIn company stats, February 2018.
177. In the U.S., the vast majority of homes are still
sold with an agent.
0%
10%
20%
30%
40%
50%
60%
70%
80%
90%
100%
2002 2003 2004 2005 2006 2007 2008 2009 2010 2011 2012 2013 2014 2015
Homes Sold Using an Agent in the US
178. The dominant role of agents is also strong and
steady in New Zealand.
0%
10%
20%
30%
40%
50%
60%
70%
80%
90%
100%
2002 2003 2004 2005 2006 2007 2008 2009 2010 2011 2012 2013 2014 2015
Homes Sold Using an Agent in the US
New Zealand
179. New technologies and platforms have failed to
have an impact on the role of agents for a decade.
0%
10%
20%
30%
40%
50%
60%
70%
80%
90%
100%
2002 2003 2004 2005 2006 2007 2008 2009 2010 2011 2012 2013 2014 2015
Homes Sold Using an Agent in the US
The introduction of technologies that
improve the home search process and
show consumers that middlemen are
unnecessary (or that technology can
replace agents) have failed to have an
impact on the role of agents.
180. 0
500
1,000
1,500
2,000
2,500
11/16 2/17 5/17 8/17 11/17 2/18
Listings Growth in Australia
PropertyNow Forsalebyowner Purplebricks Buymyplace
www.mikedp.com
The story is the same in Australia. Home sellers
are still using agents; no shift to alternatives.
181. Real estate agents will remain an important part
of the home buying and selling process.
• Home sellers still want someone to hold their
hand. Real estate agents aren’t going anywhere.
• Even with the advent of technology that could, in
theory, replace agents, consumers still prefer to
work with them.
• This is loss aversion at work; consumers want to
work with an agent in order to reduce the
chances of a potentially costly mistake when
selling their house. Agents are insurance.
183. These new models will disrupt the industry over
time, but it will be slow.
• These new models have proven traction and
demonstrated strong consumer demand.
• But change will occur slowly; this is evolution,
not revolution.
• Expect copycats to pop up in all markets, not just
mature markets.
• The leaders are and will be well-capitalized.
184. Disruption will come from well-funded start-ups,
not incumbents, portals, nor niche players.
• Incumbents are structurally disadvantaged to
disrupt; existing business models, revenue
streams, and ways of thinking handicap change.
• Property portals won’t put existing revenue
streams at risk by disintermediating agents.
• Well-funded startups with nothing to lose have
everything to gain. Players like Opendoor,
Purplebricks, and Redfin will lead the pack.
185. The impact on property portals is limited in the
short- to medium-term.
• These new models still need to advertise on
property portals.
• Extremely unlikely that portals and new models
will compete.
• Consumers want choice; portals need to cater to
these new models to remain relevant.
186. In five years the industry will look similar, but
more fragmented, with more consumer choice.
• A more fragmented
industry with a focus
on consumer choice
and increased value.
• Agents aren’t going
anywhere.
• Property portals
secure in position as
best place to advertise
a home for sale.
Now Future
Today 5 years
FSBO
Online Agency
Disruptive
Traditional
Agents
187. There is a strong correlation between keeping
people involved in the process and traction.
Traction
Peopleinvolvedinprocess
In other words,
tech-only solutions
have limited
traction.
188. Best practices point to employee specialization as
key point of difference (efficiency and expertise).
Moving the process from one-to-one to one-to-many
Home seller
Real estate agent
(Project management, negotiation,
valuation, mortgage, customer
follow-up, paperwork handler, etc.)
Home seller
Valuation
expert
Project
manager
Listing
expert
Negotiation
expert
189. Technology is used to automate processes and
increase efficiency, not to replace people.
190. The most successful international businesses all
exhibit the following traits.
A proposition of a superior experience (and not
just low cost).
Place a premium on customer service and care,
with 70%+ of staff in a customer-facing roles.
Operate centralized support services.
Are moving towards employing dedicated staff
that specialize in key areas.
Use technology to automate processes and
increase efficiency, not to replace people.
1
2
3
4
5
A smart combination of people and technology!
191. 2018 Emerging Models in Real Estate Report
A global snapshot
The U.K. market: the front line of
disruption
A leader in disruption: Purplebricks in
the U.K.
How the U.K.’s biggest incumbent is
reacting to digital disruption
U.S. market overview: fragmentation
and innovation
Inside Opendoor and the rise of
iBuyers
Highlights and trends from Australia
and Canada
Comparing some of the top emerging
models
Homepage analysis and customer
propositions
Product pricing and packaging
Tech platforms of the most successful
models
Tech-led or tech-enabled: staffing
breakdowns
The role of traditional real estate
agents
Key learnings and insights from the
global leaders
4
9
19
29
39
44
64
74
87
140
151
164
176
182
192. 1%This presentation merely scratches the
surface of the businesses and trends
changing the industry. Drop me a line
at mdelprete@gmail.com if you’d like to
tap into the other 99%.
193. Mike is a strategic advisor and global expert in real
estate tech. He is a former tech entrepreneur and
head of strategy at a major real estate portal.
He has travelled the world talking to and working
with leading property portals and real estate tech
businesses, gathering first-hand knowledge and
insights on industry trends and themes. He advises
corporates, works with startups, mentors founders
and executives, and works on challenging
entrepreneurial projects.
• www.mikedp.com
• Mailing list
• mdelprete@gmail.com
About the author: Mike DelPrete
194. Mike is internationally recognized as an expert and thought-leader in real estate
tech. His evidence-based analysis is widely read by global leaders, and he is a
sought-after strategy and new ventures consultant. He also brings deep
operational experience as the founder and CEO of a 40-person tech company and
head of strategy for a $2 billion online marketplace and classifieds business.
Consulting and advisory services
Strategy Consulting
Workshops &
Presentations
Global Intel & Research
Investment Advising
Read more about the services I offer or drop me a line at mdelprete@gmail.com
and let's talk about what you’re doing and how we might work together.
195. The Adventures in Real Estate Tech Book
Adventures in Real Estate Tech is a 110-page
collection of my past insights, analysis, and articles
from 2016 to today. My work offers a data-rich,
evidence-based analysis of real estate tech, with a
healthy dosage of strategic insights. I cover the trends
that are changing the industry and the major players
gaining traction around the world. The scope is global,
because we all have a lot to learn no matter where we
live. Order a copy today!