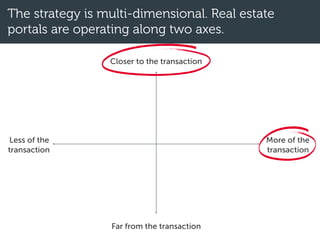
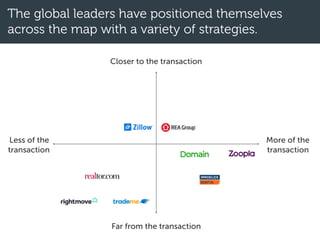
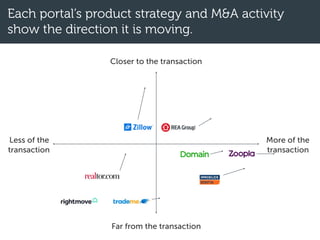
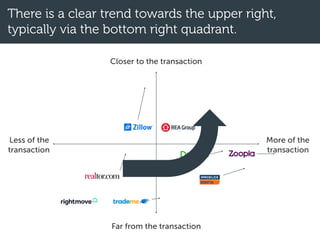
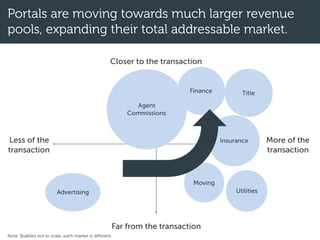
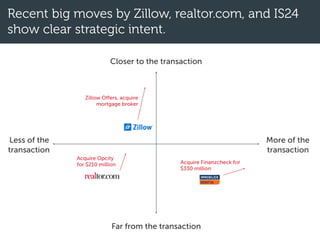
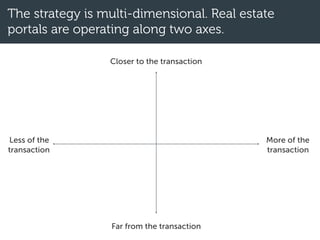
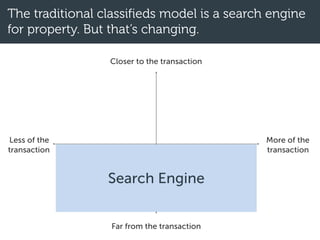
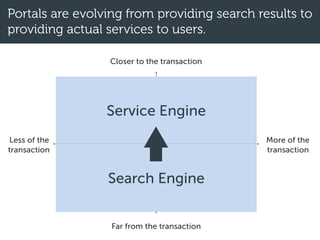
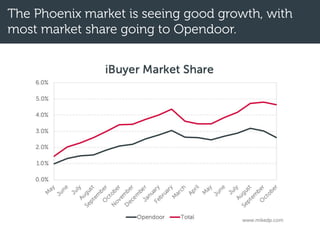
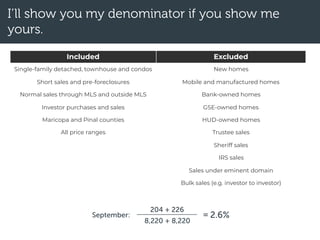
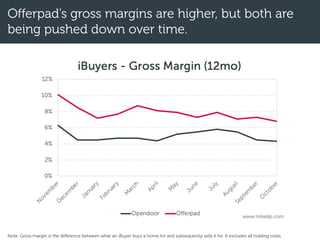
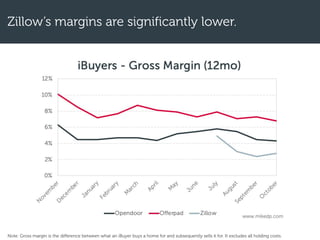
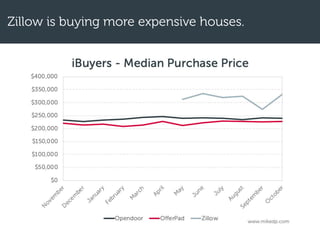
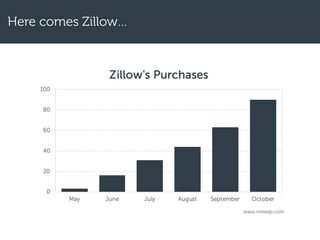
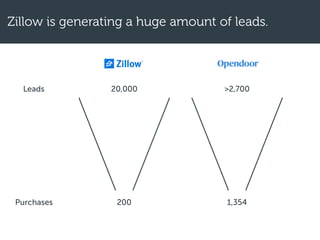
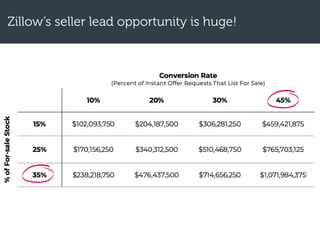
Global Trends in

Real Estate Tech
Prepared by Mike DelPrete, November 2018
1. Evolving role of portals
2. Insight into iBuyers
3. Technology vs. psychology
4. The big risks
The railroads are in
trouble because they
assumed themselves to be
in the railroad business
rather than in the
transportation business.
— Theodore Levitt, 1960
“
”
The strategy is multi-dimensional. Real estate
portals are operating along two axes.
Closer to the transaction
Far from the transaction
More of the
transaction
Less of the
transaction
The global leaders have positioned themselves
across the map with a variety of strategies.
Closer to the transaction
Far from the transaction
More of the
transaction
Less of the
transaction
Each portal’s product strategy and M&A activity
show the direction it is moving.
Closer to the transaction
Far from the transaction
More of the
transaction
Less of the
transaction
There is a clear trend towards the upper right,
typically via the bottom right quadrant.
Closer to the transaction
Far from the transaction
More of the
transaction
Less of the
transaction
Portals are moving towards much larger revenue
pools, expanding their total addressable market.
Closer to the transaction
Far from the transaction
More of the
transaction
Less of the
transaction
Advertising
Finance
Agent
Commissions
Moving
Utilities
Title
Insurance
Note: Bubbles not to scale; each market is different.
Recent big moves by Zillow, realtor.com, and IS24
show clear strategic intent.
Closer to the transaction
Far from the transaction
More of the
transaction
Less of the
transaction
Zillow Offers, acquire
mortgage broker
Acquire Opcity
for $210 million Acquire Finanzcheck for
$330 million
Zillow acquired Mortgage Lenders of America in
August 2018.
• Originated around 4,000 loans
last year.
• Average revenue per customer
of $9k-$12k.
• Offers advantage for Zillow
Offers program.
• Around 300 employees.
Zillow goes from $3.60 per mortgage lead to ~$9k per mortgage customer.
Over the past year, there has been over $730
million in M&A from the major real estate portals.
Finanzcheck
Opcity
Hometrack
Calcasa
Mortgage Lenders of America
Activity across the value stream is varied by portal,
with some common trends.
Home inspiration
Home services and
repairs
Valuation and data
Agent profiles
Mortgages
Insurance
Conveyancing
Moving
Utilities
The big acquisitions are in familiar categories: data
and finance.
Home inspiration
Home services and
repairs
Valuation and data
Agent profiles
Mortgages
Insurance
Conveyancing
Moving
Utilities
$330 million
$93.5 million$38.9 million
$65 million
2018 is shaping up to be a big year in overall M&A
activity for the major real estate portals.
Source: Company data, investor reports.
With their massive acquisitions, Move and IS24
move up the rankings in overall activity.
Note: Zillow does not include the Trulia merger.
199%
157%
157%
56%
22%
21%
1%
The strategy is multi-dimensional. Real estate
portals are operating along two axes.
Closer to the transaction
Far from the transaction
More of the
transaction
Less of the
transaction
The traditional classifieds model is a search engine
for property. But that’s changing.
Closer to the transaction
Far from the transaction
More of the
transaction
Less of the
transaction
Search Engine
Portals are evolving from providing search results to
providing actual services to users.
Closer to the transaction
Far from the transaction
More of the
transaction
Less of the
transaction
Search Engine
Service Engine
Insight into iBuyers
The Phoenix market is seeing good growth, with
most market share going to Opendoor.
Included Excluded
Single-family detached, townhouse and condos New homes
Short sales and pre-foreclosures Mobile and manufactured homes
Normal sales through MLS and outside MLS Bank-owned homes
Investor purchases and sales GSE-owned homes
Maricopa and Pinal counties HUD-owned homes
All price ranges Trustee sales
Sheriff sales
IRS sales
Sales under eminent domain
Bulk sales (e.g. investor to investor)
8,220 + 8,220
204 + 226
= 2.6%
I’ll show you my denominator if you show me
yours.
September:
Offerpad’s gross margins are higher, but both are
being pushed down over time.
Note: Gross margin is the difference between what an iBuyer buys a home for and subsequently sells it for. It excludes all holding costs.
Zillow’s margins are significantly lower.
Note: Gross margin is the difference between what an iBuyer buys a home for and subsequently sells it for. It excludes all holding costs.
Zillow is buying more expensive houses.
Here comes Zillow…
Zillow is generating a huge amount of leads.
200
20,000
Purchases
Leads
1,354
>2,700
Zillow’s seller lead opportunity is huge!
Technology vs. psychology
But what about human
psychology?
High Value
Low Value
Low FrequencyHigh Frequency
High Value
Low Value
Low FrequencyHigh Frequency
High Value
Low Value
Low FrequencyHigh Frequency
Divorce lawyers
Investment bankers
High Value
Low Value
Low FrequencyHigh Frequency
Divorce lawyers
Investment bankers
High Value
Low Value
Low FrequencyHigh Frequency
Hard to disrupt
Easy to disrupt
At scale, the players with the most traction have
around 10% technical staff.
7%
Source: LinkedIn company stats, February 2018.
10%
4%10%
Duproprio
At scale, the players with the most traction have
around 10% technical staff.
7%
Source: LinkedIn company stats, February 2018.
10%
4%10%
Duproprio Compass often describes
itself (and is valued) as a
technology company. Is it?
The big risks
Risk #1: Hubris
Market traction is closely correlated with money
raised (and spent).
Note: Live listings as of Feb 2018.
$80M

equity raised
$34.5M

equity raised
iBuying is being driven by multi-billion dollar
organizations, not scrappy start-ups.
$9B 

market cap
$1.045B

equity raised
$1.75B 

market cap
The new models are less about
new ideas, and more about
doing what’s only possible with
lots of money.
Risk #2: Psychology
There is a strong correlation between keeping
people involved in the process and traction.
Traction
Peopleinvolvedinprocess
In other words,
tech-only solutions
have limited
traction.
High Value
Low Value
Low FrequencyHigh Frequency
Divorce lawyers
Investment bankers
VC:
How are you addressing
loss aversion?
Risk #3: Different, not better
Production (the average number of transactions per
agent per year) is a reflection of efficiency.
Source: Public statements and disclosures, based on full year results and number of agents at the midpoint of that year. Industry average of 7/year
based on various Inman reports and Real Trends report for 2016. Purplebricks based on 78% listing-to-sale completion ratio.
Production (the average number of transactions per
agent per year) is a reflection of efficiency.
Actually more efficient
More efficient?
Source: Public statements and disclosures, based on full year results and number of agents at the midpoint of that year. Industry average of 7/year
based on various Inman reports and Real Trends report for 2016. Purplebricks based on 78% listing-to-sale completion ratio.
• Buying a house
• Selling a house
• Getting a
mortgage
• Getting new leads
Make things better!
Mike DelPrete
www.mikedp.com

Global Trends in
 Real Estate Tech

  • 1.
    Global Trends in
 RealEstate Tech Prepared by Mike DelPrete, November 2018
  • 2.
    1. Evolving roleof portals 2. Insight into iBuyers 3. Technology vs. psychology 4. The big risks
  • 4.
    The railroads arein trouble because they assumed themselves to be in the railroad business rather than in the transportation business. — Theodore Levitt, 1960 “ ”
  • 5.
    The strategy ismulti-dimensional. Real estate portals are operating along two axes. Closer to the transaction Far from the transaction More of the transaction Less of the transaction
  • 6.
    The global leadershave positioned themselves across the map with a variety of strategies. Closer to the transaction Far from the transaction More of the transaction Less of the transaction
  • 7.
    Each portal’s productstrategy and M&A activity show the direction it is moving. Closer to the transaction Far from the transaction More of the transaction Less of the transaction
  • 8.
    There is aclear trend towards the upper right, typically via the bottom right quadrant. Closer to the transaction Far from the transaction More of the transaction Less of the transaction
  • 9.
    Portals are movingtowards much larger revenue pools, expanding their total addressable market. Closer to the transaction Far from the transaction More of the transaction Less of the transaction Advertising Finance Agent Commissions Moving Utilities Title Insurance Note: Bubbles not to scale; each market is different.
  • 10.
    Recent big movesby Zillow, realtor.com, and IS24 show clear strategic intent. Closer to the transaction Far from the transaction More of the transaction Less of the transaction Zillow Offers, acquire mortgage broker Acquire Opcity for $210 million Acquire Finanzcheck for $330 million
  • 11.
    Zillow acquired MortgageLenders of America in August 2018. • Originated around 4,000 loans last year. • Average revenue per customer of $9k-$12k. • Offers advantage for Zillow Offers program. • Around 300 employees. Zillow goes from $3.60 per mortgage lead to ~$9k per mortgage customer.
  • 13.
    Over the pastyear, there has been over $730 million in M&A from the major real estate portals. Finanzcheck Opcity Hometrack Calcasa Mortgage Lenders of America
  • 14.
    Activity across thevalue stream is varied by portal, with some common trends. Home inspiration Home services and repairs Valuation and data Agent profiles Mortgages Insurance Conveyancing Moving Utilities
  • 15.
    The big acquisitionsare in familiar categories: data and finance. Home inspiration Home services and repairs Valuation and data Agent profiles Mortgages Insurance Conveyancing Moving Utilities $330 million $93.5 million$38.9 million $65 million
  • 16.
    2018 is shapingup to be a big year in overall M&A activity for the major real estate portals. Source: Company data, investor reports.
  • 17.
    With their massiveacquisitions, Move and IS24 move up the rankings in overall activity. Note: Zillow does not include the Trulia merger. 199% 157% 157% 56% 22% 21% 1%
  • 18.
    The strategy ismulti-dimensional. Real estate portals are operating along two axes. Closer to the transaction Far from the transaction More of the transaction Less of the transaction
  • 19.
    The traditional classifiedsmodel is a search engine for property. But that’s changing. Closer to the transaction Far from the transaction More of the transaction Less of the transaction Search Engine
  • 20.
    Portals are evolvingfrom providing search results to providing actual services to users. Closer to the transaction Far from the transaction More of the transaction Less of the transaction Search Engine Service Engine
  • 21.
  • 22.
    The Phoenix marketis seeing good growth, with most market share going to Opendoor.
  • 23.
    Included Excluded Single-family detached,townhouse and condos New homes Short sales and pre-foreclosures Mobile and manufactured homes Normal sales through MLS and outside MLS Bank-owned homes Investor purchases and sales GSE-owned homes Maricopa and Pinal counties HUD-owned homes All price ranges Trustee sales Sheriff sales IRS sales Sales under eminent domain Bulk sales (e.g. investor to investor) 8,220 + 8,220 204 + 226 = 2.6% I’ll show you my denominator if you show me yours. September:
  • 24.
    Offerpad’s gross marginsare higher, but both are being pushed down over time. Note: Gross margin is the difference between what an iBuyer buys a home for and subsequently sells it for. It excludes all holding costs.
  • 25.
    Zillow’s margins aresignificantly lower. Note: Gross margin is the difference between what an iBuyer buys a home for and subsequently sells it for. It excludes all holding costs.
  • 26.
    Zillow is buyingmore expensive houses.
  • 27.
  • 29.
    Zillow is generatinga huge amount of leads. 200 20,000 Purchases Leads 1,354 >2,700
  • 30.
    Zillow’s seller leadopportunity is huge!
  • 32.
  • 33.
    But what abouthuman psychology?
  • 35.
    High Value Low Value LowFrequencyHigh Frequency
  • 36.
    High Value Low Value LowFrequencyHigh Frequency
  • 37.
    High Value Low Value LowFrequencyHigh Frequency Divorce lawyers Investment bankers
  • 38.
    High Value Low Value LowFrequencyHigh Frequency Divorce lawyers Investment bankers
  • 39.
    High Value Low Value LowFrequencyHigh Frequency Hard to disrupt Easy to disrupt
  • 40.
    At scale, theplayers with the most traction have around 10% technical staff. 7% Source: LinkedIn company stats, February 2018. 10% 4%10% Duproprio
  • 41.
    At scale, theplayers with the most traction have around 10% technical staff. 7% Source: LinkedIn company stats, February 2018. 10% 4%10% Duproprio Compass often describes itself (and is valued) as a technology company. Is it?
  • 42.
  • 43.
  • 44.
    Market traction isclosely correlated with money raised (and spent). Note: Live listings as of Feb 2018.
  • 45.
    $80M
 equity raised $34.5M
 equity raised iBuyingis being driven by multi-billion dollar organizations, not scrappy start-ups. $9B 
 market cap $1.045B
 equity raised $1.75B 
 market cap
  • 46.
    The new modelsare less about new ideas, and more about doing what’s only possible with lots of money.
  • 47.
  • 48.
    There is astrong correlation between keeping people involved in the process and traction. Traction Peopleinvolvedinprocess In other words, tech-only solutions have limited traction.
  • 49.
    High Value Low Value LowFrequencyHigh Frequency Divorce lawyers Investment bankers
  • 50.
    VC: How are youaddressing loss aversion?
  • 51.
  • 52.
    Production (the averagenumber of transactions per agent per year) is a reflection of efficiency. Source: Public statements and disclosures, based on full year results and number of agents at the midpoint of that year. Industry average of 7/year based on various Inman reports and Real Trends report for 2016. Purplebricks based on 78% listing-to-sale completion ratio.
  • 53.
    Production (the averagenumber of transactions per agent per year) is a reflection of efficiency. Source: Public statements and disclosures, based on full year results and number of agents at the midpoint of that year. Industry average of 7/year based on various Inman reports and Real Trends report for 2016. Purplebricks based on 78% listing-to-sale completion ratio.
  • 54.
    Production (the averagenumber of transactions per agent per year) is a reflection of efficiency. Actually more efficient More efficient? Source: Public statements and disclosures, based on full year results and number of agents at the midpoint of that year. Industry average of 7/year based on various Inman reports and Real Trends report for 2016. Purplebricks based on 78% listing-to-sale completion ratio.
  • 55.
    • Buying ahouse • Selling a house • Getting a mortgage • Getting new leads
  • 57.
  • 58.