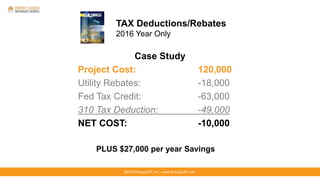
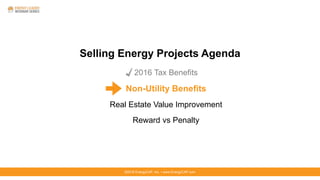
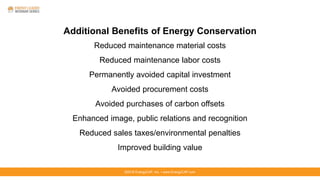
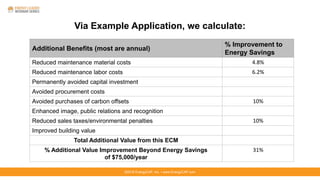
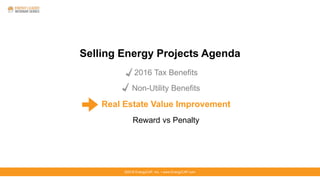
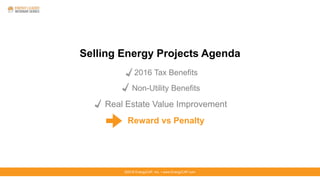
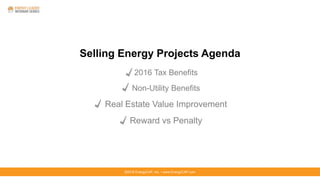
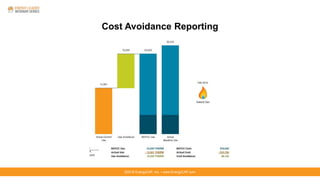
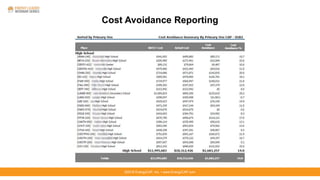
Tips To Sell Your Energy Projects
Eric Woodroof, Ph.D.
888-563-7221
©2016 EnergyCAP, Inc. ▪ www.EnergyCAP.com
Eric Woodroof, Ph.D.
400 Energy Audits
$150 Million in Savings
>25% ROI
CEM Instructor
Certification Boards (CEM, CRM, PCF)
Past President of AEE- 87 Countries
Associate Editor:
EE Journal
Buildings
Youngest Member- Energy Managers Hall of Fame
©2016 EnergyCAP, Inc. ▪ www.EnergyCAP.com
Our Clients
©2016 EnergyCAP, Inc. ▪ www.EnergyCAP.com
Promotional Discount Code
ECAP
20% off (this week)
©2016 EnergyCAP, Inc. ▪ www.EnergyCAP.com
Selling Energy Projects Agenda
2016 Tax Benefits
Non-Utility Benefits
Real Estate Value Improvement
Reward vs Penalty
TAX Deductions/Rebates
2016 Year Only
Case Study
Project Cost: 120,000
Utility Rebates: -18,000
Fed Tax Credit: -63,000
310 Tax Deduction: -49,000
NET COST: -10,000
PLUS $27,000 per year Savings
©2016 EnergyCAP, Inc. ▪ www.EnergyCAP.com
Value of Tax Benefits
©2016 EnergyCAP, Inc. ▪ www.EnergyCAP.com
Normal
Cost: 120,000
Savings: 27,000/yr
22% Return/Yr
Over 10 Years:
You Save $2 for every $1
With Some of the Tax Benefits
Cost: 39,000
Savings: 27,000/yr
69% Return/Yr
Over 10 Years:
You Save $7 for every $1
©2016 EnergyCAP, Inc. ▪ www.EnergyCAP.com
Selling Energy Projects Agenda
2016 Tax Benefits
Non-Utility Benefits
Real Estate Value Improvement
Reward vs Penalty
©2016 EnergyCAP, Inc. ▪ www.EnergyCAP.com
People are like Buildings…
“Don’t Over-Eat”
Beyond Lower Food Costs:
Live Longer
Less Medical Bills
“Don’t Waste Energy”
Beyond Energy $ Savings:
Equipment Runs Less (lasts longer)
Less Maintenance (Material & Labor)
Other Benefits…
Additional Benefits of Energy Conservation
Reduced maintenance material costs
Reduced maintenance labor costs
Permanently avoided capital investment
Avoided procurement costs
Avoided purchases of carbon offsets
Enhanced image, public relations and recognition
Reduced sales taxes/environmental penalties
Improved building value
©2016 EnergyCAP, Inc. ▪ www.EnergyCAP.com
Via Example Application, we calculate:
Additional Benefits (most are annual)
% Improvement to
Energy Savings
Reduced maintenance material costs 4.8%
Reduced maintenance labor costs 6.2%
Permanently avoided capital investment
Avoided procurement costs
Avoided purchases of carbon offsets 10%
Enhanced image, public relations and recognition
Reduced sales taxes/environmental penalties 10%
Improved building value
Total Additional Value from this ECM
% Additional Value Improvement Beyond Energy Savings
of $75,000/year
31%
©2016 EnergyCAP, Inc. ▪ www.EnergyCAP.com
©2016 EnergyCAP, Inc. ▪ www.EnergyCAP.com©2016 EnergyCAP, Inc. ▪ www.EnergyCAP.com
Selling Energy Projects Agenda
2016 Tax Benefits
Non-Utility Benefits
Real Estate Value Improvement
Reward vs Penalty
©2016 EnergyCAP, Inc. ▪ www.EnergyCAP.com©2016 EnergyCAP, Inc. ▪ www.EnergyCAP.com
Question: What is an “Actionable” ROI?
(aka: Hurdle Rate)
10% ~ 10 year Payback
20% ~ 5 year Payback
33% ~ 3 year Payback
©2016 EnergyCAP, Inc. ▪ www.EnergyCAP.com©2016 EnergyCAP, Inc. ▪ www.EnergyCAP.com
Example: Two Identical Buildings
Operating Costs
$1 M/year$1 M/year
A B
©2016 EnergyCAP, Inc. ▪ www.EnergyCAP.com©2016 EnergyCAP, Inc. ▪ www.EnergyCAP.com
We Retrofit “B”
Reduce Op. Costs by $200k/year
Operating Costs
$800K/year$1M/year
A B
©2016 EnergyCAP, Inc. ▪ www.EnergyCAP.com©2016 EnergyCAP, Inc. ▪ www.EnergyCAP.com
Is “B” worth more?
Operating Costs
$800K/year$1M/year
A B
©2016 EnergyCAP, Inc. ▪ www.EnergyCAP.com©2016 EnergyCAP, Inc. ▪ www.EnergyCAP.com
Increased sale value
= (Annual Savings) x (Simple Payback Criteria)
= $200k x 5
= $1 Million in increased sale value
and Green Buildings have higher rent and occupancy (30% higher)
©2016 EnergyCAP, Inc. ▪ www.EnergyCAP.com©2016 EnergyCAP, Inc. ▪ www.EnergyCAP.com
Another Tip:
Simple Payback vs ROI
©2016 EnergyCAP, Inc. ▪ www.EnergyCAP.com©2016 EnergyCAP, Inc. ▪ www.EnergyCAP.com
Compare:
Simple Payback = 4 Yrs
Customer Thoughts:
I have to wait 4 years;
How long will equipment last?
What is my planning horizon?
ROI = 25% per year
Customer Thoughts:
Wow, that is more than my 401k!!
Wow, that is better than our
company’s return!
Even if I financed it at 10%, I would
still get a 15%, which is better than
“doing nothing”.
©2016 EnergyCAP, Inc. ▪ www.EnergyCAP.com©2016 EnergyCAP, Inc. ▪ www.EnergyCAP.com
Selling Energy Projects Agenda
2016 Tax Benefits
Non-Utility Benefits
Real Estate Value Improvement
Reward vs Penalty
©2016 EnergyCAP, Inc. ▪ www.EnergyCAP.com©2016 EnergyCAP, Inc. ▪ www.EnergyCAP.com
Psychology:
Reward vs Penalty
©2016 EnergyCAP, Inc. ▪ www.EnergyCAP.com©2016 EnergyCAP, Inc. ▪ www.EnergyCAP.com
Consider this reward:
©2016 EnergyCAP, Inc. ▪ www.EnergyCAP.com©2016 EnergyCAP, Inc. ▪ www.EnergyCAP.com
Penalty
©2016 EnergyCAP, Inc. ▪ www.EnergyCAP.com©2016 EnergyCAP, Inc. ▪ www.EnergyCAP.com
How do you present?
Reward vs Penalty
©2016 EnergyCAP, Inc. ▪ www.EnergyCAP.com©2016 EnergyCAP, Inc. ▪ www.EnergyCAP.com
Selling Energy Projects Agenda
2016 Tax Benefits
Non-Utility Benefits
Real Estate Value Improvement
Reward vs Penalty
©2016 EnergyCAP, Inc. ▪ www.EnergyCAP.com©2016 EnergyCAP, Inc. ▪ www.EnergyCAP.com
Thank you
Eric Woodroof, Ph.D.
888-563-7221
©2016 EnergyCAP, Inc. ▪ www.EnergyCAP.com
Utility Bill Data Helps You Get Buy-
in For Energy Projects
Steve Heinz, PE, CEM, CMVP
Founder & CEO
EnergyCAP, Inc.
©2016 EnergyCAP, Inc. ▪ www.EnergyCAP.com
1. Identifies inefficient buildings
National and organizational benchmarking provides identification
and corroboration
Increases the confidence of decision-makers in energy management
investments
But benchmarking alone is not granular enough for most
project-level decisions
©2016 EnergyCAP, Inc. ▪ www.EnergyCAP.com
National Benchmarking – ENERGY STAR
©2016 EnergyCAP, Inc. ▪ www.EnergyCAP.com
National Benchmarking – ENERGY STAR
©2016 EnergyCAP, Inc. ▪ www.EnergyCAP.com
Organizational Benchmarking
©2016 EnergyCAP, Inc. ▪ www.EnergyCAP.com
Organizational Benchmarking
©2016 EnergyCAP, Inc. ▪ www.EnergyCAP.com
Organizational Benchmarking
©2016 EnergyCAP, Inc. ▪ www.EnergyCAP.com
2. Verifies success of prior projects
M&V (IPMVP-compliant Measurement & Verification of savings) increases
the confidence of decision-makers in energy management investments
An ESCO may have proprietary “black box” M&V process; EnergyCAP
provides owner-operated validation of cost avoidance
©2016 EnergyCAP, Inc. ▪ www.EnergyCAP.com
Cost Avoidance Reporting
©2016 EnergyCAP, Inc. ▪ www.EnergyCAP.com
Cost Avoidance Reporting
©2016 EnergyCAP, Inc. ▪ www.EnergyCAP.com
Cost Avoidance Reporting
©2016 EnergyCAP, Inc. ▪ www.EnergyCAP.com
Cost Avoidance Reporting
©2015 EnergyCAP, Inc. ▪ @energycap ▪ #energyleader ▪ www.EnergyCAP.com
Steve Heinz, PE, CEM, CMVP
Steve.Heinz@EnergyCAP.com
Founder & CEO
EnergyCAP, Inc.
Thank you for attending today’s webinar.

How to Get Buy-In for Your Energy Project

  • 1.
    Tips To SellYour Energy Projects Eric Woodroof, Ph.D. 888-563-7221 ©2016 EnergyCAP, Inc. ▪ www.EnergyCAP.com
  • 2.
    Eric Woodroof, Ph.D. 400Energy Audits $150 Million in Savings >25% ROI CEM Instructor Certification Boards (CEM, CRM, PCF) Past President of AEE- 87 Countries Associate Editor: EE Journal Buildings Youngest Member- Energy Managers Hall of Fame ©2016 EnergyCAP, Inc. ▪ www.EnergyCAP.com
  • 3.
    Our Clients ©2016 EnergyCAP,Inc. ▪ www.EnergyCAP.com
  • 4.
    ©2016 EnergyCAP, Inc.▪ www.EnergyCAP.com
  • 5.
    ©2016 EnergyCAP, Inc.▪ www.EnergyCAP.com
  • 6.
    Promotional Discount Code ECAP 20%off (this week) ©2016 EnergyCAP, Inc. ▪ www.EnergyCAP.com
  • 7.
    ©2016 EnergyCAP, Inc.▪ www.EnergyCAP.com Selling Energy Projects Agenda 2016 Tax Benefits Non-Utility Benefits Real Estate Value Improvement Reward vs Penalty
  • 8.
    TAX Deductions/Rebates 2016 YearOnly Case Study Project Cost: 120,000 Utility Rebates: -18,000 Fed Tax Credit: -63,000 310 Tax Deduction: -49,000 NET COST: -10,000 PLUS $27,000 per year Savings ©2016 EnergyCAP, Inc. ▪ www.EnergyCAP.com
  • 9.
    Value of TaxBenefits ©2016 EnergyCAP, Inc. ▪ www.EnergyCAP.com Normal Cost: 120,000 Savings: 27,000/yr 22% Return/Yr Over 10 Years: You Save $2 for every $1 With Some of the Tax Benefits Cost: 39,000 Savings: 27,000/yr 69% Return/Yr Over 10 Years: You Save $7 for every $1
  • 10.
    ©2016 EnergyCAP, Inc.▪ www.EnergyCAP.com Selling Energy Projects Agenda 2016 Tax Benefits Non-Utility Benefits Real Estate Value Improvement Reward vs Penalty
  • 11.
    ©2016 EnergyCAP, Inc.▪ www.EnergyCAP.com
  • 12.
    ©2016 EnergyCAP, Inc.▪ www.EnergyCAP.com People are like Buildings… “Don’t Over-Eat” Beyond Lower Food Costs: Live Longer Less Medical Bills “Don’t Waste Energy” Beyond Energy $ Savings: Equipment Runs Less (lasts longer) Less Maintenance (Material & Labor) Other Benefits…
  • 13.
    Additional Benefits ofEnergy Conservation Reduced maintenance material costs Reduced maintenance labor costs Permanently avoided capital investment Avoided procurement costs Avoided purchases of carbon offsets Enhanced image, public relations and recognition Reduced sales taxes/environmental penalties Improved building value ©2016 EnergyCAP, Inc. ▪ www.EnergyCAP.com
  • 14.
    Via Example Application,we calculate: Additional Benefits (most are annual) % Improvement to Energy Savings Reduced maintenance material costs 4.8% Reduced maintenance labor costs 6.2% Permanently avoided capital investment Avoided procurement costs Avoided purchases of carbon offsets 10% Enhanced image, public relations and recognition Reduced sales taxes/environmental penalties 10% Improved building value Total Additional Value from this ECM % Additional Value Improvement Beyond Energy Savings of $75,000/year 31% ©2016 EnergyCAP, Inc. ▪ www.EnergyCAP.com
  • 15.
    ©2016 EnergyCAP, Inc.▪ www.EnergyCAP.com
  • 16.
    ©2016 EnergyCAP, Inc.▪ www.EnergyCAP.com
  • 17.
    ©2016 EnergyCAP, Inc.▪ www.EnergyCAP.com©2016 EnergyCAP, Inc. ▪ www.EnergyCAP.com Selling Energy Projects Agenda 2016 Tax Benefits Non-Utility Benefits Real Estate Value Improvement Reward vs Penalty
  • 18.
    ©2016 EnergyCAP, Inc.▪ www.EnergyCAP.com©2016 EnergyCAP, Inc. ▪ www.EnergyCAP.com Question: What is an “Actionable” ROI? (aka: Hurdle Rate) 10% ~ 10 year Payback 20% ~ 5 year Payback 33% ~ 3 year Payback
  • 19.
    ©2016 EnergyCAP, Inc.▪ www.EnergyCAP.com©2016 EnergyCAP, Inc. ▪ www.EnergyCAP.com Example: Two Identical Buildings Operating Costs $1 M/year$1 M/year A B
  • 20.
    ©2016 EnergyCAP, Inc.▪ www.EnergyCAP.com©2016 EnergyCAP, Inc. ▪ www.EnergyCAP.com We Retrofit “B” Reduce Op. Costs by $200k/year Operating Costs $800K/year$1M/year A B
  • 21.
    ©2016 EnergyCAP, Inc.▪ www.EnergyCAP.com©2016 EnergyCAP, Inc. ▪ www.EnergyCAP.com Is “B” worth more? Operating Costs $800K/year$1M/year A B
  • 22.
    ©2016 EnergyCAP, Inc.▪ www.EnergyCAP.com©2016 EnergyCAP, Inc. ▪ www.EnergyCAP.com Increased sale value = (Annual Savings) x (Simple Payback Criteria) = $200k x 5 = $1 Million in increased sale value and Green Buildings have higher rent and occupancy (30% higher)
  • 23.
    ©2016 EnergyCAP, Inc.▪ www.EnergyCAP.com©2016 EnergyCAP, Inc. ▪ www.EnergyCAP.com Another Tip: Simple Payback vs ROI
  • 24.
    ©2016 EnergyCAP, Inc.▪ www.EnergyCAP.com©2016 EnergyCAP, Inc. ▪ www.EnergyCAP.com Compare: Simple Payback = 4 Yrs Customer Thoughts: I have to wait 4 years; How long will equipment last? What is my planning horizon? ROI = 25% per year Customer Thoughts: Wow, that is more than my 401k!! Wow, that is better than our company’s return! Even if I financed it at 10%, I would still get a 15%, which is better than “doing nothing”.
  • 25.
    ©2016 EnergyCAP, Inc.▪ www.EnergyCAP.com©2016 EnergyCAP, Inc. ▪ www.EnergyCAP.com Selling Energy Projects Agenda 2016 Tax Benefits Non-Utility Benefits Real Estate Value Improvement Reward vs Penalty
  • 26.
    ©2016 EnergyCAP, Inc.▪ www.EnergyCAP.com©2016 EnergyCAP, Inc. ▪ www.EnergyCAP.com Psychology: Reward vs Penalty
  • 27.
    ©2016 EnergyCAP, Inc.▪ www.EnergyCAP.com©2016 EnergyCAP, Inc. ▪ www.EnergyCAP.com Consider this reward:
  • 28.
    ©2016 EnergyCAP, Inc.▪ www.EnergyCAP.com©2016 EnergyCAP, Inc. ▪ www.EnergyCAP.com Penalty
  • 29.
    ©2016 EnergyCAP, Inc.▪ www.EnergyCAP.com©2016 EnergyCAP, Inc. ▪ www.EnergyCAP.com How do you present? Reward vs Penalty
  • 30.
    ©2016 EnergyCAP, Inc.▪ www.EnergyCAP.com©2016 EnergyCAP, Inc. ▪ www.EnergyCAP.com Selling Energy Projects Agenda 2016 Tax Benefits Non-Utility Benefits Real Estate Value Improvement Reward vs Penalty
  • 31.
    ©2016 EnergyCAP, Inc.▪ www.EnergyCAP.com©2016 EnergyCAP, Inc. ▪ www.EnergyCAP.com
  • 32.
    Thank you Eric Woodroof,Ph.D. 888-563-7221 ©2016 EnergyCAP, Inc. ▪ www.EnergyCAP.com
  • 33.
    Utility Bill DataHelps You Get Buy- in For Energy Projects Steve Heinz, PE, CEM, CMVP Founder & CEO EnergyCAP, Inc. ©2016 EnergyCAP, Inc. ▪ www.EnergyCAP.com
  • 34.
    ©2016 EnergyCAP, Inc.▪ www.EnergyCAP.com 1. Identifies inefficient buildings National and organizational benchmarking provides identification and corroboration Increases the confidence of decision-makers in energy management investments But benchmarking alone is not granular enough for most project-level decisions
  • 35.
    ©2016 EnergyCAP, Inc.▪ www.EnergyCAP.com National Benchmarking – ENERGY STAR
  • 36.
    ©2016 EnergyCAP, Inc.▪ www.EnergyCAP.com National Benchmarking – ENERGY STAR
  • 37.
    ©2016 EnergyCAP, Inc.▪ www.EnergyCAP.com Organizational Benchmarking
  • 38.
    ©2016 EnergyCAP, Inc.▪ www.EnergyCAP.com Organizational Benchmarking
  • 39.
    ©2016 EnergyCAP, Inc.▪ www.EnergyCAP.com Organizational Benchmarking
  • 40.
    ©2016 EnergyCAP, Inc.▪ www.EnergyCAP.com 2. Verifies success of prior projects M&V (IPMVP-compliant Measurement & Verification of savings) increases the confidence of decision-makers in energy management investments An ESCO may have proprietary “black box” M&V process; EnergyCAP provides owner-operated validation of cost avoidance
  • 41.
    ©2016 EnergyCAP, Inc.▪ www.EnergyCAP.com Cost Avoidance Reporting
  • 42.
    ©2016 EnergyCAP, Inc.▪ www.EnergyCAP.com Cost Avoidance Reporting
  • 43.
    ©2016 EnergyCAP, Inc.▪ www.EnergyCAP.com Cost Avoidance Reporting
  • 44.
    ©2016 EnergyCAP, Inc.▪ www.EnergyCAP.com Cost Avoidance Reporting
  • 45.
    ©2015 EnergyCAP, Inc.▪ @energycap ▪ #energyleader ▪ www.EnergyCAP.com Steve Heinz, PE, CEM, CMVP Steve.Heinz@EnergyCAP.com Founder & CEO EnergyCAP, Inc. Thank you for attending today’s webinar.

Editor's Notes

  • #3 All bullet points
  • #4 All bullet points
  • #5 bullets
  • #6 bullets
  • #34 Steve Heinz title slide Include picture from this page on the title slide: http://info.energycap.com/options-and-methods-for-correlating-weather
  • #46 Thank you for attending slide