Download to read offline


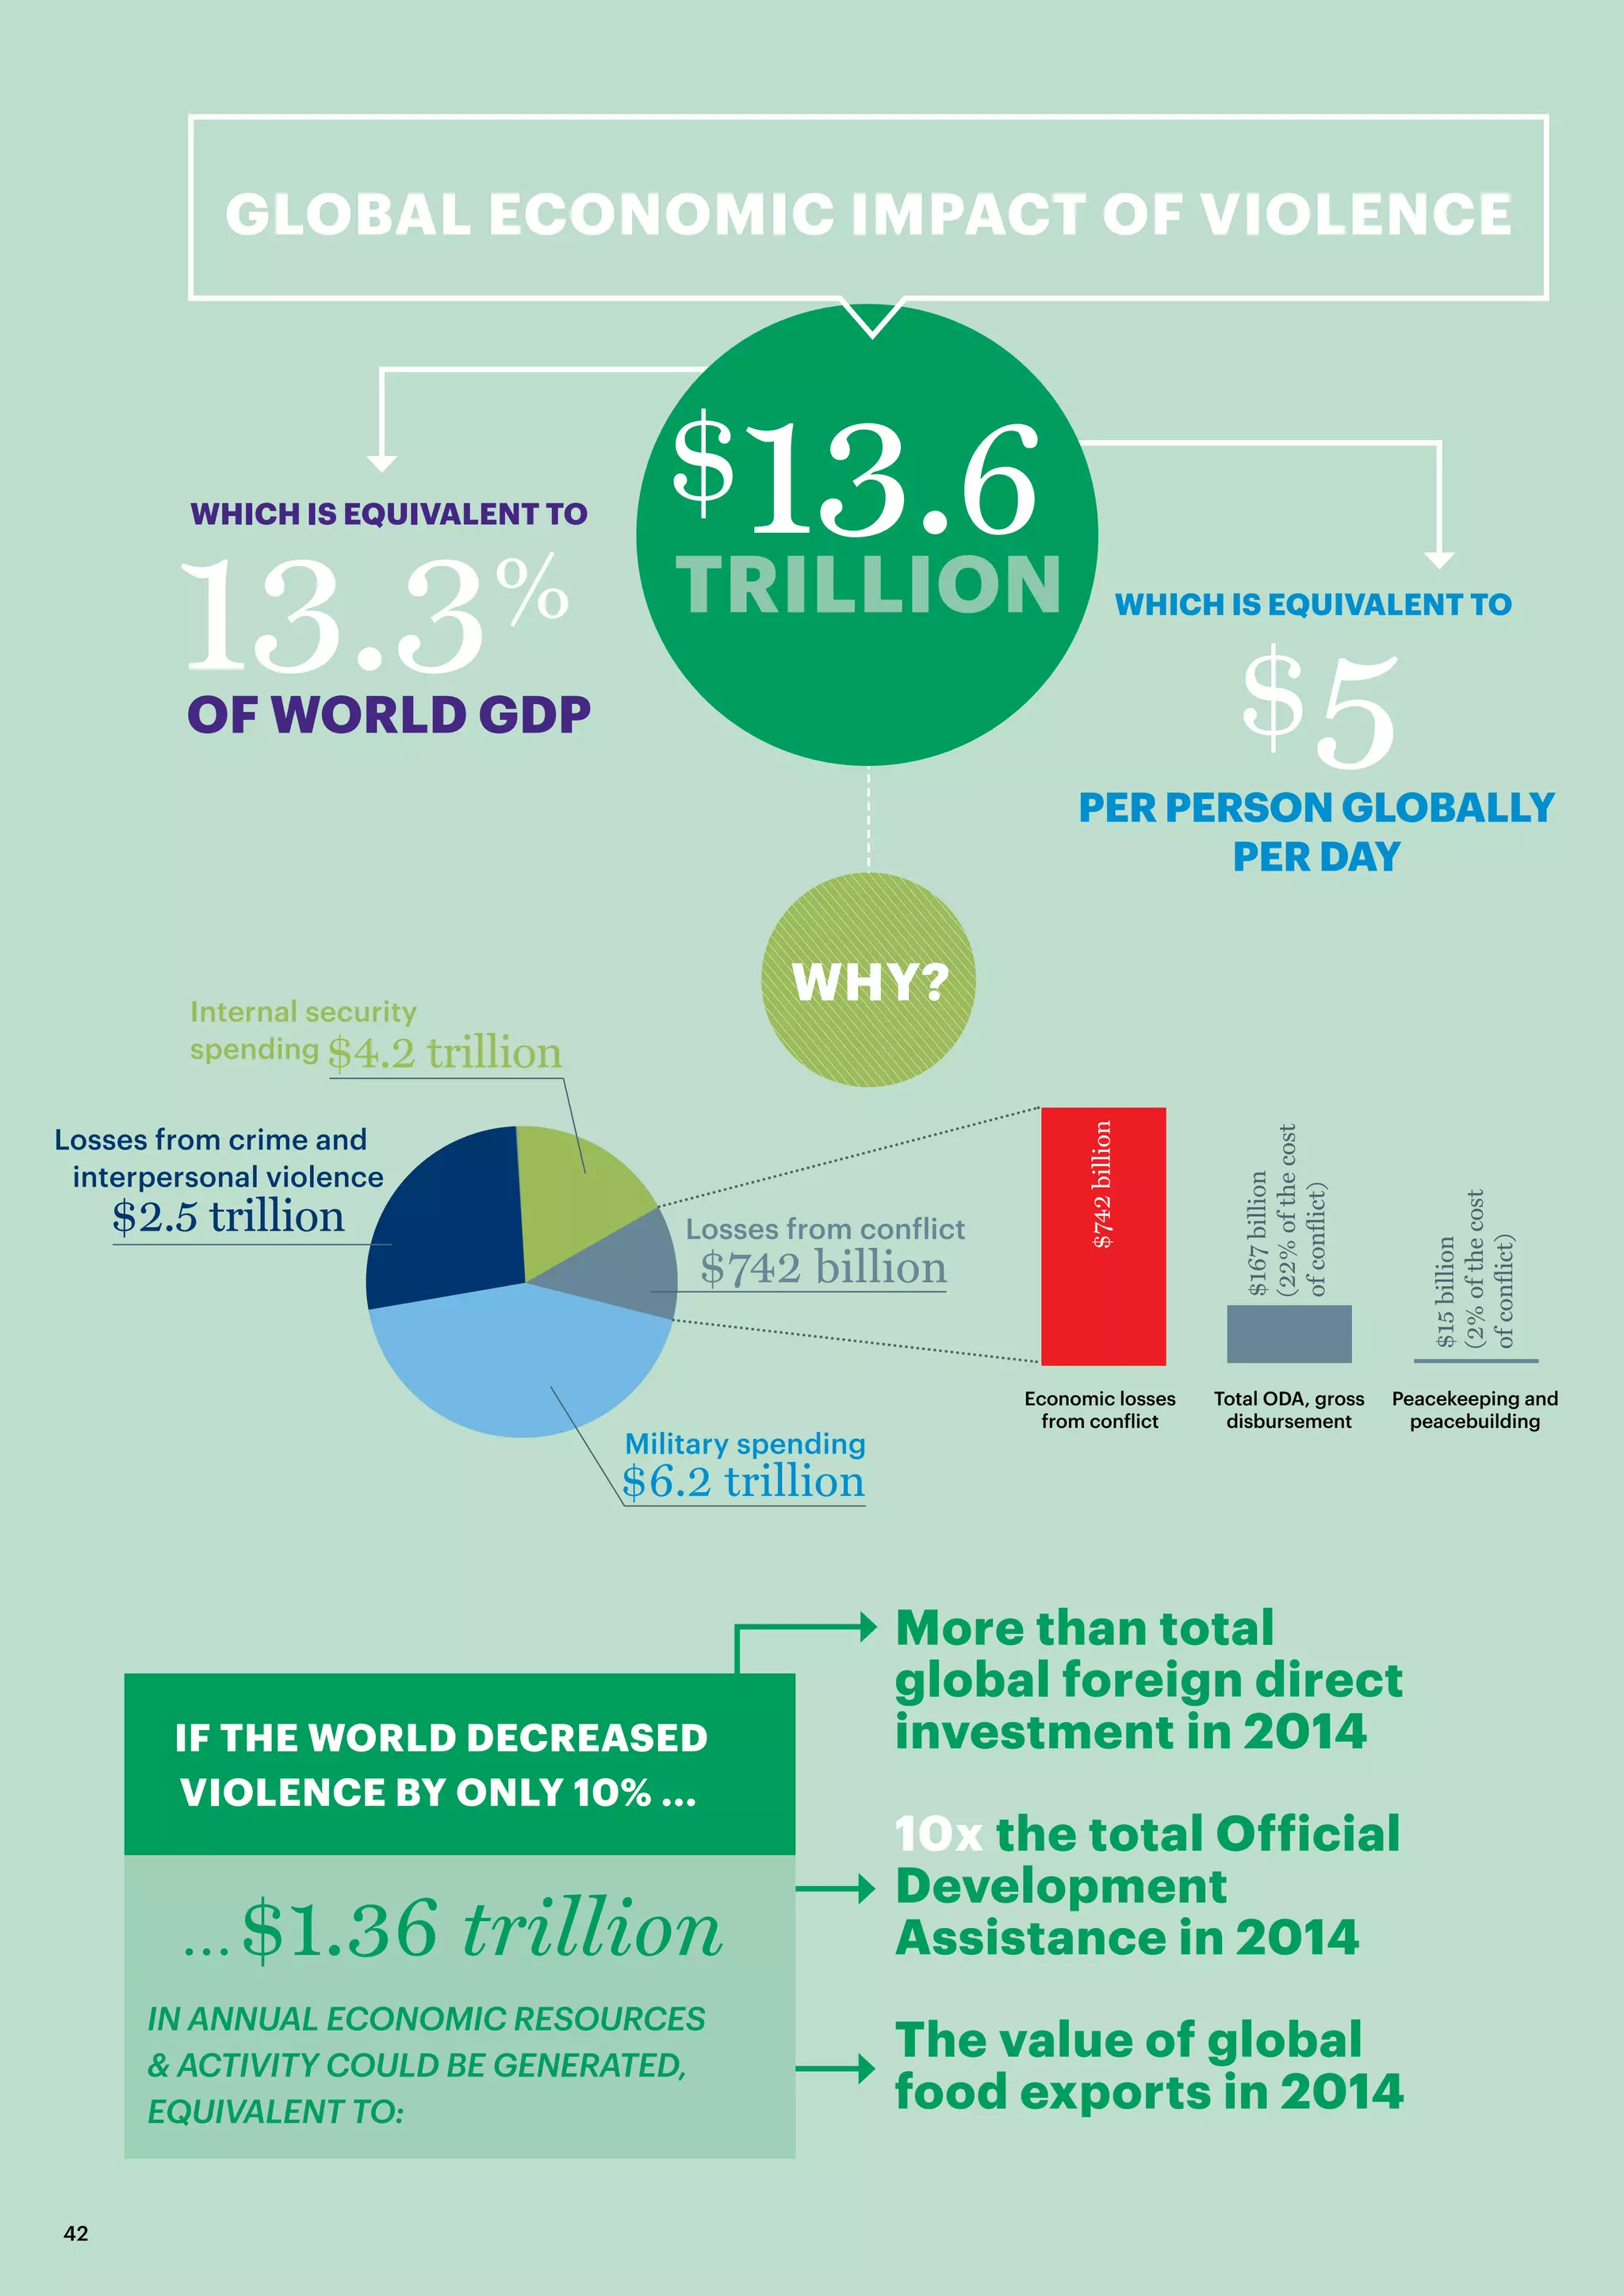


The 2016 Global Peace Index report highlights a slight deterioration in global peace, driven by escalating conflicts, particularly in the MENA region, while some regions like Central America saw improvements. The report indicates a significant economic impact of violence, costing 13.3% of the global economy, and emphasizes the interconnectedness of global challenges affecting peace. It also discusses the need for better data and measurement methods for Sustainable Development Goal 16 related to peace and justice.


![Computer Networks 01[1 using all terms].pptx](https://cdn.slidesharecdn.com/ss_thumbnails/computernetworks011-251214040533-327dd9f8-thumbnail.jpg?width=640&height=640&fit=bounds)


