Downloaded 12 times
![x40
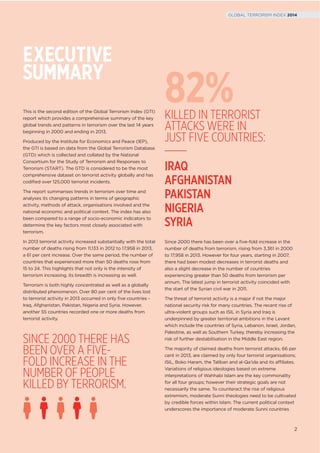
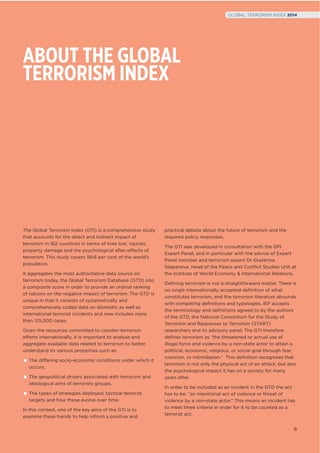
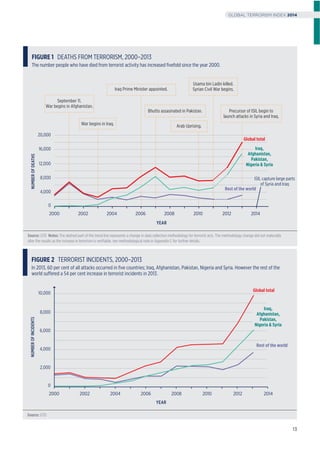
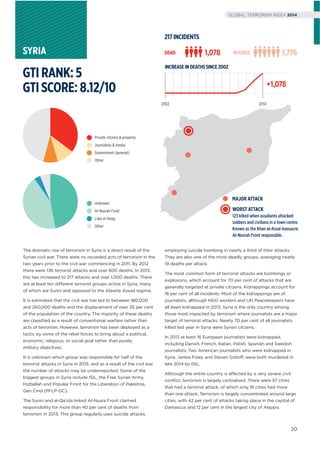
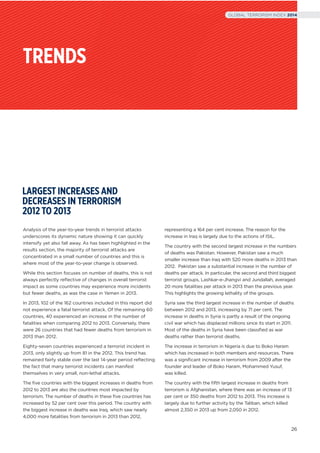
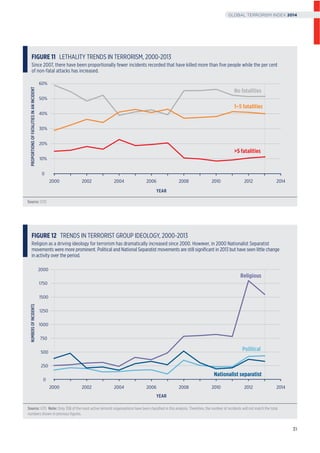
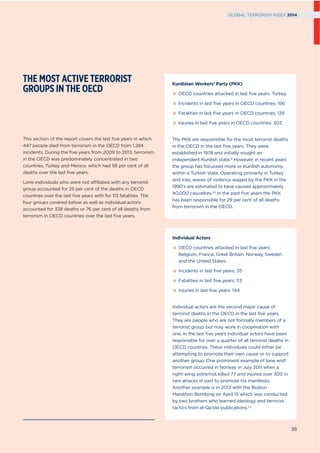
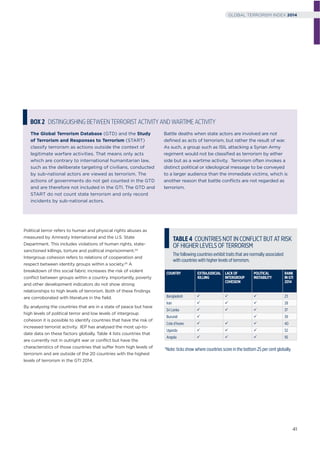
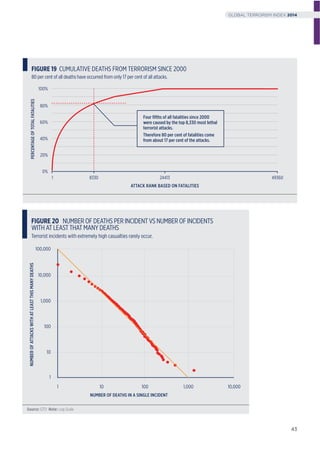
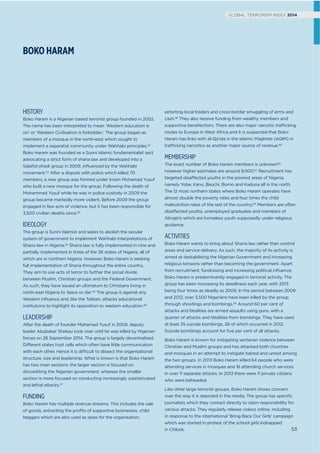
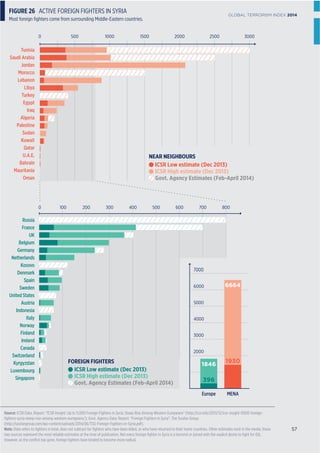
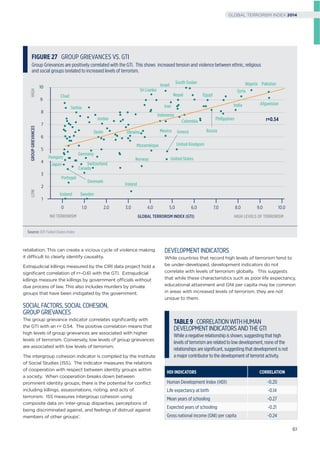
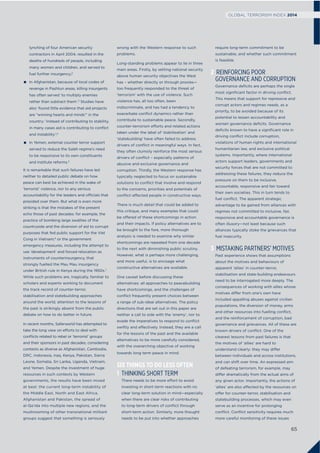
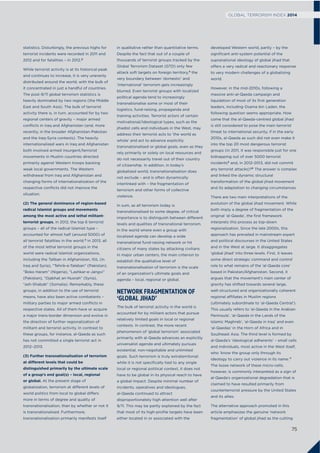
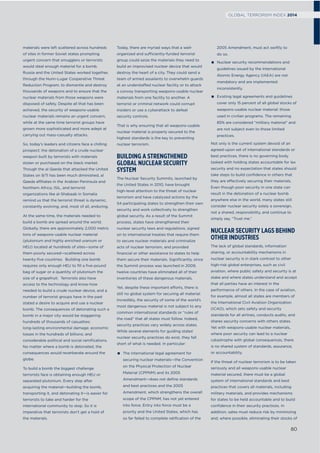
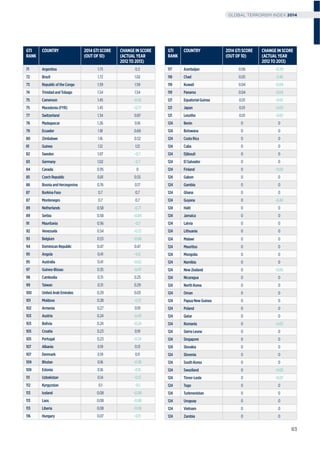
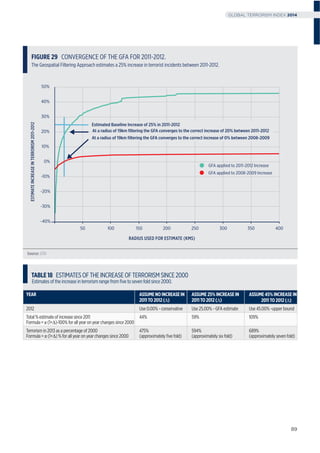
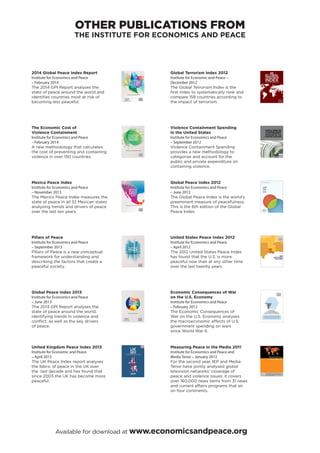
Comparing the number of deaths from homicide versus the
number of deaths from terrorism from 2000 to 2011 in the
four countries that experienced ‘black swan’ events it is
possible to compare the ratio between homicides and
terrorism. Four examples of significant ‘black swan’ incidents
since 2000 include the 2011 Norway attack, the 2004 Madrid
bombings, the 2005 7/7 London attacks and September 11.
A comparison of deaths from these four events to national
homicides of each country over the period of 2000 to 2011 is
shown in Table 5. What is apparent is that even in countries
which have experienced a devastating terrorist attack in the
last ten years; significantly more people were killed by
homicide than by terrorism over the period.
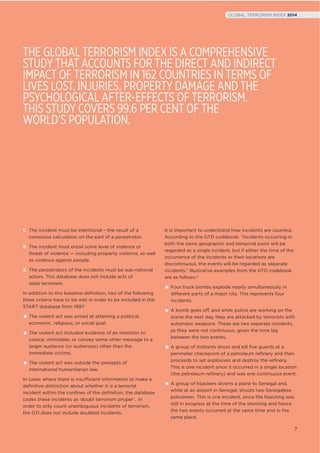
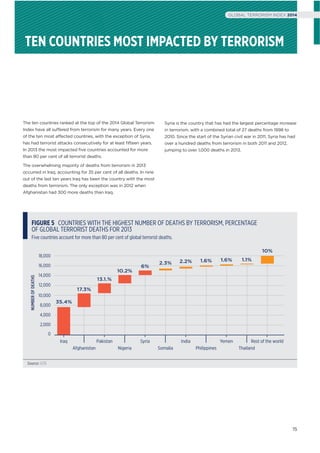
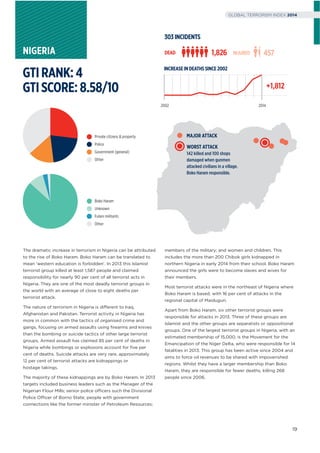
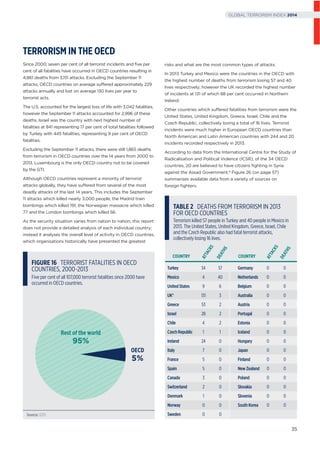
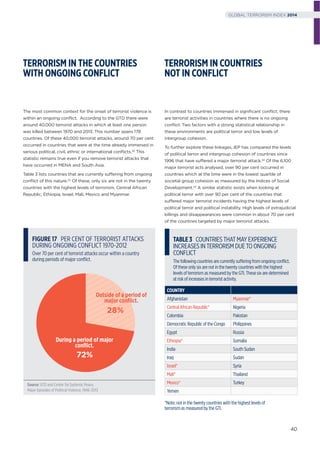
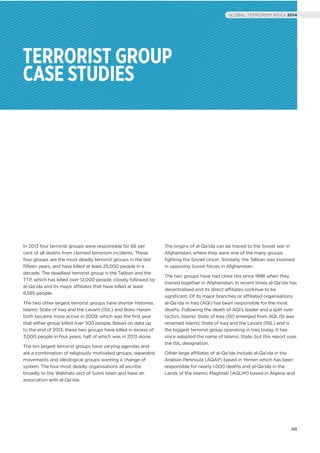
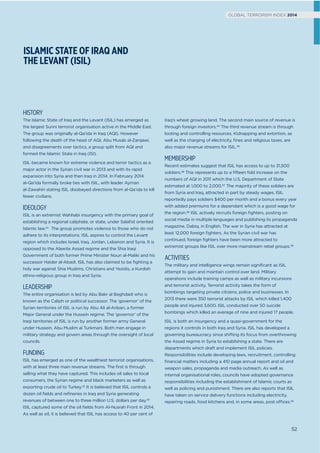
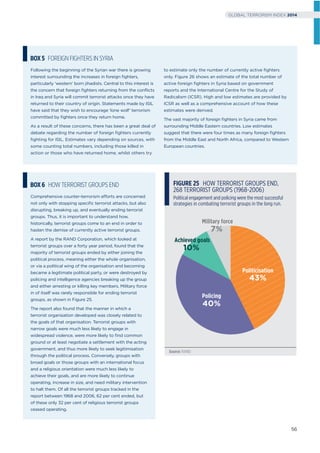
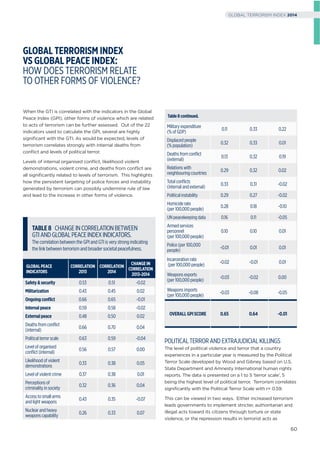
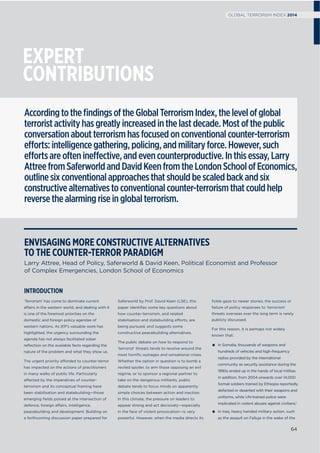
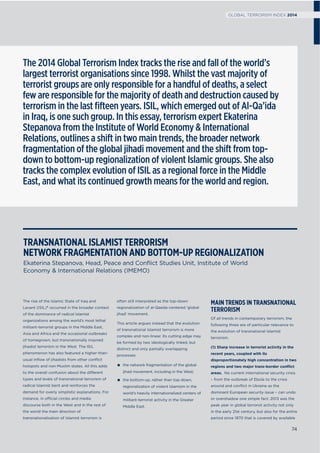
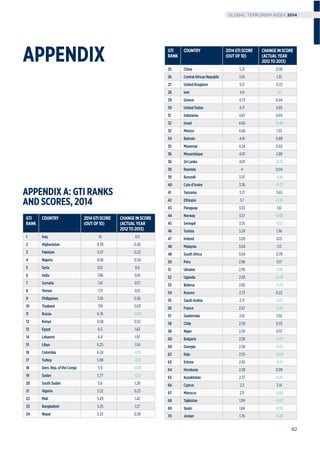
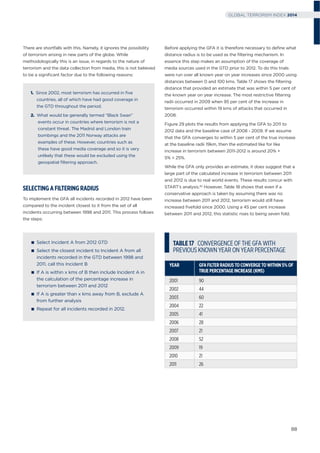
At the global level, the difference between deaths from
intentional homicide and terrorism is very significant. Figure
21 shows that in 2012 a total of around 437,000 lives were
lost due to homicide, by contrast in the same year, a total of
11,000 people were killed from terrorism representing a
number 40 times less than homicide.26 Therefore the
likelihood of being killed through intentional homicide is
much greater than being killed in a terrorist attack.
Of course while it should be noted that while terrorism may
claim fewer lives, its effect on a community is traumatic,
creating fear, changing daily habits and producing
substantial economic costs.
Source: GTD, UNODC Global Study on Homicide 2013
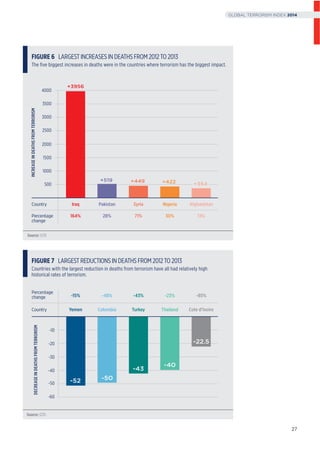
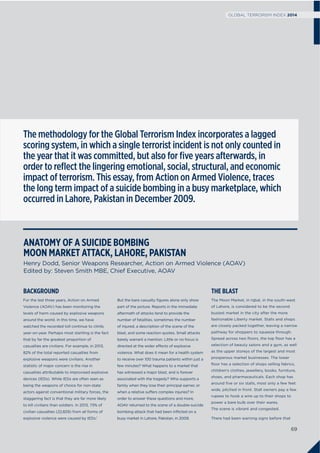
FIGURE 21 NUMBER OF DEATHS BY HOMICIDES
VS. TERRORISM GLOBALLY, 2012
Around 40 times more people were killed globally by
homicide than terrorism in 2012.
DEATHSIN2012
0
200,000
100,000
300,000
400,000
500,000
Homicides
437,000
Terrorism
11,000
COMPARING HOMICIDE TO
TERRORIST DEATHS
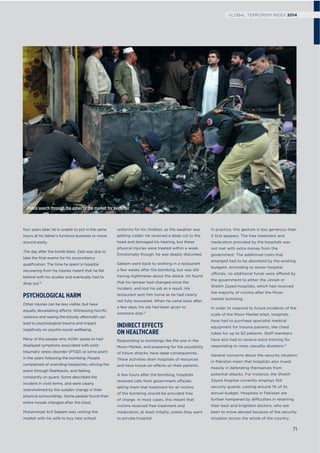
TABLE5 DEATHS BY HOMICIDE VS. DEATHS FROM
FOUR LARGE ‘BLACK SWAN’ EVENTS
Even in countries which have experienced a devastating terrorist
attack in the last ten years; significantly more people were killed by
homicide than by terrorism over the 2000-2011 period.
Country Deaths from
terrorism (T)
Homicides (H)
[1]
Ratio = (H – T)/
(T)
Norway 75 518 1:6
Spain 249 5,897 1:23
United Kingdom 57 10,776 1:188
United States 3029 195,948 1:64
TOTALNUMBEROFDEATHS 2000-2011
Source: UNODC, Homicide Statistics, http://www.unodc.org/gsh/en/data.html ,2013,
(accessed 7 October 2014).
AN INDIVIDUAL IS 40
TIMES MORE LIKELY
TO BE A VICTIM OF
HOMICIDE THAN
BE KILLED IN A
TERRORIST ATTACK.
44
GLOBAL TERRORISM INDEX 2014](https://image.slidesharecdn.com/globalterrorismindexreport2014-150111052255-conversion-gate01/85/Global-terrorism-index-report-2014-46-320.jpg)


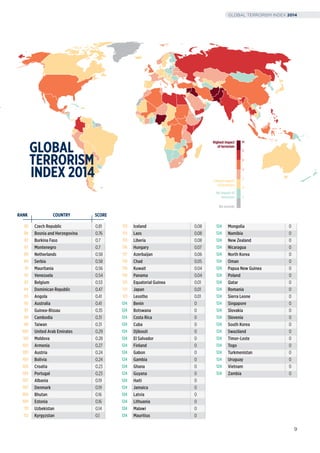
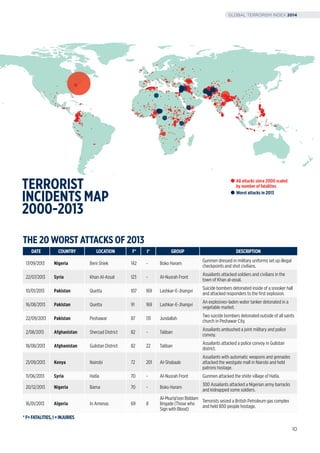
The Global Terrorism Index report analyzes trends in terrorism over the past 14 years. In 2013, deaths from terrorism significantly increased to over 17,000, with four terrorist groups (ISIL, Boko Haram, Taliban, al-Qa'ida) claiming 66% of deaths. Religious extremism based on interpretations of Wahhabi Islam motivates many groups, though political and separatist movements also use terrorism. Countries with high terrorism experience social divisions, state violence, and other forms of violence more than economic factors like poverty. The report identifies 13 countries at risk of substantial future increases in terrorism. Past successes against terrorism have involved policing or political processes more than military engagement alone.


