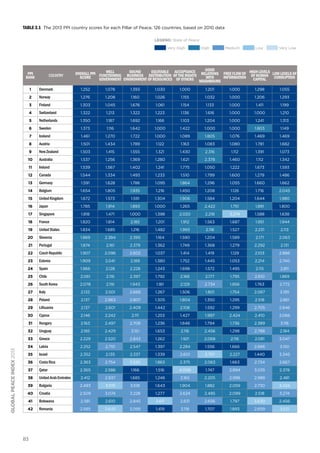
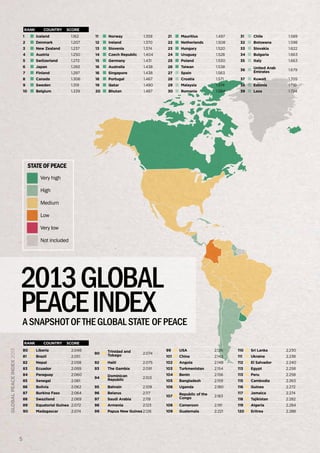
The 2013 Global Peace Index (GPI) ranks 162 nations based on peace levels using 22 indicators across safety, conflict, and militarization. It indicates a continued global decline in peace over six years, largely driven by increased violence in regions like the Middle East and civil wars in Syria and Libya, while Iceland remains the most peaceful nation. Additionally, the report introduces the Positive Peace Index, evaluating countries' capacities to sustain peaceful environments, revealing a slight overall improvement in positive peace indicators from 2005 to 2010.
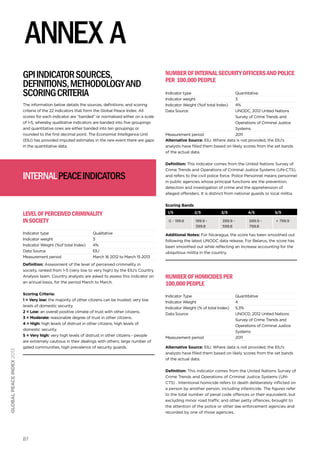
![results, findings
& methodology
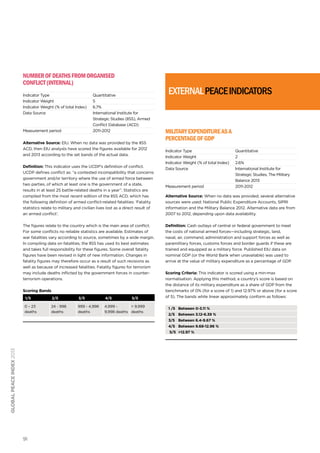
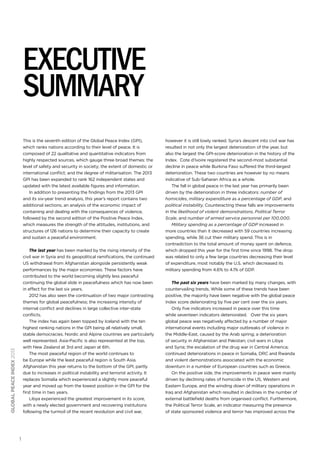
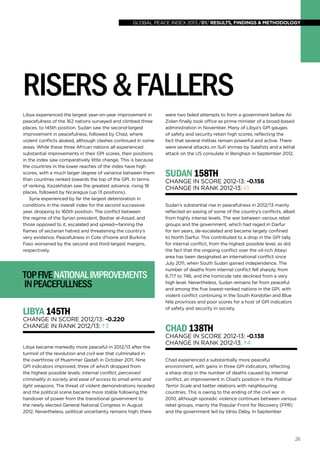
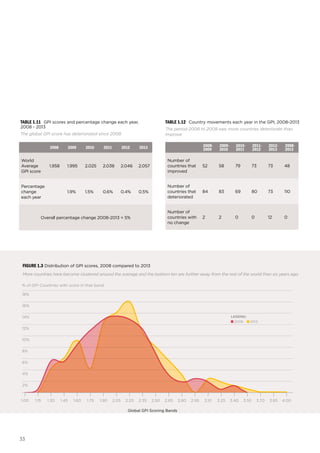
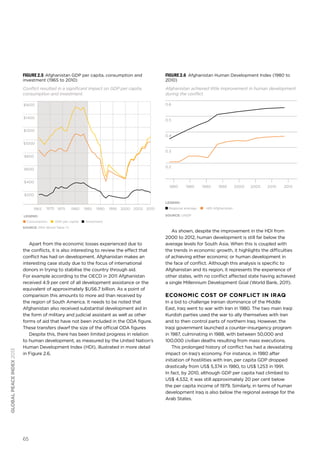
There has been a 5% deterioration
in the Global Peace Index score
over the last six years, indicating
a less peaceful world.
[ highlights ]
global peace index 2013
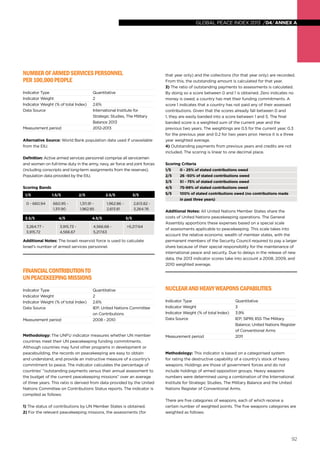
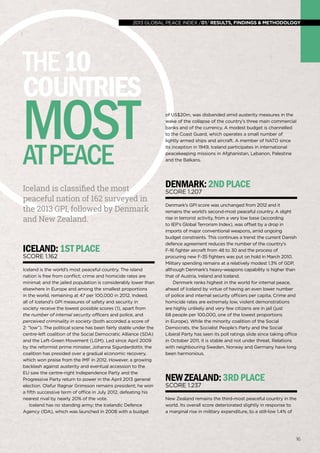
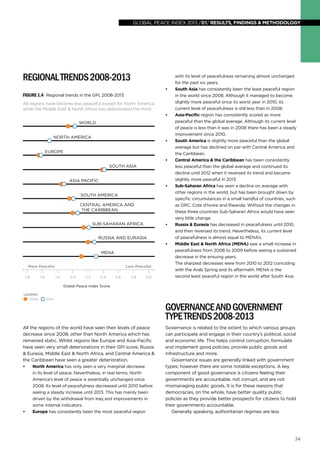
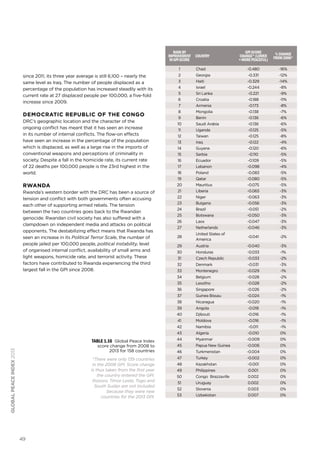
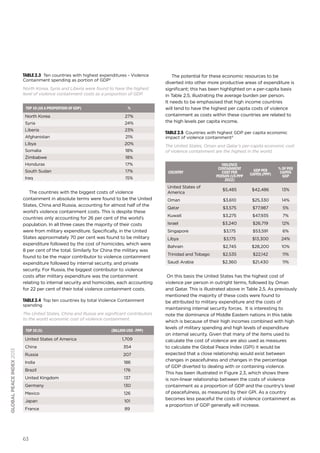
The ten highest ranking nations in the GPI are all
relatively small, stable democracies, with Nordic and
Alpine countries particularly well represented. Europe
is comfortably the most peaceful region; few countries
are involved in external conflict and most societies are
broadly harmonious. Nevertheless, several European
countries experienced less peaceful conditions amid
challenging economic circumstances, including Spain,
Greece, France and Portugal. North America is the
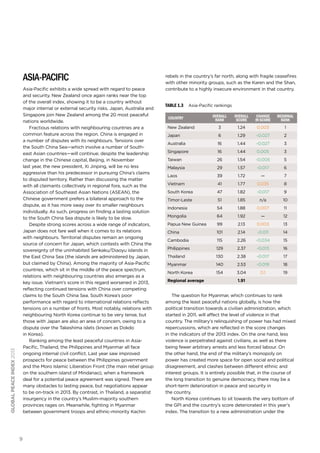
second-most peaceful region, followed by Asia-Pacific,
which is buoyed by high rankings for New Zealand (2nd)
and Japan (6th), as well as Australia, Singapore, Taiwan
and Malaysia, all of which lie in the top 30.
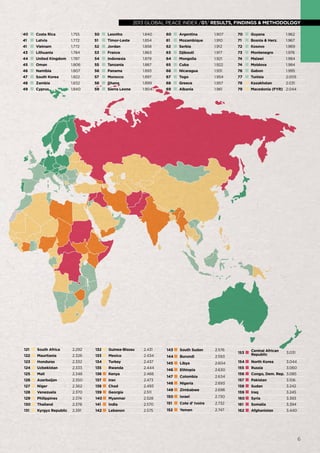
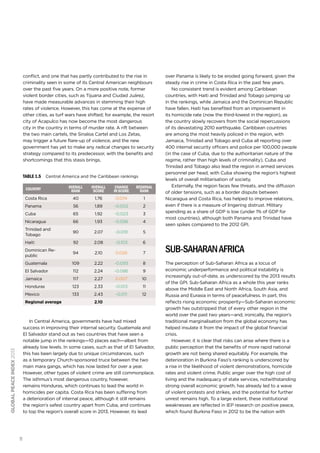
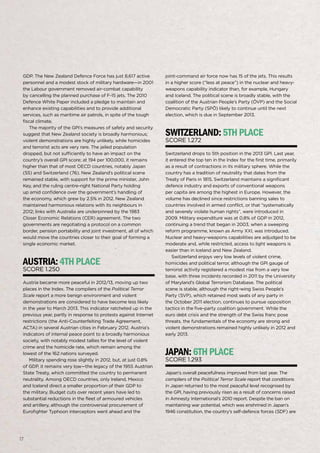
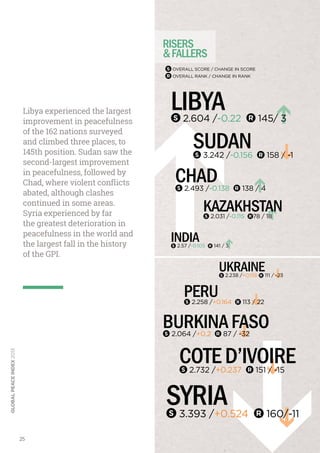
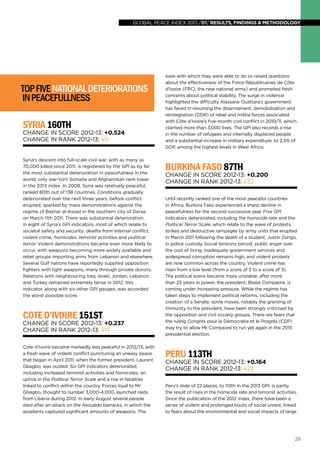
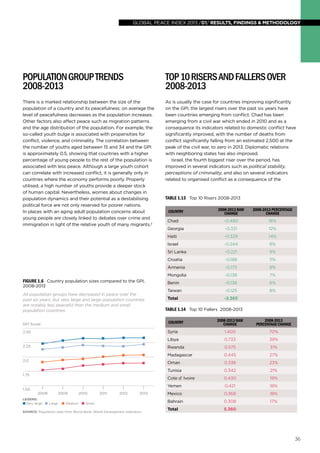
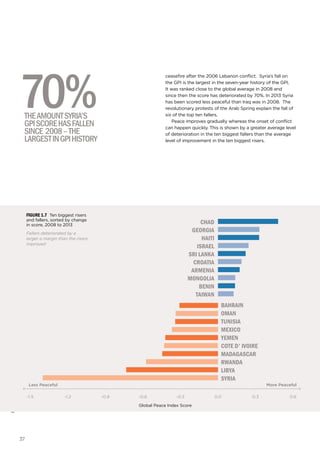
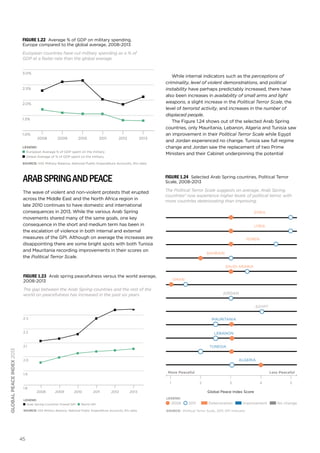
Libya experienced the greatest rise in peacefulness, with
a newly elected government and recovering institutions
following the turmoil of the recent revolution and civil war.
Sudan and Chad experienced the second and third-most
substantial gains as their respective conflicts eased, but
conditions in areas of both countries are far from peaceful
and they remain in the lower reaches of the GPI.
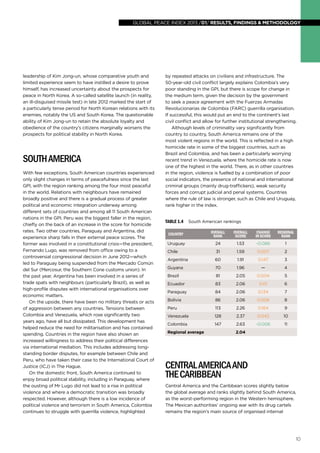
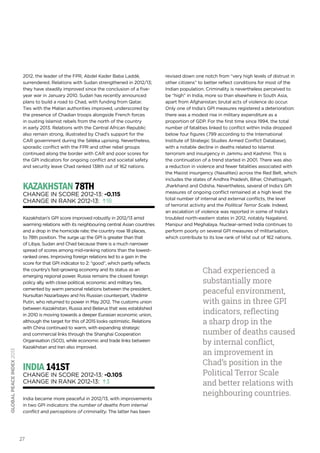
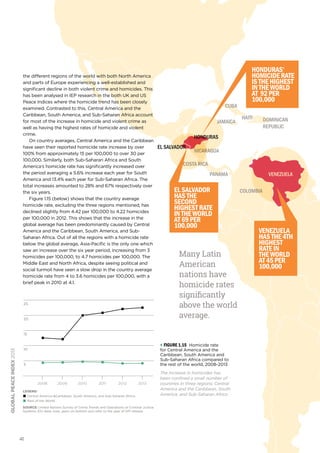
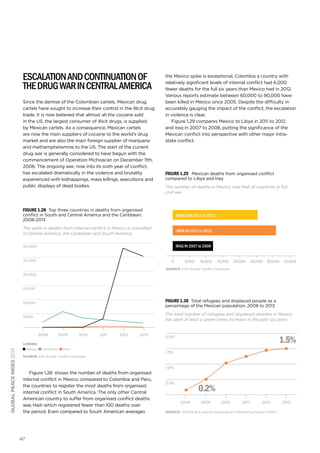
Uruguay and Chile stand out as the two most peaceful
South American nations, characterised by relatively strong
institutions and the rule of law. Conditions worsened in
third-ranked Argentina amid a series of trade spats with
neighbours. In Central America, Costa Rica again emerges
as the most peaceful nation, although it suffered from a
decline in internal peace. Nicaragua, Guatemala and El
3](https://image.slidesharecdn.com/2013globalpeaceindexreport-131217092322-phpapp02/85/2013-Global-Peace-Index-Report-6-320.jpg)
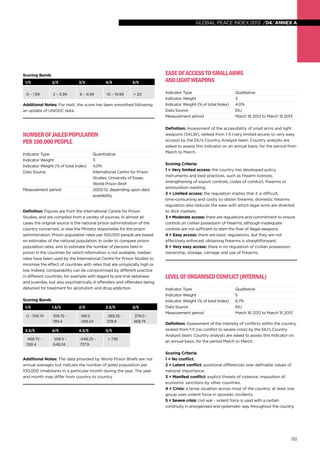
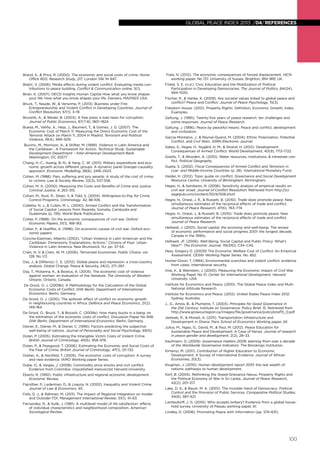
![The Global Cost
of Containing
Violence
[ summary ]
global peace index 2013
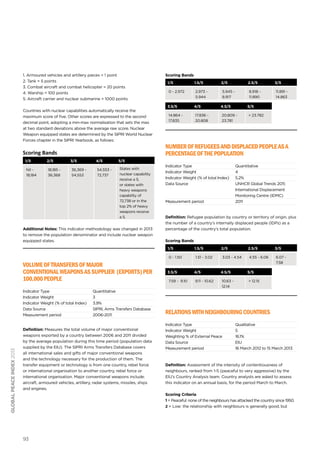
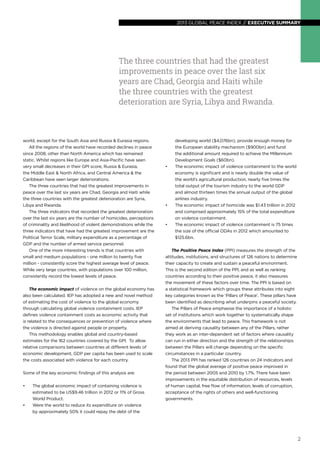
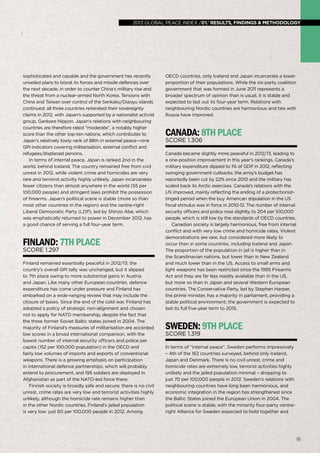
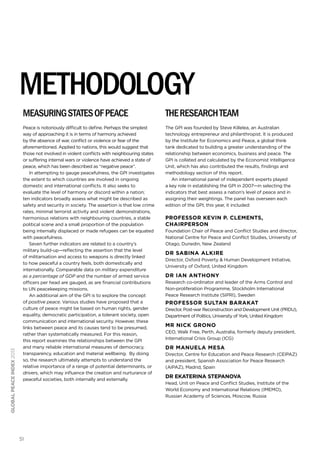
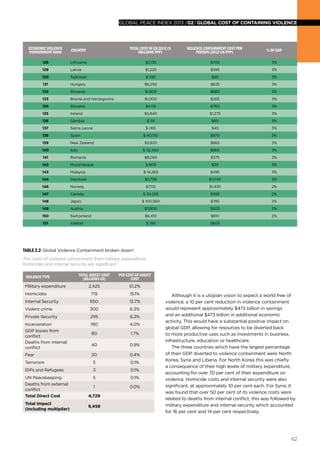
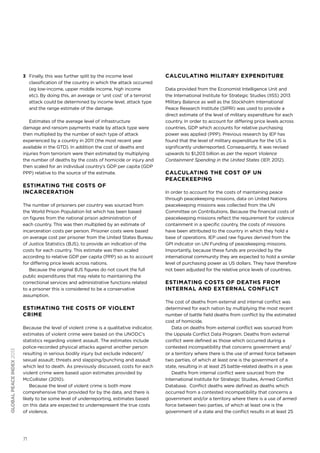
Were the world to reduce its
expenditure on violence by
approximately 50 per cent it could
repay the debt of the developing
world ($4076bn), provide enough
money for the European stability
mechanism ($900bn) and fund
the additional amount required
to achieve the annual cost of the
Millennium Development Goals
55
55
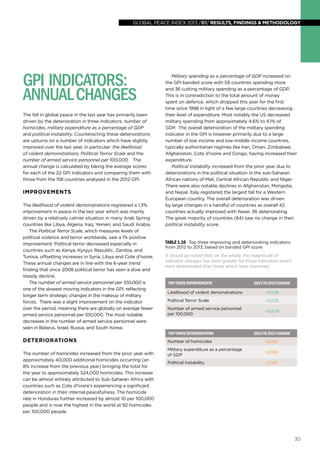
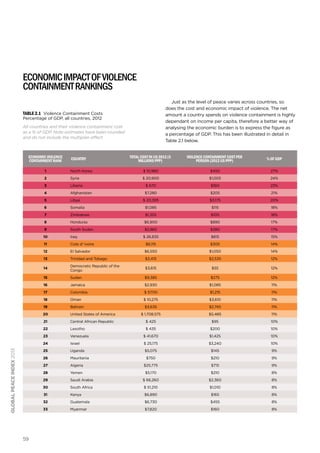
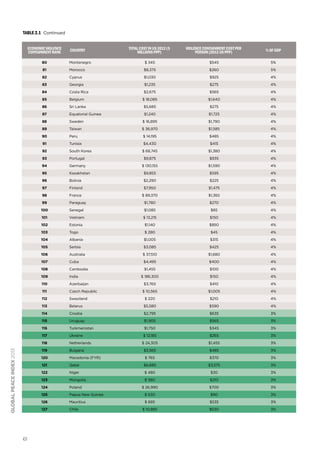
Calculating the cost of violence to the global economy
is notoriously difficult. In the past IEP has adopted a
methodology developed by Brauer and Tepper-Marlin (BTM
method) which reviewed existing literature on the cost of
violence, conflict and war and then estimated the additional
economic flow-on effects if these costs did not arise. To
complement this approach IEP has adopted a new and novel
method of estimating the cost of violence to the global
economy through calculating global violence containment
costs. IEP defines violence containment costs as economic
activity that is related to the consequences or prevention
of violence where the violence is directed against people or
property.
This approach uses ten indicators from the GPI and three
additional key areas of expenditure to place an economic
value on these thirteen different dimensions. This process
has been developed so that in addition to estimating the
global impact, the methodology could also be used to create
country based estimates. To enable relative comparisons
between countries at different levels of economic
development, GDP per capita has been used to scale the cost
of violence containment for each country. In both the US and
the UK a number of robust analyses have been conducted on
the cost of various types of violence and crime and used as
the basis for the scaling.
This study is highly conservative as there are many items
which have not been counted simply because accurate data
could not be obtained. Future studies will attempt to capture
these items; therefore future estimates are expected to be
much higher.
Using this methodology the economic impact of violence
containment to the world economy in 2012 was estimated
to be US$9.46 trillion or 11 per cent of Gross World Product](https://image.slidesharecdn.com/2013globalpeaceindexreport-131217092322-phpapp02/85/2013-Global-Peace-Index-Report-58-320.jpg)

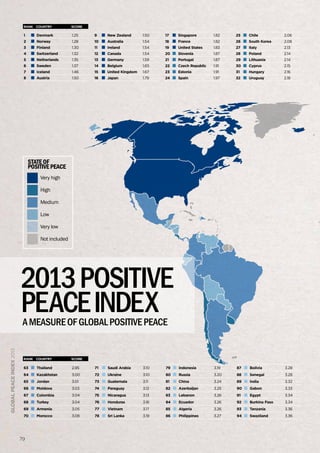
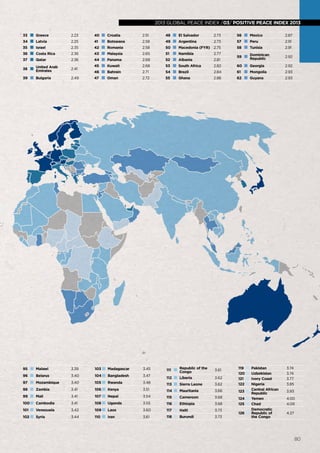
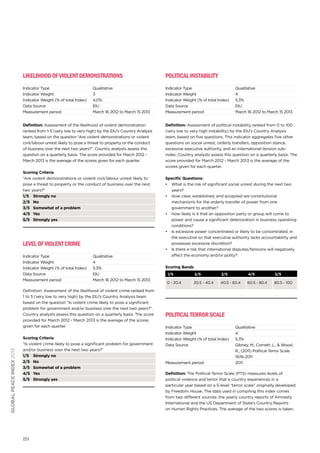
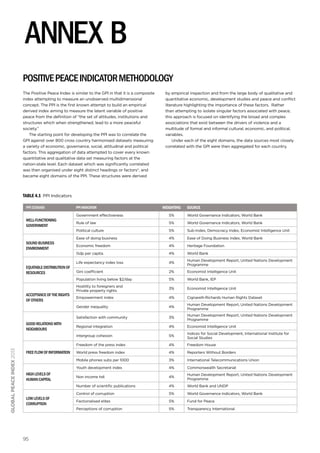
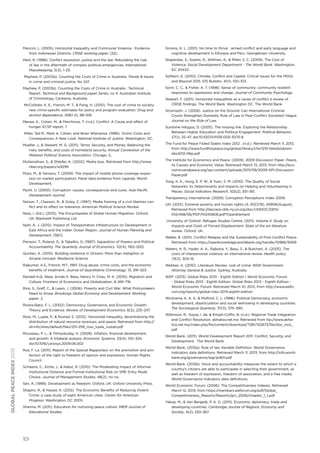
![global peace indexindex /03/ POSITIVE PEACE INDEX 2013
2013 global peace 2013 /03/ POSITIVE PEACE INDEX 2013
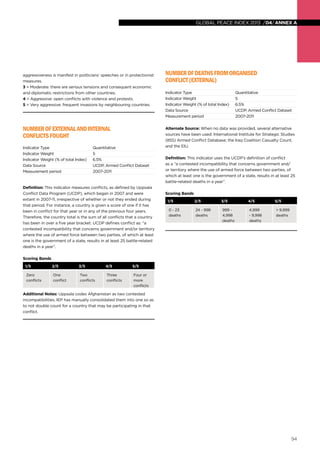
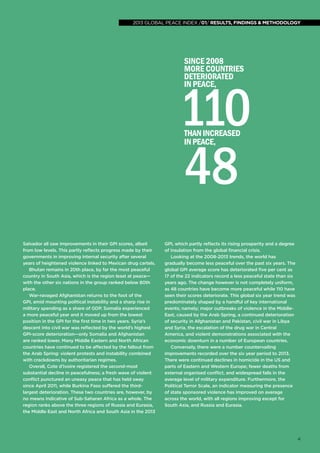
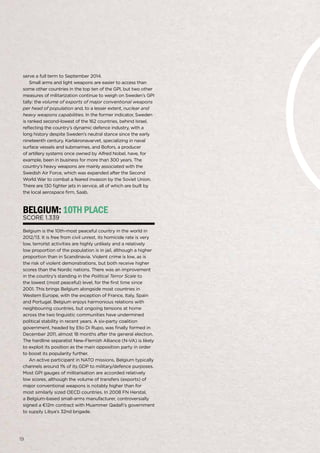
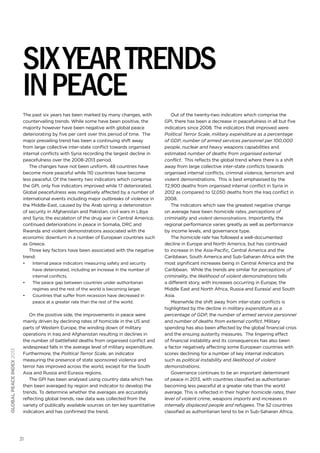
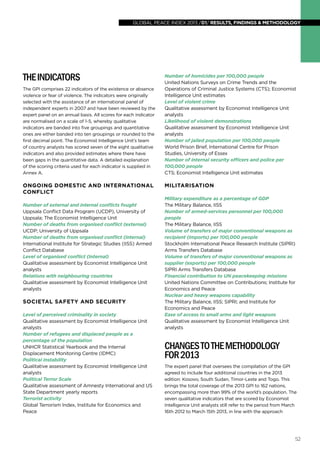
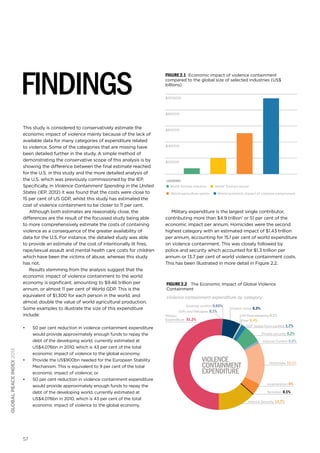
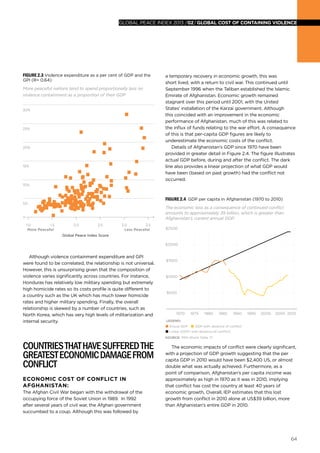
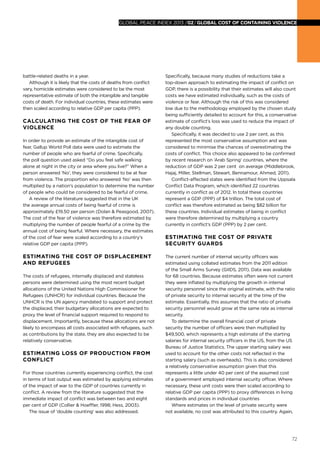
Of the top 30
countries
21
8
1
are full
democracies
while
are flawed
democracies
and
is a hybrid
regime
[ highlights ]
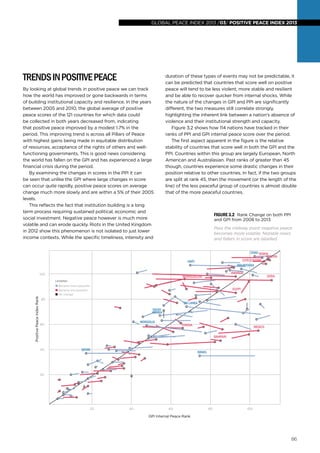
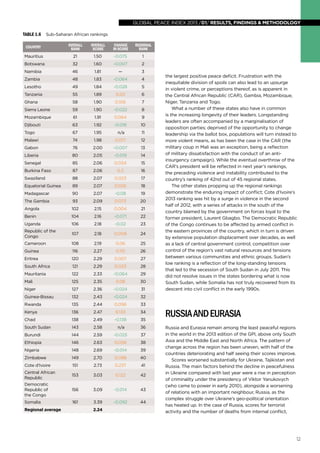
This is the second edition of the Positive Peace Index
(PPI), a measure of the strength of the attitudes,
institutions, and structures of 126 nations to determine
their capacity to create and maintain a peaceful society.
The PPI is based on a statistical framework which groups
these attributes into eight key categories known as the
‘Pillars of Peace’. These pillars have been identified as
describing what underpins a peaceful society.
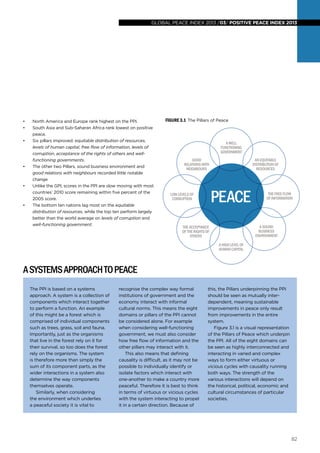
The Pillars of Peace emphasise the importance of
a holistic set of institutions which work together to
systematically shape the environments that lead to peace.
This framework is not aimed at deriving causality between
any of the Pillars, rather they work as an inter-dependent
set of factors where causality can run in either direction
and the strength of the relationships between the Pillars
will change depending on the specific circumstances in a
particular country.
In constructing the Pillars of Peace, over 800 different
indexes, datasets and attitudinal surveys were analysed in
conjunction with a broad literature review about the key
factors that drive peace, resilience and conflict.
In order to ensure the final framework was holistic, a
multidisciplinary and ‘systems approach’ to the concept of
peace was used, drawing on recent research.
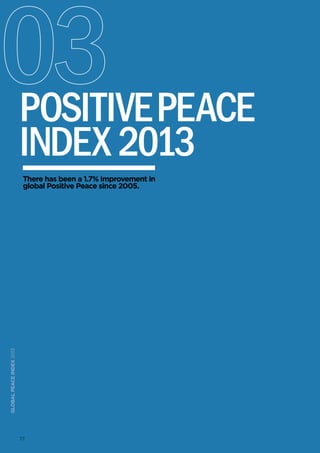
The 2013 PPI has ranked 126 countries on 24 indicators
and found that the global average of positive peace
improved in the period between 2005 and 2010 by 1.7%.
Globally there have been improvements in equitable
distribution of resources, levels of human capital, free flow
of information, levels of corruption, acceptance of the
rights of others and well-functioning governments.
North America and Europe remain the regions with the
highest levels of positive peace. Relative improvements
have been made in Asia-Pacific, South America, Central
America, MENA and Russia and Eurasia.
78
78](https://image.slidesharecdn.com/2013globalpeaceindexreport-131217092322-phpapp02/85/2013-Global-Peace-Index-Report-81-320.jpg)