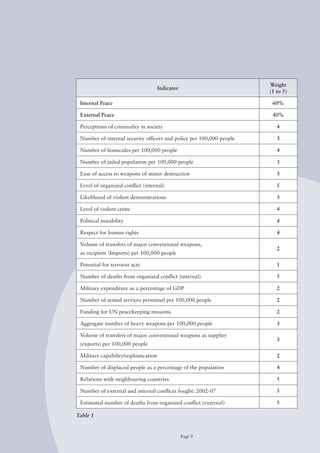
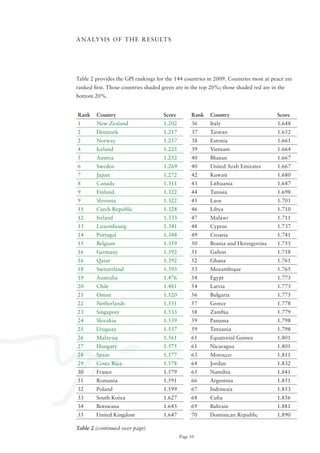
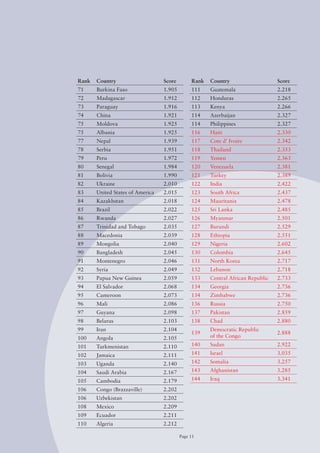
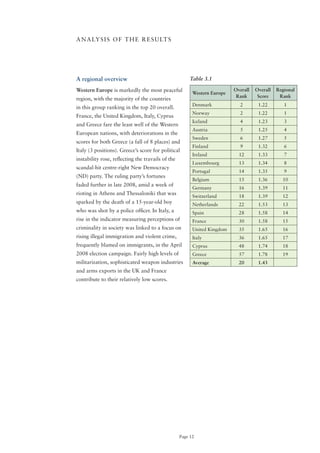
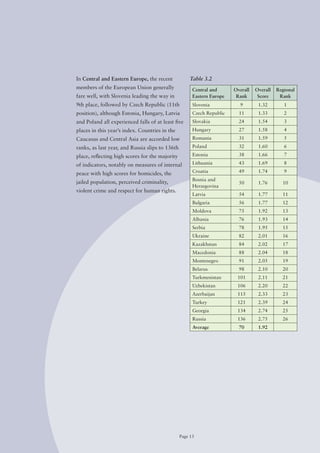
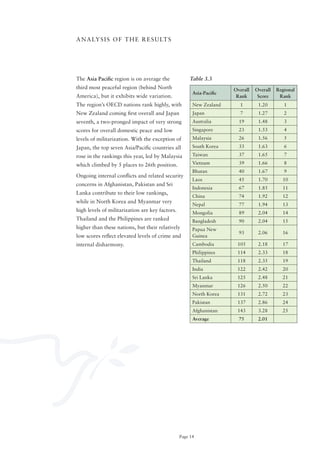
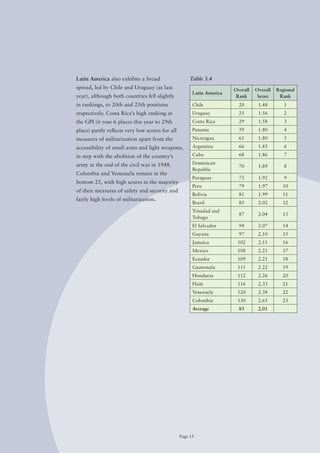
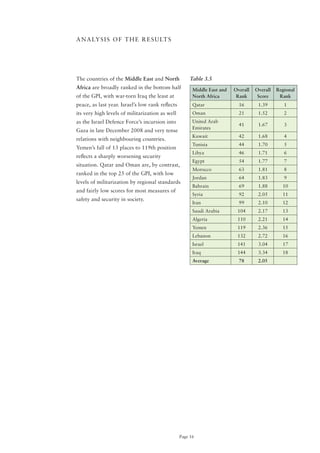
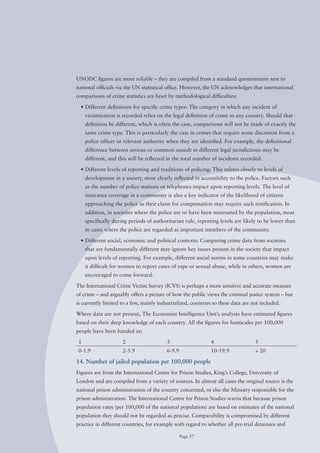
I N S T I T U T E F O R E C O N O M I C S & P EAC E P E A C E


2 0 0 9 M E T H ODOL OGY, R E SULTS & F I N DI N GS
E X E C U T I V E S U M M A RY


The results of the Global Peace Index for 2009 suggest that the
world has become slightly less peaceful in the past year, which
appears to reflect the intensification of violent conflict in some
countries and the effects of both the rapidly rising food and fuel
prices early in 2008 and the dramatic global economic downturn
in the final quarter of the year. Rapidly rising unemployment, pay
freezes and falls in the value of house prices, savings and pensions
is causing popular resentment in many countries, with political
repercussions that have been registered by the GPI through
various indicators measuring safety and security in society.

This is the third edition of the Global Peace Index (GPI). It has
been expanded to rank 144 independent states and updated with
the latest-available figures and information for 2007-08. The
index is composed of 23 qualitative and quantitative indicators
from respected sources, which combine internal and external
factors ranging from a nation’s level of military expenditure
to its relations with neighbouring countries and the level of
respect for human rights. These indicators were selected by an
international panel of experts including academics and leaders
of peace institutions.

As before, the GPI has been tested against a range of potential
“drivers” or potential determinants of peace – including levels of
democracy and transparency, education and material wellbeing.
The GPI brings a snapshot of relative peacefulness among
nations while continuing to contribute to an understanding of
what factors help create or sustain more peaceful societies.

The GPI was founded by Steve Killelea, an Australian international
technology entrepreneur and philanthropist. It forms part of
the Institute for Economics and Peace, a new global think tank
dedicated to the research and education of the relationship
between economic development, business and peace. The GPI
is collated and calculated by the Economist Intelligence Unit,
with whom this report is written in co-operation.

                                        Page 2
HIGHLIGHTS


New Zealand is ranked as the country most            encompassing almost 99% of the world’s
at peace, followed by Denmark and Norway.            population and over 87% of the planet’s
Small, stable and democratic countries are           land mass.
consistently ranked highest; 14 of the top 20        A further change involved the removal of
countries are Western or Central European            two indicators featured in the Global Peace
countries. This is, however, a reduction from        Indexes of 2007 and 2008: the measures of
16 last year, with Hungary and Slovakia both         UN and non-UN deployments. The former
slipping out of the top 20, while Qatar and          was dropped because it was generally
Australia moved up to 16th and 19th place            felt that it was not a sufficiently accurate
respectively. All five Scandinavian countries        measure of a commitment from countries
are in the top ten of the GPI. Island nations        to UN peacekeeping missions. In the 2009
generally fare well, although Madagascar             GPI the UN deployments indicator has been
fell by 30 places amid mounting political            replaced with a measure of financial support
instability and violent demonstrations. For          to UN peacekeeping missions as all UN
the third year running, the country ranked           member states share the cost of mounting
least at peace is Iraq. Afghanistan and              these operations. The indicator calculates
Somalia follow – countries that are in a state       the percentage of countries’ “outstanding
of ongoing conflict and upheaval. The average        contributions versus annual assessment to the
score for the nations surveyed in the 2009           budget of the current peacekeeping missions”
GPI is 1.964 (based on a 1-5 scale). There is        (see Annex A for a full definition).
little variance between the overall scores of
                                                     The indicator of Non-UN deployments
the top 20 countries (1.202 for New Zealand
                                                     was initially included on the assumption
and 1.481 for Chile), although the 20 lowest
                                                     that a country deploying troops overseas
ranked countries exhibit a far greater spread,
                                                     cannot be considered free of violence.
varying between 2.485 (Sri Lanka) and 3.341
                                                     However, members of the panel of experts
(Iraq).
                                                     acknowledged that the indicator is potentially
Changes to the methodology for 2009                  ambiguous - should the deployment of
The international panel of experts that              troops overseas, whose mission is to prevent
oversees the compilation of the Global               genocide in a foreign country, be recorded as
Peace Index chose to include five additional         a “negative” indicator in the GPI? In order to
countries in the 2009 edition: Burundi,              avoid making such judgements, the consensus
Georgia, Guyana, Montenegro and Nepal.               view was to remove the indicator.
Hong Kong was dropped in response                    The two previous editions of the Global
to queries about its status as a special             Peace Index have been compiled using a
administrative region of the People’s                combination of “raw” quantitative scores
Republic of China. While Hong Kong                   that were “normalized” and scores (mainly
maintains a high degree of autonomy, foreign         qualitative) that were banded using a scale of
affairs and defence are the responsibility of        1-5. The compilers have observed that the use
China’s authorities in Beijing. This brings the      of raw scores contributed to the volatility of
total number of countries covered to 144,            the index, so, following discussion with the

                                                 Page 3
HIGHLIGHTS


overseeing panel of experts, it was decided
this year to place all of the scores across the
23 indicators in bands, on either a scale of
1-5 or 1-10.

In order to make appropriate analysis of year-
on-year changes to scores and rankings of the
GPI, the Economist Intelligence Unit have used
the amended set of indicators and weights
as decided upon by the panel of experts to
construct a revised index and set of rankings
for the 2008 GPI. All discussions of changes
in rankings and scores refer to these new
methodologies. For more details, see Annex B.


                                                  Page 4
BACKGRoUND


                                   Defining peace                                      on human rights, gender equality, democratic
                                                                                       participation, tolerant solidarity, open
                                   The concept of peace is notoriously difficult
                                                                                       communication and international security.
                                   to define. The simplest way of approaching
                                                                                       However, these links between the concept of
                                   it is in terms of harmony achieved by the
                                                                                       peace and the causes of them were presumed
                                   absence of war or conflict. Applied to nations,
                                                                                       rather than systematically measured. For
                                   this would suggest that those not involved in
                                                                                       example, while Doyle2 and advocates of
                                   violent conflicts with neighbouring states or
                                                                                       his liberal peace theory have held that
                                   suffering internal wars would have achieved
                                                                                       democratic states rarely attack each other,
                                   a state of peace. This is what Johan Galtung1
                                                                                       the ongoing war in Iraq demonstrates how
                                   defined as a “negative peace” – an absence
                                                                                       some democratic countries can be militant or
                                   of violence. The concept of negative peace
                                                                                       belligerent – the justification for war often
                                   is immediately intuitive and empirically
                                                                                       being that peace is ultimately secured through
                                   measurable, and can be used as a starting
                                                                                       violence or the threat of violence.
                                   point to elaborate its counterpart concept,
                                   “positive peace”: having established what           Measuring states of peace
                                   constitutes an absence of violence, is it           The difficulties in defining the concept of
                                   possible to identify which structures and           peace may partly explain why there have
                                   institutions create and maintain peace? The         been so few attempts to measure states
                                   Global Peace Index is a first step in this          of peace across nations. This project has
                                   direction; a measurement of peace as the            approached the task on two fronts – the first
                                   “absence of violence”, that seeks to determine      aim is to produce a scoring model and global
                                   what cultural attributes and institutions are       peace index that ranks 144 nations by their
                                   associated with states of peace.                    relative states of peace using 23 indicators.
                                   In 1999 the UN General Assembly launched            The indicators have been selected as being
                                   a programme of action to build a “culture           the best available datasets that reflect the
                                   of peace” for the world’s children, which           incidence or absence of peace, and contain
                                   envisaged working towards a positive peace          both quantitative data and qualitative scores
                                   of justice, tolerance and plenty. The UN            from a range of trusted sources. The second
                                   defined a culture of peace as involving values,     aim is to use the underlying data and results
                                   attitudes and behaviours that:                      from the Global Peace Index to undertake
                                                                                       investigations into the relative importance of
                                     •	Reject	violence
                                                                                       a range of potential determinants or “drivers”
                                     •	Endeavour	to	prevent	conflicts	by	
                                                                                       that may influence the creation and nurturing
                                       addressing root causes
                                                                                       of peaceful societies, both internally and
                                     •	Aim	at	solving	problems	through	                externally.
                                       dialogue and negotiation
1 Galtung, Johan. Peace by
  Peaceful Means: peace            It proposed that such a culture of peace
  and conflict, development
  and civilization. oslo:          would be furthered by actions promoting
  International Peace Research
  Institute, 1996                  education for peace and sustainable
2 Doyle, Michael. Kant, Liberal
  Legacies, and Foreign Affairs.   development, which it suggested was based
  Philosophy and Public Affairs
  (1983) 205, 207-208

                                                                                   Page 5
BACKGRoUND


The international advisory panel                    Dr Bates Gill
of experts                                          Director, Stockholm International Peace
                                                    Research Institute (SIPRI), Sweden
As with all composite indexes of this type,
                                                    with Dr Ian Anthony and Dr Ekaterina
there are issues of bias and arbitrariness in the
                                                    Stepanova
factors that are chosen to assess peace and, as
seriously, in assigning weights to the different    Dr Ronald J. Horvath
indicators (measured on a comparable                Honorary Associate, School of Geosciences
and meaningful scale) to produce a single           University of Sydney, Australia
synthetic measure. In order to minimise             Dr Linda S. Jamison
these slants, the choices of indicators and         Dean, Abshire-Inamori Leadership Academy
the weights assigned to them were agreed            and Senior Fellow
following close and extensive consultation          Center for Strategic and International Studies
with the following international panel of           (CSIS), USA
experts in 2009:
                                                    Dr Manuela Mesa
Professor Kevin P. Clements, Chairperson            Director, Center for Education and Peace
Foundation Chair of Peace and Conflict              Research (CEIPAZ) and
Studies and                                         President, Spanish Association for Peace
Director, National Centre for Peace and             Research (AIPAZ), Spain
Conflict Studies
                                                    Dan Smith
University of otago, New Zealand
                                                    Author, in a private capacity
Professor Sultan Barakat
                                                    Paul van Tongeren
Director, Post-war Reconstruction and
                                                    Secretary General, Global Partnership for the
Development Unit (PRDU)
                                                    Prevention of Armed Conflict (GPPAC),
Department of Politics, University of York,
                                                    The Netherlands
United Kingdom


                                               Page 6
M E T H o D o L o G Y A N D D ATA S o U R C E S


The indicators                                         GPI 2008. All ranking and score changes
                                                       between the 2009 GPI and 2008 GPI are
Twenty-three indicators of the existence or
                                                       on the basis of these enhanced measuring
absence of peace were chosen by the panel of
                                                       techniques.
experts (see page 9), which are divided into
three broad categories: measures of ongoing            A detailed explanation of the scoring criteria
domestic and international conflict, measures          used for each indicator is supplied in
of safety and security in society and measures         Annex A to this paper.
of militarization. All scores for each indicator       Measures of ongoing domestic
have now been “banded”, either on a scale              and international conflict
of 1-5 (for qualitative indicators) or 1-10 (for
                                                       The Global Peace Index is intended as a
quantitative data, such as military expenditure
                                                       review of the state of peace in nations over
or the jailed population, which have then been
                                                       the past year, although many indicators are
converted to a 1-5 scale for comparability
                                                       based on available data from the last two
when compiling the final index). Qualitative
                                                       years. The panel of experts decided against
indicators in the index have been scored by
                                                       including data reflecting a country’s longer-
the Economist Intelligence Unit’s extensive
                                                       term historical experience of domestic and
team of country analysts, and gaps in the
                                                       international conflict on the grounds that the
quantitative data have been filled by estimates
                                                       GPI uses authoritative statistics on ongoing
by the same team.
                                                       civil and trans-national wars collated by
Indicators consisting of quantitative data             institutes such as the Uppsala Conflict
such as military expenditure or jailed                 Data Program and the International Peace
population have been measured on the                   Research Institute, oslo. These, combined
basis of the distribution of values across             with two indicators scored by the Economist
all countries between the maximum and                  Intelligence Unit’s analysts, comprise five of
minimum values (we assume that the 144                 the 23 indicators:
countries measured for the Global Peace
                                                            •	Number	of	external	and	internal	conflicts	
Index are a representative sample of all
                                                             fought: 2002-07
countries). Each of the indicator’s data set
has been divided into ten bands based on                    •	Estimated	number	of	deaths	from	

the full range of the data set and a country’s               organized conflict (external)

corresponding score results in its position                 •	Number	of	deaths	from	organized	conflict	
in the distribution. Each indicator’s range                  (internal)
between the maximum and minimum values                      •	Level	of	organized	conflict	(internal)
has now been anchored in time based on
                                                            •	Relations	with	neighbouring	countries
data collected for the 2008 Global Peace
Index. This is a change to the measurement
methodology used in previous versions of the
GPI and a detailed description is provided
in Annex A. In order to make comparable
and fair assessments over time, the 2009
methodology has been used to recalculate
                                                   Page 7
M E T H o D o L o G Y A N D D ATA S o U R C E S


Measures of societal safety and security                  •	Number	of	armed	services	personnel	per	
                                                            100,000 people
Ten of the indicators assess the levels of
safety and security in a society (country),               •	Volume	of	transfers	(imports)	of	major	
ranging from the perception of criminality                  conventional weapons per 100,000 people
in society, to the level of respect for human             •	Volume	of	transfers	(exports)	of	major	
rights and the rate of homicides and violent                conventional weapons per 100,000 people
crimes. Crime data is from the UN office
                                                          •	Funding	for	UN	peacekeeping	missions:	
of Drugs and Crime. The difficulties of
                                                            outstanding contributions versus annual
comparing international crime statistics are
                                                            assessment to the budget of the current
discussed in detail in Annex A. Five of these
                                                            peacekeeping missions
indicators have been scored by the Economist
Intelligence Unit’s team of country analysts:             •	Aggregate	number	of	heavy	weapons	per	
                                                            100,000 people
  •	Perceptions	of	criminality	in	society
                                                          •	Ease	of	access	to	small	arms	and	light	
  •	Number	of	displaced	people	as	a	
                                                            weapons
    percentage of the population
                                                          •	Military	capability/sophistication
  •	Political	instability
                                                     Weighting the index
  •	Level	of	disrespect	for	human	rights	
    (Political Terror Scale)                         The panel of experts apportioned scores
                                                     based on the relative importance of each of
  •	Potential	for	terrorist	acts
                                                     the indicators on a 1-5 scale. The consensus
  •	Number	of	homicides	per	100,000	people           scores for each indicator are given in table 1.
  •	Level	of	violent	crime                           Two sub-component weighted indices were
  •	Likelihood	of	violent	demonstrations             then calculated from the GPI group of
                                                     indicators:
  •	Number	of	jailed	population	per	100,000	
    people                                                1 a measure of how at peace internally a
                                                            country is;
  •	Number	of	internal	security	officers	and	
    police per 100,000 people                             2 a measure of how at peace externally a
                                                            country is (its state of peace beyond its
Measures of militarization
                                                            borders).
Eight of the indicators are related to a
                                                     The overall composite score and index was then
country’s military build-up – reflecting the
                                                     formulated by applying a weight of 60% to the
assertion that the level of militarization
                                                     measure of internal peace and 40% for external
and access to weapons is directly linked to
                                                     peace. The heavier weight applied to internal
how at peace a country feels internationally.
                                                     peace was agreed within the panel of experts,
Comparable data are readily available from
                                                     following robust debate. The decision was
sources such as the International Institute of
                                                     based on the innovative notion that a greater
Strategic Studies (IISS):
                                                     level of internal peace is likely to lead to, or at
  •	Military	expenditure	as	a	percentage	of	
                                                     least correlate with, lower external conflict.
    GDP

                                                 Page 8
Weight
                                   Indicator
                                                                      (1 to 5)

 Internal Peace                                                        60%

 External Peace                                                        40%

 Perceptions of criminality in society                                   4

 Number of internal security officers and police per 100,000 people      3

 Number of homicides per 100,000 people                                  4

 Number of jailed population per 100,000 people                          3

 Ease of access to weapons of minor destruction                          3

 Level of organized conflict (internal)                                  5

 Likelihood of violent demonstrations                                    3

 Level of violent crime                                                  4

 Political instability                                                   4

 Respect for human rights                                                4

 Volume of transfers of major conventional weapons,
                                                                         2
 as recipient (Imports) per 100,000 people

 Potential for terrorist acts                                            1

 Number of deaths from organized conflict (internal)                     5

 Military expenditure as a percentage of GDP                             2

 Number of armed services personnel per 100,000 people                   2

 Funding for UN peacekeeping missions                                    2

 Aggregate number of heavy weapons per 100,000 people                    3

 Volume of transfers of major conventional weapons as supplier
                                                                         3
 (exports) per 100,000 people

 Military	capability/sophistication                                      2

 Number of displaced people as a percentage of the population            4

 Relations with neighbouring countries                                   5

 Number of external and internal conflicts fought: 2002-07               5

 Estimated number of deaths from organized conflict (external)           5

Table 1


                                               Page 9
A N A LY S I S o F T H E R E S U LT S


Table 2 provides the GPI rankings for the 144 countries in 2009. Countries most at peace are
ranked first. Those countries shaded green are in the top 20%; those shaded red are in the
bottom 20%.


Rank    Country                      Score        Rank   Country                      Score
1       New Zealand                  1.202        36     Italy                        1.648
2       Denmark                      1.217        37     Taiwan                       1.652
2       Norway                       1.217        38     Estonia                      1.661
4       Iceland                      1.225        39     Vietnam                      1.664
5       Austria                      1.252        40     Bhutan                       1.667
6       Sweden                       1.269        40     United Arab Emirates         1.667
7       Japan                        1.272        42     Kuwait                       1.680
8       Canada                       1.311        43     Lithuania                    1.687
9       Finland                      1.322        44     Tunisia                      1.698
9       Slovenia                     1.322        45     Laos                         1.701
11      Czech Republic               1.328        46     Libya                        1.710
12      Ireland                      1.333        47     Malawi                       1.711
13      Luxembourg                   1.341        48     Cyprus                       1.737
14      Portugal                     1.348        49     Croatia                      1.741
15      Belgium                      1.359        50     Bosnia and Herzegovina       1.755
16      Germany                      1.392        51     Gabon                        1.758
16      Qatar                        1.392        52     Ghana                        1.761
18      Switzerland                  1.393        53     Mozambique                   1.765
19      Australia                    1.476        54     Egypt                        1.773
20      Chile                        1.481        54     Latvia                       1.773
21      oman                         1.520        56     Bulgaria                     1.775
22      Netherlands                  1.531        57     Greece                       1.778
23      Singapore                    1.533        58     Zambia                       1.779
24      Slovakia                     1.539        59     Panama                       1.798
25      Uruguay                      1.557        59     Tanzania                     1.798
26      Malaysia                     1.561        61     Equatorial Guinea            1.801
27      Hungary                      1.575        61     Nicaragua                    1.801
28      Spain                        1.577        63     Morocco                      1.811
29      Costa Rica                   1.578        64     Jordan                       1.832
30      France                       1.579        65     Namibia                      1.841
31      Romania                      1.591        66     Argentina                    1.851
32      Poland                       1.599        67     Indonesia                    1.853
33      South Korea                  1.627        68     Cuba                         1.856
34      Botswana                     1.643        69     Bahrain                      1.881
35      United Kingdom               1.647        70     Dominican Republic           1.890

Table 2 (continued over page)
                                             Page 10
Rank   Country                    Score        Rank   Country                    Score
71     Burkina Faso               1.905        111    Guatemala                  2.218
72     Madagascar                 1.912        112    Honduras                   2.265
73     Paraguay                   1.916        113    Kenya                      2.266
74     China                      1.921        114    Azerbaijan                 2.327
75     Moldova                    1.925        114    Philippines                2.327
75     Albania                    1.925        116    Haiti                      2.330
77     Nepal                      1.939        117    Cote d’ Ivoire             2.342
78     Serbia                     1.951        118    Thailand                   2.353
79     Peru                       1.972        119    Yemen                      2.363
80     Senegal                    1.984        120    Venezuela                  2.381
81     Bolivia                    1.990        121    Turkey                     2.389
82     Ukraine                    2.010        122    India                      2.422
83     United States of America   2.015        123    South Africa               2.437
84     Kazakhstan                 2.018        124    Mauritania                 2.478
85     Brazil                     2.022        125    Sri Lanka                  2.485
86     Rwanda                     2.027        126    Myanmar                    2.501
87     Trinidad and Tobago        2.035        127    Burundi                    2.529
88     Macedonia                  2.039        128    Ethiopia                   2.551
89     Mongolia                   2.040        129    Nigeria                    2.602
90     Bangladesh                 2.045        130    Colombia                   2.645
91     Montenegro                 2.046        131    North Korea                2.717
92     Syria                      2.049        132    Lebanon                    2.718
93     Papua New Guinea           2.059        133    Central African Republic   2.733
94     El Salvador                2.068        134    Georgia                    2.736
95     Cameroon                   2.073        134    Zimbabwe                   2.736
96     Mali                       2.086        136    Russia                     2.750
97     Guyana                     2.098        137    Pakistan                   2.859
98     Belarus                    2.103        138    Chad                       2.880
99     Iran                       2.104               Democratic Republic
                                               139                               2.888
100    Angola                     2.105               of the Congo
101    Turkmenistan               2.110        140    Sudan                      2.922
102    Jamaica                    2.111        141    Israel                     3.035
103    Uganda                     2.140        142    Somalia                    3.257
104    Saudi Arabia               2.167        143    Afghanistan                3.285
105    Cambodia                   2.179        144    Iraq                       3.341
106    Congo (Brazzaville)        2.202
106    Uzbekistan                 2.202
108    Mexico                     2.209
109    Ecuador                    2.211
110    Algeria                    2.212

                                          Page 11
A N A LY S I S o F T H E R E S U LT S


A regional overview                                     Table 3.1

Western Europe is markedly the most peaceful                              Overall   Overall   Regional
                                                         Western Europe
                                                                           Rank      Score     Rank
region, with the majority of the countries
                                                         Denmark            2        1.22        1
in this group ranking in the top 20 overall.
                                                         Norway             2        1.22        1
France, the United Kingdom, Italy, Cyprus
                                                         Iceland            4        1.23        3
and Greece fare the least well of the Western
                                                         Austria            5        1.25        4
European nations, with deteriorations in the
                                                         Sweden             6        1.27        5
scores for both Greece (a fall of 8 places) and
                                                         Finland            9        1.32        6
Italy (3 positions). Greece’s score for political
                                                         Ireland            12       1.33        7
instability rose, reflecting the travails of the
                                                         Luxembourg         13       1.34        8
scandal-hit centre-right New Democracy
                                                         Portugal           14       1.35        9
(ND) party. The ruling party’s fortunes
                                                         Belgium            15       1.36       10
faded further in late 2008, amid a week of
                                                         Germany            16       1.39       11
rioting in Athens and Thessaloniki that was
                                                         Switzerland        18       1.39       12
sparked by the death of a 15-year-old boy                Netherlands        22       1.53       13
who was shot by a police officer. In Italy, a            Spain              28       1.58       14
rise in the indicator measuring perceptions of           France             30       1.58       15
criminality in society was linked to a focus on          United Kingdom     35       1.65       16
rising illegal immigration and violent crime,            Italy              36       1.65       17
frequently blamed on immigrants, in the April            Cyprus             48       1.74       18
2008 election campaign. Fairly high levels of            Greece             57       1.78       19
militarization, sophisticated weapon industries          Average            20       1.43
and arms exports in the UK and France
contribute to their relatively low scores.


                                                   Page 12
In Central and Eastern Europe, the recent             Table 3.2
members of the European Union generally                Central and      Overall   Overall   Regional
fare well, with Slovenia leading the way in            Eastern Europe    Rank      Score     Rank
9th place, followed by Czech Republic (11th            Slovenia           9        1.32        1
position), although Estonia, Hungary, Latvia           Czech Republic     11       1.33        2
and Poland all experienced falls of at least five      Slovakia           24       1.54        3
places in this year’s index. Countries in the          Hungary            27       1.58        4
Caucasus and Central Asia are accorded low             Romania            31       1.59        5

ranks, as last year, and Russia slips to 136th         Poland             32       1.60        6

place, reflecting high scores for the majority         Estonia            38       1.66        7

of indicators, notably on measures of internal         Lithuania          43       1.69        8

peace with high scores for homicides, the              Croatia            49       1.74        9
                                                       Bosnia and
jailed population, perceived criminality,                                 50       1.76       10
                                                       Herzegovina
violent crime and respect for human rights.
                                                       Latvia             54       1.77       11
                                                       Bulgaria           56       1.77       12
                                                       Moldova            75       1.92       13
                                                       Albania            76       1.93       14
                                                       Serbia             78       1.95       15
                                                       Ukraine            82       2.01       16
                                                       Kazakhstan         84       2.02       17
                                                       Macedonia          88       2.04       18
                                                       Montenegro         91       2.05       19
                                                       Belarus            98       2.10       20
                                                       Turkmenistan      101       2.11       21
                                                       Uzbekistan        106       2.20       22
                                                       Azerbaijan        115       2.33       23
                                                       Turkey            121       2.39       24
                                                       Georgia           134       2.74       25
                                                       Russia            136       2.75       26
                                                       Average            70       1.92


                                                 Page 13
A N A LY S I S o F T H E R E S U LT S


The Asia Pacific region is on average the             Table 3.3
third most peaceful region (behind North                              Overall   Overall   Regional
                                                       Asia-Pacific
America), but it exhibits wide variation.                              Rank      Score     Rank
The region’s oECD nations rank highly, with            New Zealand      1        1.20        1
New Zealand coming first overall and Japan             Japan            7        1.27        2
seventh, a two-pronged impact of very strong           Australia        19       1.48        3
scores for overall domestic peace and low              Singapore        23       1.53        4
levels of militarization. With the exception of        Malaysia         26       1.56        5

Japan,	the	top	seven	Asia/Pacific	countries	all	       South Korea      33       1.63        6

rose in the rankings this year, led by Malaysia        Taiwan           37       1.65        7

which climbed by 5 places to 26th position.            Vietnam          39       1.66        8
                                                       Bhutan           40       1.67        9
ongoing internal conflicts and related security
                                                       Laos             45       1.70       10
concerns in Afghanistan, Pakistan and Sri
                                                       Indonesia        67       1.85       11
Lanka contribute to their low rankings,
                                                       China            74       1.92       12
while in North Korea and Myanmar very
                                                       Nepal            77       1.94       13
high levels of militarization are key factors.         Mongolia         89       2.04       14
Thailand and the Philippines are ranked                Bangladesh       90       2.04       15
higher than these nations, but their relatively        Papua New
                                                                        93       2.06       16
low scores reflect elevated levels of crime and        Guinea
internal disharmony.                                   Cambodia        105       2.18       17
                                                       Philippines     114       2.33       18
                                                       Thailand        118       2.35       19
                                                       India           122       2.42       20
                                                       Sri Lanka       125       2.48       21
                                                       Myanmar         126       2.50       22
                                                       North Korea     131       2.72       23
                                                       Pakistan        137       2.86       24
                                                       Afghanistan     143       3.28       25
                                                       Average          75       2.01


                                                 Page 14
Latin America also exhibits a broad                   Table 3.4
spread, led by Chile and Uruguay (as last                              Overall   Overall   Regional
                                                       Latin America
year), although both countries fell slightly                            Rank      Score     Rank
in rankings, to 20th and 25th positions                Chile             20       1.48        1
respectively. Costa Rica’s high ranking in             Uruguay           25       1.56        2
the GPI (it rose 6 places this year to 29th            Costa Rica        29       1.58        3
place) partly reflects very low scores for all         Panama            59       1.80        4
measures of militarization apart from the              Nicaragua         61       1.80        5

accessibility of small arms and light weapons,         Argentina         66       1.85        6

in step with the abolition of the country’s            Cuba              68       1.86        7

army at the end of the civil war in 1948.              Dominican
                                                                         70       1.89        8
                                                       Republic
Colombia and Venezuela remain in the
                                                       Paraguay          73       1.92        9
bottom 25, with high scores in the majority
                                                       Peru              79       1.97       10
of their measures of safety and security and
                                                       Bolivia           81       1.99       11
fairly high levels of militarization.
                                                       Brazil            85       2.02       12
                                                       Trinidad and
                                                                         87       2.04       13
                                                       Tobago
                                                       El Salvador       94       2.07       14
                                                       Guyana            97       2.10       15
                                                       Jamaica          102       2.11       16
                                                       Mexico           108       2.21       17
                                                       Ecuador          109       2.21       18
                                                       Guatemala        111       2.22       19
                                                       Honduras         112       2.26       20
                                                       Haiti            116       2.33       21
                                                       Venezuela        120       2.38       22
                                                       Colombia         130       2.65       23
                                                       Average           83       2.01


                                                 Page 15
A N A LY S I S o F T H E R E S U LT S


The countries of the Middle East and North             Table 3.5
Africa are broadly ranked in the bottom half            Middle East and   Overall   Overall   Regional
of the GPI, with war-torn Iraq the least at             North Africa       Rank      Score     Rank
peace, as last year. Israel’s low rank reflects         Qatar               16       1.39        1
its very high levels of militarization as well          oman                21       1.52        2
as the Israel Defence Force’s incursion into            United Arab
                                                                            41       1.67        3
                                                        Emirates
Gaza in late December 2008 and very tense
                                                        Kuwait              42       1.68        4
relations with neighbouring countries.
                                                        Tunisia             44       1.70        5
Yemen’s fall of 13 places to 119th position
                                                        Libya               46       1.71        6
reflects a sharply worsening security
                                                        Egypt               54       1.77        7
situation. Qatar and oman are, by contrast,
                                                        Morocco             63       1.81        8
ranked in the top 25 of the GPI, with low
                                                        Jordan              64       1.83        9
levels of militarization by regional standards
                                                        Bahrain             69       1.88       10
and fairly low scores for most measures of
                                                        Syria               92       2.05       11
safety and security in society.
                                                        Iran                99       2.10       12
                                                        Saudi Arabia       104       2.17       13
                                                        Algeria            110       2.21       14
                                                        Yemen              119       2.36       15
                                                        Lebanon            132       2.72       16
                                                        Israel             141       3.04       17
                                                        Iraq               144       3.34       18
                                                        Average             78       2.05


                                                  Page 16
Sub-Saharan African nations are generally               Table 3.6
placed in the bottom half of the index,                                    Overall   Overall   Regional
                                                         Africa
with conflict-ravaged Somalia, Sudan, the                                   Rank      Score     Rank
Democratic Republic of the Congo (DRC),                  Botswana            34       1.64        1
Chad and Zimbabwe all lying in the GPI’s                 Malawi              47       1.71        2
bottom ten. Botswana fares best, in 34th                 Gabon               51       1.76        3
position, as a result of minimal militarization,         Ghana               52       1.76        4
an absence of external or internal conflicts             Mozambique          53       1.77        5

and relatively low scores for most measures              Zambia              58       1.78        6

of safety and security, although the homicide            Tanzania            59       1.80        7

rate is high. Malawi is in the top 50 for                Equatorial
                                                                             61       1.80        8
                                                         Guinea
broadly similar reasons, with a lower
                                                         Namibia             65       1.84        9
homicide rate than in Botswana, but a higher
                                                         Burkina Faso        71       1.91       10
score for political instability. Madagascar falls
                                                         Madagascar          72       1.91       11
30 places from its relatively high position last
                                                         Senegal             80       1.98       12
year, amid mounting political instability and
                                                         Rwanda              86       2.03       13
the outbreak of violent demonstrations.                  Cameroon            95       2.07       14
                                                         Mali                96       2.09       15
                                                         Angola             100       2.10       16
                                                         Uganda             103       2.14       17

Three of the world’s major military-                     Congo
                                                                            106       2.20       18
                                                         (Brazzaville)
diplomatic powers (the European Union could
                                                         Kenya              113       2.27       19
be considered the 4th) continue to register
                                                         Cote d’ Ivoire     117       2.34       20
relatively low ranks, with China at 74th, the
                                                         South Africa       123       2.44       21
US at 83rd and Russia at 136th. The US rose
                                                         Mauritania         124       2.48       22
six places from last year, partly as a result of
                                                         Burundi            127       2.53       23
an improvement in its measures of political              Ethiopia           128       2.55       24
stability and a fall in the indicator registering        Nigeria            129       2.60       25
the potential for terrorist acts. Most measures          Central African
                                                                            133       2.73       26
of militarization are still accorded very high           Republic
scores and the country still jails a higher              Zimbabwe           134       2.74       27
proportion of its population than any of the             Chad               138       2.88       28
other 143 nations in the GPI. Members of the             DRC                139       2.89       29

G8 apart from Russia, the UK and the US do               Sudan              140       2.92       30

better, with Japan at 7th place, Canada at 8th           Somalia            142       3.26       31

and Germany at joint 16th.                               Average             96       2.22


                                                   Page 17
T H E T E N M o S T AT P E A C E


New Zealand: 1st place                                  although plans for a joint Trans-Tasman
Score: 1.202                                            agency for the regulation of drugs and
                                                        therapeutic goods were shelved in mid-2007
New Zealand is ranked the nation most at
                                                        owing to a lack of agreement on the issue
peace of the 144 ranked in the 2009 Global
                                                        among New Zealand political parties.
Peace Index. Its rise from 3rd position in
2008 is partly explained by an increase in              New Zealand’s measures of militarization
the score for political stability, following the        continue to receive very low scores – military
election of a new coalition government in               expenditure fell back to 1.07% of GDP in
November 2008. The centre-right National                2007 (latest available figures), which is a
Party has a strong popular mandate and                  lower proportion than Norway and Finland,
a robust parliamentary majority by New                  but higher than Denmark and Iceland.
Zealand’s standards, putting the new prime              Concerns have been raised in New Zealand
minister, John Key, in a good position                  that its low level of military spending could
to push through his agenda. The rise to                 compromise the ability of the 8,600-strong
first position is also related to the fall of           New Zealand Defence Force (NZDF) to meet
Iceland from the top spot last year, which              all its objectives, which include its alliance
reflects the deterioration in its indicators of         commitments to Australia and maintaining
political stability, the likelihood of violent          security in the South Pacific. New Zealand is
demonstrations and perceived criminality                accorded a low score for its exports of major
in the wake of the banking collapse that                conventional weapons–slightly lower the
engulfed the economy in September.                      score for Norway, Denmark and Finland and
                                                        considerably below the score for Sweden.
Most aspects of safety and security in
society, including the likelihood of violent
demonstrations, the homicide rate and the               Denmark: equal 2nd place
level of respect for human rights receive               Score: 1.217
the lowest possible scores (unchanged from
                                                        Denmark remains in second position in
last year), although the proportion of the
                                                        the GPI in 2009. It is politically stable and
population in jail is higher than any of the
                                                        enjoys good relations with its neighbours.
Nordic nations. New Zealand maintains
                                                        Rates of violent crime and homicide are low,
harmonious relations with neighbouring
                                                        violent demonstrations are highly unlikely to
countries, notably Australia, links with
                                                        occur and there is a high level of respect for
which are underpinned by the 1983 Closer
                                                        human rights. Although Denmark abandoned
Economic Relations (CER) agreement.
                                                        its policy of neutrality in 1949 to become
Augmenting the single-market agreement
                                                        a member of NATo, it has maintained a
is a Trans-Tasman Travel Agreement,
                                                        relatively modest level of defence contribution
which allows citizens of New Zealand and
                                                        and refuses to allow nuclear weapons on its
Australia to travel, work and live freely
                                                        soil in peacetime. Military expenditure as a
in either country. Steps are also being
                                                        percentage of GDP is very low and exports
taken towards greater harmonisation
                                                        of major conventional weapons are notably
of competition policy, and banking and
                                                        lower than in Sweden and Norway.
accountancy regulations with Australia,
                                                   Page 18
The indicator for imports of major                    Norway’s measures of militarization
conventional weapons rose slightly compared           receive low scores in a broad international
with that in the 2008 GPI, but not sufficiently       comparison, and military expenditure as a
to alter Denmark’s overall position when              percentage of GDP has fallen to the same
other countries near the top of the GPI,              level as the other Nordic countries surveyed,
notably Iceland, experienced a greater                including Denmark, which is also a NATo
deterioration in a wider range of indicators.         member. Access to small arms and light

The government, led by Anders Fogh                    weapons remains highly restricted. Norway’s

Rasmussen (Liberal Party), lent strong                direct military role in the international

support to the intervention in Iraq in March          struggle against terrorism following the

2003, and around 500 Danish troops were               September 11th 2001 attacks on the US

present in Iraq from June 2003 until they             has been limited, although important

were withdrawn in August 2007. Along                  for Norwegian forces. The change in the

with the other Nordic states, Denmark has             nature of threats to security in the Western

contributed both equipment and training               Hemisphere has altered the priorities of

to help the Baltic States establish stronger          Norwegian defence. Instead of being chiefly

military capacities for peacekeeping.                 geared to counter a Russian invasion, the
                                                      military is adopting a more flexible structure.
                                                      A reform process has been under way since
Norway: equal 2nd place                               2002 and the active peacetime military
Score: 1.217                                          force is being gradually cut by at least 5,000
Norway receives the same score as Denmark             troops (from about 26,600 at the outset) and
in the 2009 GPI, putting the country in joint         the military intends to dispose of one-third
second place, compared with third position            of its property.
last year. The country’s high rank reflects the
continued absence of internal conflict and
                                                      Iceland: 4th place
the fact that involvement in external conflicts
                                                      Score: 1.225
is limited to peacekeeping roles. Relations
between Norway and its neighbouring                   Iceland falls from first position in the

Scandinavian countries, with which it shares          2008 GPI to 4th place this year, amid an

a strong cultural and linguistic heritage, are        unprecedented collapse in the country’s

very good. Indeed, close co-operation with            financial system and currency that was

the other Nordic countries is a cornerstone of        triggered by international financial turmoil

Norway’s foreign policy. The rate of violent          in September and october 2008. Subsequent

crime is very low, there is a strong level of         protests on the streets of the capital,

respect for human rights, the political scene is      Reykjavik, which eventually brought about

stable and violent demonstrations are highly          the demise of the coalition government led by

unlikely to occur, all of which indicate a            Geir Haarde in January 2009, was reflected

harmonious society.                                   in a rise in the scores for political instability
                                                      and the likelihood of violent demonstrations,
                                                      albeit from very low levels. The indicator

                                                 Page 19
T H E T E N M o S T AT P E A C E


measuring perceptions of the level of                 accorded a score of 2 in Dalton and Gibney’s
criminality also increased, contributing to the       Political Terror Scale (measuring the level of
modest drop in the overall rankings. other            respect for human rights), which is higher
indicators remain unchanged compared with             than any of the other countries in the top ten
last year; the proportion of citizens who are         of the GPI.
in jail is still one of the lowest of the 144         Austria’s military expenditure as a percentage
countries surveyed, although there are more           of GDP is amongst the lowest of the 144
internal security officers and police per head        countries surveyed and there was a year-
than in Denmark and Finland.                          on-year reduction in the number of internal
A member of NATo since its inception in               security officers and police in 2008. The
1949, Iceland has no standing army, which             volume of imports of major conventional
means it continues to receive the lowest              weapons fell considerably from the high
possible scores for most of the measures of           level in 2007-08 that was associated with
militarization, although the score for military       the (domestically) controversial procurement
capability/sophistication	is	relatively	high	         of 18 Typhoon interceptor aircraft from the
on account of the nation’s well equipped              European Aeronautic Defence and Space
Coast Guard. In April 2007 the Icelandic              Company (EADS). This fall contributed
government signed peacetime security co-              considerably to Austria’s rise of five places in
operation agreements with its Norwegian               the rankings this year, offsetting the slight rise
and Danish counterparts, which mainly                 in Austria’s indicator for political stability,
focus on monitoring the North Atlantic.               which reflected escalating tensions between
Iceland’s UN peacekeeping deployments are             the Social Democratic Party (SPÖ) and the
the work of the Icelandic Crisis Response             Austrian People’s Party (ÖVP) over tax and
Unit (ICRU), which was founded in 2001                healthcare reforms. The grand coalition
and comprises a team including police                 eventually collapsed in July 2008 after just
officers, doctors and engineers.                      18 months.

                                                      Since 1995 Austria has been a member

Austria: 5th place                                    of NATo’s Partnership for Peace (PfP)

Score: 1.252                                          programme, which has led to small numbers
                                                      of its troops operating in Serbia (KFoR) and
Neutral since the end of Soviet occupation
                                                      Afghanistan (ISAF). In 2002 Austria adopted
of part of the country in 1955, Austria is
                                                      a new foreign-policy doctrine, which allows
politically stable and free of civil unrest. The
                                                      for greater involvement in collective security
country continues to enjoy good relations
                                                      arrangements without formally abandoning
with neighbouring states, which includes
                                                      Austria’s constitutionally enshrined neutrality.
support for Croatia’s bid to join the European
Community. Levels of violent crime are very
low, as is the homicide rate. The proportion
of the population in jail is also low, although
slightly higher than that recorded in the
Nordic countries and Japan. Austria is

                                                 Page 20
Sweden: 6th place                                    significant fall in the homicide rate and drops
Score: 1.269                                         in scores for some countries ranked above
                                                     Sweden last year – notably Ireland, which slid
Sweden is politically stable, free from civil
                                                     seven places.
unrest and it enjoys harmonious relations
with neighbouring countries. Human rights
are accorded a high level of respect, according      Japan: 7th place
to Dalton and Gibney’s index, and the jailed         Score: 1.272
population is one of the lowest in the world.
                                                     Japan’s 7th position in the 2009 GPI
Measures of societal safety and security
                                                     represents a fall of two places from last year.
such as the level of violent crime and the
                                                     The country has remained free from civil
likelihood of violent demonstrations are low
                                                     unrest and measures of societal security such
(and unchanged since last year). According to
                                                     as the level of violent crime, the likelihood
UN Surveys of Crime Trends and operations
                                                     of violent demonstrations and the rate of
of Criminal Justice Systems, the number of
                                                     homicides are among the lowest in the
homicides	fell	in	2007/08.
                                                     world – receiving correspondingly low
The majority of Sweden’s measures of                 scores in the 2008 GPI that did not change
militarization receive very low scores; the          in 2009. Respect for human rights is high
small amount of military expenditure as              and stringent laws prohibit the possession
a percentage of GDP and low numbers of               of firearms. Japan has generally been stable
armed service personnel is a reflection of           since the turbulence that followed the end of
the country’s long-standing neutrality. The          the Second World War. The score for political
tradition of military non alignment continues,       instability remained unchanged in 2008,
although the commitment to neutrality has            although it had increased the previous year
been loosened since early 2002 and there             in response to the scandal-hit premiership of
has arguably been a shift towards NATo.              Shinzo Abe of the Liberal Democratic Party,
Sweden is a member of the NATo-initiated             who was forced to resign as prime minister
Partnership for Peace (PfP) programme and            in July 2007 when the resurgent opposition
troops participate in peacekeeping operations        refused to back his reformist agenda.
in Afghanistan, Chad, the Balkans and the
                                                     Japan’s low level of military expenditure
Democratic Republic of the Congo, with UN
                                                     as a percentage of GDP reflects the ban on
mandates. Sweden receives a notably high
                                                     maintaining war potential that was enshrined
score for one measure of militarization in the
                                                     in the 1946 constitution. Nevertheless, the
GPI, however, that of the volume of transfers
                                                     annual defence budget is sizeable (around
of major conventional weapons as a supplier.
                                                     US$48bn) and Japan’s Self-Defence Forces
The country has developed a thriving arms
                                                     (SDF) are highly sophisticated. They have
industry through firms such as Saab Bofors
                                                     increasingly been deployed on international
Dynamics and its status as one of the world’s
                                                     humanitarian and peacekeeping missions,
top exporters of weapons per head is the
                                                     including, controversially within Japan, to
main reason for its relatively low rank among
                                                     Iraq in December 2003. An arms export ban
Scandinavian countries. Sweden’s rise to sixth
                                                     that dated back to 1946 was overturned in
position this year appears to be the result of a
                                                Page 21
T H E T E N M o S T AT P E A C E


2004, although subsequent exports have                  stationed at Kandahar had been killed, since
been on a relatively small scale. All measures          the mission began in 2002. Despite these
of militarization remained unchanged year               setbacks, the Conservative administration
on year.                                                won parliamentary approval in 2008 to
                                                        extend the mission in Afghanistan until 2011,
                                                        but rising casualties and public confusion
Canada: 8th place
                                                        about the purpose of the mission have raised
Score: 1.311
                                                        doubts about Canada’s role.
Politically stable, free from internal conflict,
with low levels of violent crime and few
violent demonstrations, Canada’s scores                 Finland: equal 9th place
for societal safety and security are low and            Score: 1.322

broadly mirror those of the Nordic countries.           Finland is politically stable, free of civil
The proportion of the population in jail rose           unrest and not at war with any other country.
slightly compared with the 2008 GPI and                 Relations with neighbouring countries are
it remains higher than in the Scandinavian              harmonious and the level of violent crime
nations, but it is far lower than in the US.            is very low – unchanged from last year –
offsetting the rise in the jailed population            although the homicide rate is higher than in
was an improvement in the score for the level           the other Nordic countries. other measures
of respect for human rights, which is one of            of safety and security in society including
the factors behind Canada’s rise into the top           the proportion of the population in jail and
ten countries most at peace in the 2009 GPI.            perceptions of criminality are very low,

Access to small arms is far more restricted             while human rights are accorded a high level

than in the US and almost all of the measures           of respect. The potential for terrorist acts

of militarization are accorded much lower               is considered to have diminished in 2008,

scores in Canada than in its southern                   although it remains slightly higher than the

neighbour. Since Canada’s three separate                other Scandinavian countries apart from

armed forces were reorganized into the                  Denmark.

Canadian Armed Forces (CAF) in 1964 the                 Since the end of the cold war, Finland
defence budget has declined as a proportion             has professed a policy of strategic non-
of overall government spending, in line with            alignment and chosen not to apply for
a diminishing perceived threat from the                 NATo membership, despite the fact that the
Warsaw Pact. The CAF’s two bases in West                three nearby Baltic States joined in 2004.
Germany were closed in the early 1990s and              The Finnish government has adopted an
the military was increasingly associated with           essentially neutral approach to the conflict
international peacekeeping missions. Canada             in Iraq; it has refrained from sending troops
has more than 2,500 troops in Afghanistan,              and is not included in the US list of countries
as part of NATo’s International Security                eligible to bid for contracts for reconstructing
Assistance Force (ISAF). The Canadians are              Iraq. However, Finland is involved in
at the forefront of actions against the Taliban         the NATo Partnership for Peace (PfP)
and by April 2009 116 of the 2,500 troops               programme and has supplied troops to the

                                                   Page 22
NATo-led force in Afghanistan – 80 remain            in the 2009 GPI, coupled with the slide of
in 2009, a slight reduction on last year.            nations including Ireland and Portugal,
Military spending as a proportion of GDP             ranked higher than Slovenia last year. Low
stays low at 1.29% of GDP in 2007 (latest            scores characterize most aspects of Slovenia’s
available figure), but higher than in Denmark        measures of militarization – the 7,200-strong
and Iceland.                                         army accounts for a low proportion of
                                                     GDP. A small contingent of 70 soldiers is
                                                     in Afghanistan and others are restricted
Slovenia: equal 9th place
                                                     to various NATo and UN peacekeeping
Score: 1.322
                                                     missions, most notably in Kosovo, where
Slovenia became an independent nation                Slovenia deploys around 350 troops. The
in July 1991 after a brief conflict with the         present government is considering decreasing
Yugoslav People’s Army, avoiding most of the         the Slovenian presence in other international
turmoil that engulfed the former Yugoslavia          peacekeeping missions.
in the early 1990s and experiencing relative
political stability under a 12-year spell of
centre-left coalition government led by the
Liberal Democracy of Slovenia from May
1992. The score for political instability is
lower than that of any other country in the
Balkans in the 2009 GPI, although it rose
slightly compared with last year, reflecting
tensions emerging from the constituents of
the coalition government that has been led
by Borut Pahor of the Social Democrats since
September 2008. Relations with neighbouring
countries are good, although Slovenia’s
score of 2 is lower than that of the Nordic
countries as a result of an ongoing maritime
border dispute with Croatia. Several measures
of safety and security in Slovenian society
receive the lowest possible scores: namely
the level of violent crime, the proportion
of the population in jail and the rate of
homicides, although violent demonstrations
are considered to be more likely than in
neighbouring Austria.

The number of internal security officers and
police per head fell significantly in 2008,
which is one of the reasons for the country’s
move into the top ten most at peace nations

                                                Page 23
T H E T E N L E A S T AT P E A C E


Globally, war-torn Iraq is classified as the           the potential for terrorist acts all receive the
least at peace out of 144 countries, followed          highest possible scores (unchanged from last
by Afghanistan.                                        year). The proportion of the population who
                                                       are displaced rose to almost 8%, according
                                                       to latest statistics from the UNHCR, higher
Iraq: 144th place
                                                       even than Afghanistan. As a result of
Score: 3.341
                                                       rising violence, some 1.5 million Iraqis are
War-torn Iraq remains the lowest-ranked                now thought to live in Syria, with another
nation of the GPI. The indicator for the level         500,000-750,000 in Jordan. “Sectarian
of organized conflict within the country               cleansing” – most notably in the capital,
stays at the highest possible score (5) in this        Baghdad, but also elsewhere – by insurgent
year’s GPI; 9,204 Iraqis were killed in 2008           and militia groups has led to an estimated 2.2
according to Iraqi Body Count, as were 322             million internally displaced persons (IDPs).
Coalition troops. Some 946 Iraqis died in the          Fearful of reprisals, or in the face of explicit
first four months of 2009. Mosul remains               threats, most IDPs have withdrawn from
an urban stronghold for al-Qaida, and the              mixed areas to those that are more religiously
Iraqi security forces, despite their successes         homogenous. In addition, many Iraqis have
elsewhere, have largely failed to clear                fled to the more stable Iraqi Kurdistan region.
insurgents from Diyala governorate.
                                                       Iraq is a highly militarized country, the
Iraq’s score for political stability has               legacy of Saddam Hussein’s steady build-up
improved since last year, albeit from a low            of forces from his time as head of security in
base, in line with a substantial enhancement           the ruling Ba’ath Party in the 1970s. The GPI
of the position of the prime minister, Nouri           score for its military capability sophistication
al-Maliki, following a series of Iraqi army            has increased this year, in line with the Iraqi
offensives in early 2008 in Basra, Baghdad,            Army’s recent purchase of sophisticated
and Amarah against elements within the                 US weaponry, including General Dynamics
Mahdi Army (a militia ostensibly loyal to              Abrams tanks, Lockheed Martin M-16 fighter
Moqtada al-Sadr, a radical Shia cleric).               jets and Bell helicopters.
The crackdown on Shia militia’s has
also precipitated thawing relations with
neighbouring Arab countries (the score for             Afghanistan: 143rd place
this indicator falls from 4 to 3), and most of         Score: 3.285

them have now reopened their embassies in              Embroiled in conflict and instability for
Baghdad, although mutual suspicions remain.            much of the past two decades, Afghanistan
Despite these improvements, and an easing              remained far from unified during 2008,
security situation since mid-2007, ongoing             experiencing an intensification of fighting
tensions and violence is far higher in Iraq            between the NATo-supported Afghan
than in most countries and the GPI’s measures          National Army (ANA) and a Taliban-
of safety and security in society mirror               backed insurgency that has spread well
this: the level of trust in other citizens, the        beyond its stronghold in the south and
homicide rate, the level of violent crime and          east of the country. The GPI scores for the

                                                  Page 24
number of deaths in organized conflict, the             militarization, such as the number of armed
level of violent crime and the likelihood of            services personnel per 100,000 people,
violent demonstrations all rose significantly           military expenditure as a percentage of GDP
– reflecting reports that as many as 5,400              and the aggregate number of heavy weapons
people were killed in 2008, making it the               per head receive fairly low scores. The
bloodiest year since the beginning of this              official army, the ANA, is small, with around
conflict in 2001. The upsurge in violence               35,000 members in mid-2008, and vastly
contributed to the country’s fall in the overall        understaffed relative to the security challenges
GPI rankings in 2009, which was also the                it faces.
result of a slight rise in Sudan’s overall score
from last year.
                                                        Somalia: 142nd place
An estimated three million Afghan refugees              Score: 3.257
have returned to their country since 2002,
                                                        Somalia has not had a nationally functioning
mainly from settlements in neighbouring
                                                        state government since its descent into civil
Pakistan, but around two million Afghans
                                                        war in 1991. The UN estimates that around
are still displaced, which is the second-
                                                        one million people of an estimated population
highest proportion of a population in the
                                                        of 8.5 million have been displaced by the
144 countries surveyed (behind Bhutan). In
                                                        ongoing conflict, which remains one of the
2008 Pakistan agreed to postpone the closure
                                                        largest proportions in the 144 countries
of Afghan refugee camps and extended the
                                                        in the GPI even though the latest available
deadline for the repatriation of two million
                                                        figures from the UNHCR (2007) point to a
refugees to Afghanistan beyond 2009.
                                                        fall in the number of displaced people. More
Relations with most neighbouring countries              than a dozen peace agreements have been
are tense. Most of the other measures of                brokered between the warring factions since
safety and security in society receive very             1991, but none have brought about political
high scores in the GPI, notably the number              stability or restored security. The GPI score
of homicides, the level of violent crime, the           for political instability increased slightly
potential for terrorist acts and perceptions            in 2008, reflecting an upsurge in fighting
of criminality in society. The political                between Islamist insurgents loyal to the Union
scene is highly unstable – the president,               of Islamic Courts (UIC) and the Transitional
Hamid Karzai, has experienced repeated                  Federal Government (TFG) of Somalia, which
assassination attempts and public support               spread beyond the capital, Mogadishu, to the
is fragile. Many people feel that their living          Galgaduud, Muudug and Hiiran regions.
conditions are worsening, owing to a lack of
                                                        The deteriorating security situation has
jobs and basic necessities such as electricity,
                                                        coincided with a growing number of violent
clean water, hospitals and food. Afghanistan’s
                                                        pirate attacks off the coast of Somalia (more
GPI score for respect for human rights is the
                                                        than 100 were recorded in 2008); disrupting
worst possible.
                                                        one of the world’s busiest shipping lanes.
Small arms and light weapons are                        This year’s rise in the GPI score for the
readily available, but other measures of                number of deaths from organized conflict also

                                                   Page 25
T H E T E N L E A S T AT P E A C E


mirrors attacks by insurgents on the African         Indicators of societal safety and security in
Union (AU) troops stationed in Somalia,              Israel present a mixed picture, as last year.
which prompted the UN Security Council               on the one hand, the level of violent crime
to extend their mandate by six months from           and the number of homicides are low, violent
February 2008. Not surprisingly, almost all          demonstrations are unlikely to occur and the
of Somalia’s measures of safety and security         political scene is reasonably stable (becoming
are accorded the highest possible scores. The        slightly more so during 2008). on the other
exceptions are indicators such as the number         hand, terrorist acts are likely, even though
of internal security officers and police per         the threat diminished slightly in 2008 and
head of population and the proportion of the         criminality is perceived to be high. Military
population in jail, on account of the country’s      expenditure in Israel as a percentage of GDP
lack of civil institutions.                          fell in 2008, but at 7.1% it remains among
                                                     the highest in the world. Despite a drop in
                                                     the number of armed service personnel per
Israel: 141st place
                                                     head in 2008, Israel’s score for this indicator
Score: 3.035
                                                     remains at the highest possible level (only
Despite peace treaties with Egypt in 1982            North Korea comes close). The IDF is
and with Jordan in 1994, Israel remains in           highly sophisticated and Israel is a major
a formal “state of war” with its northern            manufacturer and exporter of arms. Imports
neighbours, Syria and Lebanon, and with              of major conventional weapons increased,
much of the Arab world. Relations with               according to the most recent figures from
Lebanon have been tense since the war in             the Stockholm International Peace Research
July and August 2006 (known in Israel as             Institute, further contributing to a very high
the Second Lebanon War and in Lebanon as             score for Israel’s measures of militarization
the July War). The GPI indicator measuring           in the GPI.
relations with neighbouring countries remains
unchanged at “4” on a scale of 1-5; defined
as “aggressive, open conflict with violence          Sudan: 140th place
and protests”. The level of organized internal       Score: 2.922

conflict is recorded as “high”, and unchanged        Sudan’s lowly position in the GPI reflects
from	last	year,	reflecting	continued	Israeli/        the continued bloodshed and deepening
Palestinian tensions that were manifested in         humanitarian crisis in the western region of
sustained rocket attacks from Gaza (controlled       Darfur, as well as rekindled tensions between
by the Islamist group, Hamas, since June             the north and south of the country. The
2007) on towns in southern Israel in 2008 and        Darfur conflict began in early 2003, when the
a military offensive in Gaza launched by the         Sudan Liberation Movement (SLM) launched
Israel Defence Force (IDF) in late December          guerrilla attacks on government positions
2008. The IDF’s incursions into Gaza led to          in the region, angered by what they saw as
the deaths of an estimated 1,300 Palestinians        their political and economic marginalisation
and 13 Israelis by the time both sides agreed        and the Sudanese government’s failure to
unilateral ceasefires on January 18th 2009.          protect them from attacks by nomadic Arab

                                                Page 26
militias, known as the janjaweed. The brutal        Democratic Republic of the Congo:
conflict has forced around 2.7 million people       139th place
from their homes, many of them fleeing              Score: 2.888
to neighbouring Chad, caused more than
                                                    The Democratic Republic of the Congo’s
300,000 deaths and left 4.7 million dependent
                                                    score in the GPI deteriorated significantly
on humanitarian aid. Fighting continued in
                                                    in 2008. This reflected renewed violence in
2008 in spite of the signing of Darfur Peace
                                                    the eastern province of North Kivu and the
Agreement in May 2006 and the presence of
                                                    outbreak of what the Uppsala Conflict Data
a 9,200-strong UN-African Union mission
                                                    Program (UCDP) classify as a new conflict
in Sudan (UNAMIS). The conflict forced
                                                    in the war-torn country; between the Bundu
another 300,000 to flee their homes last year.
                                                    dia Kongo (Kingdom of Kongo, Bdk) and
Additionally, the conflict between the Sudan
                                                    the government about the orientation of the
People’s Liberation Army (SPLA) and the
                                                    political system in the province of Bas-Congo.
government of the National Congress Party
                                                    Armed clashes between the Congrès national
(NCP) about the future status of Southern
                                                    pour la défense du peuple (CNDP) led by
Sudan and the implementation of the 2005
                                                    Laurent Nkunda, a renegade Tutsi general,
the Comprehensive Peace Agreement (CPA)
                                                    and the national army, Forces armées de
rumbled on in 2008; in mid-May heavy
                                                    la République démocratique du Congo
fighting broke out between Arab tribal militias
                                                    (FARDC), broke out in North Kivu in late
and SPLA troops in the town of Abyei,
                                                    August and continued more or less unabated
emptying it and displacing 50,000 people.
                                                    until mid-November. The CNDP has also
Not surprisingly, measures of safety and            been fighting a Rwandan Hutu force based in
security in society such as the number of           eastern DRC. The humanitarian fallout from
homicides, political terror and the number          the fighting in North Kivu, has, once again,
of displaced people as a percentage of the          been devastating, with hundreds of casualties
population receive very high scores, although       and an estimated 250,000 people fleeing their
the latter dropped slightly from last year.         homes, many trying to find refuge in the town
Political instability increased during 2008,        of Goma. The already high level of perceived
in line with the International Criminal Court       criminality increased in 2008.
(ICC) deliberation over whether to issue an
                                                    Unsurprisingly for a nation that has endured
arrest warrant against the president, omar
                                                    decades of misrule and which has been
al-Bashir, who was charged with war crimes
                                                    frequently wracked by conflict, including a
in Darfur by the ICC’s chief prosecutor in
                                                    civil war between 1998 and 2003 that caused
July. In the military sphere, small arms and
                                                    an estimated three million deaths, almost all
light weapons remain highly accessible, while
                                                    of DRC’s measures of safety and security in
military expenditure as a percentage of GDP
                                                    society receive very high scores. The indicator
rose slightly year on year from a moderate
                                                    measuring potential terrorist acts is an
level.
                                                    exception, with a moderate score (unchanged
                                                    from last year), notably lower than in


                                               Page 27
T H E T E N L E A S T AT P E A C E


Somalia, Iraq, Afghanistan and India. Small            The large number of displaced people as a
arms and light weapons are readily available,          proportion of the population also contributes
but the other measures of militarization are           to Chad’s low overall rank. Small arms and
accorded low scores, in common with most               light weapons are easily accessed, but other
African countries.                                     measures of militarization, such as military
                                                       expenditure as a percentage of GDP and
                                                       military sophistication receive fairly low
Chad: 138th place
                                                       scores. The influx of refugees from Sudan
Score: 2.880
                                                       and Central African Republic has outstripped
Political violence has plagued Chad for much           the increase in security personnel (newly
of its 48-year history as an independent               trained by the UN mission in the country,
nation. The country’s very high scores in              MINURCAT), leading to a drop in the ratio
the GPI’s indicators of ongoing domestic               of security officers to population.
conflict reflect ongoing violence in the east of
the country, close to the border with Sudan
and the Central African Republic, which is             Pakistan: 137th place
linked to the genocide and humanitarian                Score: 2.859

crisis in Darfur. The measure of relations with        Buffeted by bombings and violent attacks
neighbouring countries is not surprisingly             linked to a strengthening Islamic insurgency,
accorded the highest possible score,                   sectarian clashes, political turmoil and a
unchanged from last year. Fighting in Chad             severe economic downturn, it is no surprise
escalated in early 2008, when a convoy of              that Pakistan slides into the ten nations
300 vehicles carrying around 2,000 rebels              ranked least at peace in this year’s GPI. The
of the Union of Forces for Democracy                   nation’s score for relations with neighbouring
and Development (UFDD) and the Rally                   countries has risen two places to level 5,
of Forces for Change (RFC) approached                  primarily in response to the attacks by
the capital, Ndjamena, where they were                 militant Islamists linked to Pakistan-based
eventually repelled by government forces.              Lashkar-e-Taiba on India’s financial and
Against this backdrop, the GPI’s indicators            cultural capital, Mumbai, in late November
of safety and security in society register very        2008. The terrorist attacks, which left at
high scores, notably the homicide rate and             least 173 people dead, has led to a sharp
the perceived level of criminality. Political          escalation of tensions with India and a
instability rose from an already high level in         renewed international focus on Pakistan’s
2008, amid the growing military threat posed           responsibility to rein in locally based
to the president, Idriss Déby, by a newly              terrorist groups. Relations with neighbouring
formed rebel alliance, Union des forces de la          Afghanistan also became increasingly
résistance (UFR). An expanded UN military              strained in 2008 and early 2009, reflecting
force in Chad, MINURCAT 2, is not due to               growing violence in Pakistan’s North-West
be fully operational until october 2009 at             Frontier Province, including attacks by
the earliest.                                          militants on supplies destined for NATo
                                                       troops in Afghanistan.

                                                  Page 28
Relations with neighbouring countries was           criticism of the scale and manner of Russia’s
one of three indicators of ongoing domestic         response, including from Ukraine. This
and international conflict that deteriorated in     predictably pushed up the score measuring
2008, mirroring an alarming rise in suicide         Russia’s relations with neighbouring
bombings and violent attacks in the North           countries to level 4: “Aggressive: open
West Frontier Province (NWFP), the Federally        conflict with violence and protests.” Violent
Administered Tribal Areas (FATA) and                demonstrations were also adjudged to have
Baluchistan. Violence has also increasingly         become more likely to occur in 2008 than the
afflicted parts of Punjab, Sindh, and the Gilgit-   previous year. Rates of homicide and violent
Baltistan region in the past year. According        crime remain high and Russians continue to
to the India-based Institute for Conflict           perceive high levels of criminality (all three
Management terrorism-related violence caused        indicators are unchanged from last year).
6,715 deaths in Pakistan in 2008 (2,155 of          The International Centre for Prison Studies
whom were civilians), compared with 3,599           records that a very high proportion of the
a year earlier and 189 in 2003, when the            Russian population is in jail (second only to
country was already being viewed as unstable.       the US in the 144 countries surveyed).
Small arms and light weapons became even
                                                    Russia’s military capability has shrunk greatly
more readily accessible in 2008, but most
                                                    since the Soviet era, but it remains powerful;
measures of militarization continued to receive
                                                    its active armed forces totalled just over one
relatively low scores, with the exception of
                                                    million in 2008, compared with 2.7 million in
military	capability/sophistication,	which	
                                                    June 1992 and an estimated 4 million at the
remained at level 4, in line with Pakistan’s
                                                    height of the Soviet Union’s power. Although
status as a nuclear-armed state.
                                                    military expenditure as a percentage of GDP
                                                    has shrunk considerably in the past decade,
Russia: 136th place                                 it remains relatively high and rose by 0.3%
Score: 2.750                                        to 2.5% in 2008. The number of exports of
                                                    major conventional weapons is extremely
Russia slides deeper into the ten countries
                                                    high (second only to Israel), although it did
least at peace this year, falling by three
                                                    fall slightly during 2008.
places to 136th, partly as a result of the
dramatic escalation of a simmering conflict
with Georgia in August 2008. The effort
                                                    Zimbabwe: 134th place
by Georgian troops launched on August
                                                    Score: 2.736
7th to retake Georgia’s breakaway territory
of South ossetia prompted a devastating             Years of misrule have precipitated a
response from Russian forces, their first           humanitarian and economic catastrophe
external military engagement since the              in Zimbabwe. The country is mired in
collapse of the Soviet Union, which extended        hyperinflation, 80% unemployment and
deep into Georgia. The brief, but intense,          a collapsing infrastructure, and waves of
war that left around 370 Georgians and              brutal land-reform programmes and political
80 Russians dead, prompted international            violence have forced hundreds of thousands


                                               Page 29
T H E T E N L E A S T AT P E A C E


from their homes. GPI scores for measures of
ongoing domestic and international conflict
are very high, and the level of organized
conflict (internal) rose in 2008, reflecting an
upsurge in political violence surrounding the
presidential election on 29th March. The score
for relations with neighbouring countries also
rose, in line with mounting criticism, notably
from the leaders of Botswana and Zambia. In
November 2008, Botswana foreign minister,
Phandu Skelemani, called for all countries
bordering Zimbabwe to close their borders
with the country, to ‘bring down Robert
Mugabe’s government’.

Most measures of safety and security in
society are predictably high, and scores for the
likelihood of violent demonstrations and the
level of violent crime rose slightly, while more
marked hikes occurred in the indicators for
political instability, perceptions of criminality
and the potential for terrorist acts. Rises also
occurred in two of Zimbabwe’s measures
of militarization: military expenditure as a
percentage of GDP (which rose to 9.3%, the
highest level of any African country) and ease
of access to small arms and light weapons.
All of this contributed to a considerable
deterioration in the country’s state of peace,
bringing about a fall of ten positions in the
2009 GPI to a rank of 134th place.


                                                   Page 30
THE ToP FIVE RISERS IN THE 2009 GPI


Bosnia and Herzegovina                                Angola
Change in rank: +23                                   Change in rank: +16
Overall rank: 50                                      Overall rank: 100

Bosnia’s rise to 50th position in the 2009            Angola’s impressive rise to 100th position in
GPI follows an impressive rise last year,             the 2009 GPI is owing to improvements in
which mainly reflected improvements in the            the scores of seven indicators, five of which
scores for measures of safety and security in         relate to safety and security in society: an
society. This year, a notable fall in the number      increasingly stable political scene, a lower
of displaced people as a proportion of the            chance of violent demonstrations, less violent
population (as recorded by the UNHCR)                 crime, a reduction in the number of displaced
was a key factor – around one million people          people and an improvement in the level of
have returned to Bosnia and Herzegovina               respect for human rights. Much-delayed
since the end of the war in December 1995,            legislative elections held in September 2008
a three-and-a-half-year conflict that resulted        resulted in a resounding victory for the ruling
in some 200,000 deaths and displaced an               Movimento Popular de Libertação de Angola
estimated 2.2 million people, almost one-half         (MPLA). Notwithstanding complaints about
of the country’s population. The number               the fairness and conduct of the poll, the
of police officers per head of population             impressive turnout – estimated at 87% – has
also fell compared with last year, amid the           given the government the strong democratic
gradual restructuring of the separate Serb and        mandate that it lacked. The MPLA now holds
Muslim-Croat police forces. In April 2008             191 out of 220 seats in the National Assembly,
parliament approved long-debated reforms              giving it the two-thirds majority needed to
to ostensibly centralise the two police forces,       push through changes to the constitution. As
which cleared the way for the signing of a            a result, the former rebel movement, União
stabilisation and association agreement (SAA)         Nacional para a Independência Total de
with the EU in June. Bosnia’s homicide rate,          Angola (UNITA), has lost what little power it
the number of deaths resulting from internal          had in government and is in danger of losing
conflict and the country’s military expenditure       all relevance as an opposition party.
as a percentage of GDP all dropped compared           The formal ending of a long-running conflict
with their scores in the 2008 GPI. An even            in the oil-rich enclave of Cabinda (fewer than
more significant rise in the rankings was             25 battle-related deaths in the year following
curtailed, however, by rises in the scores for        a peace agreement between the government
the likelihood of violent demonstrations and          and one faction of the Frente para a
terrorist acts, the former linked to heightened       Libertação do Enclave de Cabinda (FLEC) in
political tension surrounding local elections in      July 2006) also contributes to Angola’s rise
october and a slowing economy.                        in the GPI rankings. By 2008 80-90% of the
                                                      former FLEC fighters had been demobilized
                                                      or joined the army, although sporadic attacks
                                                      on government forces by the FLEC-FAC
                                                      faction were recorded during the year.


                                                 Page 31
THE ToP FIVE RISERS IN THE 2009 GPI


Congo (Brazzaville)                                    Egypt
Change in rank: +15                                    Change in rank: +13
Overall rank: 106                                      Overall rank: 54

The 14-point rise of Congo (Brazzaville)               Egypt’s rise reflects an improvement in three
in the GPI rankings is chiefly the result              indicators measuring safety and security in
of improvements in the country’s scores                society: growing political stability, greater
registering the level of internal conflict             levels of trust between citizens and a fall in
and the level of perceived criminality.                the extent of political terror (suggesting an
This reflected a year in which a fragile               improvement in the human rights situation),
peace between so-called Ninja rebels and               albeit from a very high level (4 in Dalton
government security forces held firm – there           and Gibney’s Political Terror Scale) last year.
were no reported clashes in the rebel’s                The improved score for political stability
stronghold of Pool (a southern region                  reflects the continuing rule of the national
between the capital, Brazzaville, and the              Democratic Party (NDP), which was returned
port city of Pointe Noire) or elsewhere. The           with a reduced, but still substantial, majority
rebels fought a violent insurgency against             in the December 2005 general election. The
Congo’s government in the late 1990s                   secular opposition has been largely ineffective
which killed thousands, displaced around               in pressing for greater political plurality, while
90,000 and devastated much of the region’s             the Muslim Brotherhood’s quest for power
infrastructure. Although a peace deal was              has been quashed by the arrests of activists
signed in 2003 sporadic violence has since             and leaders and amendments to Egypt’s
plagued the Pool region, with rebels robbing           constitution that prohibit political parties
civilians and hijacking trains to the oil-rich         based on religion, gender or ethnicity.
coast. In 2007 the former rebel leader, Pasteur        Beset by allegations of cronyism and
Ntoumi, renounced violence and created                 incompetence, the NDP has recently been
his own political party, Conseil national des          overhauled by the president’s son, Gamal
républicains (CNRe). Although it has some              Mubarak, who has attempted to introduce
support in certain areas of the Pool region,           greater discipline and coherence, as well as
it has so far failed to obtain strong political        bringing younger, more in-touch figures to
representation. Despite the fragile peace              prominence at a local level. The improvement
and Congo’s rise in the rankings, several              in the score for greater trust between citizens
measures of safety and security in society are         partly reflects a fall in tensions surrounding
accorded high scores, with violent crime and           attacks by militant Islamists – no attacks
the homicide rate remaining at level 4 and             have taken place since those at Dahab in
contributing to the country’s overall standing         Sinai in April 2006 that resulted in 20 deaths.
of 106th position.                                     The government has attributed the waves of
                                                       attacks that took place in 2004-06 to “terror
                                                       cells” of disaffected local Bedouin from
                                                       North Sinai, which have crossborder links to
                                                       Palestinian groups in Gaza.


                                                  Page 32
Trinidad and Tobago
Change in rank: +11
Overall rank: 87

Drops in the scores of four of Trinidad and
Tobago’s measures of safety and security in
society are behind the country’s 11-point rise in
the GPI rankings. Politics is adjudged to have
become more stable during 2008 following
the general election in November 2007, which
observers considered generally free and fair
and which resulted in an increased majority for
the People’s National Movement (PNM). The
party, led by Patrick Manning, picked up 26
seats in a newly expanded 41-seat parliament,
although it fell short of the two-thirds majority
needed to push through all of Mr Manning’s
proposed constitutional changes unopposed.
The indicator measuring the likelihood of
violent demonstrations registered a fall in
2008, reflecting a year that was largely free of
demonstrations, in contrast to 2007, when,
in January, there were a series of protests at
soaring crime rates and a two-day national
shutdown. The demonstrations were sparked
by the kidnapping of the country’s highest
profile businesswoman, Vindra Naipul-
Coolman.

Trinidad and Tobago’s jailed population fell
in 2008 and respect for human rights rose,
according to Dalton and Gibney’s Political
terror scale – with the score falling from 3 to
2. Nevertheless, violent crime continued to be
the leading political issue in 2008. The murder
rate reached an all-time annual high of 527
in mid-December, almost 50% higher than
a year earlier. The number of robberies and
kidnappings also rose. This has not been picked
up in the GPI as Trinidad’s scores for violent
crime and the homicide rate were already at 5,
the highest possible level, contributing to the
country’s overall low ranking of 87th.
                                                   Page 33
T H E T o P F I V E FA L L E R S I N T H E 2 0 0 9 G P I


Madagascar                                              Latvia
Change in rank: -30                                     Change in rank: -16
Overall rank: 72                                        Overall rank: 54

Madagascar’s dramatic fall of 30 places                 Rising political instability in late 2008
from its position as the second-highest                 and an increase in the measure of internal
ranked African nation in last year’s GPI                conflict were the key factors behind Latvia’s
comes amid a two-point rise in the measure              substantial fall in the GPI rankings this

of internal conflict and increased political            year. The four-party centre-right coalition

instability following several weeks of violent          government led by the prime minister, Ivars
                                                        Godmanis, since December 2007 struggled
protests and the deaths. Political tensions
                                                        to cope with the fallout of an unprecedented
had been mounting between the president,
                                                        nosedive in the country’s economy, triggered
Marc Ravalomanana, and the opposition
                                                        by the international banking crisis of
mayor of the capital, Antananarivo, Andry
                                                        September 2008. The credit crunch hit Latvia
Rajoelina, since the mayor rapidly emerged
                                                        particularly hard, owing to the country’s
as a political force after his surprise election
                                                        large external imbalances coupled with
in 2007. The government’s attempts to
                                                        its currency peg to the euro, which forced
undermine Rajoelina’s control of the capital,           the government to turn to the IMF and a
which included blocking the disbursal of                consortium of European countries for a loan
funds and closing the mayor’s radio and TV              to cover its ballooning current-account deficit
station, Viva TV, triggered mass protests.              and underpin the currency. A large protest
These became increasingly violent after                 against the government in the capital, Riga, in
government guards opened fire on a crowd                mid-January 2009 spilled over into the most
of protesters outside the presidential palace,          serious rioting in Latvia since independence.
killing 28 people. The president was forced             The beleaguered government was eventually
to step down on 17th March and Rajoelina                forced to resign in late February 2009 after
assumed power with military backing, amid               two coalition partners withdrew their support
widespread international condemnation.                  for Mr Godmanis.

Most of Madagascar’s measures of
militarization continued to receive very low
scores in the 2009 GPI (unchanged from
last year) although military expenditure as a
proportion of GDP rose slightly to 1.1%.


                                                   Page 34
Mexico                                                     South Africa
Change in rank: -16                                        Change in rank: -15
Overall rank: 108                                          Overall rank: 123

Mexico’s slide in the rankings to 108th position           Waves of violence that swept through South
reflects deterioration in six measures of safety           Africa’s Gauteng townships in May 2008
and security in society since last year, including         left at least 42 people dead, more than
a one-point hike in the score for violent crime            200 injured and around 15,000 homeless.
and smaller rises in the potential for terrorist           Destitute Zimbabweans and other immigrants
acts, violent demonstrations and in perceived              (who are thought to number around one
criminality. This follows an escalation in violence        million in Gauteng and more than three
linked to Mexican drug cartels, notably in and             million nationwide) were targeted by violent
around the cities of Tijuana, Culiacan and Cuidad          mobs – blamed for taking advantage of
Juarez. Mexican officials say 6,290 people were            already scarce housing, jobs and public
killed in the violence in 2008, a significant year-        services and for contributing to rising crime
on-year rise. Drug gangsters and security forces           and insecurity. The escalation in violence
clashed on an almost daily basis. In May, three            has damaged South Africa’s post-apartheid
of Mexico’s top anti-crime investigators were              reputation for tolerance and openness. In the
assassinated and several high ranking security             GPI, this is reflected in rises in two indicators:
officers resigned and fled to the US. In late              a two-point climb in the measure of the
August almost 500,000 people protested against             level of internal conflict and an increase in
drug-related violence in Mexico City, which                perceived criminality (to 4 on a scale of 1-5).
was followed by the president, Felipe Calderón,            The homicide rate and the level of violent
announcing a budget increase of almost 40% in              crime are both accorded the highest possible
security and justice expenditure for next year. The        scores, unchanged from last year, although
proportion of the population in jail rose in 2008.         they are counterbalanced by relatively low

The ongoing drug-related violence (which has               scores for measures of militarization, with

been on the rise since the mid-1990s, catalyzed            the exception of military capability and

by a traumatic economic crisis and exacerbated             sophistication.

by pervasive corruption and criminality in law-
enforcement institutions) was probably a factor
in the deterioration in the GPI indicator charting
political instability. The other likely culprit is
Mexico’s economy, which slumped in late 2008,
leading to the loss of 386,000 formal-sector jobs
in November and December alone, according
to the Ministry of Labour. Mr Calderón and
his minister of finance, Agustín Carstens, have
been facing mounting criticism from the main
opposition parties, which accuse the government
of failing to provide an adequate response to rising
unemployment.
                                                      Page 35
T H E T o P F I V E FA L L E R S I N T H E 2 0 0 9 G P I


Yemen                                                16 people. Kidnappings also increased during
Change in rank: -13                                  2008 and in early 2009. Yemen’s relations
Overall rank: 119                                    with neighbouring countries remain fairly
                                                     tense – the score stays at 3 this year. This is
Five of Yemen’s measures of safety and
                                                     underlined by the fact that Yemen’s security
security in society deteriorated in 2008,
                                                     problems are not entirely home-grown. The
contributing to a 13-place fall in the
                                                     Israeli blockade of and subsequent assault on
GPI rankings to a lowly 119th position.
                                                     the Gaza Strip has resulted in mass protests
A heightened level of violent crime, an
                                                     in support of the Palestinians. Yemen’s
increased likelihood of terrorist attacks and
                                                     proximity to Somalia has also added to the
violent demonstrations, growing perceptions
                                                     security problems confronting the authorities,
of criminality in society and dwindling respect
                                                     not least through the smuggling of weapons
for human rights reflects an escalation in
                                                     to and from the war-torn state. The GPI
three broad conflicts across the country:
                                                     measure of the ease of access to weapons
The decade-long contretemps between the
                                                     of minor destruction remains at the highest
Believing Youth Movement of Shia rebels
                                                     possible level in 2008. Given that the two-
led by the al-Houthi clan in northern
                                                     way traffic is marine-based, it comes as little
Saada governorate and the government; an
                                                     surprise that Yemenis are also suspected of
ongoing rebellion of several al-Qaida-linked
                                                     being involved in the increase in piracy in the
groups over the orientation of the political
                                                     Gulf of Aden. Yemen’s military spending as
system; and secessionist rebellions among
                                                     a percentage of GDP remains high at 2.5%
southern tribesmen resentful of the northern-
                                                     (unchanged from last year); in common with
dominated regime.
                                                     most other Middle Eastern nations, but most
Militant activity by Islamist guerrillas is
                                                     other measures of militarization receive fairly
linked to the return to Yemen of men who
                                                     low scores.
had been recruited to fight against Soviet
occupation in Afghanistan. It is widely alleged
that an agreement between the government
and al-Qaida in Yemen (AQY) – in which
the group agreed to conduct its operations
outside the country, in return for immunity
inside Yemen – caused a lull in militant
activity, but this broke down in mid-2007,
apparently when a younger cadre of militants
took over the leadership of the group.
Subsequently, a spate of attacks has occurred,
mainly on Western targets. In January three
people were killed in an attack on a tourist
convoy and the Italian and US embassies were
both the targets of bombers – an attack on
the latter by Islamic Jihad in September killed


                                                Page 36
I N V E S T I G AT I N G T H E S E T o F P o T E N T I A L D E T E R M I N A N T S


The GPI is a numerical measure of how
at peace a country is with itself and other
countries. It is a foundation on which to
establish a measure of the incidence of peace.
However, it cannot on its own explain why
these absences occur and whether groups of
countries exhibit sufficient similar deficiencies
resulting in an absence of peace.

In addition to the collation of data and
scores for the 23 indicators listed on page
9 (Table 1), the Economist Intelligence
Unit has updated for the third year its
secondary dataset of 33 drivers including
democracy, government competence and
efficacy; the strength of institutions and the
political process; international openness;
demographics; regional integration; religion
and culture; education and material well-
being. Full descriptions for each of these
indicators are provided in Annex B.

The list of potential drivers is by no means
exhaustive; it comprises indicators with data
that are both available across the countries
from credible sources and are comparable
and consistent in their measurement. Table 4
lists each of the indicators in the two groups,
the GPI and the pool of potential drivers.
Correlation coefficients of the GPI scores and
ranks and then the scores for the internal and
external measures of peace are given against
each indicator. The correlation coefficients
are calculated across the full 144 countries.
Values shaded in green are for values where
r >0.5 and r <-0.5, generally considered a
valid correlation.


                                                 Page 37
I N V E S T I G AT I N G T H E S E T o F P o T E N T I A L D E T E R M I N A N T S

                                                                              oVERALL   oVERALL   Internal   External
                                                                               SCoRE     RANK      Peace      Peace
oVERALL SCoRE                                                                   1.00      0.96     0.97       0.62
oVERALL RANK                                                                    0.96      1.00     0.95       0.53
Internal Peace                                                                  0.97      0.95     1.00       0.40
External Peace                                                                  0.62      0.53     0.40       1.00
Level of distrust in other citizens                                             0.75      0.73     0.76       0.36
Number of internal security officers and police per 100,000 people              0.05      0.06     0.07       -0.03
Number of homicides per 100,000 people                                          0.62      0.62     0.70       0.04
Number of jailed population per 100,000 people                                  0.11      0.13     0.06       0.20
Ease of access to weapons of minor destruction                                  0.73      0.73     0.78       0.22
Level of organized conflict (internal)                                          0.83      0.81     0.82       0.46
Likelihood of violent demonstrations                                            0.67      0.69     0.74       0.13
Level of violent crime                                                          0.65      0.68     0.75       0.01
Political instability                                                           0.77      0.78     0.78       0.36
Respect for human rights                                                        0.85      0.84     0.84       0.46
Volume of transfers of major conventional weapons, as recipient (Imports)      -0.07     -0.12     -0.14      0.19
per 100,000 people
Potential for terrorist acts                                                    0.63      0.58     0.59       0.44
Number of deaths from organized conflict (internal)                             0.72      0.60     0.66       0.55
Military expenditure as a percentage of GDP                                     0.35      0.28     0.24       0.53
Number of armed services personnel per 100,000 people                           0.25      0.18     0.12       0.51
UN Funding                                                                      0.33      0.31     0.31       0.23
Aggregate number of heavy weapons per 100,000 people                            0.14      0.09     0.02       0.45
Volume of transfers of major conventional weapons as supplier (exports) per    -0.06     -0.10     -0.16      0.28
100,000 people
Military	capability/sophistication                                             -0.08     -0.10     -0.22      0.40
Number of displaced people as a percentage of the population                    0.26      0.14     0.23       0.22
Relations with neighbouring countries                                           0.73      0.69     0.63       0.71
Number of external and internal conflicts fought                                0.28      0.25     0.13       0.61
Estimated number of deaths from organized conflict (external)                   0.15      0.14     0.02       0.48
Political Democracy Index                                                      -0.56     -0.57     -0.57      -0.27
Electoral process                                                              -0.38     -0.39     -0.38      -0.20
Functioning of government                                                      -0.65     -0.65     -0.66      -0.32
Political participation                                                        -0.46     -0.49     -0.48      -0.17
Political culture                                                              -0.64     -0.65     -0.68      -0.21
Civil liberties                                                                -0.50     -0.50     -0.48      -0.32
Corruption perceptions (CPI score: 10 = highly clean, 0 = highly corrupt)      -0.71     -0.78     -0.77      -0.19
Women in parliament (as a percentage of the total number of representatives    -0.30     -0.32     -0.31      -0.14
in the lower house)
Freedom of the press                                                            0.50      0.51     0.49       0.29
Exports + Imports % of GDP                                                     -0.12     -0.14     -0.11      -0.08
Foreign Direct Investment (flow) % of GDP                                      -0.19     -0.20     -0.17      -0.17
Number of visitors as % of domestic population                                 -0.42     -0.45     -0.44      -0.16
Net Migration (% of total population)                                          -0.24     -0.32     -0.28      -0.02
15-34 year old males as a % of total population                                 0.39      0.46     0.44       0.05
Gender	ratio	of	population:	women/men                                          -0.07     -0.08     -0.06      -0.07
Gender Inequality                                                              -0.43     -0.44     -0.44      -0.17
The extent of regional integration                                              0.64      0.64     0.64       0.35
Current education spending (% of GDP)                                          -0.29     -0.28     -0.30      -0.10
Primary school enrolment ratio (% Net)                                         -0.51     -0.44     -0.53      -0.18
Secondary school enrolment ratio (% Net)                                       -0.52     -0.53     -0.59      -0.05
Higher education enrolment (% Gross)                                           -0.49     -0.54     -0.57      -0.02
Mean years of schooling                                                        -0.61     -0.62     -0.65      -0.19
Adult literacy rate (% of pop over 15)                                         -0.50     -0.47     -0.52      -0.18
Hostility	to	foreigners/private	property                                        0.63      0.61     0.66       0.25
Importance of religion in national life                                         0.47      0.48     0.48       0.20
Willingness to fight                                                            0.37      0.37     0.29       0.41
Nominal GDP (US$PPPbn)                                                         -0.06     -0.05     -0.12      0.16
Nominal GDP (US$bn)                                                            -0.11     -0.11     -0.17      0.14
GDP per capita                                                                 -0.58     -0.64     -0.63      -0.15
Gini Index                                                                      0.39      0.43     0.48       -0.07
Unemployment %                                                                  0.24      0.21     0.26       0.07
Life expectancy                                                                -0.54     -0.55     -0.60      -0.10
Infant mortality per 1,000 live births                                          0.54      0.53     0.57       0.17

Table 4
                                                                Page 38
With reference to changes since last year and
the year before, the extension of the data
to 144 countries has largely verified and
endorsed our initial findings from 2007 and
2008. Those series with high correlations
to the GPI in previous years, measured
against the 144 countries maintain their
significance	threshold	of	+/-	0.5	hinting	at	a	
constant relationship over time between these
indicators and the GPI.

of the listed variables, the overall index
continues to be strongly determined by the
internal measure of peace with r = 0.97. of
the set of potential drivers, the composite
measure of political democracy remains
significant at r=-0.56, slightly less than
last year. Unsurprisingly a number of that
index’s sub-components calculate as having a
reasonable correlation with the overall scores
and rankings. Functioning of government
– a qualitative assessment of whether freely
elected representatives determine government
policy and whether there is an effective
system of checks and balances on the exercise
of government authority – almost maintains
its correlation at r=-0.65. Electoral process
and political participation remain just below
+/-0.5.	Interestingly	the	external	peace	
measure is not significantly correlated to any
of our measures relating to democracy. our
measure of the freedom of the press, compiled
by Reporters Without Borders dips slightly
back	below	our	+/-0.5	threshold,	although	
exceeds it at 0.51 when measured against the
rankings rather than the GPI scores.

For all the following charts, the GPI score is
shown on the left-hand axis.


                                                  Page 39
I N V E S T I G AT I N G T H E S E T o F P o T E N T I A L D E T E R M I N A N T S


                                                   Political Democracy Index against OVE R AL L S C OR E


         1.0             2.0                3.0              4.0                 5.0                   6.0                7.0              8.0               9.0             10.0     11.0
  1.00

                                                                                                                                                            New Zealand ay
                                                                                                                                                                     Denmark
                                                                                                                                                                        Norw
                                                                                                                                                                        Iceland
                                                                                                                                                Japanustria
                                                                                                                                                    A                       Sw eden
                                                                                                                                         Slovenia             Canada
                                                                                                                                                                 Finland
                                                                                                                                         Czech Republic Luxembourg
                                                                                                                                                            Ireland
                                                                                                                                           Portugal
                                                                                                                                               Belgium
                                        Qatar                                                                                                          Germany
                                                                                                                                                            Sw itzerland

                                                                                                                                 Chile               A ustralia
                                         Oman                                                   Singapore            Slovakia                              Netherlands
  1.50                                                                                                  Malaysia                  UruguaySpain
                                                                                                                RomaniaHungary France
                                                                                                                       Poland Costa Rica
                                                                                                                               South Korea
                                                                                                                      BotswEstonia an Kingdom
                                                                                                                             ana Italy
                           UnitedV ietnam
                                  A rab Emirates Kuw ait         Bhutan                                                       Taiw
                                                                                                                                United
                          Laos            Tunisia                                                                    Lithuania
                        Libya                                               Malaw i
                                                                                                                Croatia     Cyprus
                                             Gabon         Egypt              Bosnia and Hercegovina
                                                                                 Mozambique
                                                                                 Ghana                           Bulgaria
                                                                                                                    Latvia
                                                                               Zambia
                                                                              Tanzania Nicaragua                     Panama         Greece
                    Equatorial Guinea                     Morocco
                                                           Jordan                                    Namibia
                                                                                                       A rgentina
                                                     Cuba                                        Indonesia
                                                  Bahrain                                Dominican Republic
                                            China Burkina FasoNepal
                                                                                  Madagascar Paraguay
                                                                                          A lbania Moldova
                                                                                 Senegal           PeruSerbia
                                                                                               Bolivia          UkraineBrazil
                                                Kazakhstan
                                                       Rw anda                                                              United States of A merica
                            Syria                                                 Bangladesh Papua Mongolia
                                                                                              Macedonia Trinidad and Tobago
                                                                                                    Montenegro
  2.00                                            Cameroon                                             New Guinea
                                                                                           Mali El Salvador
               Turkmenistan              Iran Belarus
                                         A ngola                                              Guyana               Jamaica
                                                                           Uganda
                  Saudi A rabia                                         Cambodia
                Uzbekistan        Congo (Brazzaville)
                                                A lgeria                                   Guatemala Mexico
                                                                                     Ecuador
                                                                        Kenya                 Honduras
                                          A zerbaijan
                                           Cote d' Ivoire       Haiti                          Philippines
                                        Y emen                                                                   Thailand
                                                                                   V enezuela
                                                                                          Turkey
                                                                                                                                     India
                                                                                                                                   South A frica
                                                                                Mauritania                    Sri Lanka
                  Myanmar
                                                                     Burundi
                                                                     Ethiopia
  2.50
                                                   Nigeria
                                                                                                             Colombia

    Central A frican Republic                                           Georgia              Lebanon
                                Zimbabw e                               Russia


                Chad                                                Pakistan
               Democratic Republic of the Congo
                                       Sudan


                                                                                                                                Israel
  3.00


     Somalia
                                    A fghanistan
                                                             Iraq


  3.50


Figure 1: Democracy and overall GPI score


                                                                                             Page 40
F unctioning of government against OVE R AL L S C OR E


          1.0           2.0                3.0                  4.0              5.0               6.0              7.0                8.0               9.0         10.0      11.0
   1.00

                                                                                                                                                New Zealand Denmark
                                                                                                                                                              Norw ay
                                                                                                                                                               Iceland
                                                                                                                                A ustria                             Sw eden
                                                                                                                                        Japan
                                                                                                                 Czech Republic Slovenia                      Canada Finland
                                                                                                                                       Portugal    Ireland
                                                                                                                                                       Luxembourg
                                                                                                                                       Belgium
                                                       Qatar                                                                                 Germany Sw itzerland

                                                                                                                                                      A ustralia
                                                                                                                                                        Chile
                                                       Oman                                                          Slovakia
                                                                                                                          Singapore                 Netherlands
   1.50                                                                                          Malaysia
                                                                                                 RomaniaHungary
                                                                                                         Poland             France  SpainUruguay
                                                                                                                                       Costa Rica
                                                                                                                         South Korea
                                                                                                                          Botsw an
                                                  United A rab Emirates
                                                                V ietnam     Bhutan                       Italy             Taiw ana
                                                                                                                            Estonia         United Kingdom
                                      Tunisia Laos               Kuw ait                 Lithuania
                          Libya                                              Malaw i
                                                                                                  Cyprus
                                                                                                  Croatia
                          Gabon Bosnia and Hercegovina
                                              Egypt                    Ghana           Mozambique
                                                                                          Bulgaria
                                                                                            Latvia
                                                        Tanzania       Zambia                                         PanamaGreece
                                 Equatorial Guinea       MoroccoNicaragua
                                             Jordan                                 Namibia
                                                                         Cuba rgentina
                                                                            A                                 Indonesia
                                                   Bahrain       Dominican Republic
                Burkina Faso                                                  China Madagascar  Paraguay
                                                                Moldova
                                                                  Nepal       A lbania
                                                                                     Serbia
                                                                  Peru       Senegal       Bolivia
                       Kazakhstan                  Rw anda Macedonia                       Ukraine                       United States of A merica
                                                                                                                                    Brazil
                          Syria                                             BangladeshMontenegro Trinidad and Tobago
                                                                                                 Mongolia
   2.00                                                        Cameroon                      Mali
                                                                                          Guyana
                                                                                                  Papua New Guinea
                                                                                        El Salvador
                                     Belarus ngola
                                       Iran A                                                                   Jamaica
                                                         Uganda
                                   Saudi A rabia                                                Cambodia
                                Congo (Brazzaville)
                          A lgeria                              Ecuador                                               Mexico
                                                                                                              Guatemala
                                                                 Kenya                          Honduras

                                   Cote d' Ivoire       Haiti                 Philippines
                                Y emen                                                                        Thailand
                                                                 V enezuela                       Turkey
                                                                                                                                           India
                                                                                                                               South A f rica
                                                                             Mauritania
                                                                       Sri Lanka
                  Myanmar
                                              Burundi
                                                           Ethiopia
   2.50
                                             Nigeria
                                                                                       Colombia

     Central A f rican Republic North Korea Lebanon
                                         Russia

                                                                                            Pakistan
                                Sudan

                                                                                                                             Israel
   3.00


      Somalia


   3.50


Figure 2: Functioning of government and overall GPI score


The indicators for international openness still exhibit no significant correlations despite the
expansion of the group of countries under review although the correlation coefficient as
measured against the number of tourists as a percentage of the total domestic population to the
GPI rankings is getting closer at r = -0.45. our demographic indicators also show no significance
at our set thresholds, but the number of males aged 15-34 as a percentage of the population has
a relatively high correlation to the Global Peace Index rankings at r = 0.46.


                                                                                             Page 41
I N V E S T I G AT I N G T H E S E T o F P o T E N T I A L D E T E R M I N A N T S


                       C orruption perceptions (C PI score: 10 = highly clean, 0 = highly corrupt) against OVE R AL L
                                                                    S C OR E

          1.0                2.0                    3.0                4.0                5.0                  6.0                  7.0                   8.0                9.0            10.0
   1.00

                                                                                                                                                      Norw ay               New Zealand
                                                                                                                                                                       IcelandDenmark
                                                                                                                                          Japan           A ustria            Sw eden
                                                                                                                           Slovenia                                 Canada
                                                                                        Czech Republic         Portugal                             Ireland Luxembourg Finland
                                                                                                                                          Belgium
                                                                                                                          Qatar                       Germany            Sw itzerland

                                                                                                                                  Chile                              A ustralia
                                                                                                        Oman                                                           Netherlands
                                                                                                                                                                                Singapore
                                                                                             Slovakia
   1.50                                                           Romania
                                                                                               Malaysia
                                                                                             Costa Rica
                                                                                               Hungary
                                                                                                                                 Uruguay
                                                                                                                          Spain France
                                                                                     Poland
                                                                                                       SouthBotsw ana
                                                                                                             Korea
                                          V ietnam                                        Italy Bhutan United A an Emirates Estonia
                                                                                                           Taiw rab                           United Kingdom
                                                                              Kuw ait
                                                                                    Lithuania
                                                                                 Tunisia
                            Laos         Libya
                                             Malaw i
                                                                                 Croatia                               Cyprus
                                     MozambiqueGabon Bulgaria
                                           Bosnia and Hercegovina
                                              Egypt
                                             Zambia                    Ghana           Greece Latvia
                Equatorial Guinea Nicaragua Tanzania Morocco
                                                          Panama
                                      Indonesia
                                              A rgentina                          Namibia       Jordan
                                                                                Cuba
                                          Dominican Republic                                          Bahrain
                                  Paraguay Moldova Burkina Faso
                                                       Madagascar
                                                                China
                                                           A lbania
                                           Nepal           Serbia
                                                  Bolivia SenegalPeru
                                     Ukraine Rw anda Brazil
                             Kazakhstan                                                                                         United States of A merica
                    PapuaBangladesh
                               Syria             Mongolia Macedonia
                                                       Trinidad and Tobago
                                                        Montenegro
   2.00                     NewCameroon
                                 Guinea
                                       Guyana Jamaica Mali
                                                                    El Salvador
                   Turkmenistan Iran
                         A Belarus
                           ngola
                                        Uganda
                     Cambodia                             Saudi A rabia
                  Congo (Brazzaville)
                    Uzbekistan
                           Ecuador                Guatemala Mexico
                                                      A lgeria
                              Kenya Honduras
                 Haiti A zerbaijan
                        Cote d' Philippines
                                Ivoire
                                  Y emen                  Thailand
                       V enezuela                                                Turkey
                                                          India                    South A f rica
                                           Mauritania Lanka
                                                   Sri
            Myanmar
                          Burundi
                                        Ethiopia
   2.50                                   Nigeria
                                                                  Colombia
            North Central A f rican Republic
                  Korea                        Lebanon
                     Zimbabw e  Russia                             Georgia


                                   Pakistan
                  Chad
      Democratic Republic of the Congo
                  Sudan

                                                                                                              Israel
   3.00


      Somalia
             A f ghanistan
                Iraq


   3.50


Figure 3: Corruption and overall GPI peace score


The measure of corruption within a society from Transparency International continues to
have a strong correlation with the overall GPI index (the highest in fact) and the internal
peace index scores, despite the annual updates to both. Indeed, this correlation experiences an
improvement in significance compared with last year.


                                                                                             Page 42
Gender Inequality against OVE R AL L S C OR E

          0.4   0.5         0.5         0.6                  0.6                  0.7                    0.7                  0.8               0.8            0.9
   1.00

                                                                                                                                 New Zealand
                                                                                                                              Denmark     Iceland Norw ay
                                                                                Japan                    A ustria                                    Sw eden
                                                                                            Slovenia
                                                                                     Czech Republic       Canada                                  Finland
                                                                                        Luxembourg
                                                                                                 Portugal Belgium           Ireland
                                                               Qatar                         Sw itzerland                       Germany

                                                                                  Chile                          A ustralia
                                                        Oman                         Singapore                        Netherlands
   1.50                                                                               Uruguay
                                                                              Malaysia Hungary Costa Rica
                                                                                                France
                                                                                                 Romania                    Spain
                                                                                              Poland
                                                                                   Italy      Botsw anaEstonia         United Kingdom
                                                            United A rab Emirates ait
                                                                             Kuw                   V ietnam
                                                                         Tunisia Malaw i                          Lithuania
                                                                                   Cyprus                         Croatia
                                                    Egypt                                    Ghana
                                                                                                Mozambique  Bulgaria Latvia
                                                                         Zambia          Greece       Panama
                                                                                                      Tanzania
                                             Morocco                          Nicaragua
                                                                     Jordan                               Namibia
                                                                                                       A rgentinaCuba
                                                                                  Indonesia
                                                        Bahrain                     Dominican Republic
                                                    Burkina Faso             Madagascar lbania
                                                                                        Paraguay
                                                                                          China
                                                                                          A                    Moldova
                                           Nepal
                                                                                         Peru
                                                                                      Bolivia
                                                                                              United Kazakhstanmerica
                                                                                         BrazilUkraineStates of A
                                                                        Bangladesh
                                                                       Syria              Trinidad and Tobago
                                                                                            Mongolia Macedonia
   2.00                                               Cameroon                                 El Salvador
                                                         IranAMali
                                                               ngola                                JamaicaBelarus
                                                                                                 Uganda
                                          Saudi A rabia                   Cambodia
                                                              AGuatemala Mexico
                                                                 lgeria                            Uzbekistan
                                                                                                  Ecuador
                                                                                    Honduras
                                                                                 Kenya
                                                                                           A zerbaijan                          Philippines
                Y emen                                                                        Thailand
                                                  Turkey                                   V enezuela
                                                           India                                           South A f rica
                                                           Mauritania                                         Sri Lanka

   2.50                                                    Ethiopia
                                                                 Nigeria
                                                                                                         Colombia

                                                                             Zimbabw Georgia Russia
                                                                                     e


                                       Pakistan
                                    Chad


                                                                                                     Israel
   3.00


   3.50


Figure 4: Gender Inequality and overall GPI score


A measure of gender inequality, the Gender Gap Index (calculated by the World Economic
Forum) continues to miss out on our measure of significance with a r = -0.43, although it has
increased from last year.


                                                                   Page 43
I N V E S T I G AT I N G T H E S E T o F P o T E N T I A L D E T E R M I N A N T S


                            T he extent of regional integration against OVE R AL L S C OR E

          0.0   0.5        1.0          1.5              2.0              2.5           3.0              3.5              4.0                 4.5       5.0
   1.00

                         Denmark
                         Norw ay                                                   New Zealand
                                                       Iceland
                         Swustria
                          A eden
                                                                                       Japan
                         Slovenia
                          Finland
                      Czech Republic                   Canada
                          Ireland
                       Luxembourg
                         Portugal
                         Belgium
                        Germany                      Sw Qatar
                                                        itzerland

                                                        Chile                        A ustralia
                       Netherlands
                          Slovakia                     Oman                          Singapore
   1.50                   Hungary
                           France
                            Spain
                          Romania                    Costa Rica
                                                                                      Uruguay
                                                                                     Malaysia
                           Poland
                      United Italy
                              Kingdom                Botsw ana                       South Korea
                           Estonia                     Bhutan                   United V ietnam
                                                                                       A rab ait                        Taiw an
                          Lithuania                    Tunisia                          Kuw Emirates
                                                       Malaw i                           Laos                                                          Libya
                                                       Cyprus
                                                       Croatia
                         Bulgaria
                          Latvia              Bosnia and Hercegovina
                                                        Egypt                           Gabon
                                                                                     Mozambique                          Ghana
                         Greece                                                         Zambia
                                                                                       Tanzania
                                                                                       Panama
                                                     Nicaragua
                                                      Morocco                     Equatorial Guinea
                                                      Namibia                         A rgentina                         Jordan
                                                                                      Indonesia                           Cuba
                                                Dominican Republic                      Bahrain
                                                      A lbania                        Paraguay
                                                                                       Moldova
                                                                                         China                        Burkina Faso
                                                                                                                      Madagascar
                                                                                         Nepal
                                                                                        Serbia
                                                        Senegal                          Peru
                                                                                        Bolivia
                                              United States of A merica                 Ukraine
                                                      Macedonia
                                                     Montenegro                 TrinidadBrazilTobago
                                                                                     Kazakhstan
                                                                                       Rw anda
                                                                                       Mongolia
                                                                                          and
                                                                                     Bangladesh
                                                                                         Syria
   2.00                                               El Salvador
                                                          Mali
                                                                                 Papua New Guinea
                                                                                      Cameroon
                                                                                       Guyana
                                                                                       Jamaica                          A ngola
                                                                                                                        Belarus
                                                                                                                      Turkmenistan                      Iran
                                                                                        Uganda
                                                                                    Saudi A rabia
                                                                                      Cambodia
                                                       Mexico
                                                      Guatemala                 CongoEcuador
                                                                                        (Brazzaville)
                                                                                        A lgeria                                                    Uzbekistan
                                                      Honduras                          Kenya

                                                    Cote d' Ivoire                   A zerbaijan
                                                                                     Philippines
                                                                                         Haiti
                                                                                      Thailand                                                        Y emen
                                                                                     V enezuela         Turkey
                                                                                    South A f rica                        India
                                                                                      Sri Lanka                                                      Mauritania
                                                                                      Myanmar
                                                       Burundi
                                                                                                                        Ethiopia
   2.50
                                                       Nigeria
                                                                                                                        Colombia
                                                                                                                         Lebanon
                                                                                                                 CentralZimbabwRepublic
                                                                                                                        A f rican e                 North Korea
                                                       Russia                                                            Georgia


                                                                                                                       Pakistan
                                                                                                                         Chad
                                                                                                           Democratic Republic of the Congo
                                                                                                                        Sudan


                                                                                                                         Israel
   3.00


                                                                                                                                                      Somalia
                                                                                                                      A f ghanistan
                                                                                                                                                        Iraq


   3.50


Figure 5: Regional integration and overall GPI score


The extent of regional integration continues to have a significant correlation with the overall
index, but also with the internal measure. This is surprising, as the regional integration score
is a qualitative assessment of a country’s relations with its neighbours, and therefore an
external metric. To an extent this is explained by the high scores for regional integration in the
countries of the European Union and their generally high peace scores.


                                                                     Page 44
S econdary school enrolment ratio (% Net) against OVE R AL L S C OR E

          0.0                          20.0                          40.0                      60.0                         80.0                        100.0    120.0
   1.00

                                                                                                                                           New Zealand
                                                                                                                                         Iceland Norw ay
                                                                                                                                            Denmark
                                                                                                                                         A ustria      SwJapan
                                                                                                                                                          eden
                                                                                                                                            Slovenia Canada
                                                                                                                                                  Finland
                                                                                                                             PortugalCzech Republic
                                                                                                                                      Ireland
                                                                                                                             Luxembourg             Belgium
                                                               Germany                                                      Sw itzerlandQatar

                                                                                                                           Chile    A ustralia
                                                                                                   Singapore         Oman          Netherlands Slovakia
   1.50                                                                       Costa Rica
                                                                                                             Uruguay
                                                                                                             Malaysia
                                                                                                                            Romania       Hungary
                                                                                                                                                Poland France
                                                                                                                                                   Spain
                                                                                           Botsw ana                                    South Korea
                                                         Bhutan                                         V ietnam A rab Emirates
                                                                                                              United Kuw ait                Estonia an
                                                                                                                                               United Kingdom
                                                                                                                                                Taiw
                                                                                                                                                 Italy
                                                           Laos                                  Tunisia                                         Lithuania
                                         Malaw i                                                                                                         Libya
                                      Gabon                     Bosnia and Hercegovina                                             Croatia        Cyprus
                Mozambique                      Zambia      Ghana                                                                Egypt Latvia
                                                                                                                                         Bulgaria
                                                                                                                                            Greece
                             TanzaniaEquatorial Guinea Morocco Nicaragua                        Panama
                                                             Namibia                                                      Jordan
                                                                                      Indonesia                         A rgentina Cuba
                                                                           Dominican Republic                                                  Bahrain
                     Burkina Faso
                           Madagascar                               China Paraguay                             A lbania
                                                                                                                   Moldova
                                                          Nepal                                                         Serbia
                                 Senegal                                                                     Peru
                                                                                                              Bolivia
                       Rw anda                                                             Trinidad and Tobago          BrazilUnited States of A merica
                                                                                                                               Ukraine Kazakhstan
                                                                                                                            Macedonia
                                                                                                                                Mongolia
                                                              Bangladesh                                              Montenegro
   2.00                              Papua New Guinea
                                    Cameroon Mali                                El Salvador Syria
                                                                            Guyana                 A ngola              Iran
                                                                                                                    Turkmenistan
                                                                                                                        Jamaica          Belarus
                              Uganda
                                         Cambodia                                                       Saudi A rabia
                 Congo (Brazzaville)                    Guatemala                   Ecuador     Uzbekistan
                                                                                                    A lgeria
                                                                                                        Mexico
                                                  Honduras        Kenya
                                    Haiti
                                   Cote d' Ivoire                                            Philippines              A zerbaijan
                                                                Y emen                                        Thailand
                                                                                                  V enezuela
                                                                                                        Turkey
                                                                     India                    South A frica
                              Mauritania                          Sri Lanka
                                                                       Myanmar
                                                                          Burundi
   2.50                                Ethiopia
                                               Nigeria
                                                                                               Colombia

                 Central A frican Republic                                    North Korea                       Lebanon
                                                         Zimbabw e                                                   Georgia               Russia

                                                Pakistan
                         Chad
                            Democratic Republic of the Congo
                                  Sudan

                                                                                                                                         Israel
   3.00


          Somalia
                             A fghanistan
                                                                  Iraq


   3.50


Figure 6: Secondary school enrolments and overall GPI score


The education measures used in the index continue to have significant correlations with the
overall GPI. These are, however, likely to be strongly correlated with other measures such as
good governance and material well being.


                                                                                            Page 45
I N V E S T I G AT I N G T H E S E T o F P o T E N T I A L D E T E R M I N A N T S


                                              Mean years of schooling against OVE R AL L S C OR E

          0.0                       5.0                                  10.0                             15.0                      20.0          25.0
   1.00

                                                                                                                   Denmark ay New Zealand
                                                                                                                        Norw Iceland
                                                                                                         A ustria
                                                                                                       Japan eden
                                                                                                            Sw
                                                                                                                    Canada
                                                                                                   Czech Republic Slovenia
                                                                                                                      Finland
                                                                                            Luxembourg Portugal          Ireland
                                                                                                              Belgium
                                                                                                             Germany
                                                                                             Qatar Sw itzerland

                                                                                                Chile                                A ustralia
                                                                              Oman
                                                                      Singapore                      Slovakia Netherlands
   1.50                                                                     Costa RicaMalaysia           Uruguay
                                                                                              Romania HungaryFrance
                                                                                                                Spain
                                                                                                         Poland
                                                                               Botsw ana                        South Korea
                                                                   Bhutan A rab Emirates
                                                                    United
                                                                     V ietnam                  Taiw an United Kingdom
                                                                                                                  Italy
                                                                                                             Estonia
                                                                                     Kuw ait Tunisia        Lithuania
                                                           Laos i
                                                            Malaw                                                  Libya
                                       Gabon                         Bosnia and Hercegovina Croatia
                                                                                             Cyprus
                                                 Mozambique
                                             Zambia    Ghana                      Egypt Bulgaria           Latvia Greece
                                     Tanzania           Equatorial Guinea
                                                                    Nicaragua
                                                                Morocco                   Panama
                                                                     Namibia            Jordan
                                                                            Indonesia                   A rgentina
                                                                                                                Cuba
                                                                            Dominican Republic          Bahrain
                          Burkina Faso                  Madagascar              Paraguay
                                                                           ChinaMoldova
                                                          Nepal           A lbania
                                                                                        Serbia
                                         Senegal                                                Peru
                                                                                                  Bolivia
                                                      Rw anda                                     Ukraine
                                                                                                  United States of A merica
                                                                                                    Kazakhstan
                                                                  Trinidad and Tobago
                                                    Bangladesh Syria                   Mongolia Brazil
                                                                                 Macedonia
                                                                              Montenegro
   2.00                                Papua New Guinea
                                           Mali       Cameroon                El Salvador
                               A ngola                                       Jamaica Guyana Belarus
                                                                               Turkmenistan
                                                                                        Iran
                                                                 Uganda
                                                              Cambodia                    Saudi A rabia
                Congo (Brazzaville)                            GuatemalaUzbekistanA lgeria
                                                                                  Ecuador Mexico
                                                              Kenya Honduras
                 Haiti                        Cote d' Ivoire             A zerbaijan
                                                                                Philippines
                                                               Y emen                         Thailand
                                                                               Turkey V enezuela
                                                                         India           South A f rica
                                                       Mauritania Sri Lanka
                                                          Myanmar
                                                    Burundi
                                                 Ethiopia
   2.50
                                                           Nigeria
                                                                                      Colombia
                                         North Korea
                         Central A f rican Republic                                      Lebanon
                                                                Zimbabw e             Georgia Russia


                                          Pakistan
                  Democratic Republic Chad Congo
                                      of the
                            Sudan


                                                                                                            Israel
   3.00


                     Somalia
                                       A f ghanistan
                                                                        Iraq


   3.50


Figure 7: Mean years of schooling and internal peace score


Two societal, qualitative assessments scored by the Economist Intelligence Unit’s team of
analysts also appear to have a reasonable correlation to the overall score. The first indicator,
hostility to foreigners and private property attempts to measure just that, society and
government’s general attitude to foreigners and their investments in any given country. This has
a high correlation coefficient of r = 0.63. The second is a measure of the importance of religion
in national life, both for households and its influence on government policy. This is no longer
significant on our measure of internal peace however, measuring just below our threshold,
down from last year.


                                                                                  Page 46
log (GDP per capita) against OVE R AL L S C OR E

          1.0       10.0            100.0                       1000.0                      10000.0                    100000.0        1000000.0
   1.00

                                                                                                       New Zealand Norw ay
                                                                                                                    Denmark
                                                                                                                  Iceland
                                                                                                                 A ustria
                                                                                                              Japan eden
                                                                                                                 Sw
                                                                                                               Canada
                                                                                                   Czech Slovenia Finland Luxembourg
                                                                                                         Republic Ireland
                                                                                                       Portugal Belgium
                                                                                                              Germany
                                                                                                                  Sw itzerland
                                                                                                                       Qatar

                                                                                                 Chile             A ustralia
                                                                                                        Oman Singapore
                                                                                                                   Netherlands
   1.50                                                                                      UruguaySlovakia
                                                                                            Malaysia
                                                                                        Costa Rica Hungary Spain
                                                                                              Romania               France
                                                                                                    Poland
                                                                                       Botsw ana South Korea Italy
                                                                                                            anUnited Kingdom
                                                                                                       TaiwUnited A rab Emirates
                                                                 V ietnam
                                                                    Bhutan                              Estonia Kuw ait
                                                                 Laos             Tunisia          Lithuania
                                             Malaw i                                             Libya
                                                                                                   Croatia Cyprus
                                                     Mozambique Zambia Bosnia and Hercegovina Latvia Greece
                                                           Ghana            Egypt        BulgariaGabon
                                                      Tanzania Nicaragua Morocco Panama                 Equatorial Guinea
                                                                                 Jordan
                                                                                   Namibia A
                                                                          Indonesia Cuba rgentina
                                                        Burkina Faso            Dominican Republic Bahrain
                                                     Madagascar         Moldova China
                                                                            Paraguay
                                                                                   A lbania
                                                       Nepal                               Serbia
                                                                 Senegal Bolivia      Peru
                                                    Rw anda                        Ukraine Brazil
                                                                                          Kazakhstan United States of A merica
                                                     Bangladesh New Guinea Macedonia Trinidad and Tobago
                                                                      MongoliaSyria Montenegro
   2.00                                                    Papua Cameroon El Salvador
                                                              Mali      Guyana A Iran
                                                                     Turkmenistan ngola Belarus
                                                                                       Jamaica
                                                        Uganda
                                                            Cambodia                                 Saudi A rabia
                                                               Uzbekistan (Brazzaville)
                                                                       Congo         A lgeria Mexico
                                                                                 Ecuador
                                                                               Guatemala
                                                                Kenya Honduras
                                                            HaitiCote d' Ivoire
                                                                       Philippines A zerbaijan
                                                              Y emen               Thailand
                                                                                               V enezuela
                                                                                                Turkey
                                                                  India
                                                                                     South A frica
                                            Mauritania                     Sri Lanka
                                                     Myanmar
                                       Burundi
   2.50                                            Ethiopia
                                                                    Nigeria
                                                                                     Colombia

                                 North Korea e Central A frican Republic
                                    Zimbabw                                   Georgia Lebanon
                                                                                            Russia

                                                                Pakistan
                                                              Chad
                               Democratic Republic of the Congo
                                                                           Sudan


                                                                                                            Israel
   3.00


                                                 Somalia
                                                    A fghanistan
                                                                                   Iraq


   3.50


Figure 8: GDP per head and overall GPI score


The final three indicators of significance are measures of material wellbeing and health. Their
significance matches other quantitative investigations in this area of study that have established
a causal relationship with GDP per head and these healthcare measures. GDP per capita
remains significant against the Global Peace Index in its third year indeed the relationship has
strengthened this year with a r = -0.58, higher than the r = -0.57 of last year, (and r = -0.64
against the GPI rankings rather than the scores). The relationship is even more pronounced
against the measure of internal peace. There appears to be no relationship, however, to the
measure of external peace.


                                                            Page 47
I N V E S T I G AT I N G T H E S E T o F P o T E N T I A L D E T E R M I N A N T S


                                          L ife expectancy against OVE R AL L SC OR E

      30.0          40.0                           50.0                     60.0                         70.0                          80.0           90.0
   1.00

                                                                                                                                 NewNorw ay
                                                                                                                                       Zealand
                                                                                                                              Denmark Iceland
                                                                                                                                     A ustria
                                                                                                                                       Sw edenJapan
                                                                                                                       Czech Republic Canada
                                                                                                                             Slovenia
                                                                                                                                  Finland
                                                                                                                                   Ireland
                                                                                                                               Luxembourg
                                                                                                                               Portugal
                                                                                                                                  Belgium
                                                                                                                         Qatar Germany Sw itzerland

                                                                                                                                  Chile A ustralia
                                                                                                                       Oman Netherlands
                                                                                                                                   Singapore
                                                                                                                  Slovakia
   1.50                                                                                                       Hungary
                                                                                                                       Uruguay
                                                                                                                 Malaysia Costa Rica
                                                                                                           Romania Poland               France
                                                                                                                                          Spain
                                                                                                                              South Korea
                                         Botsw ana                                                                           Taiw A rab Italy
                                                                                                                              United Kingdom
                                                                                     Bhutan           V ietnam
                                                                                                             Estonia
                                                                                                      Lithuania            United an Emirates
                                                                                                                              Kuw ait
                                     Malaw i                                      Laos                          Tunisia
                                                                                                                  Libya
                                                                                                                        Croatia Cyprus
                                                                                                         Bosnia and Hercegovina
                      Mozambique
                      Zambia                                  Gabon Ghana                              Latvia
                                                                                                        EgyptBulgaria              Greece
                                         Equatorial Guinea
                                               Tanzania                                                    Nicaragua
                                                                                                     Morocco          Panama
                                                  Namibia                                                   Jordan
                                                                                             Indonesia              A rgentina Cuba
                                                                                                    Dominican Republic Bahrain
                                             Burkina Faso        Madagascar
                                                                                Nepal          Moldova Paraguay
                                                                                                            China        A lbania
                                                                                                              Serbia
                                                                              SenegalBolivia              Peru
                                Rw anda                                              Kazakhstan and Tobago United States of A merica
                                                                                              Ukraine
                                                                                           Trinidad          Brazil
   2.00                                   Cameroon Mali   Papua New Guinea BangladeshMongolia El Salvador      Macedonia
                                                                                                                Montenegro
                                                                                                                  Syria
                        A ngola                                                        Guyana
                                                                            Turkmenistan        Belarus Iran
                                                                                                       Jamaica
                                             Uganda
                                                                   Cambodia                               Saudi A rabia
                                                   Congo (Brazzaville)                    Uzbekistan
                                                                                                  GuatemalaA lgeria Mexico
                                                                                                                    Ecuador
                                                      Kenya                                       Honduras

                                       Cote d' Ivoire                         Haiti                        Philippines
                                                                                                              A zerbaijan
                                                                                   Y emen                Thailand
                                                                                                             TurkeyV enezuela
                                                  South A frica                        India
                                                                                   Mauritania                          Sri Lanka
                                                                               Myanmar
                                             Burundi
                                                          Ethiopia
   2.50
                                      Nigeria
                                                                                                                Colombia

                      Central A frican Republic                                                North Korea   Lebanon
                        Zimbabw e                                                             Russia       Georgia


                                                                                             Pakistan
                                                  Chad
                      Democratic Republic of the Congo
                                                                      Sudan


                                                                                                                                       Israel
   3.00


                                        Somalia
                       A fghanistan
                                                                                      Iraq


   3.50


Figure 9: Life expectancy and overall internal peace score


                                                                     Page 48
Infant mortality per 1,000 live births against OVE R AL L S C OR E

   1000.0                                   100.0                                                        10.0                                            1.0
                                                                                                                                                               1.00

                                                                                                                    New Zealand Norw ay
                                                                                                                            Denmark        Iceland
                                                                                                                              A ustria eden
                                                                                                                                     Sw Japan
                                                                                                                        Canada Slovenia
                                                                                                                              Czech Finland
                                                                                                                           Ireland Republic
                                                                                                                             Luxembourg
                                                                                                                                 Portugal
                                                                                                                                Belgium
                                                                                        Qatar                            Sw itzerland
                                                                                                                              Germany

                                                                                                               Chile       A ustralia
                                                                                                          Oman Slovakia Netherlands          Singapore
                                                                                                     Uruguay
                                                                                                       Malaysia Hungary
                                                                                                    Costa Rica                      Spain                      1.50
                                                                                          Romania                     Poland        France
                                           Botsw ana                                                                      South Korea
                                                     Bhutan                                                   Taiw an United Kingdom
                                                                                                                          Estonia
                                                                                             V ietnam United aitrab Emirates
                                                                                                                                      Italy
                                                                                                          Kuw A Lithuania
                                                 Malaw iLaos                          Tunisia
                                                                                          Libya
                                                                                                                        Croatia       Cyprus
                                        Mozambique Gabon
                                          Zambia
                                                 Ghana                     Egypt       Bosnia and Bulgaria Latvia
                                                                                                    Hercegovina
                                                                                                                                   Greece
                               Equatorial Guinea Tanzania               Nicaragua Panama
                                                                    Morocco
                                                              Namibia              Jordan A rgentina
                                                                           Indonesia                                        Cuba
                                                                       Dominican Republic                 Bahrain
                                  Burkina Faso Madagascar                           Paraguay lbania
                                                                                     China A
                                                              Nepal                      Moldova
                                                                                                                 Serbia
                                                      Senegal
                                                            Bolivia                 Peru
                                                                                     Ukraine              United States of A merica
                                          Rw anda              Trinidad and Tobago Brazil
                                                        BangladeshMongolia
                                                                          Kazakhstan
                                                                                           Macedonia Montenegro
                                                                                                    Syria
                                            Cameroon New Guinea
                                                   Papua                        El Salvador                                                                    2.00
                               A ngola Mali                  Guyana        Iran
                                                          Turkmenistan Jamaica                     Belarus
                                               Uganda
                                                   Cambodia                     Saudi A rabia
                                          Congo (Brazzaville) Uzbekistan
                                                                      A lgeria Ecuador
                                                                          Mexico
                                                                      Guatemala
                                                Kenya                           Honduras

                                            Cote d'A zerbaijan
                                                    Ivoire Haiti             Philippines
                                                                                                                Thailand
                                                     Y emen
                                                                               Turkey enezuela
                                                                                     V
                                                            India
                                                        South A f rica
                                                 Mauritania                                        Sri Lanka
                                                   Myanmar
                                          Burundi
                                                   Ethiopia                                                                                                    2.50
                                             Nigeria
                                                                                        Colombia

                             Central A f rican Republic      North Korea Lebanon
                                                   Zimbabw e            Georgia                 Russia

                                                Pakistan
                                    Chad
                      Democratic Republic of the Congo
                                                       Sudan

                                                                                                                              Israel
                                                                                                                                                               3.00


                                               Somalia
                          A f ghanistan
                                                                   Iraq


                                                                                                                                                               3.50


Figure 10: Infant mortality and internal peace score

Infant mortality per 1,000 births (shown here as a log scale) is also significant against
our measure of overall peace and internal peace. Again this indicator is likely to be
highly correlated to a number of the other potential drivers, such as GDP per head.

None of the other metrics on material wellbeing and health have correlation coefficients
greater than 0.5 or less than -0.5. The gini-coefficient, a measure of income distribution,
comes close, especially on our internal measure of peace (r = 0.48). once again, despite
the inclusion of 144 countries, it cannot be described as a significant correlation. There
are, nevertheless, some problems with the gini coefficient; there is a considerable lag
in the publication of statistics for many countries, forcing the Economist Intelligence
Unit to estimate the coefficient for a sizeable proportion of the 144 in the GPI. These
problems of measurement look likely to persist for the foreseeable future, and the use of
other measures of income inequality may be desirable.


                                                                          Page 49
I N V E S T I G AT I N G T H E S E T o F P o T E N T I A L D E T E R M I N A N T S


For each of the calculations carried out there       refines the set of determinants to a core set of
are some notable outliers, some consistent           powerful drivers and predictors. Regression
with each measure. These can be seen on the          analysis could also provide a tightening of the
scatter plots, as those countries frequently         weights for future iterations of the GPI. With
deviating from the general trend. Commonly           each additional year of compiling the datasets
listed countries include on the peaceful             for the Global Peace Index calculations and
side, Qatar (but no longer Bhutan) and, less         its set of ‘drivers’ we increase the possibility
peacefully, Iraq, Sudan, Israel, Colombia,           of testing more robustly the actual causality
Lebanon and the US. As outliers they weaken          order; do the societal variables really
the overall results, but also appear not to          drive internal conflict or does it work the
be following the general trends established          other way round? For example, do rises in
for other countries. There are clearly other         average incomes and wealth such as GDP
factors relating to these countries that are         per capita create more peaceful societies,
not being captured by the chosen set of              or is the emergence of greater internal and
determinants.                                        external peace a prerequisite for a take-off in

It should be noted that further research is          economic growth? Is corruption a symptom

needed to establish significant correlations         of an absence of peace or its cause?

to the measure of external peace. This is            This year we have seen tentative signs of a
probably attributable to the previously noted        causal relationship between our measure
observation that there have been very few            of the state of peace and the strength of the
interstate conflicts within this group of 144        economy. As the global economy was heading
countries during the period under review.            into a synchronized recession towards the

Based on these preliminary investigations, an        end of 2008, many of our measures in

ordering of influences and drivers would look        aggregate deteriorated that year (for example,

like Figure 11 on the following page, similar        likelihood of violent demonstrations, political

to those established in previous years.              instability, etc). We expect this relationship to
                                                     become more pronounced when measuring
Based on the last three years of research
                                                     the GPI next year as economic upheaval
carried out on the GPI against the chosen
                                                     this year impacts on the most economically
set of drivers, peaceful societies are those
                                                     vulnerable countries, with expected political
characterized as countries with very low
                                                     repercussions.
levels of internal conflict with efficient,
accountable governments, strong economies,
cohesive/integrated	populations	and	good	
relations within the international community.

Additional research has been conducted in
2009 (see 2009 Discussion Paper - Peace,
its Causes and Economic Value) including
factor and discriminant analysis that further


                                                Page 50
Figure 11


            Page 51
ANNEX A


Where the quantitative indicators have missing data in the central source, the Economist
Intelligence Unit’s analysts have estimated the scores.

Measures of ongoing domestic and international conflict
      Indicator             Central Source            Year        Definition / coding
 1    Number of             Uppsala Conflict       2002-07        UCDP defines conflict as: “a contested
      external and          Data Program                          incompatibility that concerns government
      internal wars         (UCDP), University                    and/or	territory	where	the	use	of	armed	
      fought                of Uppsala, Sweden                    force between two parties, of which at least
                            /	International	Peace	                one is the government of a state, results in
                            Research Institute,                   at least 25 battle-related deaths in a year”.
                            oslo (PRIo) Armed                     For additional information on this indicator
                            Conflict Dataset                      see notes on page 55.
 2    Estimated             UCDP                      2007        As above
      number of deaths
      from organized
      conflict (external)
 3    Number of             International             2007        For additional information on this indicator
      deaths from           Institute for Strategic               see notes on page 55.
      organized conflict    Studies, Armed
      (internal)            Conflict Database
 4    Level of              Economist                 2008        Qualitative assessment of the intensity of
      organized conflict    Intelligence Unit                     conflicts within the country. Ranked 1-5
      (internal)                                                  (very low-very high) by EIU analysts.
 5    Relations with        Economist                 2008        Qualitative assessment of relations with
      neighbouring          Intelligence Unit                     neighbouring countries. Ranked 1-5
      countries                                                   (very low-very high) by EIU analysts.


Measures of safety and security in countries
      Indicator             Central Source            Year        Definition / coding
 6    Level of perceived    Economist                 2008        Qualitative assessment of perceived criminality.
      criminality in        Intelligence Unit                     Ranked 1-5 (very low-very high) by EIU
      society                                                     analysts. For additional information on this
                                                                  indicator see notes on page 56.
 7    Number of             UNHCR Statistical         2007        Refugee population by country or territory of
      displaced people      Yearbook 2007                         origin, as a percentage of the country’s total
      as a percentage                                             population.
      of the population
 8    Political             Economist                 2008        This indicator addresses the degree to which
      instability           Intelligence Unit                     political institutions are sufficiently stable to
                                                                  support the needs of its citizens, businesses
                                                                  and overseas investors. It is a composite
                                                                  indicator based on the scores, 1 to 5 for each
                                                                  of the following issues: What is the risk of
                                                                  significant social unrest during the next two
                                                                  years? How clear, established, and accepted
                                                                  are constitutional mechanisms for the orderly
                                                                  transfer of power from one government to
                                                                  another? How likely is it that an opposition
                                                                  party or group will come to power and cause a
                                                                  significant deterioration in business operating
                                                                  conditions? Is excessive power concentrated or
                                                                  likely to be concentrated, in the executive so
                                                                  that executive authority lacks accountability
                                                                  and possesses excessive discretion?
                                                                  Is	there	a	risk	that	international	disputes/
                                                                  tensions will negatively affect the economy
                                                                  and/or	polity?

                                                        Page 52
Indicator           Central Source          Year            Definition / coding
9    Level of respect    Gibney, M.,             2007            Countries are coded on a scale of 1-5
     for human rights    Cornett, L., &                          according to their level of respect for
     (Political Terror   Wood, R., (year                         human rights the previous year, according
     Scale)              of publication)                         to the description provided in the Amnesty
                         Political Terror                        International and US Department County
                         Scale 1976-2007.                        Reports. The average of the two scores is
                         Date Retrieved,                         taken for our assessment. For additional
                         from the Political                      information on this indicator see notes
                         Terror Scale Web                        on page 56.
                         site:	http://www.
                         politicalterrorscale.
                         org
10   Potential for       Economist               2008            Qualitative assessment of the potential for
     Terrorist Acts      Intelligence Unit                       terrorist acts. Ranked 1-5 (very low-very
                                                                 high) by EIU analysts.
11   Number of           UNoDC, 10th,            2006, 2004      Intentional homicide refers to death
     homicides per       9th (and 8th) UN        and 2002        deliberately inflicted on a person by another
     100,000 people      Survey on Crime         (dependent      person, including infanticide. For additional
                         Trends and the          on              information on this indicator see notes on
                         operations of           availability)   page 56.
                         Criminal Justice
                         Systems (UNCJS)
12   Level of violent    Economist               2008            Qualitative assessment of the level of violent
     crime               Intelligence Unit                       crime. Ranked 1-5 (very low-very high) by
                                                                 EIU analysts.
13   Likelihood          Economist               2008            Qualitative assessment of the level of violent
     of violent          Intelligence Unit                       demonstrations. Ranked 1-5 (very low-very
     demonstrations                                              high) by EIU analysts.
14   Number of jailed    International           2008            For additional information on this indicator
     population per      Centre for Prison                       see notes on page 57.
     100,000 people      Studies, King’s
                         College London:
                         World Prison
                         Population List
                         (Eighth Edition)
15   Number of           UNoDC, 10th,            2006, 2004      Refers to the civil police force as distinct from
     internal security   9th (and 8th)           and 2002        national guards or local militia.
     officers and        UN Survey of            (dependent
     police per          Criminal Trends         on
     100,000 people      and operations of       availability)
                         Criminal Justice
                         Systems (UNCJS)


                                                   Page 53
ANNEX A


Measures of militarization
     Indicator            Central Source       Year            Definition / coding
16   Military             The International    2007, 2008      Cash outlays of central or federal government
     expenditure as       Institute for        (dependent      to meet the costs of national armed forces –
     a percentage of      Strategic Studies,   on              including strategic, land, naval, air, command,
     GDP                  The Military         availability)   administration and support forces as well
                          Balance 2009                         as paramilitary forces, customs forces and
                                                               border guards if these are trained and
                                                               equipped as a military force. We use our own
                                                               published data on nominal GDP to arrive
                                                               at the value of military expenditure as a
                                                               percentage of GDP.
17   Number of            The International    2007, 2008      Active armed services personnel comprise
     armed services       Institute for        (dependent      all servicemen and women on full-time
     personnel per        Strategic Studies,   on              duty in the army, navy, air force and joint
     100,000 people       The Military         availability)   forces (including conscripts and long-term
                          Balance 2009                         assignments from the Reserves).
18   Volume of            SIPRI Arms           2003-07         The SIPRI Arms Transfers Database covers
     transfers of major   Transfers Project                    all international sales and gifts of major
     conventional         database                             conventional weapons and the technology
     weapons                                                   necessary for the production of them. The
     (imports) per                                             transfer equipment or technology is from
     100,000 people                                            one country, rebel force or international
                                                               organisation to another country, rebel
                                                               force or international organisation. Major
                                                               conventional weapons include: aircraft,
                                                               armoured vehicles, artillery, radar systems,
                                                               missiles, ships, engines.
19   Volume of            SIPRI Arms           2003-07         The SIPRI Arms Transfers Database
     transfers of major   Transfers Project                    As above.
     conventional         database
     weapons
     (exports) per
     100,000 people
20   Funding for UN       United Nations       2005-07         Calculation of percentage of countries’
     peacekeeping                                              outstanding contributions versus annual
     missions                                                  assessment to the budget of the current
                                                               peacekeeping missions. For additional
                                                               information on this indicator see notes on
                                                               page 58.
21   Aggregate            Bonn International   2003            The BICC Weapon Holdings Database
     number of heavy      Centre for                           contains figures for four weapon categories:
     weapons per          Conversion (BICC)                    armoured vehicles, artillery, combat
     100,000 people                                            aircraft, major fighting ships. The numbers
                                                               of weapons in these categories have been
                                                               indexed, with 1996 as the fixed base year.
                                                               Holdings are those of government forces and
                                                               do not include holdings of armed opposition
                                                               groups. Weapon systems in storage are also
                                                               not included. Indices for groups are directly
                                                               calculated from the aggregated numbers of
                                                               holdings of heavy weapons.
22   Ease of access to    Economist            2008            Qualitative assessment of the ease of access
     small arms and       Intelligence Unit                    to small arms and light weapons. Ranked 1-5
     light weapons                                             (very low-very high) by EIU analysts.
23   Military             Economist            2008            Qualitative assessment of the grade of
     capability /         Intelligence Unit                    sophistication and the extent of military
     sophistication                                            research and development (R&D) Ranked 1-5
                                                               (very low-very high) by EIU analysts.


                                                 Page 54
A D D I T I o N A L N o T E S o N T H E I N D I C AT o R S
USED IN THE GLoBAL PEACE INDEX


1. Number of external and internal armed conflicts fought: 2003-07
Source: the Uppsala Conflict Data Program (UCDP), Uppsala University, Sweden

The separate elements of the definition are as follows:

(1) Use of armed force: use of arms in order to promote the parties’ general position in the
conflict, resulting in deaths.

(1.1) Arms: any material means, e.g. manufactured weapons but also sticks, stones, fire, water, etc.

(2) 25 deaths: a minimum of 25 battle-related deaths per year and per incompatibility.

(3) Party: a government of a state or any opposition organization or alliance of opposition
organizations.

(3.1) Government: the party controlling the capital of the state.

(3.2) opposition organization: any non-governmental group of people having announced a
name for their group and using armed force.

(4) State: a state is

(4.1) an internationally recognized sovereign government controlling a specified territory, or

(4.2) an internationally unrecognized government controlling a specified territory whose
sovereignty is not disputed by another internationally recognized sovereign government
previously controlling the same territory.

(5)	Incompatibility	concerning	government	and/or	territory	the	incompatibility,	as	stated	by	the	
parties,	must	concern	government	and/or	territory.

(5.1) Incompatibility: the stated generally incompatible positions.

(5.2) Incompatibility concerning government: incompatibility concerning type of political
system, the replacement of the central government or the change of its composition.

Incompatibility concerning territory: incompatibility concerning the status of a territory,
e.g. the change of the state in control of a certain territory (interstate conflict), secession or
autonomy (intrastate conflict).

3. Number of deaths from organized conflict (internal)
UCDP/PRIO	Armed	Conflict	Dataset	records	the	number	of	battle	deaths	per	conflict,	defined	
as:	“a	contested	incompatibility	that	concerns	government	and/or	territory	where	the	use	of	
armed force between two parties, of which at least one is the government of a state, results in
at least 25 battle-related deaths in a year”. EIU analysts, then, have scored the figures available
for 2007 and 2008 according to the following bands.

 1                      2                 3                   4                    5
 0-24                   25-999            1,000-4,999         5,000-9,999          > 10,000


                                                Page 55
A D D I T I o N A L N o T E S o N T H E I N D I C AT o R S
USED IN THE GLoBAL PEACE INDEX


6. Level of perceived criminality in society
A qualitative assessment ranked from 1-5 (very low to very high) by the Economist Intelligence
Unit’s Country Analysis team.

Very low (1): The majority of other citizens can be trusted. Very low levels of domestic security.

Low (2): An overall positive climate of trust with other citizens.

Moderate (3): Reasonable degree of trust in other citizens.

High (4): High levels of distrust in other citizens. High levels of domestic security.

Very high (5): Very high levels of distrust in other citizens – people are extremely cautious in their
dealings with others. Large number of gated communities, high prevalence of security guards.

9. Respect for Human Rights (Political Terror Scale)
Mark Gibney and Matthew Dalton, from University of North Carolina, have coded countries
on a 1 to 5 scale according to their level of terror their previous year, based on the description
provided in the Amnesty International Yearbook (in this case the 2007 Yearbook, referring to
2006 data). There is an additional index coded on a 1 to 5 scale based on a close analysis of
Country Reports from the US State Department. Amnesty International scores have been used
where available, with US State Department scores used to fill missing data.

  •	Level	1:	Countries	under	a	secure	rule	of	law.	People	are	not	imprisoned	for	their	views	and	
    torture is rare or exceptional.

  •	Level	2:	There	is	a	limited	amount	of	imprisonment	for	non-violent	political	activity.	
    However, few persons are affected and torture and beatings are exceptional. Politically-
    motivated murder is rare.

  •	Level	3:	There	is	extensive	political	imprisonment,	or	a	recent	history	of	such	
    imprisonment. Execution or other political murders and brutality may be common.
    Unlimited detention, with or without a trial, for political views is accepted.

  •	Level	4:	Civil	and	political	rights	violations	have	expanded	to	large	numbers	of	the	
    population. Murders, disappearances, and torture are a common part of life. In spite of its
    generality, on this level political terror affects those who interest themselves in politics or ideas.

  •	Level	5:	Terror	has	expanded	to	the	whole	population.	The	leaders	of	these	societies	place	no	
    limits on the means or thoroughness with which they pursue personal or ideological goals.

11. Number of homicides per 100,000 people
This indicator has been compiled using UNoDC figures in the UN Survey on Crime Trends and
the operations of Criminal Justice Systems (UNCJS) (10th, 9th and 8th Surveys of Criminal
Trends) rather than Interpol data. The figures refer to the total number of penal code offences
or their equivalent, but excluding minor road traffic and other petty offences, brought to the
attention of the police or other law enforcement agencies and recorded by one of those agencies.
The original Interpol figures reviewed for the first iteration of the Global Peace Index were
for	1998/99	and	the	consensus	among	experts	on	the	analysis	of	criminal	justice	is	that	the	

                                                 Page 56
UNoDC figures are more reliable – they are compiled from a standard questionnaire sent to
national officials via the UN statistical office. However, the UN acknowledges that international
comparisons of crime statistics are beset by methodological difficulties:

  •	Different	definitions	for	specific	crime	types:	The	category	in	which	any	incident	of	
     victimization is recorded relies on the legal definition of crime in any country. Should that
     definition be different, which is often the case, comparisons will not be made of exactly the
     same crime type. This is particularly the case in crimes that require some discretion from a
     police officer or relevant authority when they are identified. For example, the definitional
     difference between serious or common assault in different legal jurisdictions may be
     different, and this will be reflected in the total number of incidents recorded.

  •	Different	levels	of	reporting	and	traditions	of	policing:	This	relates	closely	to	levels	of	
     development in a society, most clearly reflected in accessibility to the police. Factors such
     as the number of police stations or telephones impact upon reporting levels. The level of
     insurance coverage in a community is also a key indicator of the likelihood of citizens
     approaching the police as their claim for compensation may require such notification. In
     addition, in societies where the police are or have been mistrusted by the population, most
     specifically during periods of authoritarian rule, reporting levels are likely to be lower than
     in cases where the police are regarded as important members of the community.

  •	Different	social,	economic	and	political	contexts:	Comparing	crime	data	from	societies	
     that are fundamentally different may ignore key issues present in the society that impact
     upon levels of reporting. For example, different social norms in some countries may make
     it difficult for women to report cases of rape or sexual abuse, while in others, women are
     encouraged to come forward.

The International Crime Victim Survey (ICVS) is perhaps a more sensitive and accurate measure
of crime – and arguably offers a picture of how the public views the criminal justice system – but
is currently limited to a few, mainly industrialized, countries so these data are not included.

Where data are not present, The Economist Intelligence Unit’s analysts have estimated figures
based on their deep knowledge of each country. All the figures for homicides per 100,000
people have been banded as:

 1                    2                   3                   4                    5
 0-1.9                2-5.9               6-9.9               10-19.9              > 20

14. Number of jailed population per 100,000 people
Figures are from the International Centre for Prison Studies, King’s College, University of
London and are compiled from a variety of sources. In almost all cases the original source is the
national prison administration of the country concerned, or else the Ministry responsible for the
prison administration. The International Centre for Prison Studies warns that because prison
population rates (per 100,000 of the national population) are based on estimates of the national
population they should not be regarded as precise. Comparability is compromised by different
practice in different countries, for example with regard to whether all pre-trial detainees and

                                                  Page 57
A D D I T I o N A L N o T E S o N T H E I N D I C AT o R S
USED IN THE GLoBAL PEACE INDEX


juveniles are held under the authority of the prison administration, and also whether the prison
administration is responsible for psychiatrically ill offenders and offenders being detained for
treatment for alcoholism and drug addiction. People held in custody are usually omitted from
national totals if they are not under the authority of the prison administration.

The data have been banded for scoring accordingly:

 1                   2                    3                   4                     5
 0-69                70-139               140-209             210-279               > 280

15. Number of internal security officers and police 100,000 people
The original figures have been taken from UNoDC, 10th, 9th and 8th UN Surveys of Criminal
Trends and operations of Criminal Justice Systems (UNCJS) and refer to the civil police force
as distinct from national guards or local militia. Where there are gaps, then, EIU analysts have
filled the gaps based on likely scores from our set bands of the actual data.

 1                   2                    3                   4                     5
 0-199               200-399              400-599             600-799               > 800

20. Funding for UN peacekeeping missions
The indicator calculates the percentage of countries’ “outstanding payments versus annual
assessment to the budget of the current peacekeeping missions”

All United Nations Member States share the costs of United Nations peacekeeping operations.
The General Assembly apportions these expenses based on a special scale of assessments
applicable to peacekeeping. This scale takes into account the relative economic wealth of Member
States, with the permanent members of the Security Council required to pay a larger share because
of their special responsibility for the maintenance of international peace and security.

22. Ease of access to small arms and light weapons
A qualitative assessment of the accessibility of small arms and light weapons (SALW), ranked
1-5 (very low–very high) by EIU analysts. Very limited access is scored if the country has
developed policy instruments and best practices, such as firearm licences, strengthening of
export controls, codes of conduct, firearms or ammunition marking. Very easy access, on the
contrary, is characterized by the lack of regulation of civilian possession, ownership, storage,
carriage and use of firearms.

New developments to the scoring criteria for the Global Peace Index
This year we have altered the way in which we score a number of component indicators for the
Global Peace Index. Previously these series were scored by normalising each country’s datum
on the basis of the following formula:

                                x = (x- Min(x)) / (Max (x)—Min (x))

Where Min (x) and Max (x) are respectively the lowest and highest values in all of the
countries under measurement for any given indicator. The normalized value was then
transformed from a 0-1 value to a 1-5 score to make it comparable with the other indicators.

                                               Page 58
However, while such an approach is able to accurately measure a country’s performance
against the whole data set of countries, such an approach does not lend itself to comparison
over time. In order to compare scores effectively over time we needed to anchor the minimums
and maximums to some set measures for every year of calculation. It was also apparent that
some of the series under review exhibited a fair amount of volatility year on year and that
normalisation, even with a set range year on year, would still result in a great deal of change
in indicator scores. We therefore, with the consent of the panel of experts, moved to a banding
system for these indicators based on the range of the data sets used for the index in 2008.
The scoring criteria for each of the affected series are given below.

Number of jailed population per 100,000 people

 1                  2                   3                   4                  5
 0-199.5            199.6 - 379.0       379.1 - 558.5       558.6 - 738.0      >738.0

Volume of transfers of major conventional weapons, as recipient (imports) per 100,000 people

 1                  2                   3                   4                  5
 0-15.2             15.3-30.4           30.5-38.0           38.1-60.8          >60.8

Military expenditure as a percentage of GDP

 1                  2                   3                   4                  5
 0-3.3              3.4-6.6             6.7-9.8             9.9-13.1           >13.1

Number of armed services personnel per 100,000 people

 1                  2                   3                   4                  5
 0-1,311.9          1,312-2,613.8       2,613.9-3,915.7     3,915.8-5,217.6    >5,217.6

Funding for UN Peacekeeping Missions

 1                  2                   3                   4                  5
 0-3.4              3.5-6.9             7.0-10.3            10.4-13.8          >13.8

Aggregate number of heavy weapons per 100,000 people

 1                  2                   3                   4                  5
 0-62.9             63.0-125.7          125.8-188.5         188.5-251.3        >251.3

Volume of transfers of major conventional weapons as supplier (exports) per 100,000 people

 1                  2                   3                   4                  5
 0-5.9              5.9-11.9            12.0-17.8           17.9-23.8          >23.8

Number of displaced people as a percentage of the population

 1                  2                   3                   4                  5
 0.0-3.0            3.1-6.1             6.2-9.1             9.2-12.2           >12.2

Number of external and internal conflicts fought

 1                  2                   3                   4                  5
 0-1.1              1.2-2.1             2.2-3.0             3.1-4.0            >4.0

                                              Page 59
ANNEX B
PoTENTIAL DETERMINANTS oF PEACE


Democracy and Transparency
Indicator              Central Source    Year          Definition
Electoral process      EIU Democracy     2008          Qualitative assessment of whether elections are
                       Index                           competitive in that electors are free to vote and
                                                       are offered a range of choices. Ranked 1- 10
                                                       (very low to very high).
Functioning of         EIU Democracy     2008          Qualitative assessment of whether freely elected
government             Index                           representatives determine government policy? Is
                                                       there an effective system of checks and balances on
                                                       the exercise of government authority? Ranked 1- 10
                                                       (very low to very high).
Political              EIU Democracy     2008          Qualitative	assessment	of	voter	participation/turn-
participation          Index                           out for national elections, citizens’ engagement with
                                                       politics. Ranked 1- 10 (very low to very high).
Political culture      EIU Democracy     2008          Qualitative assessment of the degree of societal
                       Index                           consensus and cohesion to underpin a stable,
                                                       functioning democracy; score the level of separation of
                                                       church and state. Ranked 1- 10 (very low to very high).
Civil liberties        EIU Democracy     2008          Qualitative assessment of the prevalence of civil
                       Index                           liberties. Is there a free electronic media? Is there
                                                       a free print media? Is there freedom of expression
                                                       and protest? Are citizens free to form professional
                                                       organisations and trade unions? Ranked 1- 10
                                                       (very low to very high).
Corruption             Transparency      2008          The Index draws on multiple expert opinion surveys
perceptions            International,                  that poll perceptions of public sector corruption
                       Corruption                      scoring countries on a scale from 0 to 10, with 0
                       Perception                      indicating high levels of perceived corruption and
                       Index                           10 indicating low levels of perceived corruption.
Women in               Inter-            2008          Figures are based on information provided by
parliament (as a       parliamentary                   national parliaments by 31st December 2006.
percentage of the      Union
total number of
representatives in
the lower house)
Gender inequality      Gender Gap        2008          A composite index that assesses countries on
                       Index, World                    how well they are dividing their resources and
                       Economic                        opportunities among their male and female
                       Forum                           populations, regardless of the overall levels of these
                                                       resources and opportunities.
Freedom of the press   Reporters         1/9/2007	-	   The index measures the state of press freedom in the
                       without borders   1/9/2008      world, reflecting the degree of freedom journalists
                                                       and news organisations enjoy in each country, and
                                                       the efforts made by the state to respect and ensure
                                                       respect for this freedom.


                                                  Page 60
International openness
Indicator              Central Source     Year           Definition
Exports + Imports      EIU                2008           Merchandise goods exports free on board measure
% of GDP                                                 (fob) and merchandise goods imports (fob).
Foreign Direct         EIU                2008           Net flows of direct investment capital by non-
Investment (flow) %                                      residents into the country, as a percentage of GDP.
of GDP
Number of visitors     UNWTo              2006, 2005     Arrivals data correspond to international visitors to
as % of domestic       Compendium         dependent      the economic territory of the country and include
population             of Tourism         on             both tourists and same-day non-resident visitors.
                       Statistics, Data   availability
Net Migration (%       World Bank,        2000-2005      Net migration is the net average annual number of
of total population)   World                             migrants during the period 2000-2005 that is the
                       Development                       number of immigrants less the number of emigrants,
                       Indicators. Data                  including both citizen and non citizens.
                       refer to 2000-
                       2005


Demographics
Indicator              Central Source     Year           Definition
15-34 year old         UN World           2008           Male population 15-34 year olds as a proportion
males as a % of        Population                        of the total population.
total population       Prospects
Gender ratio of        UN World           2008           Male population divided by the female population.
population:	women/     Population
men                    Prospects


Regional & international framework/conditions
Indicator              Central Source     Year           Definition
Extent of regional     EIU                2008           Qualitative assessment of the level of membership
integration                                              of trade alliances, as NAFTA, ANSEAN, etc.
                                                         Ranked 1-5 (Very low-very high ) by EIU analysts.


                                                   Page 61
ANNEX B
PoTENTIAL DETERMINANTS oF PEACE


Education
Indicator              Central Source   Year            Definition
Current education      UNESCo,          2005-2006       Public spending on education, total (% of GDP).
spending (% of         data refer to    (depending
GDP)                   the UNESCo       on
                       Institute for    availability)
                       Statistics
                       estimate, when
                       no value is
                       available
Primary school         World Bank,      2005-2006       Net enrolment ratio is the ratio of the number of
enrolment ratio (%     World            (depending      children of official school age (as defined by the
Net)                   Development      on              national education system) who are enrolled in
                       Indicators       availability)   school to the population of the corresponding
                                                        official school age.
Secondary school       World Bank,      2005-2006       Net enrolment ratio is the ratio of the number of
enrolment ratio (%     World            (depending      children of official school age (as defined by the
Net)                   Development      on              national education system) who are enrolled in
                       Indicators       availability)   school to the population of the corresponding
                                                        official school age.
Higher education       World Bank,      2005-2006       Gross enrolment ratio is the ratio of total enrolment,
enrolment (%           World            (depending      regardless of age, to the population of the age group
Gross)                 Development      on              that officially corresponds to the level of education
                       Indicators       availability)   shown.
Mean years of          UNESCo,          2005 and        School life expectancy (years), Primary to tertiary.
schooling              data refer to    earlier years
                       the UNESCo       (depending
                       Institute for    on
                       Statistics       availability)
                       estimate, when
                       no estimate is
                       available
Adult literacy rate    UNESCo,          2007            Data refer to national literacy estimates from
(% of population       data refer to                    censuses or surveys.
over the age of 15)    the UNESCo
                       Institute for
                       Statistics


Culture
Indicator              Central Source   Year            Definition
Hostility to           EIU              2008            Scored 1-5 by EIU analysts.
foreigners/private	
property
Importance of          EIU              2008            Qualitative assessment of the level of importance
religion in national                                    of religion in politics and social life. Ranked 1-5
life                                                    (very low to very high) by EIU analysts.
Willingness to fight   EIU              2008            Qualitative assessment of the willingness of citizens
                                                        to fight in wars. Ranked 1- 5 (very low to very high)
                                                        by EIU analysts.


                                                  Page 62
Material well being
Indicator              Central Source    Year             Definition
Nominal GDP            EIU               2008             Nominal gross domestic product at 2005 US$
(US$PPP bn)                                               purchasing power parities.
Nominal GDP            EIU               2008             Nominal gross domestic product US$ market prices.
(US$ bn)
GDP per capita         EIU               2008             Nominal gross domestic product (US$) per capita.
Gini coefficient       UN Human          Latest           The Gini index measures the extent to which
                       Development       available        the distribution of income among individuals or
                       Index 2007-       year             households within an economy deviates from a
                       2008; World                        perfectly equal distribution.
                       Bank, World
                       Development
                       Indicators; EIU
                       estimates
Unemployment %         EIU               2008             ILo defines the unemployed as members of the
                                                          economically active population who are without
                                                          work but available for and seeking work, including
                                                          people who have lost their jobs and those who have
                                                          voluntary left work.
Life expectancy        World Bank,       2006             Life expectancy at birth is the number of years a
                       World                              newborn infant would live if prevailing patterns of
                       Development                        mortality at the time of its birth were to stay the
                       Indicators                         same throughout its life.
Infant mortality per   World Bank,       2008             Infant mortality rate is the number of infants dying
1,000 live births      World                              before reaching one year of age, per 1,000 live births
                       Development                        in a given year.
                       Indicators


                                                     Page 63
Po Box 42, St Leonards, Sydney NSW 1590, Australia
email info@visionofhumanity.org web www.visionofhumanity.org

                © Institute for Economics and Peace 2009

2009 Global Peace Index report

  • 1.
    I N ST I T U T E F O R E C O N O M I C S & P EAC E P E A C E 2 0 0 9 M E T H ODOL OGY, R E SULTS & F I N DI N GS
  • 2.
    E X EC U T I V E S U M M A RY The results of the Global Peace Index for 2009 suggest that the world has become slightly less peaceful in the past year, which appears to reflect the intensification of violent conflict in some countries and the effects of both the rapidly rising food and fuel prices early in 2008 and the dramatic global economic downturn in the final quarter of the year. Rapidly rising unemployment, pay freezes and falls in the value of house prices, savings and pensions is causing popular resentment in many countries, with political repercussions that have been registered by the GPI through various indicators measuring safety and security in society. This is the third edition of the Global Peace Index (GPI). It has been expanded to rank 144 independent states and updated with the latest-available figures and information for 2007-08. The index is composed of 23 qualitative and quantitative indicators from respected sources, which combine internal and external factors ranging from a nation’s level of military expenditure to its relations with neighbouring countries and the level of respect for human rights. These indicators were selected by an international panel of experts including academics and leaders of peace institutions. As before, the GPI has been tested against a range of potential “drivers” or potential determinants of peace – including levels of democracy and transparency, education and material wellbeing. The GPI brings a snapshot of relative peacefulness among nations while continuing to contribute to an understanding of what factors help create or sustain more peaceful societies. The GPI was founded by Steve Killelea, an Australian international technology entrepreneur and philanthropist. It forms part of the Institute for Economics and Peace, a new global think tank dedicated to the research and education of the relationship between economic development, business and peace. The GPI is collated and calculated by the Economist Intelligence Unit, with whom this report is written in co-operation. Page 2
  • 3.
    HIGHLIGHTS New Zealand isranked as the country most encompassing almost 99% of the world’s at peace, followed by Denmark and Norway. population and over 87% of the planet’s Small, stable and democratic countries are land mass. consistently ranked highest; 14 of the top 20 A further change involved the removal of countries are Western or Central European two indicators featured in the Global Peace countries. This is, however, a reduction from Indexes of 2007 and 2008: the measures of 16 last year, with Hungary and Slovakia both UN and non-UN deployments. The former slipping out of the top 20, while Qatar and was dropped because it was generally Australia moved up to 16th and 19th place felt that it was not a sufficiently accurate respectively. All five Scandinavian countries measure of a commitment from countries are in the top ten of the GPI. Island nations to UN peacekeeping missions. In the 2009 generally fare well, although Madagascar GPI the UN deployments indicator has been fell by 30 places amid mounting political replaced with a measure of financial support instability and violent demonstrations. For to UN peacekeeping missions as all UN the third year running, the country ranked member states share the cost of mounting least at peace is Iraq. Afghanistan and these operations. The indicator calculates Somalia follow – countries that are in a state the percentage of countries’ “outstanding of ongoing conflict and upheaval. The average contributions versus annual assessment to the score for the nations surveyed in the 2009 budget of the current peacekeeping missions” GPI is 1.964 (based on a 1-5 scale). There is (see Annex A for a full definition). little variance between the overall scores of The indicator of Non-UN deployments the top 20 countries (1.202 for New Zealand was initially included on the assumption and 1.481 for Chile), although the 20 lowest that a country deploying troops overseas ranked countries exhibit a far greater spread, cannot be considered free of violence. varying between 2.485 (Sri Lanka) and 3.341 However, members of the panel of experts (Iraq). acknowledged that the indicator is potentially Changes to the methodology for 2009 ambiguous - should the deployment of The international panel of experts that troops overseas, whose mission is to prevent oversees the compilation of the Global genocide in a foreign country, be recorded as Peace Index chose to include five additional a “negative” indicator in the GPI? In order to countries in the 2009 edition: Burundi, avoid making such judgements, the consensus Georgia, Guyana, Montenegro and Nepal. view was to remove the indicator. Hong Kong was dropped in response The two previous editions of the Global to queries about its status as a special Peace Index have been compiled using a administrative region of the People’s combination of “raw” quantitative scores Republic of China. While Hong Kong that were “normalized” and scores (mainly maintains a high degree of autonomy, foreign qualitative) that were banded using a scale of affairs and defence are the responsibility of 1-5. The compilers have observed that the use China’s authorities in Beijing. This brings the of raw scores contributed to the volatility of total number of countries covered to 144, the index, so, following discussion with the Page 3
  • 4.
    HIGHLIGHTS overseeing panel ofexperts, it was decided this year to place all of the scores across the 23 indicators in bands, on either a scale of 1-5 or 1-10. In order to make appropriate analysis of year- on-year changes to scores and rankings of the GPI, the Economist Intelligence Unit have used the amended set of indicators and weights as decided upon by the panel of experts to construct a revised index and set of rankings for the 2008 GPI. All discussions of changes in rankings and scores refer to these new methodologies. For more details, see Annex B. Page 4
  • 5.
    BACKGRoUND Defining peace on human rights, gender equality, democratic participation, tolerant solidarity, open The concept of peace is notoriously difficult communication and international security. to define. The simplest way of approaching However, these links between the concept of it is in terms of harmony achieved by the peace and the causes of them were presumed absence of war or conflict. Applied to nations, rather than systematically measured. For this would suggest that those not involved in example, while Doyle2 and advocates of violent conflicts with neighbouring states or his liberal peace theory have held that suffering internal wars would have achieved democratic states rarely attack each other, a state of peace. This is what Johan Galtung1 the ongoing war in Iraq demonstrates how defined as a “negative peace” – an absence some democratic countries can be militant or of violence. The concept of negative peace belligerent – the justification for war often is immediately intuitive and empirically being that peace is ultimately secured through measurable, and can be used as a starting violence or the threat of violence. point to elaborate its counterpart concept, “positive peace”: having established what Measuring states of peace constitutes an absence of violence, is it The difficulties in defining the concept of possible to identify which structures and peace may partly explain why there have institutions create and maintain peace? The been so few attempts to measure states Global Peace Index is a first step in this of peace across nations. This project has direction; a measurement of peace as the approached the task on two fronts – the first “absence of violence”, that seeks to determine aim is to produce a scoring model and global what cultural attributes and institutions are peace index that ranks 144 nations by their associated with states of peace. relative states of peace using 23 indicators. In 1999 the UN General Assembly launched The indicators have been selected as being a programme of action to build a “culture the best available datasets that reflect the of peace” for the world’s children, which incidence or absence of peace, and contain envisaged working towards a positive peace both quantitative data and qualitative scores of justice, tolerance and plenty. The UN from a range of trusted sources. The second defined a culture of peace as involving values, aim is to use the underlying data and results attitudes and behaviours that: from the Global Peace Index to undertake investigations into the relative importance of • Reject violence a range of potential determinants or “drivers” • Endeavour to prevent conflicts by that may influence the creation and nurturing addressing root causes of peaceful societies, both internally and • Aim at solving problems through externally. dialogue and negotiation 1 Galtung, Johan. Peace by Peaceful Means: peace It proposed that such a culture of peace and conflict, development and civilization. oslo: would be furthered by actions promoting International Peace Research Institute, 1996 education for peace and sustainable 2 Doyle, Michael. Kant, Liberal Legacies, and Foreign Affairs. development, which it suggested was based Philosophy and Public Affairs (1983) 205, 207-208 Page 5
  • 6.
    BACKGRoUND The international advisorypanel Dr Bates Gill of experts Director, Stockholm International Peace Research Institute (SIPRI), Sweden As with all composite indexes of this type, with Dr Ian Anthony and Dr Ekaterina there are issues of bias and arbitrariness in the Stepanova factors that are chosen to assess peace and, as seriously, in assigning weights to the different Dr Ronald J. Horvath indicators (measured on a comparable Honorary Associate, School of Geosciences and meaningful scale) to produce a single University of Sydney, Australia synthetic measure. In order to minimise Dr Linda S. Jamison these slants, the choices of indicators and Dean, Abshire-Inamori Leadership Academy the weights assigned to them were agreed and Senior Fellow following close and extensive consultation Center for Strategic and International Studies with the following international panel of (CSIS), USA experts in 2009: Dr Manuela Mesa Professor Kevin P. Clements, Chairperson Director, Center for Education and Peace Foundation Chair of Peace and Conflict Research (CEIPAZ) and Studies and President, Spanish Association for Peace Director, National Centre for Peace and Research (AIPAZ), Spain Conflict Studies Dan Smith University of otago, New Zealand Author, in a private capacity Professor Sultan Barakat Paul van Tongeren Director, Post-war Reconstruction and Secretary General, Global Partnership for the Development Unit (PRDU) Prevention of Armed Conflict (GPPAC), Department of Politics, University of York, The Netherlands United Kingdom Page 6
  • 7.
    M E TH o D o L o G Y A N D D ATA S o U R C E S The indicators GPI 2008. All ranking and score changes between the 2009 GPI and 2008 GPI are Twenty-three indicators of the existence or on the basis of these enhanced measuring absence of peace were chosen by the panel of techniques. experts (see page 9), which are divided into three broad categories: measures of ongoing A detailed explanation of the scoring criteria domestic and international conflict, measures used for each indicator is supplied in of safety and security in society and measures Annex A to this paper. of militarization. All scores for each indicator Measures of ongoing domestic have now been “banded”, either on a scale and international conflict of 1-5 (for qualitative indicators) or 1-10 (for The Global Peace Index is intended as a quantitative data, such as military expenditure review of the state of peace in nations over or the jailed population, which have then been the past year, although many indicators are converted to a 1-5 scale for comparability based on available data from the last two when compiling the final index). Qualitative years. The panel of experts decided against indicators in the index have been scored by including data reflecting a country’s longer- the Economist Intelligence Unit’s extensive term historical experience of domestic and team of country analysts, and gaps in the international conflict on the grounds that the quantitative data have been filled by estimates GPI uses authoritative statistics on ongoing by the same team. civil and trans-national wars collated by Indicators consisting of quantitative data institutes such as the Uppsala Conflict such as military expenditure or jailed Data Program and the International Peace population have been measured on the Research Institute, oslo. These, combined basis of the distribution of values across with two indicators scored by the Economist all countries between the maximum and Intelligence Unit’s analysts, comprise five of minimum values (we assume that the 144 the 23 indicators: countries measured for the Global Peace • Number of external and internal conflicts Index are a representative sample of all fought: 2002-07 countries). Each of the indicator’s data set has been divided into ten bands based on • Estimated number of deaths from the full range of the data set and a country’s organized conflict (external) corresponding score results in its position • Number of deaths from organized conflict in the distribution. Each indicator’s range (internal) between the maximum and minimum values • Level of organized conflict (internal) has now been anchored in time based on • Relations with neighbouring countries data collected for the 2008 Global Peace Index. This is a change to the measurement methodology used in previous versions of the GPI and a detailed description is provided in Annex A. In order to make comparable and fair assessments over time, the 2009 methodology has been used to recalculate Page 7
  • 8.
    M E TH o D o L o G Y A N D D ATA S o U R C E S Measures of societal safety and security • Number of armed services personnel per 100,000 people Ten of the indicators assess the levels of safety and security in a society (country), • Volume of transfers (imports) of major ranging from the perception of criminality conventional weapons per 100,000 people in society, to the level of respect for human • Volume of transfers (exports) of major rights and the rate of homicides and violent conventional weapons per 100,000 people crimes. Crime data is from the UN office • Funding for UN peacekeeping missions: of Drugs and Crime. The difficulties of outstanding contributions versus annual comparing international crime statistics are assessment to the budget of the current discussed in detail in Annex A. Five of these peacekeeping missions indicators have been scored by the Economist Intelligence Unit’s team of country analysts: • Aggregate number of heavy weapons per 100,000 people • Perceptions of criminality in society • Ease of access to small arms and light • Number of displaced people as a weapons percentage of the population • Military capability/sophistication • Political instability Weighting the index • Level of disrespect for human rights (Political Terror Scale) The panel of experts apportioned scores based on the relative importance of each of • Potential for terrorist acts the indicators on a 1-5 scale. The consensus • Number of homicides per 100,000 people scores for each indicator are given in table 1. • Level of violent crime Two sub-component weighted indices were • Likelihood of violent demonstrations then calculated from the GPI group of indicators: • Number of jailed population per 100,000 people 1 a measure of how at peace internally a country is; • Number of internal security officers and police per 100,000 people 2 a measure of how at peace externally a country is (its state of peace beyond its Measures of militarization borders). Eight of the indicators are related to a The overall composite score and index was then country’s military build-up – reflecting the formulated by applying a weight of 60% to the assertion that the level of militarization measure of internal peace and 40% for external and access to weapons is directly linked to peace. The heavier weight applied to internal how at peace a country feels internationally. peace was agreed within the panel of experts, Comparable data are readily available from following robust debate. The decision was sources such as the International Institute of based on the innovative notion that a greater Strategic Studies (IISS): level of internal peace is likely to lead to, or at • Military expenditure as a percentage of least correlate with, lower external conflict. GDP Page 8
  • 9.
    Weight Indicator (1 to 5) Internal Peace 60% External Peace 40% Perceptions of criminality in society 4 Number of internal security officers and police per 100,000 people 3 Number of homicides per 100,000 people 4 Number of jailed population per 100,000 people 3 Ease of access to weapons of minor destruction 3 Level of organized conflict (internal) 5 Likelihood of violent demonstrations 3 Level of violent crime 4 Political instability 4 Respect for human rights 4 Volume of transfers of major conventional weapons, 2 as recipient (Imports) per 100,000 people Potential for terrorist acts 1 Number of deaths from organized conflict (internal) 5 Military expenditure as a percentage of GDP 2 Number of armed services personnel per 100,000 people 2 Funding for UN peacekeeping missions 2 Aggregate number of heavy weapons per 100,000 people 3 Volume of transfers of major conventional weapons as supplier 3 (exports) per 100,000 people Military capability/sophistication 2 Number of displaced people as a percentage of the population 4 Relations with neighbouring countries 5 Number of external and internal conflicts fought: 2002-07 5 Estimated number of deaths from organized conflict (external) 5 Table 1 Page 9
  • 10.
    A N ALY S I S o F T H E R E S U LT S Table 2 provides the GPI rankings for the 144 countries in 2009. Countries most at peace are ranked first. Those countries shaded green are in the top 20%; those shaded red are in the bottom 20%. Rank Country Score Rank Country Score 1 New Zealand 1.202 36 Italy 1.648 2 Denmark 1.217 37 Taiwan 1.652 2 Norway 1.217 38 Estonia 1.661 4 Iceland 1.225 39 Vietnam 1.664 5 Austria 1.252 40 Bhutan 1.667 6 Sweden 1.269 40 United Arab Emirates 1.667 7 Japan 1.272 42 Kuwait 1.680 8 Canada 1.311 43 Lithuania 1.687 9 Finland 1.322 44 Tunisia 1.698 9 Slovenia 1.322 45 Laos 1.701 11 Czech Republic 1.328 46 Libya 1.710 12 Ireland 1.333 47 Malawi 1.711 13 Luxembourg 1.341 48 Cyprus 1.737 14 Portugal 1.348 49 Croatia 1.741 15 Belgium 1.359 50 Bosnia and Herzegovina 1.755 16 Germany 1.392 51 Gabon 1.758 16 Qatar 1.392 52 Ghana 1.761 18 Switzerland 1.393 53 Mozambique 1.765 19 Australia 1.476 54 Egypt 1.773 20 Chile 1.481 54 Latvia 1.773 21 oman 1.520 56 Bulgaria 1.775 22 Netherlands 1.531 57 Greece 1.778 23 Singapore 1.533 58 Zambia 1.779 24 Slovakia 1.539 59 Panama 1.798 25 Uruguay 1.557 59 Tanzania 1.798 26 Malaysia 1.561 61 Equatorial Guinea 1.801 27 Hungary 1.575 61 Nicaragua 1.801 28 Spain 1.577 63 Morocco 1.811 29 Costa Rica 1.578 64 Jordan 1.832 30 France 1.579 65 Namibia 1.841 31 Romania 1.591 66 Argentina 1.851 32 Poland 1.599 67 Indonesia 1.853 33 South Korea 1.627 68 Cuba 1.856 34 Botswana 1.643 69 Bahrain 1.881 35 United Kingdom 1.647 70 Dominican Republic 1.890 Table 2 (continued over page) Page 10
  • 11.
    Rank Country Score Rank Country Score 71 Burkina Faso 1.905 111 Guatemala 2.218 72 Madagascar 1.912 112 Honduras 2.265 73 Paraguay 1.916 113 Kenya 2.266 74 China 1.921 114 Azerbaijan 2.327 75 Moldova 1.925 114 Philippines 2.327 75 Albania 1.925 116 Haiti 2.330 77 Nepal 1.939 117 Cote d’ Ivoire 2.342 78 Serbia 1.951 118 Thailand 2.353 79 Peru 1.972 119 Yemen 2.363 80 Senegal 1.984 120 Venezuela 2.381 81 Bolivia 1.990 121 Turkey 2.389 82 Ukraine 2.010 122 India 2.422 83 United States of America 2.015 123 South Africa 2.437 84 Kazakhstan 2.018 124 Mauritania 2.478 85 Brazil 2.022 125 Sri Lanka 2.485 86 Rwanda 2.027 126 Myanmar 2.501 87 Trinidad and Tobago 2.035 127 Burundi 2.529 88 Macedonia 2.039 128 Ethiopia 2.551 89 Mongolia 2.040 129 Nigeria 2.602 90 Bangladesh 2.045 130 Colombia 2.645 91 Montenegro 2.046 131 North Korea 2.717 92 Syria 2.049 132 Lebanon 2.718 93 Papua New Guinea 2.059 133 Central African Republic 2.733 94 El Salvador 2.068 134 Georgia 2.736 95 Cameroon 2.073 134 Zimbabwe 2.736 96 Mali 2.086 136 Russia 2.750 97 Guyana 2.098 137 Pakistan 2.859 98 Belarus 2.103 138 Chad 2.880 99 Iran 2.104 Democratic Republic 139 2.888 100 Angola 2.105 of the Congo 101 Turkmenistan 2.110 140 Sudan 2.922 102 Jamaica 2.111 141 Israel 3.035 103 Uganda 2.140 142 Somalia 3.257 104 Saudi Arabia 2.167 143 Afghanistan 3.285 105 Cambodia 2.179 144 Iraq 3.341 106 Congo (Brazzaville) 2.202 106 Uzbekistan 2.202 108 Mexico 2.209 109 Ecuador 2.211 110 Algeria 2.212 Page 11
  • 12.
    A N ALY S I S o F T H E R E S U LT S A regional overview Table 3.1 Western Europe is markedly the most peaceful Overall Overall Regional Western Europe Rank Score Rank region, with the majority of the countries Denmark 2 1.22 1 in this group ranking in the top 20 overall. Norway 2 1.22 1 France, the United Kingdom, Italy, Cyprus Iceland 4 1.23 3 and Greece fare the least well of the Western Austria 5 1.25 4 European nations, with deteriorations in the Sweden 6 1.27 5 scores for both Greece (a fall of 8 places) and Finland 9 1.32 6 Italy (3 positions). Greece’s score for political Ireland 12 1.33 7 instability rose, reflecting the travails of the Luxembourg 13 1.34 8 scandal-hit centre-right New Democracy Portugal 14 1.35 9 (ND) party. The ruling party’s fortunes Belgium 15 1.36 10 faded further in late 2008, amid a week of Germany 16 1.39 11 rioting in Athens and Thessaloniki that was Switzerland 18 1.39 12 sparked by the death of a 15-year-old boy Netherlands 22 1.53 13 who was shot by a police officer. In Italy, a Spain 28 1.58 14 rise in the indicator measuring perceptions of France 30 1.58 15 criminality in society was linked to a focus on United Kingdom 35 1.65 16 rising illegal immigration and violent crime, Italy 36 1.65 17 frequently blamed on immigrants, in the April Cyprus 48 1.74 18 2008 election campaign. Fairly high levels of Greece 57 1.78 19 militarization, sophisticated weapon industries Average 20 1.43 and arms exports in the UK and France contribute to their relatively low scores. Page 12
  • 13.
    In Central andEastern Europe, the recent Table 3.2 members of the European Union generally Central and Overall Overall Regional fare well, with Slovenia leading the way in Eastern Europe Rank Score Rank 9th place, followed by Czech Republic (11th Slovenia 9 1.32 1 position), although Estonia, Hungary, Latvia Czech Republic 11 1.33 2 and Poland all experienced falls of at least five Slovakia 24 1.54 3 places in this year’s index. Countries in the Hungary 27 1.58 4 Caucasus and Central Asia are accorded low Romania 31 1.59 5 ranks, as last year, and Russia slips to 136th Poland 32 1.60 6 place, reflecting high scores for the majority Estonia 38 1.66 7 of indicators, notably on measures of internal Lithuania 43 1.69 8 peace with high scores for homicides, the Croatia 49 1.74 9 Bosnia and jailed population, perceived criminality, 50 1.76 10 Herzegovina violent crime and respect for human rights. Latvia 54 1.77 11 Bulgaria 56 1.77 12 Moldova 75 1.92 13 Albania 76 1.93 14 Serbia 78 1.95 15 Ukraine 82 2.01 16 Kazakhstan 84 2.02 17 Macedonia 88 2.04 18 Montenegro 91 2.05 19 Belarus 98 2.10 20 Turkmenistan 101 2.11 21 Uzbekistan 106 2.20 22 Azerbaijan 115 2.33 23 Turkey 121 2.39 24 Georgia 134 2.74 25 Russia 136 2.75 26 Average 70 1.92 Page 13
  • 14.
    A N ALY S I S o F T H E R E S U LT S The Asia Pacific region is on average the Table 3.3 third most peaceful region (behind North Overall Overall Regional Asia-Pacific America), but it exhibits wide variation. Rank Score Rank The region’s oECD nations rank highly, with New Zealand 1 1.20 1 New Zealand coming first overall and Japan Japan 7 1.27 2 seventh, a two-pronged impact of very strong Australia 19 1.48 3 scores for overall domestic peace and low Singapore 23 1.53 4 levels of militarization. With the exception of Malaysia 26 1.56 5 Japan, the top seven Asia/Pacific countries all South Korea 33 1.63 6 rose in the rankings this year, led by Malaysia Taiwan 37 1.65 7 which climbed by 5 places to 26th position. Vietnam 39 1.66 8 Bhutan 40 1.67 9 ongoing internal conflicts and related security Laos 45 1.70 10 concerns in Afghanistan, Pakistan and Sri Indonesia 67 1.85 11 Lanka contribute to their low rankings, China 74 1.92 12 while in North Korea and Myanmar very Nepal 77 1.94 13 high levels of militarization are key factors. Mongolia 89 2.04 14 Thailand and the Philippines are ranked Bangladesh 90 2.04 15 higher than these nations, but their relatively Papua New 93 2.06 16 low scores reflect elevated levels of crime and Guinea internal disharmony. Cambodia 105 2.18 17 Philippines 114 2.33 18 Thailand 118 2.35 19 India 122 2.42 20 Sri Lanka 125 2.48 21 Myanmar 126 2.50 22 North Korea 131 2.72 23 Pakistan 137 2.86 24 Afghanistan 143 3.28 25 Average 75 2.01 Page 14
  • 15.
    Latin America alsoexhibits a broad Table 3.4 spread, led by Chile and Uruguay (as last Overall Overall Regional Latin America year), although both countries fell slightly Rank Score Rank in rankings, to 20th and 25th positions Chile 20 1.48 1 respectively. Costa Rica’s high ranking in Uruguay 25 1.56 2 the GPI (it rose 6 places this year to 29th Costa Rica 29 1.58 3 place) partly reflects very low scores for all Panama 59 1.80 4 measures of militarization apart from the Nicaragua 61 1.80 5 accessibility of small arms and light weapons, Argentina 66 1.85 6 in step with the abolition of the country’s Cuba 68 1.86 7 army at the end of the civil war in 1948. Dominican 70 1.89 8 Republic Colombia and Venezuela remain in the Paraguay 73 1.92 9 bottom 25, with high scores in the majority Peru 79 1.97 10 of their measures of safety and security and Bolivia 81 1.99 11 fairly high levels of militarization. Brazil 85 2.02 12 Trinidad and 87 2.04 13 Tobago El Salvador 94 2.07 14 Guyana 97 2.10 15 Jamaica 102 2.11 16 Mexico 108 2.21 17 Ecuador 109 2.21 18 Guatemala 111 2.22 19 Honduras 112 2.26 20 Haiti 116 2.33 21 Venezuela 120 2.38 22 Colombia 130 2.65 23 Average 83 2.01 Page 15
  • 16.
    A N ALY S I S o F T H E R E S U LT S The countries of the Middle East and North Table 3.5 Africa are broadly ranked in the bottom half Middle East and Overall Overall Regional of the GPI, with war-torn Iraq the least at North Africa Rank Score Rank peace, as last year. Israel’s low rank reflects Qatar 16 1.39 1 its very high levels of militarization as well oman 21 1.52 2 as the Israel Defence Force’s incursion into United Arab 41 1.67 3 Emirates Gaza in late December 2008 and very tense Kuwait 42 1.68 4 relations with neighbouring countries. Tunisia 44 1.70 5 Yemen’s fall of 13 places to 119th position Libya 46 1.71 6 reflects a sharply worsening security Egypt 54 1.77 7 situation. Qatar and oman are, by contrast, Morocco 63 1.81 8 ranked in the top 25 of the GPI, with low Jordan 64 1.83 9 levels of militarization by regional standards Bahrain 69 1.88 10 and fairly low scores for most measures of Syria 92 2.05 11 safety and security in society. Iran 99 2.10 12 Saudi Arabia 104 2.17 13 Algeria 110 2.21 14 Yemen 119 2.36 15 Lebanon 132 2.72 16 Israel 141 3.04 17 Iraq 144 3.34 18 Average 78 2.05 Page 16
  • 17.
    Sub-Saharan African nationsare generally Table 3.6 placed in the bottom half of the index, Overall Overall Regional Africa with conflict-ravaged Somalia, Sudan, the Rank Score Rank Democratic Republic of the Congo (DRC), Botswana 34 1.64 1 Chad and Zimbabwe all lying in the GPI’s Malawi 47 1.71 2 bottom ten. Botswana fares best, in 34th Gabon 51 1.76 3 position, as a result of minimal militarization, Ghana 52 1.76 4 an absence of external or internal conflicts Mozambique 53 1.77 5 and relatively low scores for most measures Zambia 58 1.78 6 of safety and security, although the homicide Tanzania 59 1.80 7 rate is high. Malawi is in the top 50 for Equatorial 61 1.80 8 Guinea broadly similar reasons, with a lower Namibia 65 1.84 9 homicide rate than in Botswana, but a higher Burkina Faso 71 1.91 10 score for political instability. Madagascar falls Madagascar 72 1.91 11 30 places from its relatively high position last Senegal 80 1.98 12 year, amid mounting political instability and Rwanda 86 2.03 13 the outbreak of violent demonstrations. Cameroon 95 2.07 14 Mali 96 2.09 15 Angola 100 2.10 16 Uganda 103 2.14 17 Three of the world’s major military- Congo 106 2.20 18 (Brazzaville) diplomatic powers (the European Union could Kenya 113 2.27 19 be considered the 4th) continue to register Cote d’ Ivoire 117 2.34 20 relatively low ranks, with China at 74th, the South Africa 123 2.44 21 US at 83rd and Russia at 136th. The US rose Mauritania 124 2.48 22 six places from last year, partly as a result of Burundi 127 2.53 23 an improvement in its measures of political Ethiopia 128 2.55 24 stability and a fall in the indicator registering Nigeria 129 2.60 25 the potential for terrorist acts. Most measures Central African 133 2.73 26 of militarization are still accorded very high Republic scores and the country still jails a higher Zimbabwe 134 2.74 27 proportion of its population than any of the Chad 138 2.88 28 other 143 nations in the GPI. Members of the DRC 139 2.89 29 G8 apart from Russia, the UK and the US do Sudan 140 2.92 30 better, with Japan at 7th place, Canada at 8th Somalia 142 3.26 31 and Germany at joint 16th. Average 96 2.22 Page 17
  • 18.
    T H ET E N M o S T AT P E A C E New Zealand: 1st place although plans for a joint Trans-Tasman Score: 1.202 agency for the regulation of drugs and therapeutic goods were shelved in mid-2007 New Zealand is ranked the nation most at owing to a lack of agreement on the issue peace of the 144 ranked in the 2009 Global among New Zealand political parties. Peace Index. Its rise from 3rd position in 2008 is partly explained by an increase in New Zealand’s measures of militarization the score for political stability, following the continue to receive very low scores – military election of a new coalition government in expenditure fell back to 1.07% of GDP in November 2008. The centre-right National 2007 (latest available figures), which is a Party has a strong popular mandate and lower proportion than Norway and Finland, a robust parliamentary majority by New but higher than Denmark and Iceland. Zealand’s standards, putting the new prime Concerns have been raised in New Zealand minister, John Key, in a good position that its low level of military spending could to push through his agenda. The rise to compromise the ability of the 8,600-strong first position is also related to the fall of New Zealand Defence Force (NZDF) to meet Iceland from the top spot last year, which all its objectives, which include its alliance reflects the deterioration in its indicators of commitments to Australia and maintaining political stability, the likelihood of violent security in the South Pacific. New Zealand is demonstrations and perceived criminality accorded a low score for its exports of major in the wake of the banking collapse that conventional weapons–slightly lower the engulfed the economy in September. score for Norway, Denmark and Finland and considerably below the score for Sweden. Most aspects of safety and security in society, including the likelihood of violent demonstrations, the homicide rate and the Denmark: equal 2nd place level of respect for human rights receive Score: 1.217 the lowest possible scores (unchanged from Denmark remains in second position in last year), although the proportion of the the GPI in 2009. It is politically stable and population in jail is higher than any of the enjoys good relations with its neighbours. Nordic nations. New Zealand maintains Rates of violent crime and homicide are low, harmonious relations with neighbouring violent demonstrations are highly unlikely to countries, notably Australia, links with occur and there is a high level of respect for which are underpinned by the 1983 Closer human rights. Although Denmark abandoned Economic Relations (CER) agreement. its policy of neutrality in 1949 to become Augmenting the single-market agreement a member of NATo, it has maintained a is a Trans-Tasman Travel Agreement, relatively modest level of defence contribution which allows citizens of New Zealand and and refuses to allow nuclear weapons on its Australia to travel, work and live freely soil in peacetime. Military expenditure as a in either country. Steps are also being percentage of GDP is very low and exports taken towards greater harmonisation of major conventional weapons are notably of competition policy, and banking and lower than in Sweden and Norway. accountancy regulations with Australia, Page 18
  • 19.
    The indicator forimports of major Norway’s measures of militarization conventional weapons rose slightly compared receive low scores in a broad international with that in the 2008 GPI, but not sufficiently comparison, and military expenditure as a to alter Denmark’s overall position when percentage of GDP has fallen to the same other countries near the top of the GPI, level as the other Nordic countries surveyed, notably Iceland, experienced a greater including Denmark, which is also a NATo deterioration in a wider range of indicators. member. Access to small arms and light The government, led by Anders Fogh weapons remains highly restricted. Norway’s Rasmussen (Liberal Party), lent strong direct military role in the international support to the intervention in Iraq in March struggle against terrorism following the 2003, and around 500 Danish troops were September 11th 2001 attacks on the US present in Iraq from June 2003 until they has been limited, although important were withdrawn in August 2007. Along for Norwegian forces. The change in the with the other Nordic states, Denmark has nature of threats to security in the Western contributed both equipment and training Hemisphere has altered the priorities of to help the Baltic States establish stronger Norwegian defence. Instead of being chiefly military capacities for peacekeeping. geared to counter a Russian invasion, the military is adopting a more flexible structure. A reform process has been under way since Norway: equal 2nd place 2002 and the active peacetime military Score: 1.217 force is being gradually cut by at least 5,000 Norway receives the same score as Denmark troops (from about 26,600 at the outset) and in the 2009 GPI, putting the country in joint the military intends to dispose of one-third second place, compared with third position of its property. last year. The country’s high rank reflects the continued absence of internal conflict and Iceland: 4th place the fact that involvement in external conflicts Score: 1.225 is limited to peacekeeping roles. Relations between Norway and its neighbouring Iceland falls from first position in the Scandinavian countries, with which it shares 2008 GPI to 4th place this year, amid an a strong cultural and linguistic heritage, are unprecedented collapse in the country’s very good. Indeed, close co-operation with financial system and currency that was the other Nordic countries is a cornerstone of triggered by international financial turmoil Norway’s foreign policy. The rate of violent in September and october 2008. Subsequent crime is very low, there is a strong level of protests on the streets of the capital, respect for human rights, the political scene is Reykjavik, which eventually brought about stable and violent demonstrations are highly the demise of the coalition government led by unlikely to occur, all of which indicate a Geir Haarde in January 2009, was reflected harmonious society. in a rise in the scores for political instability and the likelihood of violent demonstrations, albeit from very low levels. The indicator Page 19
  • 20.
    T H ET E N M o S T AT P E A C E measuring perceptions of the level of accorded a score of 2 in Dalton and Gibney’s criminality also increased, contributing to the Political Terror Scale (measuring the level of modest drop in the overall rankings. other respect for human rights), which is higher indicators remain unchanged compared with than any of the other countries in the top ten last year; the proportion of citizens who are of the GPI. in jail is still one of the lowest of the 144 Austria’s military expenditure as a percentage countries surveyed, although there are more of GDP is amongst the lowest of the 144 internal security officers and police per head countries surveyed and there was a year- than in Denmark and Finland. on-year reduction in the number of internal A member of NATo since its inception in security officers and police in 2008. The 1949, Iceland has no standing army, which volume of imports of major conventional means it continues to receive the lowest weapons fell considerably from the high possible scores for most of the measures of level in 2007-08 that was associated with militarization, although the score for military the (domestically) controversial procurement capability/sophistication is relatively high of 18 Typhoon interceptor aircraft from the on account of the nation’s well equipped European Aeronautic Defence and Space Coast Guard. In April 2007 the Icelandic Company (EADS). This fall contributed government signed peacetime security co- considerably to Austria’s rise of five places in operation agreements with its Norwegian the rankings this year, offsetting the slight rise and Danish counterparts, which mainly in Austria’s indicator for political stability, focus on monitoring the North Atlantic. which reflected escalating tensions between Iceland’s UN peacekeeping deployments are the Social Democratic Party (SPÖ) and the the work of the Icelandic Crisis Response Austrian People’s Party (ÖVP) over tax and Unit (ICRU), which was founded in 2001 healthcare reforms. The grand coalition and comprises a team including police eventually collapsed in July 2008 after just officers, doctors and engineers. 18 months. Since 1995 Austria has been a member Austria: 5th place of NATo’s Partnership for Peace (PfP) Score: 1.252 programme, which has led to small numbers of its troops operating in Serbia (KFoR) and Neutral since the end of Soviet occupation Afghanistan (ISAF). In 2002 Austria adopted of part of the country in 1955, Austria is a new foreign-policy doctrine, which allows politically stable and free of civil unrest. The for greater involvement in collective security country continues to enjoy good relations arrangements without formally abandoning with neighbouring states, which includes Austria’s constitutionally enshrined neutrality. support for Croatia’s bid to join the European Community. Levels of violent crime are very low, as is the homicide rate. The proportion of the population in jail is also low, although slightly higher than that recorded in the Nordic countries and Japan. Austria is Page 20
  • 21.
    Sweden: 6th place significant fall in the homicide rate and drops Score: 1.269 in scores for some countries ranked above Sweden last year – notably Ireland, which slid Sweden is politically stable, free from civil seven places. unrest and it enjoys harmonious relations with neighbouring countries. Human rights are accorded a high level of respect, according Japan: 7th place to Dalton and Gibney’s index, and the jailed Score: 1.272 population is one of the lowest in the world. Japan’s 7th position in the 2009 GPI Measures of societal safety and security represents a fall of two places from last year. such as the level of violent crime and the The country has remained free from civil likelihood of violent demonstrations are low unrest and measures of societal security such (and unchanged since last year). According to as the level of violent crime, the likelihood UN Surveys of Crime Trends and operations of violent demonstrations and the rate of of Criminal Justice Systems, the number of homicides are among the lowest in the homicides fell in 2007/08. world – receiving correspondingly low The majority of Sweden’s measures of scores in the 2008 GPI that did not change militarization receive very low scores; the in 2009. Respect for human rights is high small amount of military expenditure as and stringent laws prohibit the possession a percentage of GDP and low numbers of of firearms. Japan has generally been stable armed service personnel is a reflection of since the turbulence that followed the end of the country’s long-standing neutrality. The the Second World War. The score for political tradition of military non alignment continues, instability remained unchanged in 2008, although the commitment to neutrality has although it had increased the previous year been loosened since early 2002 and there in response to the scandal-hit premiership of has arguably been a shift towards NATo. Shinzo Abe of the Liberal Democratic Party, Sweden is a member of the NATo-initiated who was forced to resign as prime minister Partnership for Peace (PfP) programme and in July 2007 when the resurgent opposition troops participate in peacekeeping operations refused to back his reformist agenda. in Afghanistan, Chad, the Balkans and the Japan’s low level of military expenditure Democratic Republic of the Congo, with UN as a percentage of GDP reflects the ban on mandates. Sweden receives a notably high maintaining war potential that was enshrined score for one measure of militarization in the in the 1946 constitution. Nevertheless, the GPI, however, that of the volume of transfers annual defence budget is sizeable (around of major conventional weapons as a supplier. US$48bn) and Japan’s Self-Defence Forces The country has developed a thriving arms (SDF) are highly sophisticated. They have industry through firms such as Saab Bofors increasingly been deployed on international Dynamics and its status as one of the world’s humanitarian and peacekeeping missions, top exporters of weapons per head is the including, controversially within Japan, to main reason for its relatively low rank among Iraq in December 2003. An arms export ban Scandinavian countries. Sweden’s rise to sixth that dated back to 1946 was overturned in position this year appears to be the result of a Page 21
  • 22.
    T H ET E N M o S T AT P E A C E 2004, although subsequent exports have stationed at Kandahar had been killed, since been on a relatively small scale. All measures the mission began in 2002. Despite these of militarization remained unchanged year setbacks, the Conservative administration on year. won parliamentary approval in 2008 to extend the mission in Afghanistan until 2011, but rising casualties and public confusion Canada: 8th place about the purpose of the mission have raised Score: 1.311 doubts about Canada’s role. Politically stable, free from internal conflict, with low levels of violent crime and few violent demonstrations, Canada’s scores Finland: equal 9th place for societal safety and security are low and Score: 1.322 broadly mirror those of the Nordic countries. Finland is politically stable, free of civil The proportion of the population in jail rose unrest and not at war with any other country. slightly compared with the 2008 GPI and Relations with neighbouring countries are it remains higher than in the Scandinavian harmonious and the level of violent crime nations, but it is far lower than in the US. is very low – unchanged from last year – offsetting the rise in the jailed population although the homicide rate is higher than in was an improvement in the score for the level the other Nordic countries. other measures of respect for human rights, which is one of of safety and security in society including the factors behind Canada’s rise into the top the proportion of the population in jail and ten countries most at peace in the 2009 GPI. perceptions of criminality are very low, Access to small arms is far more restricted while human rights are accorded a high level than in the US and almost all of the measures of respect. The potential for terrorist acts of militarization are accorded much lower is considered to have diminished in 2008, scores in Canada than in its southern although it remains slightly higher than the neighbour. Since Canada’s three separate other Scandinavian countries apart from armed forces were reorganized into the Denmark. Canadian Armed Forces (CAF) in 1964 the Since the end of the cold war, Finland defence budget has declined as a proportion has professed a policy of strategic non- of overall government spending, in line with alignment and chosen not to apply for a diminishing perceived threat from the NATo membership, despite the fact that the Warsaw Pact. The CAF’s two bases in West three nearby Baltic States joined in 2004. Germany were closed in the early 1990s and The Finnish government has adopted an the military was increasingly associated with essentially neutral approach to the conflict international peacekeeping missions. Canada in Iraq; it has refrained from sending troops has more than 2,500 troops in Afghanistan, and is not included in the US list of countries as part of NATo’s International Security eligible to bid for contracts for reconstructing Assistance Force (ISAF). The Canadians are Iraq. However, Finland is involved in at the forefront of actions against the Taliban the NATo Partnership for Peace (PfP) and by April 2009 116 of the 2,500 troops programme and has supplied troops to the Page 22
  • 23.
    NATo-led force inAfghanistan – 80 remain in the 2009 GPI, coupled with the slide of in 2009, a slight reduction on last year. nations including Ireland and Portugal, Military spending as a proportion of GDP ranked higher than Slovenia last year. Low stays low at 1.29% of GDP in 2007 (latest scores characterize most aspects of Slovenia’s available figure), but higher than in Denmark measures of militarization – the 7,200-strong and Iceland. army accounts for a low proportion of GDP. A small contingent of 70 soldiers is in Afghanistan and others are restricted Slovenia: equal 9th place to various NATo and UN peacekeeping Score: 1.322 missions, most notably in Kosovo, where Slovenia became an independent nation Slovenia deploys around 350 troops. The in July 1991 after a brief conflict with the present government is considering decreasing Yugoslav People’s Army, avoiding most of the the Slovenian presence in other international turmoil that engulfed the former Yugoslavia peacekeeping missions. in the early 1990s and experiencing relative political stability under a 12-year spell of centre-left coalition government led by the Liberal Democracy of Slovenia from May 1992. The score for political instability is lower than that of any other country in the Balkans in the 2009 GPI, although it rose slightly compared with last year, reflecting tensions emerging from the constituents of the coalition government that has been led by Borut Pahor of the Social Democrats since September 2008. Relations with neighbouring countries are good, although Slovenia’s score of 2 is lower than that of the Nordic countries as a result of an ongoing maritime border dispute with Croatia. Several measures of safety and security in Slovenian society receive the lowest possible scores: namely the level of violent crime, the proportion of the population in jail and the rate of homicides, although violent demonstrations are considered to be more likely than in neighbouring Austria. The number of internal security officers and police per head fell significantly in 2008, which is one of the reasons for the country’s move into the top ten most at peace nations Page 23
  • 24.
    T H ET E N L E A S T AT P E A C E Globally, war-torn Iraq is classified as the the potential for terrorist acts all receive the least at peace out of 144 countries, followed highest possible scores (unchanged from last by Afghanistan. year). The proportion of the population who are displaced rose to almost 8%, according to latest statistics from the UNHCR, higher Iraq: 144th place even than Afghanistan. As a result of Score: 3.341 rising violence, some 1.5 million Iraqis are War-torn Iraq remains the lowest-ranked now thought to live in Syria, with another nation of the GPI. The indicator for the level 500,000-750,000 in Jordan. “Sectarian of organized conflict within the country cleansing” – most notably in the capital, stays at the highest possible score (5) in this Baghdad, but also elsewhere – by insurgent year’s GPI; 9,204 Iraqis were killed in 2008 and militia groups has led to an estimated 2.2 according to Iraqi Body Count, as were 322 million internally displaced persons (IDPs). Coalition troops. Some 946 Iraqis died in the Fearful of reprisals, or in the face of explicit first four months of 2009. Mosul remains threats, most IDPs have withdrawn from an urban stronghold for al-Qaida, and the mixed areas to those that are more religiously Iraqi security forces, despite their successes homogenous. In addition, many Iraqis have elsewhere, have largely failed to clear fled to the more stable Iraqi Kurdistan region. insurgents from Diyala governorate. Iraq is a highly militarized country, the Iraq’s score for political stability has legacy of Saddam Hussein’s steady build-up improved since last year, albeit from a low of forces from his time as head of security in base, in line with a substantial enhancement the ruling Ba’ath Party in the 1970s. The GPI of the position of the prime minister, Nouri score for its military capability sophistication al-Maliki, following a series of Iraqi army has increased this year, in line with the Iraqi offensives in early 2008 in Basra, Baghdad, Army’s recent purchase of sophisticated and Amarah against elements within the US weaponry, including General Dynamics Mahdi Army (a militia ostensibly loyal to Abrams tanks, Lockheed Martin M-16 fighter Moqtada al-Sadr, a radical Shia cleric). jets and Bell helicopters. The crackdown on Shia militia’s has also precipitated thawing relations with neighbouring Arab countries (the score for Afghanistan: 143rd place this indicator falls from 4 to 3), and most of Score: 3.285 them have now reopened their embassies in Embroiled in conflict and instability for Baghdad, although mutual suspicions remain. much of the past two decades, Afghanistan Despite these improvements, and an easing remained far from unified during 2008, security situation since mid-2007, ongoing experiencing an intensification of fighting tensions and violence is far higher in Iraq between the NATo-supported Afghan than in most countries and the GPI’s measures National Army (ANA) and a Taliban- of safety and security in society mirror backed insurgency that has spread well this: the level of trust in other citizens, the beyond its stronghold in the south and homicide rate, the level of violent crime and east of the country. The GPI scores for the Page 24
  • 25.
    number of deathsin organized conflict, the militarization, such as the number of armed level of violent crime and the likelihood of services personnel per 100,000 people, violent demonstrations all rose significantly military expenditure as a percentage of GDP – reflecting reports that as many as 5,400 and the aggregate number of heavy weapons people were killed in 2008, making it the per head receive fairly low scores. The bloodiest year since the beginning of this official army, the ANA, is small, with around conflict in 2001. The upsurge in violence 35,000 members in mid-2008, and vastly contributed to the country’s fall in the overall understaffed relative to the security challenges GPI rankings in 2009, which was also the it faces. result of a slight rise in Sudan’s overall score from last year. Somalia: 142nd place An estimated three million Afghan refugees Score: 3.257 have returned to their country since 2002, Somalia has not had a nationally functioning mainly from settlements in neighbouring state government since its descent into civil Pakistan, but around two million Afghans war in 1991. The UN estimates that around are still displaced, which is the second- one million people of an estimated population highest proportion of a population in the of 8.5 million have been displaced by the 144 countries surveyed (behind Bhutan). In ongoing conflict, which remains one of the 2008 Pakistan agreed to postpone the closure largest proportions in the 144 countries of Afghan refugee camps and extended the in the GPI even though the latest available deadline for the repatriation of two million figures from the UNHCR (2007) point to a refugees to Afghanistan beyond 2009. fall in the number of displaced people. More Relations with most neighbouring countries than a dozen peace agreements have been are tense. Most of the other measures of brokered between the warring factions since safety and security in society receive very 1991, but none have brought about political high scores in the GPI, notably the number stability or restored security. The GPI score of homicides, the level of violent crime, the for political instability increased slightly potential for terrorist acts and perceptions in 2008, reflecting an upsurge in fighting of criminality in society. The political between Islamist insurgents loyal to the Union scene is highly unstable – the president, of Islamic Courts (UIC) and the Transitional Hamid Karzai, has experienced repeated Federal Government (TFG) of Somalia, which assassination attempts and public support spread beyond the capital, Mogadishu, to the is fragile. Many people feel that their living Galgaduud, Muudug and Hiiran regions. conditions are worsening, owing to a lack of The deteriorating security situation has jobs and basic necessities such as electricity, coincided with a growing number of violent clean water, hospitals and food. Afghanistan’s pirate attacks off the coast of Somalia (more GPI score for respect for human rights is the than 100 were recorded in 2008); disrupting worst possible. one of the world’s busiest shipping lanes. Small arms and light weapons are This year’s rise in the GPI score for the readily available, but other measures of number of deaths from organized conflict also Page 25
  • 26.
    T H ET E N L E A S T AT P E A C E mirrors attacks by insurgents on the African Indicators of societal safety and security in Union (AU) troops stationed in Somalia, Israel present a mixed picture, as last year. which prompted the UN Security Council on the one hand, the level of violent crime to extend their mandate by six months from and the number of homicides are low, violent February 2008. Not surprisingly, almost all demonstrations are unlikely to occur and the of Somalia’s measures of safety and security political scene is reasonably stable (becoming are accorded the highest possible scores. The slightly more so during 2008). on the other exceptions are indicators such as the number hand, terrorist acts are likely, even though of internal security officers and police per the threat diminished slightly in 2008 and head of population and the proportion of the criminality is perceived to be high. Military population in jail, on account of the country’s expenditure in Israel as a percentage of GDP lack of civil institutions. fell in 2008, but at 7.1% it remains among the highest in the world. Despite a drop in the number of armed service personnel per Israel: 141st place head in 2008, Israel’s score for this indicator Score: 3.035 remains at the highest possible level (only Despite peace treaties with Egypt in 1982 North Korea comes close). The IDF is and with Jordan in 1994, Israel remains in highly sophisticated and Israel is a major a formal “state of war” with its northern manufacturer and exporter of arms. Imports neighbours, Syria and Lebanon, and with of major conventional weapons increased, much of the Arab world. Relations with according to the most recent figures from Lebanon have been tense since the war in the Stockholm International Peace Research July and August 2006 (known in Israel as Institute, further contributing to a very high the Second Lebanon War and in Lebanon as score for Israel’s measures of militarization the July War). The GPI indicator measuring in the GPI. relations with neighbouring countries remains unchanged at “4” on a scale of 1-5; defined as “aggressive, open conflict with violence Sudan: 140th place and protests”. The level of organized internal Score: 2.922 conflict is recorded as “high”, and unchanged Sudan’s lowly position in the GPI reflects from last year, reflecting continued Israeli/ the continued bloodshed and deepening Palestinian tensions that were manifested in humanitarian crisis in the western region of sustained rocket attacks from Gaza (controlled Darfur, as well as rekindled tensions between by the Islamist group, Hamas, since June the north and south of the country. The 2007) on towns in southern Israel in 2008 and Darfur conflict began in early 2003, when the a military offensive in Gaza launched by the Sudan Liberation Movement (SLM) launched Israel Defence Force (IDF) in late December guerrilla attacks on government positions 2008. The IDF’s incursions into Gaza led to in the region, angered by what they saw as the deaths of an estimated 1,300 Palestinians their political and economic marginalisation and 13 Israelis by the time both sides agreed and the Sudanese government’s failure to unilateral ceasefires on January 18th 2009. protect them from attacks by nomadic Arab Page 26
  • 27.
    militias, known asthe janjaweed. The brutal Democratic Republic of the Congo: conflict has forced around 2.7 million people 139th place from their homes, many of them fleeing Score: 2.888 to neighbouring Chad, caused more than The Democratic Republic of the Congo’s 300,000 deaths and left 4.7 million dependent score in the GPI deteriorated significantly on humanitarian aid. Fighting continued in in 2008. This reflected renewed violence in 2008 in spite of the signing of Darfur Peace the eastern province of North Kivu and the Agreement in May 2006 and the presence of outbreak of what the Uppsala Conflict Data a 9,200-strong UN-African Union mission Program (UCDP) classify as a new conflict in Sudan (UNAMIS). The conflict forced in the war-torn country; between the Bundu another 300,000 to flee their homes last year. dia Kongo (Kingdom of Kongo, Bdk) and Additionally, the conflict between the Sudan the government about the orientation of the People’s Liberation Army (SPLA) and the political system in the province of Bas-Congo. government of the National Congress Party Armed clashes between the Congrès national (NCP) about the future status of Southern pour la défense du peuple (CNDP) led by Sudan and the implementation of the 2005 Laurent Nkunda, a renegade Tutsi general, the Comprehensive Peace Agreement (CPA) and the national army, Forces armées de rumbled on in 2008; in mid-May heavy la République démocratique du Congo fighting broke out between Arab tribal militias (FARDC), broke out in North Kivu in late and SPLA troops in the town of Abyei, August and continued more or less unabated emptying it and displacing 50,000 people. until mid-November. The CNDP has also Not surprisingly, measures of safety and been fighting a Rwandan Hutu force based in security in society such as the number of eastern DRC. The humanitarian fallout from homicides, political terror and the number the fighting in North Kivu, has, once again, of displaced people as a percentage of the been devastating, with hundreds of casualties population receive very high scores, although and an estimated 250,000 people fleeing their the latter dropped slightly from last year. homes, many trying to find refuge in the town Political instability increased during 2008, of Goma. The already high level of perceived in line with the International Criminal Court criminality increased in 2008. (ICC) deliberation over whether to issue an Unsurprisingly for a nation that has endured arrest warrant against the president, omar decades of misrule and which has been al-Bashir, who was charged with war crimes frequently wracked by conflict, including a in Darfur by the ICC’s chief prosecutor in civil war between 1998 and 2003 that caused July. In the military sphere, small arms and an estimated three million deaths, almost all light weapons remain highly accessible, while of DRC’s measures of safety and security in military expenditure as a percentage of GDP society receive very high scores. The indicator rose slightly year on year from a moderate measuring potential terrorist acts is an level. exception, with a moderate score (unchanged from last year), notably lower than in Page 27
  • 28.
    T H ET E N L E A S T AT P E A C E Somalia, Iraq, Afghanistan and India. Small The large number of displaced people as a arms and light weapons are readily available, proportion of the population also contributes but the other measures of militarization are to Chad’s low overall rank. Small arms and accorded low scores, in common with most light weapons are easily accessed, but other African countries. measures of militarization, such as military expenditure as a percentage of GDP and military sophistication receive fairly low Chad: 138th place scores. The influx of refugees from Sudan Score: 2.880 and Central African Republic has outstripped Political violence has plagued Chad for much the increase in security personnel (newly of its 48-year history as an independent trained by the UN mission in the country, nation. The country’s very high scores in MINURCAT), leading to a drop in the ratio the GPI’s indicators of ongoing domestic of security officers to population. conflict reflect ongoing violence in the east of the country, close to the border with Sudan and the Central African Republic, which is Pakistan: 137th place linked to the genocide and humanitarian Score: 2.859 crisis in Darfur. The measure of relations with Buffeted by bombings and violent attacks neighbouring countries is not surprisingly linked to a strengthening Islamic insurgency, accorded the highest possible score, sectarian clashes, political turmoil and a unchanged from last year. Fighting in Chad severe economic downturn, it is no surprise escalated in early 2008, when a convoy of that Pakistan slides into the ten nations 300 vehicles carrying around 2,000 rebels ranked least at peace in this year’s GPI. The of the Union of Forces for Democracy nation’s score for relations with neighbouring and Development (UFDD) and the Rally countries has risen two places to level 5, of Forces for Change (RFC) approached primarily in response to the attacks by the capital, Ndjamena, where they were militant Islamists linked to Pakistan-based eventually repelled by government forces. Lashkar-e-Taiba on India’s financial and Against this backdrop, the GPI’s indicators cultural capital, Mumbai, in late November of safety and security in society register very 2008. The terrorist attacks, which left at high scores, notably the homicide rate and least 173 people dead, has led to a sharp the perceived level of criminality. Political escalation of tensions with India and a instability rose from an already high level in renewed international focus on Pakistan’s 2008, amid the growing military threat posed responsibility to rein in locally based to the president, Idriss Déby, by a newly terrorist groups. Relations with neighbouring formed rebel alliance, Union des forces de la Afghanistan also became increasingly résistance (UFR). An expanded UN military strained in 2008 and early 2009, reflecting force in Chad, MINURCAT 2, is not due to growing violence in Pakistan’s North-West be fully operational until october 2009 at Frontier Province, including attacks by the earliest. militants on supplies destined for NATo troops in Afghanistan. Page 28
  • 29.
    Relations with neighbouringcountries was criticism of the scale and manner of Russia’s one of three indicators of ongoing domestic response, including from Ukraine. This and international conflict that deteriorated in predictably pushed up the score measuring 2008, mirroring an alarming rise in suicide Russia’s relations with neighbouring bombings and violent attacks in the North countries to level 4: “Aggressive: open West Frontier Province (NWFP), the Federally conflict with violence and protests.” Violent Administered Tribal Areas (FATA) and demonstrations were also adjudged to have Baluchistan. Violence has also increasingly become more likely to occur in 2008 than the afflicted parts of Punjab, Sindh, and the Gilgit- previous year. Rates of homicide and violent Baltistan region in the past year. According crime remain high and Russians continue to to the India-based Institute for Conflict perceive high levels of criminality (all three Management terrorism-related violence caused indicators are unchanged from last year). 6,715 deaths in Pakistan in 2008 (2,155 of The International Centre for Prison Studies whom were civilians), compared with 3,599 records that a very high proportion of the a year earlier and 189 in 2003, when the Russian population is in jail (second only to country was already being viewed as unstable. the US in the 144 countries surveyed). Small arms and light weapons became even Russia’s military capability has shrunk greatly more readily accessible in 2008, but most since the Soviet era, but it remains powerful; measures of militarization continued to receive its active armed forces totalled just over one relatively low scores, with the exception of million in 2008, compared with 2.7 million in military capability/sophistication, which June 1992 and an estimated 4 million at the remained at level 4, in line with Pakistan’s height of the Soviet Union’s power. Although status as a nuclear-armed state. military expenditure as a percentage of GDP has shrunk considerably in the past decade, Russia: 136th place it remains relatively high and rose by 0.3% Score: 2.750 to 2.5% in 2008. The number of exports of major conventional weapons is extremely Russia slides deeper into the ten countries high (second only to Israel), although it did least at peace this year, falling by three fall slightly during 2008. places to 136th, partly as a result of the dramatic escalation of a simmering conflict with Georgia in August 2008. The effort Zimbabwe: 134th place by Georgian troops launched on August Score: 2.736 7th to retake Georgia’s breakaway territory of South ossetia prompted a devastating Years of misrule have precipitated a response from Russian forces, their first humanitarian and economic catastrophe external military engagement since the in Zimbabwe. The country is mired in collapse of the Soviet Union, which extended hyperinflation, 80% unemployment and deep into Georgia. The brief, but intense, a collapsing infrastructure, and waves of war that left around 370 Georgians and brutal land-reform programmes and political 80 Russians dead, prompted international violence have forced hundreds of thousands Page 29
  • 30.
    T H ET E N L E A S T AT P E A C E from their homes. GPI scores for measures of ongoing domestic and international conflict are very high, and the level of organized conflict (internal) rose in 2008, reflecting an upsurge in political violence surrounding the presidential election on 29th March. The score for relations with neighbouring countries also rose, in line with mounting criticism, notably from the leaders of Botswana and Zambia. In November 2008, Botswana foreign minister, Phandu Skelemani, called for all countries bordering Zimbabwe to close their borders with the country, to ‘bring down Robert Mugabe’s government’. Most measures of safety and security in society are predictably high, and scores for the likelihood of violent demonstrations and the level of violent crime rose slightly, while more marked hikes occurred in the indicators for political instability, perceptions of criminality and the potential for terrorist acts. Rises also occurred in two of Zimbabwe’s measures of militarization: military expenditure as a percentage of GDP (which rose to 9.3%, the highest level of any African country) and ease of access to small arms and light weapons. All of this contributed to a considerable deterioration in the country’s state of peace, bringing about a fall of ten positions in the 2009 GPI to a rank of 134th place. Page 30
  • 31.
    THE ToP FIVERISERS IN THE 2009 GPI Bosnia and Herzegovina Angola Change in rank: +23 Change in rank: +16 Overall rank: 50 Overall rank: 100 Bosnia’s rise to 50th position in the 2009 Angola’s impressive rise to 100th position in GPI follows an impressive rise last year, the 2009 GPI is owing to improvements in which mainly reflected improvements in the the scores of seven indicators, five of which scores for measures of safety and security in relate to safety and security in society: an society. This year, a notable fall in the number increasingly stable political scene, a lower of displaced people as a proportion of the chance of violent demonstrations, less violent population (as recorded by the UNHCR) crime, a reduction in the number of displaced was a key factor – around one million people people and an improvement in the level of have returned to Bosnia and Herzegovina respect for human rights. Much-delayed since the end of the war in December 1995, legislative elections held in September 2008 a three-and-a-half-year conflict that resulted resulted in a resounding victory for the ruling in some 200,000 deaths and displaced an Movimento Popular de Libertação de Angola estimated 2.2 million people, almost one-half (MPLA). Notwithstanding complaints about of the country’s population. The number the fairness and conduct of the poll, the of police officers per head of population impressive turnout – estimated at 87% – has also fell compared with last year, amid the given the government the strong democratic gradual restructuring of the separate Serb and mandate that it lacked. The MPLA now holds Muslim-Croat police forces. In April 2008 191 out of 220 seats in the National Assembly, parliament approved long-debated reforms giving it the two-thirds majority needed to to ostensibly centralise the two police forces, push through changes to the constitution. As which cleared the way for the signing of a a result, the former rebel movement, União stabilisation and association agreement (SAA) Nacional para a Independência Total de with the EU in June. Bosnia’s homicide rate, Angola (UNITA), has lost what little power it the number of deaths resulting from internal had in government and is in danger of losing conflict and the country’s military expenditure all relevance as an opposition party. as a percentage of GDP all dropped compared The formal ending of a long-running conflict with their scores in the 2008 GPI. An even in the oil-rich enclave of Cabinda (fewer than more significant rise in the rankings was 25 battle-related deaths in the year following curtailed, however, by rises in the scores for a peace agreement between the government the likelihood of violent demonstrations and and one faction of the Frente para a terrorist acts, the former linked to heightened Libertação do Enclave de Cabinda (FLEC) in political tension surrounding local elections in July 2006) also contributes to Angola’s rise october and a slowing economy. in the GPI rankings. By 2008 80-90% of the former FLEC fighters had been demobilized or joined the army, although sporadic attacks on government forces by the FLEC-FAC faction were recorded during the year. Page 31
  • 32.
    THE ToP FIVERISERS IN THE 2009 GPI Congo (Brazzaville) Egypt Change in rank: +15 Change in rank: +13 Overall rank: 106 Overall rank: 54 The 14-point rise of Congo (Brazzaville) Egypt’s rise reflects an improvement in three in the GPI rankings is chiefly the result indicators measuring safety and security in of improvements in the country’s scores society: growing political stability, greater registering the level of internal conflict levels of trust between citizens and a fall in and the level of perceived criminality. the extent of political terror (suggesting an This reflected a year in which a fragile improvement in the human rights situation), peace between so-called Ninja rebels and albeit from a very high level (4 in Dalton government security forces held firm – there and Gibney’s Political Terror Scale) last year. were no reported clashes in the rebel’s The improved score for political stability stronghold of Pool (a southern region reflects the continuing rule of the national between the capital, Brazzaville, and the Democratic Party (NDP), which was returned port city of Pointe Noire) or elsewhere. The with a reduced, but still substantial, majority rebels fought a violent insurgency against in the December 2005 general election. The Congo’s government in the late 1990s secular opposition has been largely ineffective which killed thousands, displaced around in pressing for greater political plurality, while 90,000 and devastated much of the region’s the Muslim Brotherhood’s quest for power infrastructure. Although a peace deal was has been quashed by the arrests of activists signed in 2003 sporadic violence has since and leaders and amendments to Egypt’s plagued the Pool region, with rebels robbing constitution that prohibit political parties civilians and hijacking trains to the oil-rich based on religion, gender or ethnicity. coast. In 2007 the former rebel leader, Pasteur Beset by allegations of cronyism and Ntoumi, renounced violence and created incompetence, the NDP has recently been his own political party, Conseil national des overhauled by the president’s son, Gamal républicains (CNRe). Although it has some Mubarak, who has attempted to introduce support in certain areas of the Pool region, greater discipline and coherence, as well as it has so far failed to obtain strong political bringing younger, more in-touch figures to representation. Despite the fragile peace prominence at a local level. The improvement and Congo’s rise in the rankings, several in the score for greater trust between citizens measures of safety and security in society are partly reflects a fall in tensions surrounding accorded high scores, with violent crime and attacks by militant Islamists – no attacks the homicide rate remaining at level 4 and have taken place since those at Dahab in contributing to the country’s overall standing Sinai in April 2006 that resulted in 20 deaths. of 106th position. The government has attributed the waves of attacks that took place in 2004-06 to “terror cells” of disaffected local Bedouin from North Sinai, which have crossborder links to Palestinian groups in Gaza. Page 32
  • 33.
    Trinidad and Tobago Changein rank: +11 Overall rank: 87 Drops in the scores of four of Trinidad and Tobago’s measures of safety and security in society are behind the country’s 11-point rise in the GPI rankings. Politics is adjudged to have become more stable during 2008 following the general election in November 2007, which observers considered generally free and fair and which resulted in an increased majority for the People’s National Movement (PNM). The party, led by Patrick Manning, picked up 26 seats in a newly expanded 41-seat parliament, although it fell short of the two-thirds majority needed to push through all of Mr Manning’s proposed constitutional changes unopposed. The indicator measuring the likelihood of violent demonstrations registered a fall in 2008, reflecting a year that was largely free of demonstrations, in contrast to 2007, when, in January, there were a series of protests at soaring crime rates and a two-day national shutdown. The demonstrations were sparked by the kidnapping of the country’s highest profile businesswoman, Vindra Naipul- Coolman. Trinidad and Tobago’s jailed population fell in 2008 and respect for human rights rose, according to Dalton and Gibney’s Political terror scale – with the score falling from 3 to 2. Nevertheless, violent crime continued to be the leading political issue in 2008. The murder rate reached an all-time annual high of 527 in mid-December, almost 50% higher than a year earlier. The number of robberies and kidnappings also rose. This has not been picked up in the GPI as Trinidad’s scores for violent crime and the homicide rate were already at 5, the highest possible level, contributing to the country’s overall low ranking of 87th. Page 33
  • 34.
    T H ET o P F I V E FA L L E R S I N T H E 2 0 0 9 G P I Madagascar Latvia Change in rank: -30 Change in rank: -16 Overall rank: 72 Overall rank: 54 Madagascar’s dramatic fall of 30 places Rising political instability in late 2008 from its position as the second-highest and an increase in the measure of internal ranked African nation in last year’s GPI conflict were the key factors behind Latvia’s comes amid a two-point rise in the measure substantial fall in the GPI rankings this of internal conflict and increased political year. The four-party centre-right coalition instability following several weeks of violent government led by the prime minister, Ivars Godmanis, since December 2007 struggled protests and the deaths. Political tensions to cope with the fallout of an unprecedented had been mounting between the president, nosedive in the country’s economy, triggered Marc Ravalomanana, and the opposition by the international banking crisis of mayor of the capital, Antananarivo, Andry September 2008. The credit crunch hit Latvia Rajoelina, since the mayor rapidly emerged particularly hard, owing to the country’s as a political force after his surprise election large external imbalances coupled with in 2007. The government’s attempts to its currency peg to the euro, which forced undermine Rajoelina’s control of the capital, the government to turn to the IMF and a which included blocking the disbursal of consortium of European countries for a loan funds and closing the mayor’s radio and TV to cover its ballooning current-account deficit station, Viva TV, triggered mass protests. and underpin the currency. A large protest These became increasingly violent after against the government in the capital, Riga, in government guards opened fire on a crowd mid-January 2009 spilled over into the most of protesters outside the presidential palace, serious rioting in Latvia since independence. killing 28 people. The president was forced The beleaguered government was eventually to step down on 17th March and Rajoelina forced to resign in late February 2009 after assumed power with military backing, amid two coalition partners withdrew their support widespread international condemnation. for Mr Godmanis. Most of Madagascar’s measures of militarization continued to receive very low scores in the 2009 GPI (unchanged from last year) although military expenditure as a proportion of GDP rose slightly to 1.1%. Page 34
  • 35.
    Mexico South Africa Change in rank: -16 Change in rank: -15 Overall rank: 108 Overall rank: 123 Mexico’s slide in the rankings to 108th position Waves of violence that swept through South reflects deterioration in six measures of safety Africa’s Gauteng townships in May 2008 and security in society since last year, including left at least 42 people dead, more than a one-point hike in the score for violent crime 200 injured and around 15,000 homeless. and smaller rises in the potential for terrorist Destitute Zimbabweans and other immigrants acts, violent demonstrations and in perceived (who are thought to number around one criminality. This follows an escalation in violence million in Gauteng and more than three linked to Mexican drug cartels, notably in and million nationwide) were targeted by violent around the cities of Tijuana, Culiacan and Cuidad mobs – blamed for taking advantage of Juarez. Mexican officials say 6,290 people were already scarce housing, jobs and public killed in the violence in 2008, a significant year- services and for contributing to rising crime on-year rise. Drug gangsters and security forces and insecurity. The escalation in violence clashed on an almost daily basis. In May, three has damaged South Africa’s post-apartheid of Mexico’s top anti-crime investigators were reputation for tolerance and openness. In the assassinated and several high ranking security GPI, this is reflected in rises in two indicators: officers resigned and fled to the US. In late a two-point climb in the measure of the August almost 500,000 people protested against level of internal conflict and an increase in drug-related violence in Mexico City, which perceived criminality (to 4 on a scale of 1-5). was followed by the president, Felipe Calderón, The homicide rate and the level of violent announcing a budget increase of almost 40% in crime are both accorded the highest possible security and justice expenditure for next year. The scores, unchanged from last year, although proportion of the population in jail rose in 2008. they are counterbalanced by relatively low The ongoing drug-related violence (which has scores for measures of militarization, with been on the rise since the mid-1990s, catalyzed the exception of military capability and by a traumatic economic crisis and exacerbated sophistication. by pervasive corruption and criminality in law- enforcement institutions) was probably a factor in the deterioration in the GPI indicator charting political instability. The other likely culprit is Mexico’s economy, which slumped in late 2008, leading to the loss of 386,000 formal-sector jobs in November and December alone, according to the Ministry of Labour. Mr Calderón and his minister of finance, Agustín Carstens, have been facing mounting criticism from the main opposition parties, which accuse the government of failing to provide an adequate response to rising unemployment. Page 35
  • 36.
    T H ET o P F I V E FA L L E R S I N T H E 2 0 0 9 G P I Yemen 16 people. Kidnappings also increased during Change in rank: -13 2008 and in early 2009. Yemen’s relations Overall rank: 119 with neighbouring countries remain fairly tense – the score stays at 3 this year. This is Five of Yemen’s measures of safety and underlined by the fact that Yemen’s security security in society deteriorated in 2008, problems are not entirely home-grown. The contributing to a 13-place fall in the Israeli blockade of and subsequent assault on GPI rankings to a lowly 119th position. the Gaza Strip has resulted in mass protests A heightened level of violent crime, an in support of the Palestinians. Yemen’s increased likelihood of terrorist attacks and proximity to Somalia has also added to the violent demonstrations, growing perceptions security problems confronting the authorities, of criminality in society and dwindling respect not least through the smuggling of weapons for human rights reflects an escalation in to and from the war-torn state. The GPI three broad conflicts across the country: measure of the ease of access to weapons The decade-long contretemps between the of minor destruction remains at the highest Believing Youth Movement of Shia rebels possible level in 2008. Given that the two- led by the al-Houthi clan in northern way traffic is marine-based, it comes as little Saada governorate and the government; an surprise that Yemenis are also suspected of ongoing rebellion of several al-Qaida-linked being involved in the increase in piracy in the groups over the orientation of the political Gulf of Aden. Yemen’s military spending as system; and secessionist rebellions among a percentage of GDP remains high at 2.5% southern tribesmen resentful of the northern- (unchanged from last year); in common with dominated regime. most other Middle Eastern nations, but most Militant activity by Islamist guerrillas is other measures of militarization receive fairly linked to the return to Yemen of men who low scores. had been recruited to fight against Soviet occupation in Afghanistan. It is widely alleged that an agreement between the government and al-Qaida in Yemen (AQY) – in which the group agreed to conduct its operations outside the country, in return for immunity inside Yemen – caused a lull in militant activity, but this broke down in mid-2007, apparently when a younger cadre of militants took over the leadership of the group. Subsequently, a spate of attacks has occurred, mainly on Western targets. In January three people were killed in an attack on a tourist convoy and the Italian and US embassies were both the targets of bombers – an attack on the latter by Islamic Jihad in September killed Page 36
  • 37.
    I N VE S T I G AT I N G T H E S E T o F P o T E N T I A L D E T E R M I N A N T S The GPI is a numerical measure of how at peace a country is with itself and other countries. It is a foundation on which to establish a measure of the incidence of peace. However, it cannot on its own explain why these absences occur and whether groups of countries exhibit sufficient similar deficiencies resulting in an absence of peace. In addition to the collation of data and scores for the 23 indicators listed on page 9 (Table 1), the Economist Intelligence Unit has updated for the third year its secondary dataset of 33 drivers including democracy, government competence and efficacy; the strength of institutions and the political process; international openness; demographics; regional integration; religion and culture; education and material well- being. Full descriptions for each of these indicators are provided in Annex B. The list of potential drivers is by no means exhaustive; it comprises indicators with data that are both available across the countries from credible sources and are comparable and consistent in their measurement. Table 4 lists each of the indicators in the two groups, the GPI and the pool of potential drivers. Correlation coefficients of the GPI scores and ranks and then the scores for the internal and external measures of peace are given against each indicator. The correlation coefficients are calculated across the full 144 countries. Values shaded in green are for values where r >0.5 and r <-0.5, generally considered a valid correlation. Page 37
  • 38.
    I N VE S T I G AT I N G T H E S E T o F P o T E N T I A L D E T E R M I N A N T S oVERALL oVERALL Internal External SCoRE RANK Peace Peace oVERALL SCoRE 1.00 0.96 0.97 0.62 oVERALL RANK 0.96 1.00 0.95 0.53 Internal Peace 0.97 0.95 1.00 0.40 External Peace 0.62 0.53 0.40 1.00 Level of distrust in other citizens 0.75 0.73 0.76 0.36 Number of internal security officers and police per 100,000 people 0.05 0.06 0.07 -0.03 Number of homicides per 100,000 people 0.62 0.62 0.70 0.04 Number of jailed population per 100,000 people 0.11 0.13 0.06 0.20 Ease of access to weapons of minor destruction 0.73 0.73 0.78 0.22 Level of organized conflict (internal) 0.83 0.81 0.82 0.46 Likelihood of violent demonstrations 0.67 0.69 0.74 0.13 Level of violent crime 0.65 0.68 0.75 0.01 Political instability 0.77 0.78 0.78 0.36 Respect for human rights 0.85 0.84 0.84 0.46 Volume of transfers of major conventional weapons, as recipient (Imports) -0.07 -0.12 -0.14 0.19 per 100,000 people Potential for terrorist acts 0.63 0.58 0.59 0.44 Number of deaths from organized conflict (internal) 0.72 0.60 0.66 0.55 Military expenditure as a percentage of GDP 0.35 0.28 0.24 0.53 Number of armed services personnel per 100,000 people 0.25 0.18 0.12 0.51 UN Funding 0.33 0.31 0.31 0.23 Aggregate number of heavy weapons per 100,000 people 0.14 0.09 0.02 0.45 Volume of transfers of major conventional weapons as supplier (exports) per -0.06 -0.10 -0.16 0.28 100,000 people Military capability/sophistication -0.08 -0.10 -0.22 0.40 Number of displaced people as a percentage of the population 0.26 0.14 0.23 0.22 Relations with neighbouring countries 0.73 0.69 0.63 0.71 Number of external and internal conflicts fought 0.28 0.25 0.13 0.61 Estimated number of deaths from organized conflict (external) 0.15 0.14 0.02 0.48 Political Democracy Index -0.56 -0.57 -0.57 -0.27 Electoral process -0.38 -0.39 -0.38 -0.20 Functioning of government -0.65 -0.65 -0.66 -0.32 Political participation -0.46 -0.49 -0.48 -0.17 Political culture -0.64 -0.65 -0.68 -0.21 Civil liberties -0.50 -0.50 -0.48 -0.32 Corruption perceptions (CPI score: 10 = highly clean, 0 = highly corrupt) -0.71 -0.78 -0.77 -0.19 Women in parliament (as a percentage of the total number of representatives -0.30 -0.32 -0.31 -0.14 in the lower house) Freedom of the press 0.50 0.51 0.49 0.29 Exports + Imports % of GDP -0.12 -0.14 -0.11 -0.08 Foreign Direct Investment (flow) % of GDP -0.19 -0.20 -0.17 -0.17 Number of visitors as % of domestic population -0.42 -0.45 -0.44 -0.16 Net Migration (% of total population) -0.24 -0.32 -0.28 -0.02 15-34 year old males as a % of total population 0.39 0.46 0.44 0.05 Gender ratio of population: women/men -0.07 -0.08 -0.06 -0.07 Gender Inequality -0.43 -0.44 -0.44 -0.17 The extent of regional integration 0.64 0.64 0.64 0.35 Current education spending (% of GDP) -0.29 -0.28 -0.30 -0.10 Primary school enrolment ratio (% Net) -0.51 -0.44 -0.53 -0.18 Secondary school enrolment ratio (% Net) -0.52 -0.53 -0.59 -0.05 Higher education enrolment (% Gross) -0.49 -0.54 -0.57 -0.02 Mean years of schooling -0.61 -0.62 -0.65 -0.19 Adult literacy rate (% of pop over 15) -0.50 -0.47 -0.52 -0.18 Hostility to foreigners/private property 0.63 0.61 0.66 0.25 Importance of religion in national life 0.47 0.48 0.48 0.20 Willingness to fight 0.37 0.37 0.29 0.41 Nominal GDP (US$PPPbn) -0.06 -0.05 -0.12 0.16 Nominal GDP (US$bn) -0.11 -0.11 -0.17 0.14 GDP per capita -0.58 -0.64 -0.63 -0.15 Gini Index 0.39 0.43 0.48 -0.07 Unemployment % 0.24 0.21 0.26 0.07 Life expectancy -0.54 -0.55 -0.60 -0.10 Infant mortality per 1,000 live births 0.54 0.53 0.57 0.17 Table 4 Page 38
  • 39.
    With reference tochanges since last year and the year before, the extension of the data to 144 countries has largely verified and endorsed our initial findings from 2007 and 2008. Those series with high correlations to the GPI in previous years, measured against the 144 countries maintain their significance threshold of +/- 0.5 hinting at a constant relationship over time between these indicators and the GPI. of the listed variables, the overall index continues to be strongly determined by the internal measure of peace with r = 0.97. of the set of potential drivers, the composite measure of political democracy remains significant at r=-0.56, slightly less than last year. Unsurprisingly a number of that index’s sub-components calculate as having a reasonable correlation with the overall scores and rankings. Functioning of government – a qualitative assessment of whether freely elected representatives determine government policy and whether there is an effective system of checks and balances on the exercise of government authority – almost maintains its correlation at r=-0.65. Electoral process and political participation remain just below +/-0.5. Interestingly the external peace measure is not significantly correlated to any of our measures relating to democracy. our measure of the freedom of the press, compiled by Reporters Without Borders dips slightly back below our +/-0.5 threshold, although exceeds it at 0.51 when measured against the rankings rather than the GPI scores. For all the following charts, the GPI score is shown on the left-hand axis. Page 39
  • 40.
    I N VE S T I G AT I N G T H E S E T o F P o T E N T I A L D E T E R M I N A N T S Political Democracy Index against OVE R AL L S C OR E 1.0 2.0 3.0 4.0 5.0 6.0 7.0 8.0 9.0 10.0 11.0 1.00 New Zealand ay Denmark Norw Iceland Japanustria A Sw eden Slovenia Canada Finland Czech Republic Luxembourg Ireland Portugal Belgium Qatar Germany Sw itzerland Chile A ustralia Oman Singapore Slovakia Netherlands 1.50 Malaysia UruguaySpain RomaniaHungary France Poland Costa Rica South Korea BotswEstonia an Kingdom ana Italy UnitedV ietnam A rab Emirates Kuw ait Bhutan Taiw United Laos Tunisia Lithuania Libya Malaw i Croatia Cyprus Gabon Egypt Bosnia and Hercegovina Mozambique Ghana Bulgaria Latvia Zambia Tanzania Nicaragua Panama Greece Equatorial Guinea Morocco Jordan Namibia A rgentina Cuba Indonesia Bahrain Dominican Republic China Burkina FasoNepal Madagascar Paraguay A lbania Moldova Senegal PeruSerbia Bolivia UkraineBrazil Kazakhstan Rw anda United States of A merica Syria Bangladesh Papua Mongolia Macedonia Trinidad and Tobago Montenegro 2.00 Cameroon New Guinea Mali El Salvador Turkmenistan Iran Belarus A ngola Guyana Jamaica Uganda Saudi A rabia Cambodia Uzbekistan Congo (Brazzaville) A lgeria Guatemala Mexico Ecuador Kenya Honduras A zerbaijan Cote d' Ivoire Haiti Philippines Y emen Thailand V enezuela Turkey India South A frica Mauritania Sri Lanka Myanmar Burundi Ethiopia 2.50 Nigeria Colombia Central A frican Republic Georgia Lebanon Zimbabw e Russia Chad Pakistan Democratic Republic of the Congo Sudan Israel 3.00 Somalia A fghanistan Iraq 3.50 Figure 1: Democracy and overall GPI score Page 40
  • 41.
    F unctioning ofgovernment against OVE R AL L S C OR E 1.0 2.0 3.0 4.0 5.0 6.0 7.0 8.0 9.0 10.0 11.0 1.00 New Zealand Denmark Norw ay Iceland A ustria Sw eden Japan Czech Republic Slovenia Canada Finland Portugal Ireland Luxembourg Belgium Qatar Germany Sw itzerland A ustralia Chile Oman Slovakia Singapore Netherlands 1.50 Malaysia RomaniaHungary Poland France SpainUruguay Costa Rica South Korea Botsw an United A rab Emirates V ietnam Bhutan Italy Taiw ana Estonia United Kingdom Tunisia Laos Kuw ait Lithuania Libya Malaw i Cyprus Croatia Gabon Bosnia and Hercegovina Egypt Ghana Mozambique Bulgaria Latvia Tanzania Zambia PanamaGreece Equatorial Guinea MoroccoNicaragua Jordan Namibia Cuba rgentina A Indonesia Bahrain Dominican Republic Burkina Faso China Madagascar Paraguay Moldova Nepal A lbania Serbia Peru Senegal Bolivia Kazakhstan Rw anda Macedonia Ukraine United States of A merica Brazil Syria BangladeshMontenegro Trinidad and Tobago Mongolia 2.00 Cameroon Mali Guyana Papua New Guinea El Salvador Belarus ngola Iran A Jamaica Uganda Saudi A rabia Cambodia Congo (Brazzaville) A lgeria Ecuador Mexico Guatemala Kenya Honduras Cote d' Ivoire Haiti Philippines Y emen Thailand V enezuela Turkey India South A f rica Mauritania Sri Lanka Myanmar Burundi Ethiopia 2.50 Nigeria Colombia Central A f rican Republic North Korea Lebanon Russia Pakistan Sudan Israel 3.00 Somalia 3.50 Figure 2: Functioning of government and overall GPI score The indicators for international openness still exhibit no significant correlations despite the expansion of the group of countries under review although the correlation coefficient as measured against the number of tourists as a percentage of the total domestic population to the GPI rankings is getting closer at r = -0.45. our demographic indicators also show no significance at our set thresholds, but the number of males aged 15-34 as a percentage of the population has a relatively high correlation to the Global Peace Index rankings at r = 0.46. Page 41
  • 42.
    I N VE S T I G AT I N G T H E S E T o F P o T E N T I A L D E T E R M I N A N T S C orruption perceptions (C PI score: 10 = highly clean, 0 = highly corrupt) against OVE R AL L S C OR E 1.0 2.0 3.0 4.0 5.0 6.0 7.0 8.0 9.0 10.0 1.00 Norw ay New Zealand IcelandDenmark Japan A ustria Sw eden Slovenia Canada Czech Republic Portugal Ireland Luxembourg Finland Belgium Qatar Germany Sw itzerland Chile A ustralia Oman Netherlands Singapore Slovakia 1.50 Romania Malaysia Costa Rica Hungary Uruguay Spain France Poland SouthBotsw ana Korea V ietnam Italy Bhutan United A an Emirates Estonia Taiw rab United Kingdom Kuw ait Lithuania Tunisia Laos Libya Malaw i Croatia Cyprus MozambiqueGabon Bulgaria Bosnia and Hercegovina Egypt Zambia Ghana Greece Latvia Equatorial Guinea Nicaragua Tanzania Morocco Panama Indonesia A rgentina Namibia Jordan Cuba Dominican Republic Bahrain Paraguay Moldova Burkina Faso Madagascar China A lbania Nepal Serbia Bolivia SenegalPeru Ukraine Rw anda Brazil Kazakhstan United States of A merica PapuaBangladesh Syria Mongolia Macedonia Trinidad and Tobago Montenegro 2.00 NewCameroon Guinea Guyana Jamaica Mali El Salvador Turkmenistan Iran A Belarus ngola Uganda Cambodia Saudi A rabia Congo (Brazzaville) Uzbekistan Ecuador Guatemala Mexico A lgeria Kenya Honduras Haiti A zerbaijan Cote d' Philippines Ivoire Y emen Thailand V enezuela Turkey India South A f rica Mauritania Lanka Sri Myanmar Burundi Ethiopia 2.50 Nigeria Colombia North Central A f rican Republic Korea Lebanon Zimbabw e Russia Georgia Pakistan Chad Democratic Republic of the Congo Sudan Israel 3.00 Somalia A f ghanistan Iraq 3.50 Figure 3: Corruption and overall GPI peace score The measure of corruption within a society from Transparency International continues to have a strong correlation with the overall GPI index (the highest in fact) and the internal peace index scores, despite the annual updates to both. Indeed, this correlation experiences an improvement in significance compared with last year. Page 42
  • 43.
    Gender Inequality againstOVE R AL L S C OR E 0.4 0.5 0.5 0.6 0.6 0.7 0.7 0.8 0.8 0.9 1.00 New Zealand Denmark Iceland Norw ay Japan A ustria Sw eden Slovenia Czech Republic Canada Finland Luxembourg Portugal Belgium Ireland Qatar Sw itzerland Germany Chile A ustralia Oman Singapore Netherlands 1.50 Uruguay Malaysia Hungary Costa Rica France Romania Spain Poland Italy Botsw anaEstonia United Kingdom United A rab Emirates ait Kuw V ietnam Tunisia Malaw i Lithuania Cyprus Croatia Egypt Ghana Mozambique Bulgaria Latvia Zambia Greece Panama Tanzania Morocco Nicaragua Jordan Namibia A rgentinaCuba Indonesia Bahrain Dominican Republic Burkina Faso Madagascar lbania Paraguay China A Moldova Nepal Peru Bolivia United Kazakhstanmerica BrazilUkraineStates of A Bangladesh Syria Trinidad and Tobago Mongolia Macedonia 2.00 Cameroon El Salvador IranAMali ngola JamaicaBelarus Uganda Saudi A rabia Cambodia AGuatemala Mexico lgeria Uzbekistan Ecuador Honduras Kenya A zerbaijan Philippines Y emen Thailand Turkey V enezuela India South A f rica Mauritania Sri Lanka 2.50 Ethiopia Nigeria Colombia Zimbabw Georgia Russia e Pakistan Chad Israel 3.00 3.50 Figure 4: Gender Inequality and overall GPI score A measure of gender inequality, the Gender Gap Index (calculated by the World Economic Forum) continues to miss out on our measure of significance with a r = -0.43, although it has increased from last year. Page 43
  • 44.
    I N VE S T I G AT I N G T H E S E T o F P o T E N T I A L D E T E R M I N A N T S T he extent of regional integration against OVE R AL L S C OR E 0.0 0.5 1.0 1.5 2.0 2.5 3.0 3.5 4.0 4.5 5.0 1.00 Denmark Norw ay New Zealand Iceland Swustria A eden Japan Slovenia Finland Czech Republic Canada Ireland Luxembourg Portugal Belgium Germany Sw Qatar itzerland Chile A ustralia Netherlands Slovakia Oman Singapore 1.50 Hungary France Spain Romania Costa Rica Uruguay Malaysia Poland United Italy Kingdom Botsw ana South Korea Estonia Bhutan United V ietnam A rab ait Taiw an Lithuania Tunisia Kuw Emirates Malaw i Laos Libya Cyprus Croatia Bulgaria Latvia Bosnia and Hercegovina Egypt Gabon Mozambique Ghana Greece Zambia Tanzania Panama Nicaragua Morocco Equatorial Guinea Namibia A rgentina Jordan Indonesia Cuba Dominican Republic Bahrain A lbania Paraguay Moldova China Burkina Faso Madagascar Nepal Serbia Senegal Peru Bolivia United States of A merica Ukraine Macedonia Montenegro TrinidadBrazilTobago Kazakhstan Rw anda Mongolia and Bangladesh Syria 2.00 El Salvador Mali Papua New Guinea Cameroon Guyana Jamaica A ngola Belarus Turkmenistan Iran Uganda Saudi A rabia Cambodia Mexico Guatemala CongoEcuador (Brazzaville) A lgeria Uzbekistan Honduras Kenya Cote d' Ivoire A zerbaijan Philippines Haiti Thailand Y emen V enezuela Turkey South A f rica India Sri Lanka Mauritania Myanmar Burundi Ethiopia 2.50 Nigeria Colombia Lebanon CentralZimbabwRepublic A f rican e North Korea Russia Georgia Pakistan Chad Democratic Republic of the Congo Sudan Israel 3.00 Somalia A f ghanistan Iraq 3.50 Figure 5: Regional integration and overall GPI score The extent of regional integration continues to have a significant correlation with the overall index, but also with the internal measure. This is surprising, as the regional integration score is a qualitative assessment of a country’s relations with its neighbours, and therefore an external metric. To an extent this is explained by the high scores for regional integration in the countries of the European Union and their generally high peace scores. Page 44
  • 45.
    S econdary schoolenrolment ratio (% Net) against OVE R AL L S C OR E 0.0 20.0 40.0 60.0 80.0 100.0 120.0 1.00 New Zealand Iceland Norw ay Denmark A ustria SwJapan eden Slovenia Canada Finland PortugalCzech Republic Ireland Luxembourg Belgium Germany Sw itzerlandQatar Chile A ustralia Singapore Oman Netherlands Slovakia 1.50 Costa Rica Uruguay Malaysia Romania Hungary Poland France Spain Botsw ana South Korea Bhutan V ietnam A rab Emirates United Kuw ait Estonia an United Kingdom Taiw Italy Laos Tunisia Lithuania Malaw i Libya Gabon Bosnia and Hercegovina Croatia Cyprus Mozambique Zambia Ghana Egypt Latvia Bulgaria Greece TanzaniaEquatorial Guinea Morocco Nicaragua Panama Namibia Jordan Indonesia A rgentina Cuba Dominican Republic Bahrain Burkina Faso Madagascar China Paraguay A lbania Moldova Nepal Serbia Senegal Peru Bolivia Rw anda Trinidad and Tobago BrazilUnited States of A merica Ukraine Kazakhstan Macedonia Mongolia Bangladesh Montenegro 2.00 Papua New Guinea Cameroon Mali El Salvador Syria Guyana A ngola Iran Turkmenistan Jamaica Belarus Uganda Cambodia Saudi A rabia Congo (Brazzaville) Guatemala Ecuador Uzbekistan A lgeria Mexico Honduras Kenya Haiti Cote d' Ivoire Philippines A zerbaijan Y emen Thailand V enezuela Turkey India South A frica Mauritania Sri Lanka Myanmar Burundi 2.50 Ethiopia Nigeria Colombia Central A frican Republic North Korea Lebanon Zimbabw e Georgia Russia Pakistan Chad Democratic Republic of the Congo Sudan Israel 3.00 Somalia A fghanistan Iraq 3.50 Figure 6: Secondary school enrolments and overall GPI score The education measures used in the index continue to have significant correlations with the overall GPI. These are, however, likely to be strongly correlated with other measures such as good governance and material well being. Page 45
  • 46.
    I N VE S T I G AT I N G T H E S E T o F P o T E N T I A L D E T E R M I N A N T S Mean years of schooling against OVE R AL L S C OR E 0.0 5.0 10.0 15.0 20.0 25.0 1.00 Denmark ay New Zealand Norw Iceland A ustria Japan eden Sw Canada Czech Republic Slovenia Finland Luxembourg Portugal Ireland Belgium Germany Qatar Sw itzerland Chile A ustralia Oman Singapore Slovakia Netherlands 1.50 Costa RicaMalaysia Uruguay Romania HungaryFrance Spain Poland Botsw ana South Korea Bhutan A rab Emirates United V ietnam Taiw an United Kingdom Italy Estonia Kuw ait Tunisia Lithuania Laos i Malaw Libya Gabon Bosnia and Hercegovina Croatia Cyprus Mozambique Zambia Ghana Egypt Bulgaria Latvia Greece Tanzania Equatorial Guinea Nicaragua Morocco Panama Namibia Jordan Indonesia A rgentina Cuba Dominican Republic Bahrain Burkina Faso Madagascar Paraguay ChinaMoldova Nepal A lbania Serbia Senegal Peru Bolivia Rw anda Ukraine United States of A merica Kazakhstan Trinidad and Tobago Bangladesh Syria Mongolia Brazil Macedonia Montenegro 2.00 Papua New Guinea Mali Cameroon El Salvador A ngola Jamaica Guyana Belarus Turkmenistan Iran Uganda Cambodia Saudi A rabia Congo (Brazzaville) GuatemalaUzbekistanA lgeria Ecuador Mexico Kenya Honduras Haiti Cote d' Ivoire A zerbaijan Philippines Y emen Thailand Turkey V enezuela India South A f rica Mauritania Sri Lanka Myanmar Burundi Ethiopia 2.50 Nigeria Colombia North Korea Central A f rican Republic Lebanon Zimbabw e Georgia Russia Pakistan Democratic Republic Chad Congo of the Sudan Israel 3.00 Somalia A f ghanistan Iraq 3.50 Figure 7: Mean years of schooling and internal peace score Two societal, qualitative assessments scored by the Economist Intelligence Unit’s team of analysts also appear to have a reasonable correlation to the overall score. The first indicator, hostility to foreigners and private property attempts to measure just that, society and government’s general attitude to foreigners and their investments in any given country. This has a high correlation coefficient of r = 0.63. The second is a measure of the importance of religion in national life, both for households and its influence on government policy. This is no longer significant on our measure of internal peace however, measuring just below our threshold, down from last year. Page 46
  • 47.
    log (GDP percapita) against OVE R AL L S C OR E 1.0 10.0 100.0 1000.0 10000.0 100000.0 1000000.0 1.00 New Zealand Norw ay Denmark Iceland A ustria Japan eden Sw Canada Czech Slovenia Finland Luxembourg Republic Ireland Portugal Belgium Germany Sw itzerland Qatar Chile A ustralia Oman Singapore Netherlands 1.50 UruguaySlovakia Malaysia Costa Rica Hungary Spain Romania France Poland Botsw ana South Korea Italy anUnited Kingdom TaiwUnited A rab Emirates V ietnam Bhutan Estonia Kuw ait Laos Tunisia Lithuania Malaw i Libya Croatia Cyprus Mozambique Zambia Bosnia and Hercegovina Latvia Greece Ghana Egypt BulgariaGabon Tanzania Nicaragua Morocco Panama Equatorial Guinea Jordan Namibia A Indonesia Cuba rgentina Burkina Faso Dominican Republic Bahrain Madagascar Moldova China Paraguay A lbania Nepal Serbia Senegal Bolivia Peru Rw anda Ukraine Brazil Kazakhstan United States of A merica Bangladesh New Guinea Macedonia Trinidad and Tobago MongoliaSyria Montenegro 2.00 Papua Cameroon El Salvador Mali Guyana A Iran Turkmenistan ngola Belarus Jamaica Uganda Cambodia Saudi A rabia Uzbekistan (Brazzaville) Congo A lgeria Mexico Ecuador Guatemala Kenya Honduras HaitiCote d' Ivoire Philippines A zerbaijan Y emen Thailand V enezuela Turkey India South A frica Mauritania Sri Lanka Myanmar Burundi 2.50 Ethiopia Nigeria Colombia North Korea e Central A frican Republic Zimbabw Georgia Lebanon Russia Pakistan Chad Democratic Republic of the Congo Sudan Israel 3.00 Somalia A fghanistan Iraq 3.50 Figure 8: GDP per head and overall GPI score The final three indicators of significance are measures of material wellbeing and health. Their significance matches other quantitative investigations in this area of study that have established a causal relationship with GDP per head and these healthcare measures. GDP per capita remains significant against the Global Peace Index in its third year indeed the relationship has strengthened this year with a r = -0.58, higher than the r = -0.57 of last year, (and r = -0.64 against the GPI rankings rather than the scores). The relationship is even more pronounced against the measure of internal peace. There appears to be no relationship, however, to the measure of external peace. Page 47
  • 48.
    I N VE S T I G AT I N G T H E S E T o F P o T E N T I A L D E T E R M I N A N T S L ife expectancy against OVE R AL L SC OR E 30.0 40.0 50.0 60.0 70.0 80.0 90.0 1.00 NewNorw ay Zealand Denmark Iceland A ustria Sw edenJapan Czech Republic Canada Slovenia Finland Ireland Luxembourg Portugal Belgium Qatar Germany Sw itzerland Chile A ustralia Oman Netherlands Singapore Slovakia 1.50 Hungary Uruguay Malaysia Costa Rica Romania Poland France Spain South Korea Botsw ana Taiw A rab Italy United Kingdom Bhutan V ietnam Estonia Lithuania United an Emirates Kuw ait Malaw i Laos Tunisia Libya Croatia Cyprus Bosnia and Hercegovina Mozambique Zambia Gabon Ghana Latvia EgyptBulgaria Greece Equatorial Guinea Tanzania Nicaragua Morocco Panama Namibia Jordan Indonesia A rgentina Cuba Dominican Republic Bahrain Burkina Faso Madagascar Nepal Moldova Paraguay China A lbania Serbia SenegalBolivia Peru Rw anda Kazakhstan and Tobago United States of A merica Ukraine Trinidad Brazil 2.00 Cameroon Mali Papua New Guinea BangladeshMongolia El Salvador Macedonia Montenegro Syria A ngola Guyana Turkmenistan Belarus Iran Jamaica Uganda Cambodia Saudi A rabia Congo (Brazzaville) Uzbekistan GuatemalaA lgeria Mexico Ecuador Kenya Honduras Cote d' Ivoire Haiti Philippines A zerbaijan Y emen Thailand TurkeyV enezuela South A frica India Mauritania Sri Lanka Myanmar Burundi Ethiopia 2.50 Nigeria Colombia Central A frican Republic North Korea Lebanon Zimbabw e Russia Georgia Pakistan Chad Democratic Republic of the Congo Sudan Israel 3.00 Somalia A fghanistan Iraq 3.50 Figure 9: Life expectancy and overall internal peace score Page 48
  • 49.
    Infant mortality per1,000 live births against OVE R AL L S C OR E 1000.0 100.0 10.0 1.0 1.00 New Zealand Norw ay Denmark Iceland A ustria eden Sw Japan Canada Slovenia Czech Finland Ireland Republic Luxembourg Portugal Belgium Qatar Sw itzerland Germany Chile A ustralia Oman Slovakia Netherlands Singapore Uruguay Malaysia Hungary Costa Rica Spain 1.50 Romania Poland France Botsw ana South Korea Bhutan Taiw an United Kingdom Estonia V ietnam United aitrab Emirates Italy Kuw A Lithuania Malaw iLaos Tunisia Libya Croatia Cyprus Mozambique Gabon Zambia Ghana Egypt Bosnia and Bulgaria Latvia Hercegovina Greece Equatorial Guinea Tanzania Nicaragua Panama Morocco Namibia Jordan A rgentina Indonesia Cuba Dominican Republic Bahrain Burkina Faso Madagascar Paraguay lbania China A Nepal Moldova Serbia Senegal Bolivia Peru Ukraine United States of A merica Rw anda Trinidad and Tobago Brazil BangladeshMongolia Kazakhstan Macedonia Montenegro Syria Cameroon New Guinea Papua El Salvador 2.00 A ngola Mali Guyana Iran Turkmenistan Jamaica Belarus Uganda Cambodia Saudi A rabia Congo (Brazzaville) Uzbekistan A lgeria Ecuador Mexico Guatemala Kenya Honduras Cote d'A zerbaijan Ivoire Haiti Philippines Thailand Y emen Turkey enezuela V India South A f rica Mauritania Sri Lanka Myanmar Burundi Ethiopia 2.50 Nigeria Colombia Central A f rican Republic North Korea Lebanon Zimbabw e Georgia Russia Pakistan Chad Democratic Republic of the Congo Sudan Israel 3.00 Somalia A f ghanistan Iraq 3.50 Figure 10: Infant mortality and internal peace score Infant mortality per 1,000 births (shown here as a log scale) is also significant against our measure of overall peace and internal peace. Again this indicator is likely to be highly correlated to a number of the other potential drivers, such as GDP per head. None of the other metrics on material wellbeing and health have correlation coefficients greater than 0.5 or less than -0.5. The gini-coefficient, a measure of income distribution, comes close, especially on our internal measure of peace (r = 0.48). once again, despite the inclusion of 144 countries, it cannot be described as a significant correlation. There are, nevertheless, some problems with the gini coefficient; there is a considerable lag in the publication of statistics for many countries, forcing the Economist Intelligence Unit to estimate the coefficient for a sizeable proportion of the 144 in the GPI. These problems of measurement look likely to persist for the foreseeable future, and the use of other measures of income inequality may be desirable. Page 49
  • 50.
    I N VE S T I G AT I N G T H E S E T o F P o T E N T I A L D E T E R M I N A N T S For each of the calculations carried out there refines the set of determinants to a core set of are some notable outliers, some consistent powerful drivers and predictors. Regression with each measure. These can be seen on the analysis could also provide a tightening of the scatter plots, as those countries frequently weights for future iterations of the GPI. With deviating from the general trend. Commonly each additional year of compiling the datasets listed countries include on the peaceful for the Global Peace Index calculations and side, Qatar (but no longer Bhutan) and, less its set of ‘drivers’ we increase the possibility peacefully, Iraq, Sudan, Israel, Colombia, of testing more robustly the actual causality Lebanon and the US. As outliers they weaken order; do the societal variables really the overall results, but also appear not to drive internal conflict or does it work the be following the general trends established other way round? For example, do rises in for other countries. There are clearly other average incomes and wealth such as GDP factors relating to these countries that are per capita create more peaceful societies, not being captured by the chosen set of or is the emergence of greater internal and determinants. external peace a prerequisite for a take-off in It should be noted that further research is economic growth? Is corruption a symptom needed to establish significant correlations of an absence of peace or its cause? to the measure of external peace. This is This year we have seen tentative signs of a probably attributable to the previously noted causal relationship between our measure observation that there have been very few of the state of peace and the strength of the interstate conflicts within this group of 144 economy. As the global economy was heading countries during the period under review. into a synchronized recession towards the Based on these preliminary investigations, an end of 2008, many of our measures in ordering of influences and drivers would look aggregate deteriorated that year (for example, like Figure 11 on the following page, similar likelihood of violent demonstrations, political to those established in previous years. instability, etc). We expect this relationship to become more pronounced when measuring Based on the last three years of research the GPI next year as economic upheaval carried out on the GPI against the chosen this year impacts on the most economically set of drivers, peaceful societies are those vulnerable countries, with expected political characterized as countries with very low repercussions. levels of internal conflict with efficient, accountable governments, strong economies, cohesive/integrated populations and good relations within the international community. Additional research has been conducted in 2009 (see 2009 Discussion Paper - Peace, its Causes and Economic Value) including factor and discriminant analysis that further Page 50
  • 51.
    Figure 11 Page 51
  • 52.
    ANNEX A Where thequantitative indicators have missing data in the central source, the Economist Intelligence Unit’s analysts have estimated the scores. Measures of ongoing domestic and international conflict Indicator Central Source Year Definition / coding 1 Number of Uppsala Conflict 2002-07 UCDP defines conflict as: “a contested external and Data Program incompatibility that concerns government internal wars (UCDP), University and/or territory where the use of armed fought of Uppsala, Sweden force between two parties, of which at least / International Peace one is the government of a state, results in Research Institute, at least 25 battle-related deaths in a year”. oslo (PRIo) Armed For additional information on this indicator Conflict Dataset see notes on page 55. 2 Estimated UCDP 2007 As above number of deaths from organized conflict (external) 3 Number of International 2007 For additional information on this indicator deaths from Institute for Strategic see notes on page 55. organized conflict Studies, Armed (internal) Conflict Database 4 Level of Economist 2008 Qualitative assessment of the intensity of organized conflict Intelligence Unit conflicts within the country. Ranked 1-5 (internal) (very low-very high) by EIU analysts. 5 Relations with Economist 2008 Qualitative assessment of relations with neighbouring Intelligence Unit neighbouring countries. Ranked 1-5 countries (very low-very high) by EIU analysts. Measures of safety and security in countries Indicator Central Source Year Definition / coding 6 Level of perceived Economist 2008 Qualitative assessment of perceived criminality. criminality in Intelligence Unit Ranked 1-5 (very low-very high) by EIU society analysts. For additional information on this indicator see notes on page 56. 7 Number of UNHCR Statistical 2007 Refugee population by country or territory of displaced people Yearbook 2007 origin, as a percentage of the country’s total as a percentage population. of the population 8 Political Economist 2008 This indicator addresses the degree to which instability Intelligence Unit political institutions are sufficiently stable to support the needs of its citizens, businesses and overseas investors. It is a composite indicator based on the scores, 1 to 5 for each of the following issues: What is the risk of significant social unrest during the next two years? How clear, established, and accepted are constitutional mechanisms for the orderly transfer of power from one government to another? How likely is it that an opposition party or group will come to power and cause a significant deterioration in business operating conditions? Is excessive power concentrated or likely to be concentrated, in the executive so that executive authority lacks accountability and possesses excessive discretion? Is there a risk that international disputes/ tensions will negatively affect the economy and/or polity? Page 52
  • 53.
    Indicator Central Source Year Definition / coding 9 Level of respect Gibney, M., 2007 Countries are coded on a scale of 1-5 for human rights Cornett, L., & according to their level of respect for (Political Terror Wood, R., (year human rights the previous year, according Scale) of publication) to the description provided in the Amnesty Political Terror International and US Department County Scale 1976-2007. Reports. The average of the two scores is Date Retrieved, taken for our assessment. For additional from the Political information on this indicator see notes Terror Scale Web on page 56. site: http://www. politicalterrorscale. org 10 Potential for Economist 2008 Qualitative assessment of the potential for Terrorist Acts Intelligence Unit terrorist acts. Ranked 1-5 (very low-very high) by EIU analysts. 11 Number of UNoDC, 10th, 2006, 2004 Intentional homicide refers to death homicides per 9th (and 8th) UN and 2002 deliberately inflicted on a person by another 100,000 people Survey on Crime (dependent person, including infanticide. For additional Trends and the on information on this indicator see notes on operations of availability) page 56. Criminal Justice Systems (UNCJS) 12 Level of violent Economist 2008 Qualitative assessment of the level of violent crime Intelligence Unit crime. Ranked 1-5 (very low-very high) by EIU analysts. 13 Likelihood Economist 2008 Qualitative assessment of the level of violent of violent Intelligence Unit demonstrations. Ranked 1-5 (very low-very demonstrations high) by EIU analysts. 14 Number of jailed International 2008 For additional information on this indicator population per Centre for Prison see notes on page 57. 100,000 people Studies, King’s College London: World Prison Population List (Eighth Edition) 15 Number of UNoDC, 10th, 2006, 2004 Refers to the civil police force as distinct from internal security 9th (and 8th) and 2002 national guards or local militia. officers and UN Survey of (dependent police per Criminal Trends on 100,000 people and operations of availability) Criminal Justice Systems (UNCJS) Page 53
  • 54.
    ANNEX A Measures ofmilitarization Indicator Central Source Year Definition / coding 16 Military The International 2007, 2008 Cash outlays of central or federal government expenditure as Institute for (dependent to meet the costs of national armed forces – a percentage of Strategic Studies, on including strategic, land, naval, air, command, GDP The Military availability) administration and support forces as well Balance 2009 as paramilitary forces, customs forces and border guards if these are trained and equipped as a military force. We use our own published data on nominal GDP to arrive at the value of military expenditure as a percentage of GDP. 17 Number of The International 2007, 2008 Active armed services personnel comprise armed services Institute for (dependent all servicemen and women on full-time personnel per Strategic Studies, on duty in the army, navy, air force and joint 100,000 people The Military availability) forces (including conscripts and long-term Balance 2009 assignments from the Reserves). 18 Volume of SIPRI Arms 2003-07 The SIPRI Arms Transfers Database covers transfers of major Transfers Project all international sales and gifts of major conventional database conventional weapons and the technology weapons necessary for the production of them. The (imports) per transfer equipment or technology is from 100,000 people one country, rebel force or international organisation to another country, rebel force or international organisation. Major conventional weapons include: aircraft, armoured vehicles, artillery, radar systems, missiles, ships, engines. 19 Volume of SIPRI Arms 2003-07 The SIPRI Arms Transfers Database transfers of major Transfers Project As above. conventional database weapons (exports) per 100,000 people 20 Funding for UN United Nations 2005-07 Calculation of percentage of countries’ peacekeeping outstanding contributions versus annual missions assessment to the budget of the current peacekeeping missions. For additional information on this indicator see notes on page 58. 21 Aggregate Bonn International 2003 The BICC Weapon Holdings Database number of heavy Centre for contains figures for four weapon categories: weapons per Conversion (BICC) armoured vehicles, artillery, combat 100,000 people aircraft, major fighting ships. The numbers of weapons in these categories have been indexed, with 1996 as the fixed base year. Holdings are those of government forces and do not include holdings of armed opposition groups. Weapon systems in storage are also not included. Indices for groups are directly calculated from the aggregated numbers of holdings of heavy weapons. 22 Ease of access to Economist 2008 Qualitative assessment of the ease of access small arms and Intelligence Unit to small arms and light weapons. Ranked 1-5 light weapons (very low-very high) by EIU analysts. 23 Military Economist 2008 Qualitative assessment of the grade of capability / Intelligence Unit sophistication and the extent of military sophistication research and development (R&D) Ranked 1-5 (very low-very high) by EIU analysts. Page 54
  • 55.
    A D DI T I o N A L N o T E S o N T H E I N D I C AT o R S USED IN THE GLoBAL PEACE INDEX 1. Number of external and internal armed conflicts fought: 2003-07 Source: the Uppsala Conflict Data Program (UCDP), Uppsala University, Sweden The separate elements of the definition are as follows: (1) Use of armed force: use of arms in order to promote the parties’ general position in the conflict, resulting in deaths. (1.1) Arms: any material means, e.g. manufactured weapons but also sticks, stones, fire, water, etc. (2) 25 deaths: a minimum of 25 battle-related deaths per year and per incompatibility. (3) Party: a government of a state or any opposition organization or alliance of opposition organizations. (3.1) Government: the party controlling the capital of the state. (3.2) opposition organization: any non-governmental group of people having announced a name for their group and using armed force. (4) State: a state is (4.1) an internationally recognized sovereign government controlling a specified territory, or (4.2) an internationally unrecognized government controlling a specified territory whose sovereignty is not disputed by another internationally recognized sovereign government previously controlling the same territory. (5) Incompatibility concerning government and/or territory the incompatibility, as stated by the parties, must concern government and/or territory. (5.1) Incompatibility: the stated generally incompatible positions. (5.2) Incompatibility concerning government: incompatibility concerning type of political system, the replacement of the central government or the change of its composition. Incompatibility concerning territory: incompatibility concerning the status of a territory, e.g. the change of the state in control of a certain territory (interstate conflict), secession or autonomy (intrastate conflict). 3. Number of deaths from organized conflict (internal) UCDP/PRIO Armed Conflict Dataset records the number of battle deaths per conflict, defined as: “a contested incompatibility that concerns government and/or territory where the use of armed force between two parties, of which at least one is the government of a state, results in at least 25 battle-related deaths in a year”. EIU analysts, then, have scored the figures available for 2007 and 2008 according to the following bands. 1 2 3 4 5 0-24 25-999 1,000-4,999 5,000-9,999 > 10,000 Page 55
  • 56.
    A D DI T I o N A L N o T E S o N T H E I N D I C AT o R S USED IN THE GLoBAL PEACE INDEX 6. Level of perceived criminality in society A qualitative assessment ranked from 1-5 (very low to very high) by the Economist Intelligence Unit’s Country Analysis team. Very low (1): The majority of other citizens can be trusted. Very low levels of domestic security. Low (2): An overall positive climate of trust with other citizens. Moderate (3): Reasonable degree of trust in other citizens. High (4): High levels of distrust in other citizens. High levels of domestic security. Very high (5): Very high levels of distrust in other citizens – people are extremely cautious in their dealings with others. Large number of gated communities, high prevalence of security guards. 9. Respect for Human Rights (Political Terror Scale) Mark Gibney and Matthew Dalton, from University of North Carolina, have coded countries on a 1 to 5 scale according to their level of terror their previous year, based on the description provided in the Amnesty International Yearbook (in this case the 2007 Yearbook, referring to 2006 data). There is an additional index coded on a 1 to 5 scale based on a close analysis of Country Reports from the US State Department. Amnesty International scores have been used where available, with US State Department scores used to fill missing data. • Level 1: Countries under a secure rule of law. People are not imprisoned for their views and torture is rare or exceptional. • Level 2: There is a limited amount of imprisonment for non-violent political activity. However, few persons are affected and torture and beatings are exceptional. Politically- motivated murder is rare. • Level 3: There is extensive political imprisonment, or a recent history of such imprisonment. Execution or other political murders and brutality may be common. Unlimited detention, with or without a trial, for political views is accepted. • Level 4: Civil and political rights violations have expanded to large numbers of the population. Murders, disappearances, and torture are a common part of life. In spite of its generality, on this level political terror affects those who interest themselves in politics or ideas. • Level 5: Terror has expanded to the whole population. The leaders of these societies place no limits on the means or thoroughness with which they pursue personal or ideological goals. 11. Number of homicides per 100,000 people This indicator has been compiled using UNoDC figures in the UN Survey on Crime Trends and the operations of Criminal Justice Systems (UNCJS) (10th, 9th and 8th Surveys of Criminal Trends) rather than Interpol data. The figures refer to the total number of penal code offences or their equivalent, but excluding minor road traffic and other petty offences, brought to the attention of the police or other law enforcement agencies and recorded by one of those agencies. The original Interpol figures reviewed for the first iteration of the Global Peace Index were for 1998/99 and the consensus among experts on the analysis of criminal justice is that the Page 56
  • 57.
    UNoDC figures aremore reliable – they are compiled from a standard questionnaire sent to national officials via the UN statistical office. However, the UN acknowledges that international comparisons of crime statistics are beset by methodological difficulties: • Different definitions for specific crime types: The category in which any incident of victimization is recorded relies on the legal definition of crime in any country. Should that definition be different, which is often the case, comparisons will not be made of exactly the same crime type. This is particularly the case in crimes that require some discretion from a police officer or relevant authority when they are identified. For example, the definitional difference between serious or common assault in different legal jurisdictions may be different, and this will be reflected in the total number of incidents recorded. • Different levels of reporting and traditions of policing: This relates closely to levels of development in a society, most clearly reflected in accessibility to the police. Factors such as the number of police stations or telephones impact upon reporting levels. The level of insurance coverage in a community is also a key indicator of the likelihood of citizens approaching the police as their claim for compensation may require such notification. In addition, in societies where the police are or have been mistrusted by the population, most specifically during periods of authoritarian rule, reporting levels are likely to be lower than in cases where the police are regarded as important members of the community. • Different social, economic and political contexts: Comparing crime data from societies that are fundamentally different may ignore key issues present in the society that impact upon levels of reporting. For example, different social norms in some countries may make it difficult for women to report cases of rape or sexual abuse, while in others, women are encouraged to come forward. The International Crime Victim Survey (ICVS) is perhaps a more sensitive and accurate measure of crime – and arguably offers a picture of how the public views the criminal justice system – but is currently limited to a few, mainly industrialized, countries so these data are not included. Where data are not present, The Economist Intelligence Unit’s analysts have estimated figures based on their deep knowledge of each country. All the figures for homicides per 100,000 people have been banded as: 1 2 3 4 5 0-1.9 2-5.9 6-9.9 10-19.9 > 20 14. Number of jailed population per 100,000 people Figures are from the International Centre for Prison Studies, King’s College, University of London and are compiled from a variety of sources. In almost all cases the original source is the national prison administration of the country concerned, or else the Ministry responsible for the prison administration. The International Centre for Prison Studies warns that because prison population rates (per 100,000 of the national population) are based on estimates of the national population they should not be regarded as precise. Comparability is compromised by different practice in different countries, for example with regard to whether all pre-trial detainees and Page 57
  • 58.
    A D DI T I o N A L N o T E S o N T H E I N D I C AT o R S USED IN THE GLoBAL PEACE INDEX juveniles are held under the authority of the prison administration, and also whether the prison administration is responsible for psychiatrically ill offenders and offenders being detained for treatment for alcoholism and drug addiction. People held in custody are usually omitted from national totals if they are not under the authority of the prison administration. The data have been banded for scoring accordingly: 1 2 3 4 5 0-69 70-139 140-209 210-279 > 280 15. Number of internal security officers and police 100,000 people The original figures have been taken from UNoDC, 10th, 9th and 8th UN Surveys of Criminal Trends and operations of Criminal Justice Systems (UNCJS) and refer to the civil police force as distinct from national guards or local militia. Where there are gaps, then, EIU analysts have filled the gaps based on likely scores from our set bands of the actual data. 1 2 3 4 5 0-199 200-399 400-599 600-799 > 800 20. Funding for UN peacekeeping missions The indicator calculates the percentage of countries’ “outstanding payments versus annual assessment to the budget of the current peacekeeping missions” All United Nations Member States share the costs of United Nations peacekeeping operations. The General Assembly apportions these expenses based on a special scale of assessments applicable to peacekeeping. This scale takes into account the relative economic wealth of Member States, with the permanent members of the Security Council required to pay a larger share because of their special responsibility for the maintenance of international peace and security. 22. Ease of access to small arms and light weapons A qualitative assessment of the accessibility of small arms and light weapons (SALW), ranked 1-5 (very low–very high) by EIU analysts. Very limited access is scored if the country has developed policy instruments and best practices, such as firearm licences, strengthening of export controls, codes of conduct, firearms or ammunition marking. Very easy access, on the contrary, is characterized by the lack of regulation of civilian possession, ownership, storage, carriage and use of firearms. New developments to the scoring criteria for the Global Peace Index This year we have altered the way in which we score a number of component indicators for the Global Peace Index. Previously these series were scored by normalising each country’s datum on the basis of the following formula: x = (x- Min(x)) / (Max (x)—Min (x)) Where Min (x) and Max (x) are respectively the lowest and highest values in all of the countries under measurement for any given indicator. The normalized value was then transformed from a 0-1 value to a 1-5 score to make it comparable with the other indicators. Page 58
  • 59.
    However, while suchan approach is able to accurately measure a country’s performance against the whole data set of countries, such an approach does not lend itself to comparison over time. In order to compare scores effectively over time we needed to anchor the minimums and maximums to some set measures for every year of calculation. It was also apparent that some of the series under review exhibited a fair amount of volatility year on year and that normalisation, even with a set range year on year, would still result in a great deal of change in indicator scores. We therefore, with the consent of the panel of experts, moved to a banding system for these indicators based on the range of the data sets used for the index in 2008. The scoring criteria for each of the affected series are given below. Number of jailed population per 100,000 people 1 2 3 4 5 0-199.5 199.6 - 379.0 379.1 - 558.5 558.6 - 738.0 >738.0 Volume of transfers of major conventional weapons, as recipient (imports) per 100,000 people 1 2 3 4 5 0-15.2 15.3-30.4 30.5-38.0 38.1-60.8 >60.8 Military expenditure as a percentage of GDP 1 2 3 4 5 0-3.3 3.4-6.6 6.7-9.8 9.9-13.1 >13.1 Number of armed services personnel per 100,000 people 1 2 3 4 5 0-1,311.9 1,312-2,613.8 2,613.9-3,915.7 3,915.8-5,217.6 >5,217.6 Funding for UN Peacekeeping Missions 1 2 3 4 5 0-3.4 3.5-6.9 7.0-10.3 10.4-13.8 >13.8 Aggregate number of heavy weapons per 100,000 people 1 2 3 4 5 0-62.9 63.0-125.7 125.8-188.5 188.5-251.3 >251.3 Volume of transfers of major conventional weapons as supplier (exports) per 100,000 people 1 2 3 4 5 0-5.9 5.9-11.9 12.0-17.8 17.9-23.8 >23.8 Number of displaced people as a percentage of the population 1 2 3 4 5 0.0-3.0 3.1-6.1 6.2-9.1 9.2-12.2 >12.2 Number of external and internal conflicts fought 1 2 3 4 5 0-1.1 1.2-2.1 2.2-3.0 3.1-4.0 >4.0 Page 59
  • 60.
    ANNEX B PoTENTIAL DETERMINANTSoF PEACE Democracy and Transparency Indicator Central Source Year Definition Electoral process EIU Democracy 2008 Qualitative assessment of whether elections are Index competitive in that electors are free to vote and are offered a range of choices. Ranked 1- 10 (very low to very high). Functioning of EIU Democracy 2008 Qualitative assessment of whether freely elected government Index representatives determine government policy? Is there an effective system of checks and balances on the exercise of government authority? Ranked 1- 10 (very low to very high). Political EIU Democracy 2008 Qualitative assessment of voter participation/turn- participation Index out for national elections, citizens’ engagement with politics. Ranked 1- 10 (very low to very high). Political culture EIU Democracy 2008 Qualitative assessment of the degree of societal Index consensus and cohesion to underpin a stable, functioning democracy; score the level of separation of church and state. Ranked 1- 10 (very low to very high). Civil liberties EIU Democracy 2008 Qualitative assessment of the prevalence of civil Index liberties. Is there a free electronic media? Is there a free print media? Is there freedom of expression and protest? Are citizens free to form professional organisations and trade unions? Ranked 1- 10 (very low to very high). Corruption Transparency 2008 The Index draws on multiple expert opinion surveys perceptions International, that poll perceptions of public sector corruption Corruption scoring countries on a scale from 0 to 10, with 0 Perception indicating high levels of perceived corruption and Index 10 indicating low levels of perceived corruption. Women in Inter- 2008 Figures are based on information provided by parliament (as a parliamentary national parliaments by 31st December 2006. percentage of the Union total number of representatives in the lower house) Gender inequality Gender Gap 2008 A composite index that assesses countries on Index, World how well they are dividing their resources and Economic opportunities among their male and female Forum populations, regardless of the overall levels of these resources and opportunities. Freedom of the press Reporters 1/9/2007 - The index measures the state of press freedom in the without borders 1/9/2008 world, reflecting the degree of freedom journalists and news organisations enjoy in each country, and the efforts made by the state to respect and ensure respect for this freedom. Page 60
  • 61.
    International openness Indicator Central Source Year Definition Exports + Imports EIU 2008 Merchandise goods exports free on board measure % of GDP (fob) and merchandise goods imports (fob). Foreign Direct EIU 2008 Net flows of direct investment capital by non- Investment (flow) % residents into the country, as a percentage of GDP. of GDP Number of visitors UNWTo 2006, 2005 Arrivals data correspond to international visitors to as % of domestic Compendium dependent the economic territory of the country and include population of Tourism on both tourists and same-day non-resident visitors. Statistics, Data availability Net Migration (% World Bank, 2000-2005 Net migration is the net average annual number of of total population) World migrants during the period 2000-2005 that is the Development number of immigrants less the number of emigrants, Indicators. Data including both citizen and non citizens. refer to 2000- 2005 Demographics Indicator Central Source Year Definition 15-34 year old UN World 2008 Male population 15-34 year olds as a proportion males as a % of Population of the total population. total population Prospects Gender ratio of UN World 2008 Male population divided by the female population. population: women/ Population men Prospects Regional & international framework/conditions Indicator Central Source Year Definition Extent of regional EIU 2008 Qualitative assessment of the level of membership integration of trade alliances, as NAFTA, ANSEAN, etc. Ranked 1-5 (Very low-very high ) by EIU analysts. Page 61
  • 62.
    ANNEX B PoTENTIAL DETERMINANTSoF PEACE Education Indicator Central Source Year Definition Current education UNESCo, 2005-2006 Public spending on education, total (% of GDP). spending (% of data refer to (depending GDP) the UNESCo on Institute for availability) Statistics estimate, when no value is available Primary school World Bank, 2005-2006 Net enrolment ratio is the ratio of the number of enrolment ratio (% World (depending children of official school age (as defined by the Net) Development on national education system) who are enrolled in Indicators availability) school to the population of the corresponding official school age. Secondary school World Bank, 2005-2006 Net enrolment ratio is the ratio of the number of enrolment ratio (% World (depending children of official school age (as defined by the Net) Development on national education system) who are enrolled in Indicators availability) school to the population of the corresponding official school age. Higher education World Bank, 2005-2006 Gross enrolment ratio is the ratio of total enrolment, enrolment (% World (depending regardless of age, to the population of the age group Gross) Development on that officially corresponds to the level of education Indicators availability) shown. Mean years of UNESCo, 2005 and School life expectancy (years), Primary to tertiary. schooling data refer to earlier years the UNESCo (depending Institute for on Statistics availability) estimate, when no estimate is available Adult literacy rate UNESCo, 2007 Data refer to national literacy estimates from (% of population data refer to censuses or surveys. over the age of 15) the UNESCo Institute for Statistics Culture Indicator Central Source Year Definition Hostility to EIU 2008 Scored 1-5 by EIU analysts. foreigners/private property Importance of EIU 2008 Qualitative assessment of the level of importance religion in national of religion in politics and social life. Ranked 1-5 life (very low to very high) by EIU analysts. Willingness to fight EIU 2008 Qualitative assessment of the willingness of citizens to fight in wars. Ranked 1- 5 (very low to very high) by EIU analysts. Page 62
  • 63.
    Material well being Indicator Central Source Year Definition Nominal GDP EIU 2008 Nominal gross domestic product at 2005 US$ (US$PPP bn) purchasing power parities. Nominal GDP EIU 2008 Nominal gross domestic product US$ market prices. (US$ bn) GDP per capita EIU 2008 Nominal gross domestic product (US$) per capita. Gini coefficient UN Human Latest The Gini index measures the extent to which Development available the distribution of income among individuals or Index 2007- year households within an economy deviates from a 2008; World perfectly equal distribution. Bank, World Development Indicators; EIU estimates Unemployment % EIU 2008 ILo defines the unemployed as members of the economically active population who are without work but available for and seeking work, including people who have lost their jobs and those who have voluntary left work. Life expectancy World Bank, 2006 Life expectancy at birth is the number of years a World newborn infant would live if prevailing patterns of Development mortality at the time of its birth were to stay the Indicators same throughout its life. Infant mortality per World Bank, 2008 Infant mortality rate is the number of infants dying 1,000 live births World before reaching one year of age, per 1,000 live births Development in a given year. Indicators Page 63
  • 64.
    Po Box 42,St Leonards, Sydney NSW 1590, Australia email info@visionofhumanity.org web www.visionofhumanity.org © Institute for Economics and Peace 2009