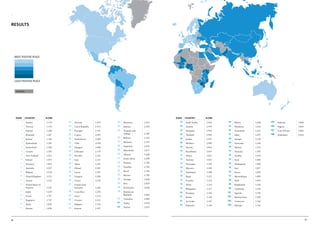
institute for economics and peace


    global
    peace
    index
    2012


                                    1
The Institute for
Economics and Peace                                       global
Quantifying peace
and its benefits
                                                          peace
                                                          index
The Institute for Economics and Peace (IEP) is an
independent, non-partisan, non-profit research
                                                          2012
organization dedicated to shifting the world’s focus to
peace as a positive, achievable, and tangible measure
of human well-being and progress.
    IEP achieves its goals by developing new              This is the sixth edition of the Global Peace Index         peaceful environments.
conceptual frameworks to define peacefulness;             (GPI), which ranks nations according to their level             In the spirit of deepening knowledge and
providing metrics for measurement; uncovering the         of peacefulness. It is composed of 23 qualitative and       understanding of the relative peacefulness of nations,
relationship between peace, business and prosperity;      quantitative indicators from highly respected sources,      IEP has developed the first known attempt to quantify
and by promoting a better understanding of the            which gauge three broad themes: the level of safety         measures of positive peace through the Positive Peace
cultural, economic and political factors that drive       and security in society; the extent of domestic or          Index (PPI). This study measures the strength of the
peacefulness.                                             international conflict; and the degree of militarisation.   attitudes, institutions, and structures within nations
    IEP has offices in Sydney, New York, and              The 2012 GPI has been expanded to rank 158                  which sustain peace. This provides a framework
Washington, D.C. It works with a wide range of            independent states and updated with the latest              to determine a nation’s institutional capacity and
partners internationally and collaborates with            available figures and information.                          resilience to fundamentally create and maintain a
intergovernmental organizations on measuring and              This year’s report is divided into three main           peaceful society.
communicating the economic value of peace.                sections; the first is the methodology, results and
                                                          findings from the 2012 index, the second is an
                                                          analysis of trends in peacefulness since the inception
                                                          of the GPI in 2007, and the final section is IEP’s first
For more information:                                     attempt at defining a Positive Peace Index.
www.economicsandpeace.org                                     The methodology, results and findings section
www.visionofhumanity.org                                  provides highlights for the ten most and least peaceful
                                                          countries, as well as for the five most improved and
                                                          five most deteriorated over the one-year period.
                                                          Indicator sources and weights are provided along with
                                                          explanation on the changes to the methodology.
                                                              The trends in peacefulness analysis tracks
                                                          key global trends in peace over the past six years
                                                          and utilises the GPI’s comprehensive 23 indicator
                                                          dataset to understand nuanced changes in the many
                                                          multidimensional aspects of peace. The data has been
                                                          evaluated against many other socio-economic factors
                                                          to understand key correlations and associations with


2                                                                                                                                                                       3
Contents


Contents


Methodology,                                                Risers and fallers                                             52
Results                                                     Indicator trends                                               52
and Findings                                                Correlation trends                                             56
Highlights                                              7     Corruption                                                   58
2012 Global Peace Index rankings                        8     GDP per capita                                               60
Constructing the Index                                 10   Quintile analysis                                              63
    Measuring states of peace                          10
    The research team                                  10   Positive
    The indicators                                     11
                                                            Peace
                                                            Index
    Changes to the methodology 2012                    12
                                                            EXECUTIVE SUMMARY                                              67
Analysis of the results                                13
                                                            Introduction                                                   69
    Regional overview                                  13
                                                            Why a Positive Peace Index?                                    70
    The ten countries most at peace                    18
                                                            Methodology                                                    71
    The ten countries least at peace                   23
                                                            Results                                                        80
    Risers and fallers                                 29
                                                            Positive peace gap                                             81
    Top-five national improvements in peacefulness     29
                                                            Positive peace deficit case study                              90
    Top-five national deteriorations in peacefulness   31
                                                            Positive peace by region                                       93
Methodological notes                                   34
                                                            Positive peace by income group                                101
    Weighting the Index                                34
    Qualitative scoring                                35   Positive peace by government type                             102

                                                            Positive peace by indicator domain                            104

Trends in                                                   Trends in individual positive peace indicators                107

Peacefulness                                                Conclusion                                                    109

Highlights                                             37
                                                            Annex A
Trends in peacefulness from 2009-2012                  38
                                                            GPI indicator sources, definitions and scoring criteria       110
Methodology of trend analysis                          40

Twenty year trends                                     40   Annex B
Overall trend                                          45   socio - economic factors                                      122

    By region                                          45   References                                                    127

    Sub-Saharan Africa                                 46   Endnotes                                                      128
    By government type                                 50

Internal Peacefulness                                  51


4                                                                                                                          5
HIGHLIGHTS


                  the main developments in 2012                            deteriorations in several measures of militarisation.
                                                                           Sri Lanka experienced the greatest improvement in its
                  Calculating the 2012 Global Peace Index (GPI) by         overall peacefulness, following the ending of decades
                  examining 23 indicators across 158 countries reveals     of civil war.
                  that the world has become slightly more peaceful             War-ravaged Somalia remains the country least
                  in the past year. This follows two consecutive years     at peace in 2012 for the second successive year,
                  when an overall decline in peacefulness was observed;    with ongoing conflict in several regions (with the
                  many countries experienced growing instability and       notable exception of Somaliland). Afghanistan’s score


    METHODOLOGY
                  heightened disharmony linked to rapid rises in food,     deteriorated and it dropped to the second-lowest
                  fuel, and commodity prices and the global economic       position. Syria’s descent into civil war caused its score
                  downturn.                                                to deteriorate by the largest margin and it dropped by

    RESULTS           There were improvements in the overall scores
                  across all regions, apart from the Middle East and
                                                                           31 places, to 147th position.
                                                                               Among the GPI indicators, ‘Level of perceived


    & FINDINGS
                  North Africa, where many countries experienced           criminality in society’ registered the largest year-on-
                  waves of uprisings, protests and revolutions, sparked    year change from the 2011 GPI, showing a substantial
                  by the Arab Spring. GPI scores deteriorated most         deterioration. The five indicators showing the most
                  sharply in Syria, Egypt and Tunisia. The Asia-           significant year-on-year deterioration were all
                  Pacific region experienced the largest average rise in   measures of the security situation and reflected the
                  peacefulness, with the most significant gains in Sri     upheaval and turmoil that has rippled across the Arab
                  Lanka, Bhutan, Philippines and Nepal. Sub-Saharan        world and beyond.
                                                                               The Political Terror Scale showed the greatest
                  Syria’s descent into civil war caused                    improvement and there were gains in several
                  its score to deteriorate by the largest                  indicators of militarisation as defence budgets were
                  margin and it dropped by 31 places, to                   squeezed.

                  147th position.

                  Africa became slightly more peaceful, with notable
                  improvements in Zimbabwe, Madagascar and Gabon
                  and, for the first time since the GPI was launched in
                  2007, it is not the least peaceful region—that dubious
                  honour falls to the Middle East and North Africa this
                  year.
                     Iceland is, for the second successive year, the
                  country most at peace, followed by Denmark and
                  New Zealand. Small, stable democracies again
                  dominate the top ten. Qatar is the highest-placed
                  Middle-Eastern country (and non-democracy), in
                  12th position. Bhutan moved into the top 20 for
                  the first time, mainly as a result of easing tensions
                  surrounding ethnic Nepali refugees. Norway dropped
                  out of the top ten to 18th position, the result of the
                  violent attack by Anders Breivik in July 2011, killing
                  77 and injuring more than 300. Norway also saw


6                                                                                                                               7
2012
global peace
index rankings


most peaceful


least peaceful

    no data


    Rank      Country          Score                                                                Rank   Country             Score

        1     Iceland          1.113   29   United Kingdom   1.609   56   Djibouti          1.881     85   Ecuador             2.028   109   Belarus           2.208   137   Ethiopia          2.504
        2     Denmark          1.239   30   Chile            1.616   58   Mongolia          1.884     85   Swaziland           2.028   110   Uzbekistan        2.219   138   Burundi           2.524
        2     New Zealand      1.239   31   Botswana         1.621   59   Oman              1.887     87   Equatorial Guinea   2.039   111   Egypt             2.220   139   Myanmar           2.525
        4     Canada           1.317   32   Romania          1.627   60   Malawi            1.894     88   United States of            111   El Salvador       2.220   140   Zimbabwe          2.538
        5     Japan            1.326   33   Uruguay          1.628   61   Panama            1.899          America             2.058   113   Jamaica           2.222   141   Georgia           2.541
        6                              34   Vietnam          1.641   62   Jordan            1.905     89   China               2.061   114   Benin             2.231   142   India             2.549
              Austria          1.328
        6                              35   Croatia          1.648   63   Indonesia         1.913     90   Dominican                   115   Armenia           2.238   143   Yemen             2.601
              Ireland          1.328
                                       36   Costa Rica       1.659   64                                    Republic            2.068   116                             144
        8     Slovenia         1.330                                      Serbia            1.920                                            Niger             2.241         Colombia          2.625
                                       37                                                             91   Bangladesh          2.071
        9     Finland          1.348        Laos             1.662   65   Bosnia and                                                   117   Turkmenistan      2.242   145   Chad              2.671
                                       38                                 Herzegovina       1.923     92   Guinea              2.073
       10     Switzerland      1.349        Italy            1.690                                                                     118   Bahrain           2.247   146   Nigeria           2.801
                                                                     66                               93   Papua New
       11     Belgium          1.376   39   Bulgaria         1.699        Albania           1.927                                      119   Rwanda            2.250   147   Libya             2.830
                                                                     66                                    Guinea              2.076
       12     Qatar            1.395   40   France           1.710        Moldova           1.927                                      120   Kenya             2.252   147   Syria             2.830
                                                                                                      94   Trinidad and
       13                              41   Estonia          1.715   68   Macedonia (FYR)   1.935                                      121   Algeria           2.255   149   Pakistan          2.833
              Czech Republic   1.396                                                                       Tobago              2.082
       14                              42   South Korea      1.734   69   Guyana            1.937                                      122   Eritrea           2.264   150   Israel            2.842
              Sweden           1.419                                                                  95   Angola              2.105
       15                              43   Lithuania        1.741   70   Cuba              1.951                                      123   Venezuela         2.278   151   Central African
              Germany          1.424                                                                  95   Guinea-Bissau       2.105
       16                              44   Argentina        1.763   71   Ukraine           1.953                                      124   Guatemala         2.287         Republic          2.872
              Portugal         1.470                                                                  97   Cameroon            2.113
       17                              45   Latvia           1.774   72   Tunisia           1.955                                      125   Mauritania        2.301   152   North Korea       2.932
              Hungary          1.476                                                                  98   Uganda              2.121
       18                              46   United Arab              73   Cyprus            1.957                                      126   Thailand          2.303   153   Russia            2.938
              Norway           1.480                                                                  99   Madagascar          2.124
                                            Emirates         1.785   74   Gambia            1.961                                      127                             154   Democratic
       19     Bhutan           1.481                                                                  99   Tajikistan          2.124         South Africa      2.321
                                       47   Kuwait           1.792   75   Gabon             1.972                                                                            Republic of the
       20     Malaysia         1.485                                                                 101   Liberia             2.131   128   Iran              2.324
                                       48   Mozambique       1.796   76   Paraguay          1.973                                                                            Congo             3.073
       21     Mauritius        1.487                                                                 102   Mali                2.132   129   Honduras          2.339
                                       49   Namibia          1.804   77                                                                                                155   Iraq              3.192
       22     Australia        1.494                                      Greece            1.976    103                               130   Turkey            2.344
                                                                                                           Sri Lanka           2.145                                   156   Sudan             3.193
                                       50   Ghana            1.807   78   Senegal           1.994                                      131
       23     Singapore        1.521                                                                 104   Republic                          Kyrgyz Republic   2.359
                                       51   Zambia           1.830   79                                                                                                157   Afghanistan       3.252
       24                                                                 Peru              1.995          of Congo            2.148   132   Azerbaijan        2.360
              Poland           1.524                                                                                                                                   158   Somalia           3.392
                                       52   Sierra Leone     1.855   80   Nepal             2.001    105
       25     Spain            1.548                                                                       Kazakhstan          2.151   133   Philippines       2.415
                                       53   Lesotho          1.864   81   Montenegro        2.006    106
       26     Slovakia         1.590                                                                       Saudi Arabia        2.178   134   Cote d’Ivoire     2.419
                                       54   Morocco          1.867   81   Nicaragua         2.006    107
       27     Taiwan           1.602                                                                       Haiti               2.179   135   Mexico            2.445
                                       55   Tanzania         1.873   83   Brazil            2.017    108
       28     Netherlands      1.606                                                                       Cambodia            2.207   136   Lebanon           2.459
                                       56   Burkina Faso     1.881   84   Bolivia           2.021


8                                                                                                                                                                                                 9
Constructing the
                                                                                                                                                                                                                           index


Constructing
the index

Measuring states of peace                                  a range of potential determinants, or “drivers”, which    Peace Research (AIPAZ), Madrid, Spain                      Societal safety
                                                           may influence the creation and nurturance of peaceful                                                                and security
                                                                                                                     Dr Ekaterina Stepanova
Peace is notoriously difficult to define. Perhaps the      societies, both internally and externally.                                                                           Level of perceived criminality in society
simplest way of approaching it is in terms of harmony                                                                Head, Unit on Peace and Conflict Studies, Institute
                                                                                                                                                                                Qualitative assessment by Economist Intelligence Unit
achieved by the absence of war or conflict. Applied to                                                               of the World Economy and International Relations
                                                                                                                                                                                analysts
nations, this would suggest that those not involved in     The research team                                         (IMEMO), Russian Academy of Sciences, Moscow.
violent conflicts with neighbouring states or suffering
                                                           The GPI was founded by Steve Killelea, an Australian
internal wars have achieved a state of peace, which                                                                                                                             Number of refugees and displaced people as a
                                                           technology entrepreneur and philanthropist. It is         The indicators
has been described as a “negative peace”.                                                                                                                                       percentage of the population
                                                           produced by the Institute for Economics and Peace.
    In attempting to gauge peacefulness, the GPI           The GPI is collated and calculated by the Economist                                                                  UNHCR Statistical Yearbook and the Internal
                                                                                                                     The GPI comprises 23 indicators measuring the
investigates the extent to which countries are involved    Intelligence Unit, with whom sections of this report                                                                 Displacement Monitoring Centre (IDMC)
                                                                                                                     absence of voilence or fear of voilence. Selected with
in ongoing domestic and international conflicts. It        are written in co-operation.                              the assistance of an international panel of independent    Political instability
also seeks to evaluate the level of harmony or discord
                                                                                                                     experts. All scores for each indicator are “banded”,       Qualitative assessment by Economist Intelligence Unit
AN ADDITIONAL AIM OF THE GPI IS TO EXPLORE                 An international panel of independent experts played      either on a scale of 1-5 (for qualitative indicators) or   analysts
THE CONCEPT OF A “POSITIVE PEACE”.                         a key role in establishing the Global Peace Index in      1-9 (for quantitative data). The Economist Intelligence
                                                           2007—in selecting the indicators that best assess a       Unit’s team of country analysts has scored eight           Political Terror Scale
within a nation; ten indicators broadly assess what
                                                           nation’s level of peace and in assigning a weighting to   of the nine qualitative indicators. They have also         Qualitative assessment of Amnesty International and
might be described as safety and security in society.
                                                           each of them. The panel has overseen each edition of      provided estimates where there have been gaps in           US Department of State yearly reports
The assertion is that low crime rates, minimal
                                                           the GPI; this year, it included:                          the quantitative data. A detailed explanation of the
incidences of terrorist acts and violent demonstrations,                                                                                                                        Terrorist acts
                                                                                                                     scoring criteria used for each indicator is supplied in
harmonious relations with neighbouring countries,                                                                                                                               Global Terrorism Database, University of Maryland
a stable political scene and a small proportion of the
                                                           Professor Kevin P. Clements, chairperson                  Annex A.
                                                                                                                                                                                and Institute for Economics and Peace
population being internally displaced or refugees can      Foundation Chair of Peace and Conflict Studies and
                                                           Director, National Centre for Peace and Conflict          Ongoing domestic and                                       Number of homicides per 100,000 people
be equated with peacefulness.
                                                                                                                     international conflict                                     United Nations Office on Drugs and Crime (UNODC)
    Eight further indicators are related to a country’s    Studies, University of Otago, Dunedin, New Zealand
                                                                                                                     Number of external and internal conflicts fought
military build-up—reflecting the assertion that            Dr Ian Anthony                                                                                                       Level of violent crime
                                                                                                                     Uppsala Conflict Data Program (UCDP), University
the level of militarisation and access to weapons is       Research co-ordinator and Leader of the Arms                                                                         Qualitative assessment by Economist Intelligence Unit
                                                                                                                     of Uppsala, Sweden and the Centre for the Study of
directly linked to how at peace a country feels, both      Control and Non-proliferation Programme,                                                                             analysts
                                                                                                                     Civil War at PRIO (International Peace Research
domestically and internationally. Comparable data on       Stockholm International Peace Research Institute          Institute Oslo)                                            Likelihood of violent demonstrations
military expenditure as a percentage of GDP and the        (SIPRI), Sweden
number of armed service officers per head are gauged,                                                                                                                           Qualitative assessment by Economist Intelligence Unit
                                                                                                                     Estimated number of deaths from organised conflict
as are financial contributions to UN peacekeeping          Professor Sultan Barakat                                  (external)
                                                                                                                                                                                analysts
missions.                                                  Director, Post-war Reconstruction and Development         UCDP, University of Uppsala, Sweden and the Centre         Number of jailed population per 100,000 people
    An additional aim of the GPI is to explore the         Unit (PRDU), Department of Politics, University of        for the Study of Civil War at PRIO                         International Centre for Prison Studies, University of
concept of a “positive peace”. Various studies have        York, United Kingdom
                                                                                                                                                                                Essex
proposed that a culture of peace might be based                                                                      Number of deaths from organised conflict (internal)
                                                           Mr Nick Grono                                             International Institute for Strategic Studies (IISS)
on human rights, gender equality, democratic                                                                                                                                    Number of internal security officers and police per
                                                           Deputy President International Crisis Group (ICG),        Armed Conflict Database
participation, tolerant solidarity, open communication                                                                                                                          100,000 people
                                                           Brussels, Belgium
and international security. However, these links                                                                     Level of organised conflict (internal)                     UNODC
between peace and its causes tend to be presumed,          Dr Toshiya Hoshino                                        Qualitative assessment by Economist Intelligence Unit
rather than systematically measured. This report also      Professor, Osaka School of International Public                                                                      Militarisation
                                                                                                                     analysts
examines relationships between the GPI and reliable        Policy, Osaka University, Japan                                                                                      Military expenditure as a percentage of GDP
international measures, including democracy and                                                                      Relations with neighbouring countries                      IISS, The Military Balance
                                                           Dr Manuela Mesa                                           Qualitative assessment by Economist Intelligence
transparency, education and material wellbeing. As
                                                           Director, Centre for Education and Peace Research         Unit analysts
such, it seeks to understand the relative importance of
                                                           (CEIPAZ) and President, Spanish Association for


10                                                                                                                                                                                                                                  11
Constructing the
index


                                                                                                                       Analysis of
                                                                                                                       the Results

Number of armed-services personnel per 100,000            Maryland, would be a useful addition to the GPI. This        Regional overview                                        Western          Overall      Overall      Regional
people                                                    year it has been included (named Terrorist acts) and it                                                               Europe           Rank         Score        Rank
IISS, The Military Balance                                replaces the qualitative indicator Potential for terrorist   Western Europe remains markedly the most peaceful
                                                                                                                                                                                 Belgium          11          1.38          7
                                                          acts, which was scored by Economist Intelligence             region, with the majority of the countries in this
Volume of transfers of major conventional weapons                                                                      group ranking in the top 20 overall. The average GPI      Sweden           14          1.42          8
                                                          Unit analysts. The weighting of this indicator was
as recipient (imports) per 100,000 people                                                                              score in 2011 for the region improved slightly, after     Germany          15          1.42          9
                                                          increased from 1 to 2.
Stockholm International Peace Research Institute              The remaining eight qualitative indicators that are      deteriorations in the two previous years associated       Portugal         16          1.47          10
(SIPRI) Arms Transfers Database                           scored by Economist Intelligence Unit analysts refer         with the global financial and economic crisis. Between    Norway           18          1.48          11
                                                          to the period 16th March 2011 to 15th March 2012,            2007 (the first year of the GPI) and 2009 the region      Spain            25          1.55          12
                                                          in line with the approach last year, when the review         became more peaceful. Norway dropped out of               Netherlands      28          1.61          13
Volume of transfers of major conventional weapons         period was amended to take account of the events that        the top ten for the first time, to 18th position, the
                                                                                                                                                                                 United
as supplier (exports) per 100,000 people                  unfolded in the Middle East and North Africa last            result of the violent attack by Anders Breivik in July    Kingdom          29          1.61          14
SIPRI Arms Transfers Database                             spring.                                                      2011, killing 77 and injuring more than 300. There        Italy            38          1.69          15
                                                              The panel recommended that the weighting of              were also deteriorations in several GPI gauges of the
Financial contribution to UN peacekeeping missions                                                                                                                               France           40          1.71          16
                                                          ‘Level of perceived criminality’ in society should be        country’s militarisation. Three Nordic nations are
United Nations Committee on Contributions and                                                                                                                                    Cyprus           73          1.96          17
                                                          reduced from 4 to 3. The scoring system for ‘Military        again ranked in the GPI’s top ten, with high levels of
Institute for Economics and Peace                                                                                                                                                Greece           77          1.98          18
                                                          expenditure as a percentage of GDP’ was adjusted             safety and security indicating broadly harmonious
Aggregate weighted number of heavy weapons per                                                                         societies, free from civil conflict.                      Average          23          1.50
                                                          from bandings of 0.5 to a sliding scale of 0.1 to
100,000 people                                            provide a more precise coverage.                                 Sweden ranks lower than its Scandinavian
IISS, The Military Balance and Institute for Economics                                                                 neighbours (14th) on account of its thriving arms-       Greece’s score deteriorated for the fourth successive
                                                          This brings the total coverage in the 2012
and Peace                                                                                                              manufacturing industry and the volume of exports of      year, and by the second-largest margin in the
                                                          GPI to 158 nations, encompassing more                        conventional weapons. As in previous editions of the     region, behind Norway, with an increasing risk
Ease of access to small arms and light weapons            than 99% of the world’s population.                          GPI, the majority of the Western European nations        of demonstrations and rises in the level of violent
Qualitative assessment by Economist Intelligence Unit
                                                              The scores for 10 countries for ‘Number of               recorded only small year-on-year changes to their        crime linked to the ongoing sovereign debt crisis and
analysts
                                                          homicides per 100,000’ people were “smoothed”                scores. Spain experienced the largest improvement,       spiralling unemployment. It tumbled to 77th position,
Military capability/sophistication                        owing to the availability of new and more reliable           in part owing to the Basque separatist group, ETA,       replacing Cyprus as the lowest-ranked nation in
Qualitative assessment by Economist Intelligence          data. This has reduced some substantial movements            announcing a “definitive cessation” to its campaign      the region, in spite of an austerity-induced sharp
Unit analysts                                             in scores that may not accurately reflect conditions in      of bombings and shootings, which lasted for more         drop in military expenditure. Very large numbers of
                                                          a country and could lead to false assumptions being          than 40 years and killed more than 800 people. The       heavy weapons per head in both Greece and Cyprus
                                                          made.                                                        Political Terror Scale also registered an improvement    continue to contribute to their relatively high overall
changes to the methodology 2012                               Data for ‘Number of external and internal                in Spain and there was a drop in military expenditure    scores and low ranks. The UK and France have
                                                          conflicts fought’ remains the same as those used in the      as austerity measures kicked in. Switzerland’s score     been accorded low positions compared with their
The advisory panel that oversees the compilation of
                                                          2011 GPI owing to methodological issues concerning           improved by the second-largest margin in the region      neighbouring countries in previous editions of the
the GPI agreed to include five additional countries
                                                          the latest data.                                             and the country moved into the top ten for the first     GPI, owing to their sophisticated military spheres,
in the 2012 edition: Benin, Djibouti, Guinea-Bissau,
                                                                                                                       time.                                                    substantial arms exports, involvement in external
Lesotho and Mauritius. This brings the total coverage
                                                                                                                                                                                conflicts and relatively high homicide rates. This year,
in the 2012 GPI to 158 nations, encompassing more
                                                                                                                       Western          Overall    Overall      Regional        the UK’s score improved slightly, although it dropped
than 99% of the world’s population.                                                                                    Europe           Rank       Score        Rank            to 29th place, with falls in military expenditure and
    Subsequent editions of the GPI will include other
                                                                                                                        Iceland         1           1.11         1              an improvement in its rank in the Political Terror
nations, but not micro-states; the panel and the
                                                                                                                        Denmark         2           1.24         2              Scale just outweighing mounting political instability,
compilers agreed that countries covered by the GPI
                                                                                                                                                                                an increased likelihood of violent demonstrations and
must either have a population of more than 1 million                                                                    Austria         6           1.33         3
                                                                                                                                                                                a rise in violent crime linked to a spate of riots and
or a land area greater than 20,000 square kilometers.                                                                   Ireland         6           1.33         3
                                                                                                                                                                                disturbances in August 2011.
    The panel recommended that the Global Terrorism                                                                     Finland         9           1.35         5
                                                                                                                                                                                    North America experienced a slight
Database, an authoritative and up-to-date quantitative                                                                  Switzerland     10          1.35         6
                                                                                                                                                                                improvement, continuing a trend since 2007. There
measure of terrorist acts compiled by the University of


12                                                                                                                                                                                                                                   13
Analysis of                                                                                                                                                                                                             Analysis of
the results                                                                                                                                                                                                             the results


was an upturn in Canada’s score and ranking (to             Boris Tadic; a pro-EU coalition presided over a          Central
                                                                                                                                                                                scene. Ongoing internal conflicts and related security
fourth position) as a result of a reduction in the          modest economic recovery in 2011. There were also        and Eastern        Overall     Overall      Regional       concerns in Afghanistan and Pakistan explain their
number of deaths from external conflict (fewer              improvements in some of Serbia’s GPI measures of         Europe             Rank        Score        Rank           continued presence in the bottom ten of the GPI. The
casualties among Canadian troops stationed in               militarisation.                                           Kazakhstan        105         2.15         20
                                                                                                                                                                                lowly positions of North Korea (152nd) and Myanmar
Afghanistan). The US’s overall score also improved             Tajikistan heads the Caucasian and Central Asian                                                                 (139th) reflect tense security situations and very high
                                                                                                                      Belarus           109         2.21         21
slightly, although it slipped seven places to 88th          nations for the first time, in 99th position, amid an                                                               levels of militarisation, although both experienced
                                                                                                                      Uzbekistan        110         2.22         22
position as a result of larger gains in several countries   improving security situation and a decline in military                                                              improvements and more benign environments in 2011.
                                                                                                                      Armenia           115         2.24         23
previously ranked below it. The US’s fairly low rank        expenditure to a very low level. Kyrgyz Republic
largely reflects much higher levels of militarisation       experienced the largest deterioration in peacefulness,    Turkmenistan      117         2.24         24
                                                                                                                                                                                Asia-             Overall     Overall      Regional
and involvement in external conflicts than its northern     with a decline in respect for human rights (the           Turkey            130         2.34         25             Pacific           Rank        Score        Rank
neighbour. Several measures of societal safety and          Political Terror Scale) linked to the revolution in       Kyrgyz
                                                                                                                                                                                 New Zealand       2           1.24         1
security also receive higher scores, including the          April 2010 and subsequent clashes between Kyrgyz          Republic          131         2.36         26
                                                                                                                                                                                 Japan             5           1.33         2
proportion of people in jail.                               and Uzbek ethnic communities in the southern cities       Azerbaijan        132         2.36         27
                                                                                                                                                                                 Bhutan            19          1.48         3
                                                            of Osh and Jalalabad. There was also an increase in       Georgia           141         2.54         28
                                                                                                                                                                                 Malaysia          20          1.49         4
 North              Overall   Overall      Regional         the country’s jailed population to 267 per 100,000, a     Russia            153         2.94         29
 America            Rank      Score        Rank             lower proportion of its population than in Kazakhstan                                                                Australia         22          1.49         5
                                                                                                                      Average           74          1.96
                                                            and Uzbekistan, but higher than in Turkmenistan and                                                                  Singapore         23          1.52         6
 Canada             4         1.32          1
                                                            Tajikistan.                                                                                                          Taiwan            27          1.60         7
 United States of                                                                                                    The Asia Pacific region is on average the fourth-most
 America            88        2.06          2                                                                                                                                    Vietnam           34          1.64         8
                                                                                                                     peaceful region. Its overall GPI score improved by
 Average            46        1.69                          Central                                                                                                              Laos              37          1.66         9
                                                            and Eastern       Overall     Overall     Regional       the largest extent from last year, with the average for
                                                                                                                                                                                 South Korea       42          1.73         10
                                                            Europe            Rank        Score       Rank           the 25 nations falling from 2.07 to 2.01, following a
                                                                                                                                                                                 Mongolia          58          1.88         11
Central and Eastern Europe remains, on average,                                                                      slight improvement in the 2011 edition. Asia Pacific
                                                             Slovenia         8           1.33         1
                                                                                                                     countries exhibit wide variation in the GPI; the OECD       Indonesia         63          1.91         12
the third-most peaceful region, after North America,
                                                             Czech Republic   13          1.40         2
and the situation improved for the second successive                                                                 nations rank highly, with New Zealand coming joint-         Nepal             80          2.00         13
                                                             Hungary          17          1.48         3
year and by a greater extent than in Western Europe.                                                                 second overall and Japan fifth, a two-pronged impact        China             89          2.06         14
                                                             Poland           24          1.52         4             of very strong scores for overall domestic peace and
The newest members of the EU are ranked highest,                                                                                                                                 Bangladesh        91          2.07         15
with Slovenia consolidating its position in the top ten      Slovakia         26          1.59         5             low levels of militarisation. Bhutan experienced a          Papua New
(8th position), although the Czech Republic slipped to       Romania          32          1.63         6             robust gain in its GPI score and it rose into the top 20    Guinea            93          2.08         16
13th place.                                                  Croatia          35          1.65         7             for the first time, (19th place), above Malaysia, mainly    Sri Lanka         103         2.15         17
    Non-EU countries in the Balkans are ranked               Bulgaria         39          1.70         8             because of the easing of the ethic-Nepali refugee           Cambodia          108         2.21         18
between 34th and 78th in the 2012 GPI and nations            Estonia          41          1.72         9
                                                                                                                     situation.                                                  Thailand          126         2.30         19
in the Caucasus and Central Asia occupy the lower                                                                        The divide in South-East Asia remained marked,
                                                             Lithuania        43          1.74         10                                                                        Philippines       133         2.42         20
reaches of the index, as before.                                                                                     with Taiwan and Vietnam in the top 35 and
                                                             Latvia           45          1.77         11                                                                        Myanmar           139         2.53         21
                                                                                                                     Cambodia, Thailand and Philippines ranked below
Bulgaria’s score improved most markedly                      Serbia           64          1.92         12                                                                        India             142         2.55         22
                                                                                                                     100th. Cambodia’s score improved solidly from a
in the region, mainly as a result of                         Bosnia and
                                                                                                                     sharp deterioration the previous year, amid growing         Pakistan          149         2.83         23
contractions in its military sphere                          Herzegovina      65          1.92         13
                                                                                                                     political stability under the ruling Cambodian              North Korea       152         2.93         24
                                                             Albania          66          1.93         14
brought on by budgetary pressures.                                                                                   Peoples’ Party, which secured a victory in elections to     Afghanistan       157         3.25         25
                                                             Moldova          66          1.93         14
   Bulgaria’s score improved most markedly in                                                                        the Senate in late January 2012. There were also fewer      Average           77          2.01
                                                             Macedonia                                               violent crimes and a fall in the homicide rate.
the region, mainly as a result of contractions in its
                                                             (FYR)            68          1.94         16
military sphere brought on by budgetary pressures.                                                                       With the exception of Bhutan, South Asian nations
                                                             Ukraine          71          1.95         17                                                                       Latin America also experienced an overall gain
Serbia’s overall score underwent the second-largest                                                                  occupy the lower half of the regional table, headed
                                                             Montenegro       81          2.01         18                                                                       in peacefulness, with 16 of the 23 nations seeing
improvement in the region, amid increased political                                                                  by Nepal, which rose to 80th place amid an easing
                                                                                                                                                                                improvements to their GPI scores. Chile is ranked
stability led by the reformist (now former) president,       Tajikistan       99          2.12         19            of the security situation and a more stable political
                                                                                                                                                                                highest, above Uruguay, with a decline in military


14                                                                                                                                                                                                                                   15
Analysis of                                                                                                                                                                                                          Analysis of
the results                                                                                                                                                                                                          the results


expenditure and gains in its human-rights situation        Latin              Overall     Overall      Regional
                                                                                                                      the position of the president, Ali Bongo Ondimba.        Sub-
(Political Terror Scale) and the homicide rate.            America            Rank        Score        Rank           Improvements to five GPI indicators point to a more      Saharan           Overall   Overall     Regional
Costa Rica’s high ranking (36th) in the GPI partly                                                                    peaceful environment in Chad in 2011—a fall in the       Africa            Rank      Score       Rank
                                                            Trinidad
reflects very low scores for almost all its measures        and Tobago        94          2.08         15
                                                                                                                      number of refugees and internally displaced people       Malawi            60        1.89         12
of militarisation, in step with the abolition of the                                                                  reflects the easing of the conflict and humanitarian
                                                            Haiti             107         2.18         16                                                                      Gambia            74        1.96         13
country’s army at the end of the civil war in 1948.                                                                   disaster in Darfur. Nevertheless, risk of civil unrest
                                                            El Salvador       111         2.22         17                                                                      Gabon             75        1.97         14
    Venezuela’s rise in peacefulness (it was the second-                                                              remains and many of the country’s measures of
                                                            Jamaica           113         2.22         18                                                                      Senegal           78        1.99         15
biggest “improver” after Guyana) reflected warming                                                                    societal safety and security remain at high levels,
                                                            Venezuela         123         2.28         19                                                                      Swaziland         85        2.03         16
relations with neighbouring countries, particularly a                                                                 hence its low rank (145th).
rapprochement between the president, Hugo Chávez,           Guatemala         124         2.29         20                 Among Sub-Saharan nations, Malawi experienced        Equatorial
                                                                                                                                                                               Guinea            87        2.04         17
and his Colombian counterpart, Juan Manuel Santos,          Honduras          129         2.34         21             the largest decline in its GPI score and rank (falling
                                                                                                                                                                               Guinea            92        2.07         18
who was elected president in June 2010. There was           Mexico            135         2.45         22             19 places to 60th position), largely as a result of a
also a steep decline in military expenditure as a                                                                     police crackdown on mass protests in July 2011 that      Angola            95        2.11         19
                                                            Colombia          144         2.63         23
percentage of GDP. Mexico’s GPI score deteriorated          Average           87          2.05                        left at least 18 people dead. Nigeria underwent the      Guinea-Bissau     95        2.11         19
significantly again and it slipped to 135th position                                                                  second-largest deterioration, with a sharp rise in       Cameroon          97        2.11         21
amid mounting drug-related violence and widespread                                                                    the measure of internal conflict in response to the      Uganda            98        2.12         22
crime that spread to areas that were previously
                                                           Sub-Saharan Africa experienced a modest rise in            wave of deadly attacks in the north of the country by    Madagascar        99        2.12         23
                                                           peacefulness and, for the first time since the GPI was
relatively unscathed. During 2011 the majority of                                                                     the radical Islamist group, Boko Haram. A suicide
                                                           launched in 2007, it was not ranked the least peaceful                                                              Liberia           101       2.13         24
murders were concentrated in Chihuahua, Nuevo                                                                         bombing of UN headquarters in Abuja in August
                                                           region. This was primarily the consequence of a                                                                     Mali              102       2.13         25
Leon, Guerrero and Sinaloa. The efficacy of the                                                                       2011 killed 23 people. At least 186—and possibly
                                                           second successive sharp deterioration in the overall                                                                Republic of the
government’s military crackdown is being increasingly                                                                 more than 200—people were killed on January 20th
                                                           score for the Middle East and North Africa region.                                                                  Congo             104       2.15         26
questioned by civil society and it is likely to become                                                                in the northern city of Kano in a co-ordinated series
                                                           There were improvements in 23 of the 38 (60%)                                                                       Benin             114       2.23         27
one of the presidential campaign issues. Rates of                                                                     of bomb and gun attacks. The carnage in Nigeria’s
                                                           countries surveyed. Zimbabwe underwent the greatest                                                                 Niger             116       2.24         28
kidnapping in some states are among the highest in                                                                    second-largest city was the most deadly strike by
                                                           improvement—a tense security situation eased amid a
the world.                                                                                                            the fanatical sect since it began an uprising in 2009    Rwanda            119       2.25         29
                                                           more stable political scene under the unity government
                                                                                                                      to topple democracy and impose Islamic rule in the       Kenya             120       2.25         30
                                                           and a gradual economic recovery from near collapse.
 Latin             Overall     Overall      Regional                                                                  multi-ethnic and religiously diverse nation. War-torn
                                                           Madagascar also experienced a more peaceful year as                                                                 Eritrea           122       2.26         31
 America           Rank        Score        Rank                                                                      Somalia remained the lowest-ranked country in the
                                                           a recovery from the deep political crisis that followed                                                             Mauritania        125       2.30         32
 Chile             30          1.62          1
                                                                                                                      region.
                                                           the overthrow of the president, Marc Ravalomanana,                                                                  South Africa      127       2.32         33
 Uruguay           33          1.63          2             in March 2009 gained momentum. Mauritius,
                                                                                                                      Sub-                                                     Cote d' Ivoire    134       2.42         34
 Costa Rica        36          1.66          3             included in the GPI for the first time this year, is the   Saharan           Overall     Overall      Regional      Ethiopia          137       2.50         35
 Argentina         44          1.76          4             highest-ranked nation in the region, supplanting           Africa            Rank        Score        Rank
                                                           Botswana, which topped the regional table for the                                                                   Burundi           138       2.52         36
 Panama            61          1.90          5
                                                                                                                       Mauritius         21          1.49         1
 Guyana            69          1.94          6             past four years. Botswana climbed six places to 31st                                                                Zimbabwe          140       2.54         37
                                                                                                                       Botswana          31          1.62         2
 Cuba              70          1.95          7
                                                           in the 2012 GPI, following a reduction in its score                                                                 Chad              145       2.67         38
                                                                                                                       Mozambique        48          1.80         3
                                                           for numbers of internal security officers and police                                                                Nigeria           146       2.80         39
 Paraguay          76          1.97          8
                                                           per 100,000 population and an improvement in its            Namibia           49          1.80         4
 Peru              79          2.00          9                                                                                                                                 Central African
                                                           human-rights situation (Political Terror Scale).            Ghana             50          1.81         5
                                                                                                                                                                               Republic          151       2.87         40
 Nicaragua         81          2.01          10
                                                               Gabon experienced the third-largest rise in             Zambia            51          1.83         6
                                                                                                                                                                               Democratic
 Brazil            83          2.02          11            peacefulness, with a drop in the Political Terror Scale     Sierra Leone      52         1.86          7            Republic of the
 Bolivia           84          2.02          12            and a reduced likelihood of violent demonstrations,                                                                 Congo             154       3.07         41
                                                                                                                       Lesotho           53         1.86          8
 Ecuador           85          2.03          13            linked, in part, to the landslide win of the governing      Tanzania          55         1.87          9            Sudan             156       3.19         42
 Dominican                                                 Parti Démocratique Gabonais (PDG) in the December                                                                   Somalia           158       3.39         43
                                                                                                                       Burkina Faso      56         1.88          10
 Republic          90          2.07          14            2011 legislative elections and the strengthening of
                                                                                                                       Djibouti          56         1.88          10           Average           97        2.20


16                                                                                                                                                                                                                           17
Analysis of                                                                                                                                                                                                                    Analysis of
the results                                                                                                                                                                                                                    the results


The Middle East and North Africa was the only                    Middle East
                                                                                                                            the currency in late 2008. The Icelandic Defence          2010. Denmark’s military nevertheless remains fairly
region to experience a decline in peacefulness, with a           and North           Overall   Overall       Regional       Agency (IDA), which was launched in 2008 with a           sophisticated (certainly compared with Iceland) and
downturn largely reflecting upheaval and instability             Africa              Rank      Score         Rank           budget of US$20 million, has now been disbanded.          the country aims to continue to support international
associated with the Arab Spring, which was sparked               Qatar               12         1.40         1
                                                                                                                            All of Iceland’s GPI gauges of militarisation are now     missions, such as those in Afghanistan and Libya,
in Tunisia in December 2010. Huge, sustained public                                                                         accorded “very low” scores; there is no standing          through stronger co-operation with NATO allies.
                                                                 United Arab
protests toppled the long-time president, Zine el                Emirates            46         1.79         2              army, and military expenditure was just 1.1% of GDP.          Most GPI indicators relating to safety and security
Abidine Ben Ali, a month later and rippled across the            Kuwait              47         1.79         3
                                                                                                                            The modest budget is mainly channelled to the Coast       in society are accorded very low scores. Denmark is
entire region and beyond during 2011. Deteriorations                                                                        Guard, which operates a small number of ships and         free from internal conflict and it enjoys good relations
                                                                 Morocco             54         1.87         4
in perceived criminality in society were registered in                                                                      helicopters. A member of NATO since its inception in      with neighbouring countries. Rates of violent crime
                                                                 Oman                59         1.89         5
six of the 16 countries and there were no improvements                                                                                                                                and homicide are very low, violent demonstrations are
                                                                 Jordan              62         1.91         6              The proportion of citizens who are in
in that indicator. Violent demonstrations also became                                                                                                                                 highly unlikely and just 74 people per 100,000 are in
                                                                 Tunisia             72         1.96         7              jail is one of the lowest in the world,
more likely in six countries across the region. There                                                                                                                                 jail, one of the lowest proportions in Europe. While
were several instances of improvement in this indicator          Saudi Arabia        106        2.18         8              dropping to 47 per 100,000 in 2011.                       the new centre-left coalition government has not had
(in Libya, Iraq and Bahrain, for example, albeit from            Egypt               111        2.22         9              1949, Iceland participates in international               the smoothest of starts since taking power in October
elevated levels last year). The popular uprising in              Bahrain             118        2.25         10             peacekeeping missions in Afghanistan, Lebanon,            2011, it is stable and not under threat.
Syria, a brutal crackdown by the Assad regime and                Algeria             121        2.26         11             Palestine and the Balkans, although economic
an increasingly violent insurgency, were reflected in                                                                       difficulties have led to budget cuts.
                                                                 Iran                128        2.32         12                                                                       2. New Zealand: 2nd PLACE
a steep deterioration in most GPI measures of the                                                                               Icelandic society is essentially harmonious, with
security situation (by far the biggest fall of the 158
                                                                 Lebanon
                                                                 Yemen
                                                                                     136
                                                                                     143
                                                                                                2.46
                                                                                                2.60
                                                                                                             13
                                                                                                             14
                                                                                                                            measures of safety and security including violent         1.239
countries surveyed), while further significant declines                                                                     crime, internal conflict and the number of homicides
                                                                 Libya               147        2.83         15
                                                                                                                            all accorded very low scores. The proportion of           New Zealand remains at second place in the 2012
in peacefulness were also detected in post-revolution
                                                                 Syria               147        2.83         15             citizens who are in jail is one of the lowest in the      GPI. Its overall score improved slightly in response
Egypt and Tunisia. Libya, which plummeted from a
                                                                 Israel              150        2.84         17             world, dropping to 47 per 100,000 in 2011. The            to a reduction in the size of the jailed population
relatively high position (46th in the 2009 GPI) amid
                                                                 Iraq                155        3.19         18             political scene has been stable under the centre-left     in 2011, although, at 199 per 100,000, it remains
the descent into civil war, experienced a modest slide
                                                                                                                            coalition of the Social Democratic Alliance (SDA)         notably higher than most other OECD countries
 in peacefulness in 2011-12. There were also                     Average             101        2.25
                                                                                                                            and the Left-Green Movement (LGM), led since              (58 in Japan, 73 in Norway and 111 in France in
deteriorations in Kuwait, Morocco, Oman and the
                                                                                                                            April 2009 by the reformist prime minister, Johanna       2011). Offsetting this was a marginal rise in military
United Arab Emirates.
                                                                                                                            Sigurdardottir. The government has been boosted           expenditure, to a still very modest 1% of GDP. The
    Qatar is again the nation ranked most at peace in
                                                                                                                            by a steady economic recovery in 2011, the passage        2010 Defence White Paper pledged to maintain and
the region (12th position); most indicators of safety
                                                                THE TEN COUNTRIES                                           of the 2012 budget and a reshuffle in January 2012,       enhance existing capabilities and to provide additional
and security in society are accorded very low scores
                                                                MOST AT PEACE                                               which included the removal of the most controversial      services, such as maritime air patrols, although there
and measures of ongoing conflict and militarisation
                                                                                                                            minister in the previous government, Jon Bjarnason.       were no promises of significant increases to the defence
are scored considerably lower than for the majority
                                                                Iceland is classified the most peaceful nation of 158                                                                 budget. Most measures of militarisation are scored
of its neighbouring countries, although the Emirates’
                                                                surveyed in the 2012 GPI, followed by Denmark and                                                                     very low, although military capability / sophistication
military expenditure as a percentage of GDP is the
                                                                New Zealand.                                                Denmark: 2nd PLACE                                        is adjudged to be moderate, on a par with most OECD
highest of the top 20. Algeria experienced the largest
year-on-year improvement in peacefulness, benefiting                                                                        1.239                                                     countries.
                                                                                                                                                                                          The majority of the GPI’s gauges of safety and
from warming relations with Libya’s National                    ICELAND: 1 PLACEst
                                                                                                                            Denmark’s GPI score improved for the second               security suggest that New Zealand society is broadly
Transitional Council after initial scepticism and signs
of reconciliation with Morocco. Several political
                                                                1.113                                                       successive year, contributing to a rise to joint second   harmonious; violent demonstrations are highly
                                                                                                                            place, alongside New Zealand. This partly reflects a      unlikely, while homicides and terrorist acts are very
reforms have been announced by the president,                   Iceland is in first place for the second successive year.
                                                                                                                            fall in military spending (to a relatively modest 1.3%    rare. The political scene remained stable, with the
Abdelaziz Bouteflika, including authorizing 17 new              The slight improvement in Iceland’s score this year
                                                                                                                            of GDP) at a time of government budget constraints.       centre-right National Party returned to power and
political parties to hold constituent congresses. They          reflects a drop in the measure of military capability
                                                                                                                            This continues a trend: the current Danish defence        securing a record-high 59 seats in parliament, amid
are reflected in a rise in the political stability indicator.   and sophistication to the lowest possible level, with
                                                                                                                            agreement reduces the number of the country’s F-16        strong approval for the prime minister, John Key,
The country has so far largely avoided mass protest             ongoing austerity measures in the wake of the collapse
                                                                                                                            fighter aircraft from 48 to 30 and the process of         and confidence in the government’s handling of
and social unrest.                                              of the country’s three main commercial banks and
                                                                                                                            procuring new F-35 fighters was put on hold in March      the economy, which grew by 1.2% in 2011. New


18                                                                                                                                                                                                                                        19
Analysis of                                                                                                                                                                                                                Analysis of
the results                                                                                                                                                                                                                the results


Zealand maintained harmonious relations with most        Japan: 5th PLACE                                             recent years have led to substantial reductions in the      measures of safety and security point to a largely
neighbouring countries, notably Australia, links with                                                                 fleet of armoured vehicles and artillery, although the      harmonious society, with a high level of trust in other
which are underpinned by the 1983 Closer Economic
                                                         1.326                                                        controversial procurement of Eurofighter Typhoon            citizens, a very low homicide rate and a very small
Relations (CER) agreement. The two governments are       Japan slipped to 5th position in the 2012 GPI, as a          interceptors went ahead and the Joint-Command Air           proportion of the population in jail.
negotiating a protocol on a common border, pension       result of an increase in the number of heavy weapons         Force now has 15 of the jets, which contributes to a
                                                                                                                                                                                  Ireland’s historically neutral stance
portability and joint investment, all of which would     and a slight rise in military spending as a proportion       “moderate” score for the country’s military capability
                                                                                                                                                                                  has required only a small professional
move the countries closer to their goal of forming a     of GDP. There was also a rise in the Political Terror        and sophistication.
single economic market.                                                                                                   Offsetting the improvements in two indicators
                                                                                                                                                                                  defence force and the country’s
                                                         Scale for the first time since 2004 from a very low
                                                         level—the result of concerns raised in Amnesty               was a rise in the number of internal security officers      measures of militarisation are accorded
                                                         International’s 2010 annual report. Despite the ban          and police in Austria for the second successive             very low scores.
Canada: 4th PLACE
                                                         on maintaining war potential that was enshrined in           year, according to the most recent UNODC survey.               Ireland’s historically neutral stance has required
1.317                                                    Japan’s 1946 constitution, the country’s Self-Defence        Nevertheless, the number of police officers per head        only a small professional defence force and the
                                                         Forces (SDF) are sophisticated and capable and in            remains one of the lowest in the OECD. There was            country’s measures of militarisation are accorded very
Canada’s GPI score improved slightly for the second
                                                         late 2010 the government unveiled plans to boost             also a rise in the likelihood of violent demonstrations,    low scores. Military expenditure fell to just 1.2% of
successive year and it rose to 4th position, although
                                                         its southern forces over the next decade to counter          partly reflecting the protests against internet             GDP in 2011, one of the lowest levels among OECD
this was also a consequence of Japan’s slide from 3rd
                                                         China’s military rise. It will also strengthen its missile   restrictions (the Anti-Counterfeiting Trade Agreement,      countries. The armed forces have been asked to cut
in the 2011 GPI. The barometer of the number of
                                                         defences against the threat from a nuclear-armed             ACTA) in several Austrian cities in February 2012.          US$147 million from their spending plans from 2011-
deaths in external conflict declined, reflecting fewer
                                                         North Korea. In December 2011 the government                 Most other measures of safety and security in society       14 as part of a wider package of government cutbacks.
fatalities suffered by Canadian troops in Afghanistan
                                                         announced a relaxation of Japan’s self-imposed ban           are accorded very low scores, notably the level of
in 2010, compared with the previous year. Canada has
                                                         on arms exports, saying it will allow the country to         violent crime and the homicide rate, which remain
played a key role in NATO’s International Security
                                                                                                                      among the lowest of the 158 nations surveyed.
                                                                                                                                                                                  Slovenia: 8th PLACE
                                                         supply military equipment for humanitarian missions.
Assistance Force (ISAF), with more than 2,500
troops stationed near Kandahar, which accounts for
                                                             While the prime minister, Naoto Kan, stepped                                                                         1.330
                                                         down in August amid sustained criticism of his               Ireland: 6th PLACE
higher scores for the number of internal and external                                                                                                                             Slovenia moved up to 8th position in the 2012 GPI
                                                         handling of the Fukushima nuclear crisis, his
conflicts fought and the estimated number of deaths
from external conflict (158 since 2002) than the other
                                                         successor, Yoshihiko Noda of the ruling Democratic           1.328                                                       as a result of improvements to two indicators in its
                                                                                                                                                                                  military sphere. Budgetary constraints caused military
                                                         Party of Japan enjoyed high approval ratings and
countries in the top ten of the GPI. The controversial                                                                Ireland’s score improved considerably and it re-entered     expenditure to fall to just 1.4% of GDP in 2011 and
                                                         political stability was maintained (accorded the lowest
deployment ended in July 2011, although a separate                                                                    the top ten in the 2012 GPI, after two successive           plans to modernise equipment were put on hold,
                                                         possible score). Japan remained free from civil unrest
training mission, involving some 950 troops will be                                                                   deteriorations linked to the economic and political         leading to a drop in the score for military capability /
                                                         in 2011, while violent crime and homicides are rare
based in Kabul until 2014.                                                                                            crises. The political scene stabilised after a new          sophistication. The air force lacks any fighter aircraft,
                                                         and terrorist acts highly unlikely. Stringent laws
    Offsetting this gain was a rise in the number                                                                     coalition government, comprising the centre-right           with air policing supplied by the Italian air force.
                                                         prohibit the possession of firearms, all of which feed
of internal security officers and police under the                                                                    Fine Gael and the centre-left Labour Party and led          A small contingent of soldiers joined NATO’s ISAF
                                                         into a high overall position in the GPI.
minority conservative administration. There were                                                                      by Enda Kenny, the prime minister, took power in            operation in Afghanistan in 2004 and 87 remained
more than 69,000 active police officers in Canada in                                                                  March 2011. It displayed levels of energy, cohesion         in Herat in 2011, which became an increasingly
2010, an increase of almost 2,000 from the previous      Austria: 6th PLACE                                           and purposefulness that were conspicuous by their           controversial political issue. Other international
year equating to 203 per 100,000 population, the                                                                      absence in the outgoing government. The Irish public
highest rate since 1981. Most of Canada’s measures
                                                         1.328                                                        responded favourably and has been broadly generous
                                                                                                                                                                                  military deployments are restricted to various NATO
                                                                                                                                                                                  and UN peacekeeping missions, most notably in
of societal safety and security are accorded very low    Austria’s overall score improved very slightly from          in giving the new government the benefit of the doubt       Kosovo.
scores. The proportion of the population in jail is      last year, but it dropped by one ranking place as a          as it struggles to implement austerity measures that           Several measures of safety and security in
higher than the Scandinavian nations, at 117 per         result of a more substantial gain in Canada’s score.         will entail several years of tax rises and spending cuts.   Slovenian society receive the lowest possible scores,
100,000 people in 2011, but lower than in New            The compilers of the Political Terror Scale report a              Signs of life in the economy—it grew by 0.7%           including the level of violent crime, the proportion
Zealand and much lower then the US. Access to small      more benign environment in Austria in 2010 (the most         in 2011, the first expansion since 2007—probably            of the population in jail and the rate of homicides,
arms and light weapons has been restricted since         recent year for which data are available) and there was      contributed to a reduced number of violent                  although violent demonstrations are considered
the 1995 Firearms Act and they are far less readily      a drop in military spending to a mere 0.6% of GDP,           demonstrations during 2011, although they are               to be more likely than in neighbouring Austria.
available than in the US, but more so than in Japan      one of the lowest levels in the world. Budget cuts over      considered to be more likely in Ireland than in most        While Slovenia’s centre-left coalition lost a vote of
and several Western European countries.                                                                               other countries in the top ten of the GPI. Other


20                                                                                                                                                                                                                                     21
Analysis of                                                                                                                                                                                                              Analysis of
the results                                                                                                                                                                                                              the results


confidence in September 2011, it remained in power        of Finland’s population were in jail in 2011; among        position. In the general election of October 2011,          hundreds of deaths. Following several high-profile
as a caretaker government and a new centre-left           the top ten nations, only Iceland and Japan are lower.     there was no significant change in the balance of           kidnappings by al-Shabaab in northern Kenya,
party—Positive Slovenia—won elections in December         The country remains free of civil unrest and, while        power, with the centre-right Swiss People’s Party           in October 2011 Kenyan forces launched revenge
and the score for political instability remained very     the six-party coalition government that was formed in      (SVP) retaining most seats. While the euro debt crisis      attacks. Several hundred Ethiopian troops returned
low. It remains the lowest of the Balkan countries        June 2011 represents a broader spectrum of opinion         and the strength of the Swiss franc pose threats, the       to Somalia in December. The International Maritime
by some margin and it is matched only by Slovakia         than is usual, it is stable and expected to last out its   fundamentals of the economy are strong and violent          Bureau reported a growing number of violent pirate
in the Central and Eastern Europe region. Despite         four-year term. Relations with neighbouring countries      demonstrations remained highly unlikely in 2011 and         attacks off the coast of Somalia in 2011, with 237
gradual progress on settling their long-running border    are harmonious and violent crime is very rare—the          early 2012.                                                 incidents, compared with 219 in 2010, although the
dispute, relations with Croatia remained difficult in     score is unchanged from last year—although the                                                                         number of successful hijackings fell.
2011 and several other issues related to the Yugoslav     homicide rate remains higher than in the other Nordic                                                                      On July 20th 2011 the UN declared famine in
succession remain unresolved, including the financing     countries. Terrorist acts are rare and are considered to   The ten countries                                           Somalia after four years of drought. During 2011
of radioactive-waste disposal at the jointly owned        be highly unlikely.                                        least at peace                                              war and famine caused around 286,000 Somalis to
nuclear-power plant at Krsko. Slovenia’s tally for                                                                                                                               flee the country and around 330,000 to be internally
relations with neighbouring countries therefore                                                                      War-torn Somalia is classified the least at peace out of    displaced. Figures from the UNHCR and the Internal
                                                          Switzerland: 10th PLACE                                    158 countries, followed by Afghanistan.
remains higher than that of most countries in the top                                                                                                                            Displacement Monitoring Centre suggest that around
ten of the GPI.                                           1.349                                                                                                                  1.9 million Somalis have been displaced by the
                                                                                                                     Somalia: 158th PLACE                                        ongoing conflicts. This amounts to more than 20% of
Finland: 9th PLACE                                        Switzerland moved into the top ten of the GPI for the
                                                                                                                                                                                 the population, giving Somalia the worse possible GPI
1.348                                                     first time, primarily as a result of contractions in its   3.392                                                       score. Almost all of Somalia’s measures of societal
                                                          military sphere. While the country has a tradition of
                                                                                                                     Somalia is rooted at the foot of the GPI for the            safety and security are accorded very high scores.
Finland’s overall score improved slightly as a result     neutrality that dates from the Treaty of Paris in 1815,
                                                                                                                     second successive year—the country’s overall score          The exceptions are police numbers per head and the
of a drop in military expenditure, to 1.4% of GDP         Switzerland maintains a significant defence industry
                                                                                                                     deteriorated as a result of a fall in the gauge of          proportion of the population in jail, on account of the
in 2011, but it slipped to 9th position as a result of    and exports of conventional weapons per head of
                                                                                                                     political stability. This partly reflects the resignation   country’s lack of civil institutions.
a more substantial improvement in Ireland’s GPI           population are the highest in Europe. However, the
tally. Like many other European countries, defence        volume has declined since restrictions banning sales       of the prime minister, Mohamed Abdullahi Mohamed
expenditure has come under pressure and Finland           to countries involved in armed conflict or which           Farmajo, in June 2011 amid further challenges to the        Afghanistan: 157th PLACE
                                                                                                                     transition to democratically elected government. The
has embarked on a wide-ranging review that may
include the closure of bases. Since the end of the
                                                          “systematically and severely violate human rights”
                                                          were introduced in 2009. Military expenditure              mandate of Somalia’s dysfunctional institutions—the         3.252
cold war, Finland has adopted a policy of strategic       was reduced to 1.2% of GDP in 2011, continuing a           Transitional Federal Government (TFG) and the               Embroiled in conflict and instability for much of the
non-alignment and chosen not to apply for NATO            trend that began in 2003 when a sweeping reform            Federal Transitional Parliament (FTP)—was duly              past two decades, Afghanistan remained far from
membership, despite the fact that the three former        programme, known as Army XXI, was introduced.              extended until August 2012. Mr Farmajo’s departure          peaceful during in the past year: the country’s GPI
                                                          This is also reflected in a decline in the GPI gauge       sparked demonstrations in the streets of the capital,       score deteriorated and only Somalia is ranked lower.
Soviet Baltic states joined in 2004. The majority of
                                                          of the number of heavy weapons per head in                 Mogadishu; he was widely considered to be one of the        The UN estimates that 3,021 civilians were killed
Finland’s measures of militarisation are accorded
                                                          Switzerland last year. The recent procurement of           most capable prime ministers that Somalia has had           during 2011 (up from 2,790 in 2010), making it the
low scores in a broad international comparison, with
                                                          new Swedish Gripen fighter jets in a US$3.4 billion        for years. While the TFG gained a foothold in parts of      deadliest period for civilians since 2001. Militants
a small number of troops per head of population
                                                          deal may be undermined by the new government,              southern Somalia with the support of African Union          carried out suicide attacks, deployed roadside
and fairly low volumes of imports and exports of
                                                          which has demanded savings. Military capability and        troops, it still controlled only part of Mogadishu in       bombs and conducted large-scale attacks on public
conventional weapons. There is a growing emphasis
                                                          sophistication is scored as “moderate” and, while          early 2012.                                                 places, amid continued confrontation between the
on participation in international defence partnerships,
                                                          restricted, access to light weapons is easier than in          Somalia has not had a nationally functioning            NATO-supported Afghan National Army (ANA)
which will probably extend to procurement, and 195
                                                          Iceland and New Zealand.                                   state government since its descent into civil war in        and a Taliban-backed insurgency that has spread
soldiers are deployed in Afghanistan as part of the
                                                              Switzerland’s measures of safety and security          1991 and in 2011 the violent confrontation between          well beyond its stronghold in the south and east of
NATO-led force. The number of heavy weapons per
                                                          confirm that society is broadly harmonious, with           the TFG and Islamist rebel groups, Hizbul Islam and         the country. In June a hospital in Azra district was
head is relatively high, on a par with Sweden, but
                                                          very low levels of violent crime, homicides and            al-Shabaab, continued for the sixth successive year.        destroyed, killing 27 people and injuring 53. In
notably higher than New Zealand, Japan and Ireland.
                                                          terrorist acts. The compilers of the Political Terror      Outbreaks of fierce fighting frequently engulfed parts      December at least 58 were killed in twin attacks on a
   Most measures of safety and security in society
                                                          Scale consider that Switzerland has become a more          of Mogadishu and towns across southern Somalia,             Shia shrine in the capital, Kabul, and a Shia mosque
are accorded very low scores; only 59 per 100,000
                                                          benign environment: its score improved to the lowest       including Beledweyne and Bulo Hawo, resulting in            in Mazar-i-Sharif. Casualties among the NATO-


22                                                                                                                                                                                                                                  23
Analysis of                                                                                                                                                                                                                Analysis of
the results                                                                                                                                                                                                                the results


led International Security Assistance Force (ISAF)          for much of 2011 owing to an ongoing controversy              Sudan’s scores for the Political Terror Scale remain    population in 2010-11, down from 15.4% the
dropped to 566 in 2011, compared with 711 in 2010           surrounding the September 2010 parliamentary              at the highest possible level, unchanged since 2002.        previous year, but still one of the highest levels in the
and 521 in 2009.                                            election.                                                 Perceptions of criminality and the level of violent         world.
    Most indicators of societal safety and security,                                                                  crime, however, receive more moderate scores than               The political scene became more unstable, with
such as terrorist acts and levels of violent crime rates,                                                             most countries in the lowest reaches of the GPI,            the unity government, led by Nouri al-Maliki, the
                                                            sudan: 156th PLACE
are accorded very high GPI scores, although the                                                                       notably Somalia, Iraq and Afghanistan, which                prime minister, weak and divided. In December an
Political Terror Scale tally dropped slightly. Violent      3.193                                                     reflects Sudan’s size and the fact that, while parts        arrest warrant was issued for vice-president Tareq al-
demonstrations became less likely, having been at                                                                     of the country are in turmoil, other areas, including       Hashemi, who is accused of involvement in terrorism
                                                            Sudan’s GPI tally improved slightly as a result of a
an elevated level of risk last year. Offsetting these                                                                 the capital, Khartoum, are stable. Most GPI tallies         and the Al-Iraquiya bloc boycotted parliament and the
                                                            gradual easing of the refugee crisis in Darfur during
improvements were deteriorations in two indicators in                                                                 in the military sphere receive low scores—military          cabinet. Iraq remains a highly militarised country, the
                                                            2010; the UNHCR reported that the number of
Afghanistan’s military sphere. There was a rise                                                                       expenditure rose in 2010, but to a relatively modest        legacy of Saddam Hussein’s steady build-up of forces
                                                            refugees and IDPs dropped to 10.5% of Sudan’s
                                                                                                                      1.5% of GDP.                                                from his time as head of security in the ruling Ba’ath
Most indicators of societal safety and                      population, with a consequent decline in the GPI
                                                                                                                                                                                  Party in the 1970s. Small arms and light weapons
security, such as terrorist acts and levels                 indicator from the highest possible level. The UN
                                                                                                                                                                                  are very easily obtained. Military expenditure fell
of violent crime rates, are accorded very                   estimates that up to 300,000 people have died and         Iraq: 155th PLACE
                                                                                                                                                                                  to 3.1% of GDP in 2011, which partly reflects the
high GPI scores, although the Political                     around 2.7 million have been forced to flee their
                                                            homes from the combined effects of war, famine and
                                                                                                                      3.192                                                       government’s decision to delay the purchase of
Terror Scale tally dropped slightly.                                                                                                                                              Lockheed Martin F-16 fighter jets and divert US$900
                                                            disease in Darfur since 2003. Hopes of an end to the      Iraq’s GPI score improved in 2011, with a modest
in the number of internal security officers and                                                                                                                                   million of allocated funds into the country’s food-
                                                            Darfur conflict were high in March 2011, when the         fall in the intensity of internal conflict and a reduced
police; the Afghan National Police is being steadily                                                                                                                              ration programme.
                                                            main rebel force, the Justice and Equality Movement       likelihood of violent demonstrations, although it
strengthened with support from NATO states and
                                                            (JEM), signed a peace accord with the government,         remained among the five lowest-ranked countries.
amounted to 126,000 active staff in mid-2011, with
                                                            but a failure to agree on specifics was accompanied by    The US military support for Iraq’s government ended
160,000 expected by 2014. Development of the ANA                                                                                                                                  Democratic Republic
                                                            renewed violent clashes with smaller rebel groups.        in mid-December 2011 when the last contingent of
continued, the intention being that it will reach full
                                                                South Sudan became an independent nation on           47,000 troops withdrew. While the country’s overall         of the Congo: 154th PLACE
capacity in time for the planned withdrawal of NATO
forces at the end of 2014, which was reflected in a rise
                                                            9th July 2011, but a violent dispute over the border in
                                                            the oil-rich Abyei province rumbled on, with dozens
                                                                                                                      security situation can be said to have eased for the
                                                                                                                      second year running, the measure of internal conflict
                                                                                                                                                                                  3.073
in military expenditure as a proportion of GDP.
                                                            of fatalities and many thousands of people forced to      is still at a high level; sectarian tension and violence    The Democratic Republic of the Congo’s (DRC) score
    The GPI measure of the number of displaced
                                                            leave their homes. Violent conflicts also erupted in      remain widespread and the Iraq Body Count recorded          deteriorated in 2011 for the second successive year
people (including refugees) increased for the second
                                                            the Sudanese provinces of South Kordofan and Blue         4,087 civilian deaths from violence in 2011, a slight       and the country slipped to 154th position. Violent
successive year, to over 3 million, which amounts
                                                            Nile between the government and the Sudan People’s        rise from last year. Sunni militant groups launched         demonstrations became more likely and levels of
to 11.4% of the population, one of the highest
                                                            Liberation Movement/Army-North, and inter-                bomb attacks on governmental institutions and               violent crime ratcheted up amid an escalation of
proportions in the world. According to the IDP
                                                            ethnic conflict over livestock and natural resources      security forces across the country, notably in Anbar,       violent conflict in the east of the country and in the
taskforce, 448,000 people were displaced by armed
                                                            intensified in parts of South Sudan. Most of the GPI      Diyala, Salah ad Din and Baghdad. The number of             capital, Kinshasa, and other cities ahead of elections.
conflict, human-rights abuses and other general
                                                            gauges of ongoing conflict therefore remained at very     homicides per 1,000 people, the level of violent crime,     Clashes in North and South Kivu between the Hutu
violence at the end of 2011. The number of conflict-
                                                            high levels.                                              the perceptions of criminality, the likelihood of violent   rebels of the Democratic Forces for the Liberation
induced IDPs has been rising steadily since 2007,
                                                                The measure of political stability deteriorated,      demonstrations and the potential for terrorist acts all     of Rwanda (FDLR), allied with smaller groups
increasing by 27% in 2011 and almost doubling since
                                                            having improved last year in response to the first        receive the highest possible scores (unchanged from         including the Mayi-Mayi and the Forces Armées de
2008, according to the UNHCR.
                                                            comprehensive and (partly) contested elections            last year).                                                 la République Démocratique du Congo (FARDC, the
    Afghanistan’s political scene became even more
                                                            in a quarter of a century. The downgrade reflects             A growing number of Iraq’s many internally              national army), left scores dead and forced thousands
unstable in 2011 following a deteriorating security
                                                            mounting tensions within the ruling National              displaced people were able to return home in 2010           to leave their homes. There were also deadly clashes
situation and several high-profile assassinations. The
                                                            Congress Party (NCP), headed by the president, Omar       and 2011, which also contributed to the improvement         between the FARDC and Ituri militias near the
leader of the Kandahar Provincial Council and a
                                                            al-Bashir, over allowing the south to secede. The loss    in Iraq’s GPI score. This partly reflects the return of     Ugandan border, causing around 30,000 people to
major political power-broker, Ahmed Wali Karzai,
                                                            of 75% of the country’s oil reserves and 20% of its       Iraqis from an increasingly unstable Syria (around          flee the town of Gety. The disturbances in Kinshasa
was killed on July 12th, and the head of the High
                                                            population presents severe economic challenges, and       one million Iraqis are thought to live there, with          were sparked by an attempted coup in February, in
Peace Council, Burhanuddin Rabbani, was killed
                                                            the ensuing austerity is provoking unrest, possibly       another 475,000 in Jordan). The UNHCR estimates             which 19 were killed. Violence marred the run-up to
on September 20th. Parliament was at an impasse
                                                            inspired by the events of the Arab Spring.                that refugees and IDPs amounted to 9.4% of the


24                                                                                                                                                                                                                                     25
Analysis of                                                                                                                                                                                                             Analysis of
the results                                                                                                                                                                                                             the results


presidential and parliamentary elections in November,      related terrorist threat are also key factors, along       greatest proportion of the 158 countries surveyed         renewed donor engagement. Small arms and light
with 25 reportedly killed on the election weekend, and     with a low ranking in the Political Terror Scale and       and almost three times that of Saudi Arabia, the          weapons are easily obtained in the Central African
although Joseph Kabila was reinstated as president,        a high homicide rate. The secession conflict between       next largest at 7.7%. North Korea’s scores for its        Republic, but other measures of militarisation are
the political scene clearly became more volatile over      Islamic militants and Russia’s central and regional        military capability and sophistication and stock          accorded very low scores—the army comprises just
the year.                                                  government in Dagestan continued at a highly violent       of heavy weapons are also high, remaining at last         2,150 trained soldiers.
    Ongoing conflicts and instability, high rates          level, with shootings, bombings and ambushes against       year’s elevated level, following a South Korean
of crime and an estimated 2.1 million displaced            security forces and local authorities claiming more        report suggesting that the country had increased its
                                                                                                                                                                                Israel: 150th place
people and refugees are the disastrous consequence         than 400 lives, a rise of around 20% compared with         investment in tanks and special forces, which number
of decades of misrule in DRC, including a civil war        2010. Violent conflict was also recorded in Ingushetia,    200,000.                                                  2.842
between 1998 and 2003 that caused as many as               Chechnya and Kabardino-Balkaria. Russia’s score
                                                                                                                                                                                Israel’s score improved for the third successive year,
3 million deaths through fighting or disease and           for the GPI indicator of internal conflict remained
                                                                                                                      Central AFRICAN                                           although it remained among the ten lowest-ranked
malnutrition. DRC’s relations with neighbouring            “moderate” in 2011-12, in spite of events in the North
countries are again accorded a moderate score, which       Caucasus, reflecting the fact that large areas of the
                                                                                                                      Republic: 151st PLACE                                     nations, at 150th place. The upturn reflects falls in

reflects strong links with Rwanda and Zambia.              country are free of conflict.                              2.872                                                     two of the GPI measures of the country’s military
                                                                                                                                                                                sphere: the volume of imports of major conventional
Relations with Angola remained tense, however,
                                                                                                                      The Central African Republic’s (CAR) score                weapons and the number of armed service personnel
with an ongoing dispute over the two countries’
                                                           North Korea: 152ND PLACE                                   deteriorated for the second year running and it           per head of population, albeit from some of the
maritime border and offshore oil. Most indicators in
the military sphere are accorded low scores, although      2.932                                                      dropped to 151st place of 158 nations (last year it       highest levels in the world. While Israel’s military is
                                                                                                                                                                                powerful and highly sophisticated and expenditure
the rise in military expenditure to 1.4% of GDP may                                                                   was 144th of 153). There was a rise in the number of
                                                           North Korea is among the ten lowest-ranked nations         refugees and internally displaced people as a result      stayed above 6% of GDP in 2010, the budget (and
reflect plans for greater military collaboration with
                                                           in the GPI for the second year running, although its       of violence and instability that continues to permeate    the government of the right-wing prime minister,
China, which has recently signed a multi-billion-US-
                                                           score improved as a result of a reduced likelihood         several parts of the country. This includes clashes       Benyamin Netanyahu) came under pressure in 2011
dollar infrastructure-for-minerals deal with DRC.
                                                           of violent demonstrations and a drop in the level          between a rebel group that has not signed up to the       following a series of mass protests and industrial
                                                           of violent crime. This follows a sharp decline in          peace process—Convention des Patriotes pour la            action over spiralling food, fuel and housing costs.
Russia: 153RD PLACE                                        peacefulness in North Korea that was registered by         Justice et la Paix (CPJP)—and the national army,          The demands for economic reforms, and even

2.938                                                      the 2011 GPI in response to reports of a dramatic
                                                           escalation in violence and brutality at the hands of the
                                                                                                                      the Forces Armées Centrafricaines (FACA). A peace         Netanyahu’s resignation, dramatically shifted the
                                                                                                                                                                                national debate to the economy, eclipsing even the
                                                                                                                      deal was signed by the CPJP and the government in
Russia’s score improved slightly in the 2012 GPI as        regime. Public executions tripled, with capital offences   June 2011, but fighting erupted again in September,       usually dominant security issue, which is reflected in a
a result of gains in two indicators: a drop in military    reportedly including robbery, people-trafficking,          with 43 people reportedly killed near the eastern         rise in the GPI political instability score.
expenditure as a proportion of GDP and a reduction         the illicit use of mobile phones and unauthorised          town of Bria. The UNHCR estimates that 130,000                While there were fewer deaths recorded from
in the jailed population for the fourth successive         possession of US dollars. There was speculation            CAR refugees have sought refuge in Chad, Cameroon         organised internal conflict, the conflict between
year. Nevertheless, 534 per 100,000 remains high           that the reign of terror was instituted to enforce the     and Sudan, while around 176,000 IDPs remains              Israeli forces and the Islamist Resistance Movement,
by international comparison—only Georgia, Eritrea,         succession of Kim Jong-eun, Kim Jong-il’s third son,       within the country, living in constant fear of violence   (Hamas), (which has controlled Gaza since June 2007)
Rwanda and the US incarcerate a higher proportion          and there has been no evidence of any deviation            from clashes between groups. Attacks by the Lord’s        remained violent and other GPI measures of conflict
of their population. Military expenditure dropped to       from the traditional, hard-line approach since Kim         Resistance Army in the far south explain the high         retained high scores. Throughout 2011 Hamas and
2.3% of GDP following a sharp rise in the wake of the      Jong-eun assumed power after his father’s death in         scores that are accorded to most of the CAR’s             other militants launched rocket attacks on southern
brief war with Georgia in August 2008, when military       December.                                                  measures of ongoing conflict and societal safety and      Israel from Gaza and the Israeli forces retaliated with
reform and modernisation became a national priority.           Pyongyang’s relations with neighbouring South          security.                                                 air strikes. Violence escalated in March and April,
Russia’s lowly position in the GPI (153rd of 158           Korea remained very tense in 2011 and early 2012               The political scene remained uncertain, following     with Israeli forces mounting the heaviest attacks
nations) can in large part be attributed to its powerful   in the wake of the sinking of a South Korean               the disputed re-election of François Bozizé in early      since 2009, with around 40 Palestinian casualties. A
and sophisticated military sphere and defence              naval vessel, the Cheonan, and missile salvos at           2011. While his ruling party, Kwa Na Kwa, secured         terrorist attack by affiliates of the Popular Resistance
industry. Exports of major conventional weapons,           Yeonpyeong, one of five South Korean islands in the        an overwhelming majority in the National Assembly         Committees on August 18th killed eight Israelis and
the number of heavy weapons per head and the size          West (Yellow) Sea, close to North Korea, in 2010.          (76 of 105 seats), Mr Bozizé’s new cabinet fell short     injured dozens.
of the police force relative to the population are, for    Relations with China and Japan were also strained.         of hopes for an inclusive unity government, making            Israel’s indicators of societal safety and security
example, among the highest of any country.                 North Korea is a highly militarised state: military        a return to political stability unlikely, even with       present a mixed picture, as before. On the one hand,
    Ongoing conflicts in the North Caucasus and the        expenditure is estimated at 20% of GDP, by far the                                                                   the level of violent crime and homicide rate are low


26                                                                                                                                                                                                                                   27
Analysis of                                                                                                                                                                                                                         Analysis of
the results                                                                                                                                                                                                                         the results


and violent demonstrations are unlikely to occur.          plotting to overthrow the government by accusing its     Risers and fallers                                                    Top-five national
On the other hand, the incidence of terrorist acts is      commanders of acting as a “state within a state”.
                                                                                                                                                                                          improvements in peacefulness
high and relations with neighbouring countries are
                                                           RELATIONS WITH NEIGHBOURING AFGHANISTAN
tense—Israel remains in a formal “state of war”                                                                                                    Change                    Change
                                                           AND INDIA REMAINED FRAUGHT.                                               Score,        in Score,    Rank,        in rank,     Sri Lanka
with its northern neighbours, Syria and Lebanon,
                                                           Mr Gilani came under further pressure in January          Country         2012          2011–12      2012         2011–12
                                                                                                                                                                                          103rd
                                                                                                                                                                                    *

and relations with much of the Arab world and Iran
remain highly strained.                                    2012, when the Supreme Court threatened to dismiss        Top 5
                                                           him because of his failure to comply with its order to    risers                                                               Change in score 2011-12: -0.292
                                                           reopen corruption cases pending against the president,                                                                         Change in rank 2011-12: 27
                                                                                                                     Sri Lanka        2.145        -0.292        103          ↑27
Pakistan: 149th place                                      Asif Ali Zardari. Relations with neighbouring                                                                                  Sri Lanka’s score improved markedly for the second
2.833
                                                                                                                     Zimbabwe         2.538        -0.186        140           -
                                                           Afghanistan and India remained fraught and the                                                                                 successive year in the aftermath of the defeat of the
                                                                                                                     Bhutan           1.481        -0.182        19           ↑11
                                                           compilers of the Political Terror Scale ratcheted                                                                              Tamil Tigers and the ending of two decades of civil
Pakistan’s GPI score improved modestly in 2011, in         up Pakistan’s status to “level 5” for the first time,     Guyana           1.937        -0.178        69           ↑21
                                                                                                                                                                                          war in May 2009. The GPI indicator of the number of
part because of a further easing of the overall security   as “terror has expanded to the whole population”.         Philippines      2.415        -0.157        133           2
                                                                                                                                                                                          deaths from organised (internal) conflict fell sharply
situation from the violence verging on civil war that      Pakistan’s nuclear-armed military is highly capable       Top 5                                                                in response to the fact that there were no casualties
engulfed much of the country in 2009. According to         and sophisticated and defence expenditure rose to         FALLERS
                                                                                                                                                                                          in 2010, compared with 15,565 in 2009. There were
the Institute for Conflict Management, terrorism-          3.2% of GDP in 2011. Small arms and light weapons         Syria            2.830        +0.523        147          ↓31         related declines in the homicide rate, the frequency
related violence caused 6,142 deaths in Pakistan           are very easily obtained, although most of Pakistan’s
                                                                                                                     Egypt            2.220        +0.215        111          ↓40         of terrorist acts and the Political Terror Scale. In
in 2011, down from 7,435 last year and 11,585 in           other GPI measures of militarisation are accorded
                                                                                                                     Tunisia          1.955        +0.193        72           ↓29         August 2011 the president, Mahinda Rajapaksa,
2009. Fewer suicide-bombing attacks and a reduction        relatively low scores, unchanged from last year.
                                                                                                                     Oman             1.887        +0.150        59           ↓20
                                                                                                                                                                                          announced the lifting of the state of emergency
in sectarian violence were reflected in lower tallies
                                                                                                                                                                                          imposed since 1963 to confront the threat from Tamil
for three GPI indicators: terrorist acts, the level of                                                               Malawi           1.894        +0.146        60           ↓19
                                                                                                                                                                                          Separatists. The level of internal conflict nevertheless
organised internal conflict and estimated deaths from
                                                                                                                                                                                          remains “moderate”, reflecting signs of intermittent
internal conflict. Nevertheless, they, and most other                                                               Sri Lanka’s GPI score experienced the largest year-
                                                                                                                                                                                          violence and reports of continued abductions and
measures of conflict and societal safety and security                                                               on-year improvement (rise in peacefulness) of the
                                                                                                                                                                                          disappearances, including two cases in the northern
remained at elevated levels. Terrorist-engineered                                                                   158 nations surveyed and it climbed 27 places to a
                                                                                                                                                                                          city of Jaffna in December 2011. Military expenditure
explosions and “target killings” rocked many towns                                                                  still-low 103rd position. Zimbabwe’s score improved
                                                                                                                                                                                          declined in 2011 as a proportion of GDP amid
and cities. The government launched two major                                                                       by the second-largest margin and Bhutan’s the third-
                                                                                                                                                                                          pressures to cut the country’s deficit. Nevertheless,
offensives against Tehrik-i-Taliban Pakistan (TTP, an                                                               largest.
                                                                                                                                                                                          a rise in defence spending appears likely in 2012,
alliance of around a dozen militant Islamist groups                                                                     Syria’s score deteriorated to the largest extent from
                                                                                                                                                                                          justified by security officials to repay loans on military
based in the country) in the Federally Administered                                                                 the 2011 GPI, reflecting a wave of popular protests,
                                                                                                                                                                                          hardware acquired to fight the Tamil Tigers.
Tribal Areas (FATA), the most volatile region, which                                                                a brutal crackdown by the army and an eruption of
reportedly killed more than 200 militants and forced                                                                violent conflict that resulted in an estimated 9,000
at least 100,000 to flee their homes.                                                                               dead by March 2012. Post-revolution Egypt and                         Zimbabwe
    Conflict between various militant separatists
and the government over the status of Balochistan
                                                                                                                    Tunisia deteriorated by the second and third-largest
                                                                                                                    margins, respectively.
                                                                                                                                                                                          140th
continued and ethnic violence escalated in Sindh                                                                                                                                          Change in score 2011-12: -0.186
province; the Human Rights Commission of Pakistan                                                                                                                                         Change in rank 2011-12: 0
estimates that as many as 1,400 people were killed                                                                                                                                        Zimbabwe’s score advanced strongly as a result of
in Karachi alone in the first eight months of 2011.                                                                                                                                       improvements to five of its GPI measures, including
The political scene remained highly unstable in                                                                                                                                           a drop in the homicide rate (albeit from a very high
2011, with growing tensions between the weak                                                                                                                                              level), and a decline in the number of refugees and
coalition government and the army. In December                                                                                                                                            internally displaced people. The advances in several
                                                                                                                        *The 2011 Global Peace Index included only 153 countries, while
speculation mounted that a military coup was in the                                                                                                                                       measures of societal safety and security coincided
                                                                                                                    the 2012 GPI includes 158, which affects changes in ranking.
offing after the prime minister, Yusuf Raza Gilani,                                                                                                                                       with a gradual improvement in the economy from a
made public remarks implying that the army was


28                                                                                                                                                                                                                                              29
Analysis of                                                                                                                                                                                                                 Analysis of
the results                                                                                                                                                                                                                 the results


dire state, since a power-sharing government between       Guyana                                                                                                                  headed by the prime minister, Kamal el-Ganzouri.
the president, Robert Mugabe, and the opposition was
                                                                                                                        TOP-FIVE national
established in February 2009—in particular, inflation
                                                           69th                                                         deteriorations in peacefulness
                                                                                                                                                                                   Clashes between pro-democracy demonstrators and
                                                                                                                                                                                   the military police occurred across the country,
is now at single-digit levels, while economic growth       Change in score 2011-12: -0.178                                                                                         with scores of casualties. The deteriorating security
                                                                                                                        Syria
has been relatively strong, led by the agriculture and     Change in rank 2011-12: 21                                                                                              situation and rising crime rates (there have been
mining sectors. State finances nevertheless remain
                                                           Guyana’s score improved robustly in 2011 and the
                                                                                                                        147th                                                      more frequent reports of robberies, car-jackings and
constrained after a decade-long economic crisis to                                                                                                                                 thuggery, which are reflected in declines in several
                                                           country rose 21 places, to 69th position. The surge
2008. Zimbabwe’s military expenditure contracted                                                                                                                                   GPI indicators) have been attributed to the Mubarak
                                                           up the GPI ranking is greater than that for Zimbabwe         Change in score 2011-12: +0.523
year on year to 2.5% of GDP. While Zimbabwe’s                                                                                                                                      regime’s decision to release prisoners from jail during
                                                           because there is a much narrower spread of scores            Change in rank 2011-12: 31
score improved, there was no improvement in rank                                                                                                                                   the revolution in an attempt to sow fear, but it is also
                                                           among mid-ranking nations than the lowest-ranked
due to the inclusion of five new countries which rank                                                                                                                              demonstrative of the ineffectiveness of the army and
                                                           ones. The compilers of the Political Terror Scale            Emboldened by dramatic revolutions in Tunisia and
higher than 140.                                                                                                                                                                   police in restoring order. There has been a resurgence
                                                           suggest that the human-rights environment became             Egypt, a small number of protesters gathered in Syria’s
                                                                                                                                                                                   in sectarian violence, with rising tensions between
                                                           more benign and there was a drop in the homicide             capital, Damascus, in mid-March 2011 to demand
                                                                                                                                                                                   Muslims and the country’s Coptic Christian minority
Bhutan                                                     rate to a still-high level of 18.4 per 100,000.              the release of political prisoners. Around 35 of the
                                                                                                                                                                                   and Egypt’s relations with neighbouring countries
19th                                                       Military expenditure fell to 1.4% of GDP in 2011;
                                                           the country’s very low level of investment in its
                                                                                                                        protestors were arrested, which sparked further pro-
                                                                                                                        democracy protests in Deraa, which later spread to
                                                                                                                                                                                   have worsened (notably with Israel). All of this fed
                                                                                                                                                                                   into a sharp deterioration in Egypt’s overall GPI score
Change in score 2011-12: -0.182                            military sphere has left the armed forces “weak and          other cities. In a brutal crackdown, the Assad regime
                                                                                                                                                                                   for the second year running and the country slid 40
Change in rank 2011-12: 11                                 ill-equipped” according to Jane’s Defence Review,            sent tanks into Deraa, Banias, Jisr al-Shughour,
                                                                                                                                                                                   places to 111th position.
                                                           with just 1,100 active troops. This prompted a               Homs, Hama, Deir-el-Zour and Lattakia. The regime
A substantial improvement in Bhutan’s score saw
                                                           downward revision of the GPI score for military              claims to be targeting “terrorist groups”, but there are
it leap 11 places into the top 20 of the GPI for the
first time. Most of the GPI measures that registered
                                                           capability / sophistication to the lowest possible level.    reports that security forces and the Shabiha militia, a    Tunisia
gains related to an easing of the thorny issue of          Philippines                                                  smuggling group from the Assad family’s Alawi sect,
                                                                                                                        are killing people indiscriminately. This has been
                                                                                                                                                                                   72nd
ethnic-Nepali refugees, more than 100,000 of whom
were forced from their homes in Bhutan to camps
                                                           133rd                                                        exacerbated by other violent groups, with Islamists        Change in score 2011-12: +0.193
in Eastern Nepal amid violent inter-ethnic conflict                                                                     and criminal gangs accused. By March 2012 the UN           Change in rank 2011-12: 29
in the early 1990s. Their eventual resettlement with       Change in score 2011-12: -0.157                              estimated that more than 9,000 Syrians had been
                                                                                                                                                                                   The revolution in Tunisia that sparked the Arab
the assistance of the UNHCR to other countries,            Change in rank 2011-12: 2                                    killed in violence that in places could be described as
                                                                                                                                                                                   Spring in December 2010 and early 2011 not
including the US (the 50,000th refugee originating         The robust rise in the Philippines’ score stems from         a descent into civil war. Not surprisingly, the majority
                                                                                                                                                                                   surprisingly brought with it a period of turbulence
from Bhutan arrived there in August 2011), was             improvements to four indicators: the homicide                of Syria’s measures of ongoing conflict and societal
                                                                                                                                                                                   and uncertainty and there was a decline in the level
reflected in the GPI gauge of refugees and IDPs as a       rate, the number of deaths from internal conflict,           safety and security registered sharp declines in their
                                                                                                                                                                                   of peacefulness. Tunisia’s GPI tally deteriorated by
proportion of overall population, although it remains      the likelihood of violent demonstrations and the             scores and the country plunged 31 places to 147th
                                                                                                                                                                                   the third-largest margin of the 158 countries surveyed
higher than most other countries. Additionally, there      incidence of terrorist acts (although this is not directly   position in the 2012 GPI.
                                                                                                                                                                                   and the country dropped 29 places to a still relatively
were no reports of large-scale violent demonstrations      comparable with last year’s score, owing to a change                                                                    high 72nd position. (Prior to the revolution, Tunisia
in the year to March 2012 and violent attacks by           in the methodology). All were previously at moderate                                                                    was one of the highest-ranked nations in the Middle
ethnic-Nepali refugees, which might have triggered         or high levels to reflect the violent conflict between       Egypt
                                                                                                                                                                                   East and North Africa.) Political instability increased
retaliatory protests, appear to have diminished. The       the government and the Moro Islamic Liberation               111th                                                      considerably, with the first two interim governments
political scene has stabilised and Bhutan continues to     Front (MILF), which engulfed the southern province                                                                      proved unpopular as they comprised many former
consolidate its position as a parliamentary democracy.     of Mindanao in mid-2007. The conflict eased in               Change in score 2011-12: +0.215                            regime members. The third interim government,
The country held its first local-government elections in   December 2009 when peace talks were resumed                  Change in rank 2011-12: 40                                 which was stripped of most of the former regime
June 2011; voter turnout was around 50%. Divisions         just weeks after a massacre of 57 people who were            Egypt has experienced a turbulent year in the wake of      members, was able to prepare for elections in October,
between the two houses of parliament persist, but          travelling to file election-nomination papers in             the revolution that toppled the long-serving president,    but support for the unelected body remained fragile.
recent parliamentary debate has demonstrated that          Mindanao. However, violence rumbled on in Sulu               Hosni Mubarak, on February 11th 2011. There has            The election of the National Constituent Assembly
the two chambers are capable of compromise.                province during 2011, characterised by bombings and          been criticism and sometimes violent protests about        in October 2011 ushered in further instability in
                                                           attacks by the Islamist Abu Sayyaf Group.                    the pace of reform under the interim government,           the form of clashes between radical Islamist groups


30                                                                                                                                                                                                                                      31
Analysis of                                                                                                                                                                     Analysis of
the results                                                                                                                                                                     the results


wanting a system of Sharia law for the constitution and    Malawi                                                     GPI indicators:
between secularists.
   The number of violent demonstrations increased
                                                           60th                                                       annual changes
considerably between mid-March 2011 and the                Change in score 2011-12: +0.146                            Taking the average scores for each of the 23 GPI
October elections. They subsequently subsided, but         Change in rank 2011-12: 19                                 indicators and comparing them with those from the
there were several violent protests in the south and the                                                              153 countries analysed in the 2011 GPI, the Political
                                                           Malawi’s relatively peaceful state (it was ranked
west of the country, triggered by very high levels of                                                                 Terror Scale, which measures levels of political
                                                           39th in the 2011 GPI, the second-highest of the
unemployment and poverty. Violent crime also rose                                                                     violence and terror worldwide in 2010, registered the
                                                           Sub-Saharan nations surveyed) shattered in 2011. At
sharply amid the security vacuum caused when many                                                                     largest annual improvement.
                                                           least 18 people were killed when police cracked down
police officers thought to be corrupt under the regime                                                                    There were also improvements to three indicators
                                                           on protests across urban Malawi on July 20th-21st.
were relieved of their posts. There were numerous                                                                     in the military sphere, including a decline in military
                                                           The protests, organised by Malawi’s influential civil
reports of lootings in offices, cars and properties                                                                   expenditure as a percentage of GDP in 2011, as
                                                           society organisations (CSOs), saw thousands take
associated with the regime, which appeared to have                                                                    many countries hit by economic headwinds moved to
                                                           to the streets to voice their discontent over a host of
abated later in the year.                                                                                             reduce budget deficits. Six of the world’s top military
                                                           issues that have emerged during the second term of the
                                                                                                                      spenders: Brazil, France, Germany, India, the UK and
                                                           president, Bingu wa Mutharika. These include: acute
                                                                                                                      the US, cut their defence budgets in 2011.
Oman                                                       fuel and foreign-exchange shortages since September
                                                                                                                      Level of perceived criminality in society was the
59th                                                       2010; worsening electricity shortages; extravagant
                                                           expenditure by senior government members;
                                                                                                                      indicator exhibiting the greatest deterioration,
                                                                                                                      followed by the gauge of the likelihood of violent
Change in score 2011-12: +0.150                            intolerance of dissent, which has created a culture of
                                                                                                                      demonstrations. The five indictors showing the
Change in rank 2011-12: 20                                 fear; widespread corruption; the enactment of a law
                                                                                                                      largest deteriorations were all measures of safety and
                                                           that bans injunctions against the government and a
Oman’s slide of 20 places to 59th position in the                                                                     security in society and appear to reflect the upheavals
                                                           deterioration in government-donor relations, which
2012 GPI reflects the Arab Spring-inspired protests                                                                   and turbulence that have shaken the Arab world
                                                           has jeopardised aid inflows. Violent clashes occurred
and disturbances that began in February 2011                                                                          since December 2010 and have since rippled out well
                                                           in several cities: the administrative capital, Lilongwe;
and continued for several months. There were                                                                          beyond that region.
                                                           the commercial capital, Blantyre; and the northern
deteriorations in three GPI indicators of societal
                                                           cities of Karonga and Mzuzu—clearly indicating that
safety and security, from low (benign) levels: the                                                                    Top-five improvements                            Change
                                                           this was not an isolated incident of unrest. Although
level of internal conflict, the likelihood of violent
                                                           an uneasy calm returned, the underlying issues remain       Political Terror Scale                          -0.062
demonstrations and perceptions of criminality. The
                                                           unresolved. The unrest is reflected in a deterioration      Terrorist acts                                  -0.049
number of security officers and police per head of
                                                           of four GPi indicators: political instability, the
population also rose, to a “high” level. Protestors                                                                    Military expenditure as a percentage of GDP     -0.045
                                                           likelihood of violent demonstrations, the homicide
demanded political and social reforms, as well as an                                                                   Military capability/sophistication              -0.033
                                                           rate and political terror.
end to corruption and many demonstrations took place                                                                   Aggregate number of heavy weapons per 100,000   -0.026
around the industrial city of Sohar, home to diverse                                                                   people
industries intended to reduce Oman’s dependence on
                                                                                                                      Top-five deteriorations                          Change
oil. The army was also called in to clear demonstrators
from Muscat and Salalah in April and May, but                                                                          Level of perceived criminality in society       +0.067

violence subsided after various economic and political                                                                 Likelihood of violent demonstrations            +0.042
concessions were announced by Sultan Qaboos bin                                                                        Number of homicides per 100,000 people          +0.036
Said al-Said, the most important of which was the                                                                      Level of organised conflict (internal)          +0.033
granting of legislative powers to the Majlis al-Shura                                                                  Level of violent crime                          +0.020
(Consultative Council), which was, until then, an
advisory body.


32                                                                                                                                                                                      33
Methodological
                                                                                                                                                                                                               notes


Methodological
notes

Weighting the index                                                              The overall composite score and index was then           Qualitative scoring:
                                                                             formulated by applying a weight of 60% to the
                                                                                                                                          the Economist Intelligence
When the GPI was launched in 2007 the advisory                               measure of internal peace and 40% for external peace.
panel of independent experts apportioned scores based                                                                                     Unit’s approach
                                                                             The heavier weight applied to internal peace was
on the relative importance of each of the indicators                         agreed by the advisory panel, following robust debate.       The Economist Intelligence Unit employs more
on a 1-5 scale. Two sub-component weighted indices                           The decision was based on the innovative notion that         than 100 full-time country experts and economists,
were then calculated from the GPI group of indicators:                       a greater level of internal peace is likely to lead to, or   supported by 650 in-country contributors. Analysts
                                                                             at least correlate with, lower external conflict. The        generally focus on two or three countries and,
1.	A measure of how at peace internally a country is;                        weights have been reviewed by the advisory panel             in conjunction with local contributors, develop a
2.	A measure of how at peace externally a country is                         prior to the compilation of each edition of the GPI.         deep knowledge of a nation’s political scene, the
   (its state of peace beyond its borders).                                                                                               performance of its economy and the society in general.
                                                                                                                                              Eight of the GPI’s 23 indicators are scored
 Indicator                                                                   Weight (%)                                                   qualitatively by the Economist Intelligence Unit’s
                                                                                                                                          country analysts. Scoring follows a strict process to
 Internal Peace                                                                   60%
                                                                                                                                          ensure reliability, consistency and comparability:
 External Peace                                                                   40%
                                                                                                                                          1.	Individual country analysts score qualitative
 Internal Peace                                                              Weight (1 to 5)
                                                                                                                                             indicators.
 Level of perceived criminality in society                                          3
                                                                                                                                          2.	Country analysts meet with their respective regional
 Number of internal security officers and police per 100,000 people                 3
                                                                                                                                             teams to collectively assess indicators and to ensure
 Number of homicides per 100,000 people                                             4                                                        consistency and comparability within the region.
 Number of jailed population per 100,000 people                                     3
                                                                                                                                          3.	Indicator scores are checked by the Economist
 Ease of access to small weapons and light weapons                                  3                                                        Intelligence Unit’s Custom Research team (which
 Level of organised conflict (internal)                                             5                                                        has responsibility for the GPI) to ensure global
 Likelihood of violent demonstrations                                               3                                                        comparability.
 Level of violent crime                                                             4                                                     4.	If an indicator score is found to be questionable, the
 Political instability                                                              4                                                        Custom Research team, and the appropriate Regional
 Political Terror Scale                                                             4                                                        Director and country analyst discuss and make a
 Volume of transfers of major conventional weapons, as recipient (imports)          2                                                        judgment on the score.
 per 100,000 people
                                                                                                                                          5.	Scores are assessed by the external advisory panel
 Terrorist acts                                                                     2                                                        before finalising the GPI.
 Number of deaths from organised conflict (internal)                                5
                                                                                                                                          6.	If the advisory panel finds an indicator score to be
 External Peace                                                              Weight (1 to 5)                                                 questionable, the Custom Research team, and the
                                                                                                                                             appropriate Regional Director and country analyst
 Military expenditure as a percentage of GDP                                        2
                                                                                                                                             discuss and make a final judgment on the score.
 Number of armed services personnel per 100,000 people                              2
                                                                                                                                          Because of the large scope of the GPI, occasionally data
 Financial contribution to UN peacekeeping missions                                 2
                                                                                                                                          for quantitative indicators do not extend to all nations.
 Aggregate weighted number of heavy weapons per 100,000 people                      3
                                                                                                                                          In this case, country analysts are asked to suggest an
 Volume of transfers of major conventional weapons as supplier (exports)            3
                                                                                                                                          alternative data source or provide an estimate to fill
 per 100,000 people
                                                                                                                                          any gap. This score is checked by the Regional Director
 Military capability / sophistication                                               2
                                                                                                                                          to ensure reliability and consistency within the region,
 Number of displaced people as a percentage of the population                       4
                                                                                                                                          and by the Custom Research team to ensure global
 Relations with neighbouring countries                                              5                                                     comparability. Again, indicators are assessed by the
                                                                                                                                          external advisory panel before finalisation.


34                                                                                                                                                                                                               35
Highlights


                                                                                                First released in 2007, the GPI now contains six years   •	 All five of the biggest risers in peace over the period
                                                                                                of historical data. Some of the data sets contained         2009-2012 were emerging from some kind of
                                                                                                in the Index have been collected over a longer period       conflict.
                                                                                                of time and in our analysis we have been able to         •	 All five of the biggest fallers were Arab Spring
                                                                                                highlight some trends spanning a period up to 20            countries.
                                                                                                years.
                                                                                                                                                         •	 The ‘Political Terror Scale’ and the ‘Level of
                                                                                                    This section of the 2012 Global Peace Index
                                                                                                                                                            internally organised conflict’ indicators most
                                                                                                report highlights some interesting trends in peace. It
                                                                                                                                                            closely correlate with the GPI suggesting that
                                                                                                should be noted however that due to a change in GPI
                                                                                                                                                            government repression is one of the major driving
                                                                       nds
                                                                           )                    methodology in 2009 some of the trends have only
                                                                    usa                                                                                     factors in peace.
                                                            P,   Tho                            been calculated from 2009 onwards. A deeper trend
                                                                           $40
                                                        (PP
                                                   pita                                                                                                  •	 ‘Military expenditure as a percentage of GDP’
                                               r Ca
                                                                  $35


                                        GD
                                          PP
                                            e                                                   analysis will be conducted by IEP in the future to
                                                     $30


                                                                                                                                                            has increased since the turn of the century with

                                                                                 trends
                                                                                                understand the changing texture of peace.
                                          $25


                                                                                                                                                            military expenditure making up 2.51% of total
                                  $20


                                                                                                    The major findings of the analysis are:
                      $15


                                                                                                                                                            global economic activity in 2010. Without the US
                                                                                                •	 The average level of peacefulness in 2012 is
           $10


                                                                                 in
                                                                                                                                                            increases in military expenditure from 2001 to
                                                                                                   approximately the same as it was in 2007.
     $5


                                                                                                                                                            2010, global expenditure would have fallen.
                                                                                                   However there were changing levels year to year
                                                                                                                                                         •	 More nations have decreased their military

                                                                                 peacefulness
                                                                                                   during this period, with peacefulness improving
                                                                                                   from 2007 to 2009, then declining from 2009 to           expenditure as a percentage of GDP (98 in total)
                                                                                                   2011 and improving again from 2011 to 2012.              than increased it (22 countries) since 2007.

                                                                                                •	 Over the past six years, external peace has           •	 Terrorism has emerged as a significant source of
                                                                                                                                                            conflict since 2001. There were 2,000 deaths in
     1.5


                                                                                                   improved whilst internal peace has worsened.
                                                                                                                                                            2003, climbing to 10,000 in 2007 at the height of
                                                                                                •	 Sub-Saharan Africa is no longer the least peaceful
                                                                                                                                                            the Iraq war and reducing to 7,000 in 2010.
                                                                                                   region in the world.
                                                                                                                                                         •	 Countries in the most peaceful quintile rarely move
                                                                                                   »»It has experienced the largest regional
                                                                                                                                                            out. Similarly, no country that started in the least
                                                                                                     improvement in the world in ‘Relations with
             201
             2 0 Glo


                                                                                                                                                            peaceful quintile in 2009 was able to move out.
                                                                                                     neighbouring states’ from 2009 to 2012.
                                                                                                                                                            This suggests that peace is ‘sticky’ at both ends.
                                                                                                   »»It performs better than Latin America on
                    bal
                        Pea


                                                                                                     ‘Perceptions of criminality’.
                           ce I
                          nde


                                                                                                   »»It records a smaller number of deaths from
                             xS
                               2.5


                                                                                                     internal conflict than both Asia Pacific and the
                               co


                                                                                                     Middle East and North Africa regions.
                                                                                                •	 The Middle East and North Africa region is now
                                                                                                   less peaceful, owing to the events of the Arab
                                                                                                   Spring over the past year and a half.
                                                                                                •	 There is a notable ‘tipping point’ after which
                                                                                                   relatively small gains in peacefulness seem to be
                                                                                                   associated with large falls in corruption and large
                                                                                                   increases in GDP per capita.
                                                                                                •	 There is a substantial gap in peacefulness between
                                                                                                   democracies and other government types. Flawed
                                                                                                   democracies perform substantially better than
                                                                                                   hybrid and authoritarian regimes.


36                                                                                                                                                                                                             37
Trends in peacefulness
                                                                                                                                                                                      from 2009-2012


Trends in peacefulness
from 2009-2012


 Country                 Score Change   % Change   Country            Score Change   % Change   Country                    Score Change   % Change   Country                  Score Change   % Change

 Sri Lanka               -0.34          -13.66%    Vietnam            -0.02          -1.38%     Mali                       0.05           2.21%      Sweden                   0.15           11.84%
 Lebanon                 -0.26          -9.52%     Botswana           -0.02          -1.36%     Ghana                      0.05           2.65%      El Salvador              0.15           7.32%
 Chad                    -0.21          -7.26%     Colombia           -0.02          -0.78%     Trinidad and Tobago        0.05           2.32%      Bosnia and Herzegovina   0.17           9.56%
 Zimbabwe                -0.20          -7.26%     Uganda             -0.02          -0.88%     Zambia                     0.05           2.83%      Dominican Republic       0.18           9.43%
 Georgia                 -0.19          -7.11%     Kenya              -0.01          -0.64%     Slovakia                   0.05           3.35%      Malawi                   0.18           10.70%
 Israel                  -0.19          -6.37%     Singapore          -0.01          -0.79%     Lithuania                  0.05           3.20%      Democratic Republic
                                                                                                                                                     of the Congo             0.18           6.38%
 Bhutan                  -0.19          -11.16%    Brazil             0.00           -0.25%     Estonia                    0.05           3.28%
                                                                                                                                                     Russia                   0.19           6.83%
 Ecuador                 -0.18          -8.25%     Ireland            0.00           -0.36%     Japan                      0.05           4.29%
                                                                                                                                                     Greece                   0.20           11.11%
 Mauritania              -0.18          -7.14%     Burundi            0.00           -0.19%     Morocco                    0.06           3.08%
                                                                                                                                                     Nigeria                  0.20           7.64%
 Guyana                  -0.16          -7.68%     Angola             0.00           0.00%      Paraguay                   0.06           2.97%
                                                                                                                                                     Nicaragua                0.20           11.37%
 Mongolia                -0.16          -7.66%     Latvia             0.00           0.03%      Indonesia                  0.06           3.27%
                                                                                                                                                     Madagascar               0.21           11.10%
 Haiti                   -0.15          -6.48%     Albania            0.00           0.09%      Nepal                      0.06           3.19%
                                                                                                                                                     Gabon                    0.21           12.13%
 Iraq                    -0.15          -4.46%     Qatar              0.00           0.17%      Czech Republic             0.07           5.16%
                                                                                                                                                     North Korea              0.21           7.90%
 South Africa            -0.12          -4.77%     Moldova            0.00           0.13%      Guatemala                  0.07           3.11%
                                                                                                                                                     Iran                     0.22           10.46%
 Iceland                 -0.11          -9.20%     Canada             0.01           0.46%      Uruguay                    0.07           4.59%
                                                                                                                                                     Cyprus                   0.22           12.67%
 Macedonia (FYR)         -0.10          -5.11%     Slovenia           0.01           0.55%      Jordan                     0.07           4.04%
                                                                                                                                                     Rwanda                   0.22           11.00%
 Venezuela               -0.10          -4.33%     Senegal            0.01           0.49%      Honduras                   0.07           3.26%
                                                                                                                                                     Mexico                   0.24           10.67%
 Hungary                 -0.10          -6.31%     Saudi Arabia       0.01           0.50%      Tanzania                   0.07           4.15%
                                                                                                                                                     Yemen                    0.24           10.08%
 Croatia                 -0.09          -5.33%     Papua New Guinea   0.02           0.82%      Netherlands                0.08           4.91%
                                                                                                                                                     Equatorial Guinea        0.24           13.22%
 Argentina               -0.09          -4.75%     Uzbekistan         0.02           0.77%      Austria                    0.08           6.10%
                                                                                                                                                     Tunisia                  0.26           15.10%
 Malaysia                -0.08          -4.89%     Belgium            0.02           1.25%      Cote d’Ivoire              0.08           3.29%
                                                                                                                                                     Norway                   0.26           21.61%
 Bulgaria                -0.08          -4.23%     Australia          0.02           1.23%      Costa Rica                 0.08           5.19%
                                                                                                                                                     Sudan                    0.27           9.27%
 Poland                  -0.08          -4.70%     Denmark            0.02           1.79%      Philippines                0.09           3.78%
                                                                                                                                                     Bahrain                  0.37           19.50%
 Ukraine                 -0.06          -2.86%     Peru               0.02           1.20%      Cuba                       0.09           5.09%
                                                                                                                                                     Oman                     0.37           24.16%
 Republic of the Congo   -0.05          -2.45%     Myanmar            0.02           0.97%      Panama                     0.10           5.59%
                                                                                                                                                     Egypt                    0.45           25.19%
 Thailand                -0.05          -2.14%     Bangladesh         0.03           1.27%      Belarus                    0.11           5.01%
                                                                                                                                                     Syria                    0.78           38.10%
 Taiwan                  -0.05          -3.01%     Finland            0.03           1.97%      South Korea                0.11           6.55%
                                                                                                                                                     Libya                    1.12           65.54%
 Ethiopia                -0.05          -1.83%     Cambodia           0.03           1.31%      Jamaica                    0.11           5.28%
 Turkey                  -0.05          -1.90%     Bolivia            0.03           1.55%      Kuwait                     0.11           6.67%
 Switzerland             -0.04          -3.13%     Mozambique         0.03           1.75%      United Arab Emirates       0.12           7.05%
 Montenegro              -0.04          -1.95%     Germany            0.03           2.35%      Portugal                   0.12           9.04%
 Laos                    -0.04          -2.28%     Azerbaijan         0.03           1.43%      India                      0.13           5.26%
 United Kingdom          -0.04          -2.28%     Romania            0.04           2.29%      France                     0.13           8.25%
 Namibia                 -0.04          -1.98%     New Zealand        0.04           3.13%      Turkmenistan               0.13           6.23%
 Afghanistan             -0.03          -1.00%     Cameroon           0.04           1.96%      Kazakhstan                 0.13           6.58%
 Serbia                  -0.03          -1.58%     Italy              0.04           2.54%      Somalia                    0.13           4.13%
 Spain                   -0.03          -1.84%     United States                                Chile                      0.14           9.17%
                                                   of America         0.04           2.14%
 Pakistan                -0.03          -0.93%                                                  Central African Republic   0.14           5.08%
                                                   Algeria            0.04           1.95%
 Burkina Faso            -0.02          -1.27%                                                  China                      0.14           7.32%


38                                                                                                                                                                                                    39
twenty
                                                                                                                                                                                                                                         year trends


Methodology of                                               twenty-year
Trends Analysis                                              trends

The majority of indicators in the Global Peace Index         Since the end of the Cold War there has been a              Chart 2.1: Military Expenditure as % of GDP by region,
                                                                                                                         1991-2010 SOURCE: WORLD BANK, WORLD DEVELOPMENT INDICATORS
have remained the same since its inception in 2007.          marked decline in global armed conflict, although this
                                                                                                                         Aside from North America, military expenditure as a percentage
However, some indicators have changed during this            trend has somewhat reversed during the last six years       of GDP has declined in every region since 1991.
time, and the data collection and aggregation methods        with the advent of the Iraq and Afghanistan wars.
have been adjusted where possible for the changes in         However, the long term trend is evident with other                                                  5                                           20

these indicators.                                            broader measures of militarisation used in the GPI
    In 2009 the two indicators related to troops and         improving during this period. When viewed over 20                                                                                               15

peacekeeping deployments were changed into a single          years both interstate and intrastate warfare has fallen
                                                                                                                                                                                                             10
indicator measuring financial contributions to UN            substantially. However, while this trend has continued
                                                                                                                                                                                                                                      Middle East
peacekeeping missions. The Refugee indicator was             with interstate warfare the last six years have seen                                                                                                                 and North Africa
                                                                                                                                                                                                              5
also changed to include internally displaced persons as      violence within states increase.                                                                    4


                                                                                                                            Military Expenditure as a % of GDP
well as refugees.                                                 In order to fully understand trends in peacefulness,                                                                                        0
                                                                                                                                                                                                               1991                           2010
    In 2010 the heavy weapons indicator was adjusted         it is necessary to study much more than just organised
to better account for the uneven impact of different         conflict. Whilst armed conflict has declined,
types of heavy weapons.                                      many other measures of peacefulness have varied
    In 2012, ‘Potential for terrorist acts’ was changed      considerably in the post-cold war period. Terrorism
                                                                                                                                                                                                                                       North America
from a qualitative assessment of the potential of            has emerged as a serious threat in the early 21st
                                                                                                                                                                 3
future terrorist incidents to a quantitative indicator       century, with deaths from terrorism increasing
based on the prior impact of terrorism.                      five fold from 2003 to 2007. Political terror also
    Where possible these indicators have been taken          intensified in some regions whilst receding in others                                                                                                                       World
back and used to calculate new GPI scores for                and perceptions of criminality increased, even as
previous years, however, this was not possible in all        violent crime decreased.
occasions. Given that the changed indicators comprise             There were also notable movements in some of
                                                                                                                                                                 2                                                                    Central and Eastern Europe
a relatively small percentage of the total GPI score, it     the factors which are associated with maintaining
is still possible to calculate an overall trend score with   peaceful societies. The emergence of new democracies                                                                                                                      Sub-Saharan Africa
                                                                                                                                                                                                                                       Asia-Pacific
a high degree of accuracy.                                   after the fall of the cold war has slowed to a trickle,                                                                                                                   Western Europe
                                                             and has even reversed course in some areas. Nascent
                                                                                                                                                                                                                                       Latin America
                                                             democratic movements in the middle east hang in the
                                                             balance.
                                                                  Studying the movements in the GPI allows for a                                                 1
                                                                                                                                                                     1991                 2001                                    2010
                                                             much more thorough and nuanced understanding of
                                                             trends in peacefulness. Whilst data for the GPI as a
                                                             whole is only available back until 2007, data for some
                                                             of the indicators is available back to the immediate        Chart 2.1 shows military expenditure as a % of GDP                      years, and has now returned to cold war levels. The
                                                             aftermath of the end of the cold war.                       by region from 1991 to 2010. Military expenditure                       biggest decrease in military expenditure occured in
                                                                  Examining these twenty year trends for some key        as a percentage of Gross World Product (GWP) has                        the Middle East and North Africa, where it dropped
                                                             datasets helps to define movements which are greater        fallen from approximately 3% in 1991 to around                          from around 15% of GDP in 1991 to less than 5% of
                                                             than the six years of GPI data.                             2.51% in 2010. It was under 2.5% between 1995 and                       GDP in 2010.
                                                                  As background for the six year GPI tend analysis,      2001, but began to rise again as a result of conflict
                                                             four long terms trends have been examined below:            in Afghanistan and Iraq. Every region in the world
                                                             military expenditure as a percentage of GDP, battle-        bar North America experienced a downward trend in
                                                             related deaths, fatalities from terrorism, and the          military expenditure as a % of GDP over the entire
                                                             percentage of ‘free’ countries in the world.                period. Military expenditure in the US declined
                                                                                                                         sharply between 1991 and 2000, falling from 4.5% to
                                                                                                                         3%. However, it has dramatically increased in recent


40                                                                                                                                                                                                                                                      41
twenty                                                                                                                                                                                                                                                     twenty
  year trends                                                                                                                                                                                                                                            year trends


  Chart 2.2: Battle-related deaths (by area where the                                                                                   Chart 2.3: Terrorism Fatalities, 1991-2010
  death occurred), 1991-2010                                                                                                            SOURCE: NATIONAL CONSORTIUM FOR THE STUDY OF TERRORISM AND
  SOURCE: WORLD BANK, WORLD DEVELOPMENT INDICATORS                                                                                      RESPONSES TO TERRORISM, GLOBAL TERRORISM DATABASE
  There have been three major spikes in battle related deaths                                                                           The number of terrorism related deaths has been increasing since
  since 2010.                                                                                                                           the turn of the century.
                                     80000                                                                                                    12000


                                     70000
                                                                                                                                                                               10000


                                                                                                                                          Total Annual Deaths from Terrorism
                                     60000
Total Annual Battle-Related Deaths


                                                                                                                                                                                8000
                                     50000


                                     40000                                                                                                                                      6000


                                     30000
                                                                                                                                                                                4000


                                     20000                                                               World


                                                                                                         Asia Pacific                                                           2000

                                     10000


                                                                                                         Sub-Saharan Africa
                                                                                                         Middle East and North Africa
                                                                                                         Central and Eastern Europe                                                0
                                         0                                                               North America Latin America
                                                                                                               Western Europe                                                          1991   1995         2000                  2005                     2010
                                             1991   1995        2000          2005                    2010


                                                                                                                                        Chart 2.3 shows the number of fatalities from                             been consistently downward since 2001.
      Chart 2.2 highlights that battle related deaths have             less than 10,000. Whilst there are still some high               terrorism from 1991 to 2010. Although terrorism                               If the world has become more peaceful during the
  continued to fall, from well over 100,000 in 1991                    intensity conflicts, they are situated in certain regional       leapt to the world’s attention after the terrorist attacks                last twenty years, then the multidimensional factors of
  to approximately 50,000 in 2010. This downward                       hotspots. The majority of the world’s population have            of September 11th, 2001, there were actually 10 years                     peace also should have improved during this period.
  trend was interrupted by three notable upward spikes.                not experienced high intensity conflict in the last              during this time period which had a higher number of
  The first spike was the result of the conflict in the                twenty years.                                                    fatalities than 2001.
  Balkans in the mid-90s, the second was caused by                                                                                          Terrorism deaths peaked in 1997 as a result of
  the Rwandan genocide and associated conflict in                                                                                       conflict related terrorism in numerous countries
  Africa, and the third is a product of the wars in Iraq                                                                                around the world. There have also been a high
  and Afghanistan. Perhaps the most notable trend in                                                                                    number of fatalities in the last five years, the vast
  conflict related deaths over this period is that the                                                                                  majority of which occurred in Afghanistan, Iraq,
  combined number of deaths in North America, South                                                                                     Pakistan and India. If terrorist deaths in active and
  America, Europe, and Sub-Saharan Africa is now                                                                                        post-conflict areas are removed, then the trend has


42                                                                                                                                                                                                                                                                   43
twenty
year trends


                                                                                                                                                        Overall
                                                                                                                                                        Trend 2007-2012

Chart 2.4: Percentage of countries rated as free,                                                                                                       Chart 2.5: GPI AVERAGE SCORE, 2007-2012, UNWEIGHTED AND               As seen in chart 2.5, the average country level
partially free, and not free in the Freedom House                                                                                                       POPULATION WEIGHTED
                                                                                                                                                                                                                              peacefulness in the world has barely changed in the
Freedom in the World survey, 1991-2010                                                                                                                  If a population weighted system is used, the world has become
SOURCE: FREEDOM HOUSE, FREEDOM IN THE WORLD SURVEY                                                                                                      less peaceful over the last six years.                                last six years. However, if a population weighting
The percentage of free countries has increased by about 5                                                                                                                                                                     method is used then peace has decreased over the last
percentage points since 1991.                                                                                                                                                                                                 six years. The greater part of this trend is driven by
                                                                                                                                                                                    2.5                                       changes in India and China, which together account
                                                                   0.5                                                                                                              2.4
                                                                                                                                                                                                                              for around 37% of the total global population. Both
                                                                                                                                                                                                                              China and India have become less peaceful over the
                                                                                                                                                                                    2.3
                                                                                                                                                                                                        Population Weighted   last six years.
                                                                                                                                                                                    2.2


                                                                                                                                                 Average GPI Score
                                                                                                                                        Free                                                                                  By Region
                                                                                                                                                                                    2.1

                                                                                                                                                                                    2.0                       Unweighted
                                                                                                                                                                                                                              As noted in the methodology, results, and findings
                                                                   0.4
         % of Countries that are Free, Partly Free, and Not Free


                                                                                                                                                                                                                              section, 2012 marks the first occasion in the GPI’s
% of Coutnries Rated as Free, Partly Free, or Not Free


                                                                                                                                                                                    1.9
                                                                                                                                                                                                                              history that Sub-Saharan Africa is not the least
                                                                                                                                                                                    1.8
                                                                                                                                                                                                                              peaceful region in the world, a distinction which
                                                                                                                                                                                    1.7                                       is now held by the Middle East and North Africa
                                                                                                                                                                                    1.6                                       region. Although the Middle East region has been
                                                                   0.3                                                                                                                                                        becoming less peaceful since 2009, the trend became
                                                                                                                                  Partly Free                                       1.5
                                                                                                                                                                                                 2007                 2012
                                                                                                                                                                                                                              most noticeable after 2010, owing chiefly to the Arab
                                                                                                                                                                                                                              Spring.
                                                                                                                                                                                                                                  At the other end of the spectrum, Western Europe
                                                                                                                                    Not Free
                                                                                                                                                                                                                              remains the most peaceful region in the world by
                                                                   0.2                                                                                  Chart 2.6: Regional Change in GPI score, 2007-2012                    a large margin. Central and Eastern Europe, Latin
                                                                                                                                                        Sub-Saharan Africa is no longer the world’s least peaceful region.    America, and Asia Pacific all have average scores
                                                                                                                                                                                                                              which have remained clustered around 2.


                                                                                                                                                                                           2.4

                                                                   0.1
                                                                                                                                                                                                                                     Middle East and North Africa
                                                                                                                                                                                           2.2                                       Sub-Saharan Africa


                                                                                                                                                        Average Global Peace Index Score
                                                                                                                                                                                                                                     Latin America
                                                                                                                                                                                           2.0                                       Asia-Pacific
                                                                                                                                                                                                                                     Central and Eastern Europe

                                                                   0.0                                                                                                                     1.8
                                                                         1991   2001                                                  2011                                                                                           North America
                                                                                                                                                                                           1.6
Although data is not available back to 1991 for all                                    percentage of countries rated as ‘free’ has increased                                                                                         Western Europe
the drivers, it is available for some socio-economic                                   from under 40% to just over 45% in 2010. The
                                                                                                                                                                                           1.4
factors. Chart 2.4 above shows Freedom House’s                                         percentage of ‘partly free’ and ‘not free’ has declined
Freedom Index, which is another measure of human                                       slightly over this period, although the last five years
                                                                                                                                                                                           1.2
progress and development that has over 20 years of                                     have seen a number of countries classified as ‘partly
data. The Freedom Index divides the countries of the                                   free’ fall to ‘not free’ status.
world into three categories: Free, Partly-Free, and Not                                                                                                                                    1.0
Free. Since the end of the Cold War and the spread                                                                                                                                               2007                         2012
of democracy in the formerly communist states, the


44                                                                                                                                                                                                                                                                               45
Overall                                                                                                                                                                                                                                          Overall
Trend 2007-2012                                                                                                                                                                                                                           Trend 2007-2012


SUB-SAHARAN AFRICA                                             Malawi                   1.71        1.89            0.18
                                                                                                                              Table 2.3: Comparison of Sub-Saharan Africa to other
                                                                                                                              Regions on Selected Indicators, 2012
                                                               Democratic Republic                                            Sub-Saharan Africa now has the 4th best ‘Relations with
Perhaps the most notable regional development is
                                                               of the Congo             2.89        3.07            0.18      neighbouring states’ of any region.
that Sub-Saharan Africa is no longer the world’s least
                                                               Nigeria                  2.60        2.80            0.20
peaceful region as of 2012. Although this is primarily                                                                                                                                                            Relations         Access to
                                                               Madagascar               1.91        2.12            0.21
due to the deterioration of peacefulness in the Middle                                                                                                                                  Deaths from   Political   with              Small Arms
                                                               Gabon                    1.76        1.97            0.21                                            Perception of       Internal      Terror      Neighbouring      and Light
East and North Africa, there are a number of areas
                                                                                                                               REGION                               Criminality         Conflict      Scale       States            Weapons
where Sub-Saharan Africa is becoming more peaceful.            Rwanda                   2.03        2.25            0.22

    Table 2.1 below shows the change in score of               Equatorial Guinea        1.80        2.04            0.24       Sub-Saharan Africa                          3.53             1.39         3.09           2.45             3.71
all the Sub-Saharan countries from 2009 to 2012.               Sudan                    2.92        3.19            0.27       Asia Pacific                                2.92             1.60         3.00           2.46             2.72
Thirteen countries in Sub-Saharan Africa have                                                                                  Central and Eastern Europe                  2.86             1.07         2.19           2.55             3.07
become more peaceful since 2009. Of these, Chad’s             Changes in Peacefulness in                                       Latin America                               3.67             1.30         2.63           1.85             3.49
peacefulness increased the most, followed by                  Sub-Saharan Africa, 2009-2012                                    Middle East and North Africa                3.31             1.72         3.03           3.00             3.06
Zimbabwe, Mauritania, and South Africa.                       Table 2.2 shows the change in indicator scores                   North America                               2.00             1.00         2.00           1.75             2.50
Table 2.1: Changes in Peacefulness in Sub-Saharan Africa,     (five risers, five fallers) in Sub-Saharan Africa from
                                                                                                                               Western Europe                              2.33             1.00         1.28           1.17             1.94
2009-2012                                                     2009 to 2012. It should be noted that the ‘Number
13 countries have become more peaceful since 2009.                                                                             Global Average                              3.14             1.33         2.59           2.28             3.11
                                                              of homicides’ indicator technically increased the
                                                              most over the period, changing by 0.903 however
 Country                2009         2012        Change
                                                              it has been excluded from table 2.2 as improved                     Table 2.3 shows the 2012 GPI scores for each                         state repression will have spill-over effects which
 Chad                    2.88        2.67            -0.21    data collection has resulted in a rapid increase in             region on the five indicators where Sub-Saharan                          positively influence other internal peace indicators. If
 Zimbabwe                2.74        2.54            -0.20    the numbers. Although this makes comparisons for                Africa improved the most from 2009. Regions                              this is the case, we should expect to see peacefulness
 Mauritania              2.48        2.30            -0.18    homicides in Sub-Saharan Africa difficult it will               with poorer scores than Sub-Saharan Africa are                           continue to increase in Sub-Saharan Africa in the
 South Africa            2.44        2.32            -0.12    improve the accuracy of this indicator in the future.           highlighted in red.                                                      next few years. The improvement on relations with
 Republic of                                                                                                                      Although Sub-Saharan Africa still performs below                     neighbouring states is also significant, as it shows
 the Congo               2.20        2.15            -0.05    Table 2.2: Top 5 Risers and Fallers by Indicator, 2009-2012     the global average on all five of these indicators, there                that gains to peacefulness are occurring across both
                                                              Access to small arms and light weapons improved the most over   are a number of surprising results. ‘Perceptions of                      internal and external indicators. Improving relations
 Ethiopia                2.55        2.50            -0.05
                                                              this period.
 Namibia                 1.84        1.80            -0.04                                                                    criminality’ are now higher in Latin America than                        with neighbouring states lessens the likelihood of
                                                                                                                              in Sub-Saharan Africa. The ‘Number of deaths from                        conflict in the Sub-Saharan region. This should in
 Burkina Faso            1.91        1.88            -0.02     Indicator                                   Score Change
                                                                                                                              internal conflict’ is worse in both Asia Pacific and the                 turn positively influence a number of other external
 Botswana                1.64        1.62            -0.02     Access to Small arms and light weapons      -0.225
                                                                                                                              Middle East and North Africa, than in Sub-Saharan                        peace indicators. Whilst the external relations score in
 Uganda                  2.14        2.12            -0.02     Relations with neighbouring states          -0.214
                                                                                                                              Africa. ‘Relations with neighbouring states’ are now                     Sub-Saharan Africa is still above the global average, it
 Kenya                   2.27        2.25            -0.01     Political Terror Scale                      -0.198
                                                                                                                              better than in Central and Eastern Europe.                               is higher than three other regions.
 Burundi                 2.53        2.52            -0.005    Deaths from internal conflict               -0.121                 Chart 2.7 shows the change in ‘Relations with                            Sub-Saharan Africa has also been improving on a
 Angola                  2.10        2.10            0.000     Perception of criminality                   -0.087             neighbouring states’ by region from 2009 to 2012.                        number of the factors associated with peace. The most
 Senegal                 1.98        1.99            0.01                                                                         The biggest increase in peacefulness in Sub-                         notable trend is highlighted in chart 2.8. Both gender
 Mozambique              1.77        1.80            0.03                                                                     Saharan Africa was in relation to ‘Access to small                       and income inequality has been decreasing since 2009.
 Cameroon                2.07        2.11            0.04                                                                     arms and light weapons’, although Sub-Saharan                            The axis for gender inequality has been inverted to
                                                               Number of internally displaced people                          Africa’s score is still well above any region other than                 make the trend more easily understandable.
 Mali                    2.09        2.13            0.05                                                  0.269
                                                                                                                              Latin America.
 Ghana                   1.76        1.81            0.05      UN peacekeeping funding                     0.198
                                                                                                                                  There is an improvement in peacefulness
 Zambia                  1.78        1.83            0.05      Violent crime                               0.138
                                                                                                                              pertaining to a decrease in the average Political Terror
 Tanzania                1.80        1.87            0.07      Likelihood of violent demonstrations        0.125
                                                                                                                              Scale score. This is perhaps the most interesting result,
 Cote d’Ivoire           2.34        2.42            0.08      Political instability                       0.088
                                                                                                                              as the Political Terror Scale is the GPI indicator that
 Somalia                 3.26        3.39            0.13                                                                     correlates most closely with the GPI itself over the
 Central African                                                                                                              period 2007-2012. It is likely that this decrease in
 Republic                2.73        2.87            0.14


46                                                                                                                                                                                                                                                         47
Overall                                                                                                                                                                                                                                                                                            Overall
Trend 2007-2012                                                                                                                                                                                                                                                                             Trend 2007-2012


Chart 2.7; Change in Relations with Neighbouring states                                                                                                                             Chart 2.9: Sub-Saharan Africa’s Performance on the
by region, 2009-2012                                                                                                                                                                Democracy Index, 2011
Relations between neighbouring states improved the most in                                                                                                                          Political Culture in Sub-Saharan Africa is almost equal to the
Sub-Saharan Africa.                                                                                                                                                                 global average


                                      Sub-Saharan Africa

                                              Asia-Pacific                                                                                                                            Political Democracy Index

 Central and Eastern Europe

                                            Latin America                                                                                                                                          Civil Liberties
Middle East and North Africa

                                            North America
                                                                                                                                                                                                Electoral Process
                                        Western Europe                              0
                                                            -0.3      -0.2   -0.1   0.0      0.1         0.2              0.3      0.4                                        0.5
                                                             MORE PEACEFUL                                                          LESS PEACEFUL                                   Functioning of Government


Chart 2.8; Change in INCOME AND GENDER INEQUALITY,                                                                                                                                               Political Culture
SUB-SAHARAN AFRICA, 2009-2012 states by region, 2009-2012
Both income and gender inequality have decreased in
Sub-Saharan Africa in the last four years.
                                                                                                                                                                                           Political Participation

                                     0.60                                                                                          0.50
                                                                                                                                                                                                                     0     1        2        3       4   5   6        7        8   9   10

                                     0.61                                                                                          0.49
                                                                                                                                                                                                                               Sub-Saharan Africa                GPI Average
                                     0.62                                                                                          0.48


                                                                                                                                          Household Income Gini Coefficient
                                     0.63                                                                                          0.47
     Gender Inequality Index Score


                                                Gender Inequality                                                                                                                   Chart 2.9 shows the performance of Sub-Saharan
                                                (Left Hand Side)
                                     0.64                                                                                 Gini     0.46                                             Africa on the EIU’s Democracy Index and its sub-
                                                                                                               (Right Hand Side)
                                                                                                                                                                                    indices. All of these sub-indices have correlated
                                     0.65                                                                                          0.45
                                                                                                                                                                                    strongly with the GPI for every year that the
                                     0.66                                                                                          0.44                                             Democracy Index has been released (2006, 2008,
                                                                                                                                                                                    2010, and 2011).
                                     0.67                                                                                          0.43                                                 Although Sub-Saharan Africa still performs
                                                                                                                                                                                    worse than the Global Average on every indicator
                                     0.68                                                                                          0.42
                                                                                                                                                                                    in the Democracy Index, the gap is closing. The
                                     0.69                                                                                          0.41                                             greatest differential is related to the electoral process
                                                                                                                                                                                    and the functioning of government, whilst political
                                     0.70                                                                                          0.40
                                                                                                                                                                                    participation and political culture are closest to the
                                                  2007                                                                    2012
                                                                                                                                                                                    global average. Political Culture is a reflection of
                                                                                                                                                                                    the popularity and acceptance of democracy as an
The Gini coefficient measures the distribution of                                         of all the GPI countries (.41).
                                                                                                                                                                                    ideology. It looks at the proportion of the population
income throughout a society. A Gini score of one                                             The Gender Gap Index is the proxy used for gender
                                                                                                                                                                                    that feels as if democracy is both viable and desirable.
would represent perfect inequality, where one person                                      inequality. It measures female participation across
controlled all the income of a nation, whilst a score                                     four domains: economics, education, health, and
of zero would represent perfect equality. Whilst it                                       political participation. The average gender inequality
has been decreasing over the past six years, the Sub-                                     score in Sub-Saharan Africa is now approaching the
Saharan Africa average Gini is still above the average                                    global average (.67).


48                                                                                                                                                                                                                                                                                                      49
Overall
Trend 2007-2012


                                                                                        Internal
                                                                                        Peacefulness

By GOVERNMENT TYPE                                                                      Given that all but one of the changes to the
                                                                                        methodology of the GPI occurred in external
Chart 2.10: Change in GPI score by Government Type, 2007-                               indicators, it would be possibly misleading to
2012                                                                                    isolate changes in external peacefulness. However,
Full democracies are considerably more peaceful than any other                          as the indicators comprising internal peace have
government type.
                                                                                        remained essentially unchanged during this period, a
                                                                                        comparison of changes in internal peace by region is
                                        2.4                                             possible.

                                                                 Authoritarian regime
                                                                                        Chart 2.11: Change in Internal Peacefulness by Region
                                                                                        North America and Western Europe recorded the biggest positive
                                        2.2
                                                                                        changes in internal peacefulness.
                                                                       Hybrid regime


                                        2.0
     Average Global Peace Index Score


                                                                    Flawed democracy                          Asia-Pacific


                                        1.8                                               Central and Eastern Europe


                                                                                                          Latin America
                                        1.6
                                                                                         Middle East and North Africa

                                                                      Full democracy
                                        1.4                                                               North America


                                                                                                    Sub-Saharan Africa
                                        1.2

                                                                                                       Western Europe


                                        1.0                                                                               -0.10       -0.05        0.00   0.05         0.10       0.15       0.20
                                              2007                             2012                                       MORE PEACEFUL                                            LESS PEACEFUL


The large gap between full democracies and other                                        Chart 2.11 above highlights that Western Europe and                      2007, 16 saw their internal peacefulness decreased.
governance systems has remained constant throughout                                     North America increased their internal peacefulness                      The most prominent movement was in Mexico as
the history of the GPI. There has, however, been                                        over the period 2007-2012, a somewhat surprising                         a result of violence associated with the drug war,
a slight average increase in peace in the flawed                                        result as they were already starting from relative high                  but there were also large movements in Panama,
democracies in the past three years. It is too early to                                 levels of internal peacefulness. The fall in internal                    Paraguay, and Chile.
suggest that this trend will continue into the future.                                  peacefulness in the Middle East and North Africa
    During the first year of the GPI, the average score                                 is not particularly surprising, given the turmoil
for authoritarian regimes was slightly lower than that                                  associated with the Arab Spring. However, the
of hybrid regimes. However, the gap has now reversed                                    movement in Latin America was not prefaced by an
with hybrid regimes now being slightly more peaceful                                    obvious continent wide political discontent. Of the 21
on average than authoritarian regimes.                                                  Latin American countries included in the GPI since


50                                                                                                                                                                                                                     51
Indicator
                                                                                                                                                                                                                                                        trends


Risers                                                            Indicator
and Fallers                                                       trends

Table 2.4 below shows the five biggest risers and                 Table 2.5 shows the movement on GPI indicators              Table 2.5: GPI INDICATORS MOVEMENTS, 2009-2012
                                                                                                                              The scores on the majority of indicators have worsened in the
fallers in the GPI since 2009. This trend has not been            from 2009 to 2012. The numbers for the quantitative
                                                                                                                              last four years.
taken back to 2007 as variations in the methodology               indicators are based on the raw data rather than the
and number of indicators distorted the scores for                 banded GPI scores. Indicators whose methodology
individual countries.                                             changed during this period were excluded from                Qualitative Indicators                                                                       2009     2012     Change

                                                                  consideration.                                               Political Terror Scale                                                                       2.69     2.60     -0.08
Table 2.4: TOP FIVE RISERS AND FALLERs, 2009-2012                     Of the qualitative indicators, ‘Military capability’
                                                                                                                               Military capability/sophistication                                                           2.58     2.57     -0.02
All five of the biggest fallers in peacefulness are Arab Spring   saw the greatest average improvement in peacefulness,
countries.                                                                                                                     Ease of access to small arms and light weapons                                               3.08     3.09     0.01
                                                                  whilst ‘Likelihood of violent demonstrations’ saw the
                                                                                                                               Relations with neighbouring countries                                                        2.27     2.28     0.02
                                                                  greatest fall in peacefulness. This was in large part
                                                                  due to the events of the Arab Spring.                        Political instability                                                                        2.45     2.50     0.05
 Country                      Change                                  It is not possible to directly compare changes in the    Level of organised conflict (internal)                                                       2.32     2.42     0.10

                               -0.34                              raw scores of quantitative indicators. However, there        Level of violent crime                                                                       2.63     2.76     0.13
     Sri Lanka
                                                                  are a number of notable changes. The average number          Perceptions of criminality in society                                                        3.00     3.14     0.14
     Lebanon                   -0.26
                                                                  of homicides per 100,000 has almost doubled,                 Likelihood of violent demonstrations                                                         2.72     2.94     0.22
     Chad                      -0.21
                                                                  although it is more than likely that most of this effect
                                                                                                                               Quantitative Indicators
     Zimbabwe                  -0.20                              is attributable to better and more comprehensive
                                                                  data collection. Whilst the number of armed service          Estimated number of deaths from organised conflict (external)                                43.23    13.08    -30.15
     Georgia                   -0.19
                                                                  personnel per 100,000 has decreased, the number              Number of armed services personnel per 100,000 people                                        479.42   463.23   -16.18
     Bahrain                   0.37
                                                                  of police officers has risen. Somewhat similarly,            Military expenditure as a percentage of GDP                                                  2.60     1.87     -0.73
     Oman                      0.37
                                                                  deaths from internal conflict have risen whilst deaths       UN Peacekeeping Funding                                                                      1.30     1.36     0.05
     Egypt                     0.45                               from external conflict have decreased. In general,           Volume of transfers of major conventional weapons as supplier (exports) per 100,000 people   1.71     1.78     0.08
     Syria                     0.78                               external peace has improved whilst internal peace has
                                                                                                                               Number of external and internal conflicts fought                                             0.78     0.93     0.15
                               1.12
                                                                  deteriorated.
     Libya                                                                                                                     Number of displaced people as a percentage of the population                                 0.44     1.20     0.76
                                                                                                                               Number of homicides per 100,000 people                                                       4.83     10.09    5.26
                                                                                                                               Number of jailed population per 100,000 people                                               152.97   160.91   7.94

All five of the biggest risers were countries emerging                                                                         Number of internal security officers and police 100,000 people                               326.29   354.46   28.17

from conflicts: Sri Lanka saw the end of a devastating                                                                         Number of deaths from organised conflict (internal)                                          781.90   818.97   37.08
civil war, Lebanon concluded its conflict with Israel,
Chad dealt with the fallout from an attempted rebel
takeover, Zimbabwe began to recover after its power-
sharing agreement was reached, and Georgia’s conflict
with Russia came to an end.
    By contrast, all five of the biggest fallers were
caught up in the events of the Arab Spring, with Syria
and Libya being impacted the most. The Gaddafi
regime was eventually overthrown after NATO forces
intervened in 2011, whilst a conflict that verges on
civil war still threatens Syria.


52                                                                                                                                                                                                                                                         53
Indicator                                                                                                                                                                                                                 Indicator
trends                                                                                                                                                                                                                       trends


Although the variance for most indicators did not         their level of crime indicator scores.                    Chart 2.14: Political Instability                          chart 2.15: Number of deaths from
                                                                                                                                                                               organised conflict (internal)
change significantly between 2007 and 2012, there
were a few instances where there was interesting          Chart 2.13: Likelihood of violent demonstrations               5                                  Max                     55000
variation between and within the minimum,
maximum, and median values in the indicators.                  5                                   Max
                                                                                                                         4                                                          44000

CHart 2.12: Level of violent crime
                                                                                                                                                                                    33000
                                                               4                                                                                                                                                           Max
                                                                                                                         3
      5                                 Max                                                                                                                Median
                                                                                                                                                                                    22000
                                                               3                                   Median
                                                                                                                         2
      4                                                                                                                                                                             11000

                                                               2                                                                                                                                                           Median
                                                                                                                         1                                   Min                        0
                                                                                                                             2007 2008 2009 2010 2011 2012                                                                 Min
      3                                 Median                                                                                                                                              2008   2009   2010   2011   2012

                                                               1                                    Min
                                                                   2007 2008 2009 2010 2011 2012
      2
                                                                                                                    The ‘Political instability’ indicator is a qualitiative    The ‘Number of deaths from organised internal
                                                                                                                    indicator compiled by EIU analysts. A score of 1           conflict’ indicator has remained consistently low for
      1                                   Min
          2007 2008 2009 2010 2011 2012
                                                          The ‘Likelihood of violent demonstrations’ is a           means stable, whilst a score of 5 means a country is       the majority of the world. During the six-year period,
                                                          qualitative indicator compiled by the Economist           politically unstable.                                      at most only 30 countries had a banded score of 2 or
                                                          Intelligence Unit (EIU). The indicator contributes 4%         Unlike other qualitiative indicators, the political    more, i.e. greater than 24 deaths from conflict. It is a
The ‘Level of violent crime’ is a qualitative indicator   to the overall GPI score. The scoring range is between    instability has had its range increase between 2010        quantitative indicator.
compiled by the Economist Intelligence Unit (EIU).        1 (very low) to 5 (very high).                            and 2011. Moreover, the median value has also                  The extreme fluctuations in the maximum value
The indicator contributes 5.33% to the overall GPI            The range of scores for likelihood of violent         increased 0.5 during the six-year period. Whilst           reflect the major conflicts which were occurring
score. The scoring range is between 1 (very low) and 5    demonstrations indicator has remained unchanged           some regions of the world have seen slight reductions      during the relevant time period: Iraq (2008-2009),
(very high).                                              with scores spanning all possible values from 1 to 5.     in their score (Asia Pacific), Central, Eastern and        Sri Lanka (2010-2011) and Libya (2012). Other
    The range of scores for the level of violent crime        All regions saw an increase in their scores with      Western Europe saw slight increase in their political      major conflicts which resulted in a large number
indicator has remained unchanged with scores              the Middle East and North Africa seeing the biggest       instability score. Similarly, the Middle East and North    of casualties occurred in Mexico, Pakistan and
spanning all possible values from 1 to 5.                 change between 2010 and 2011 as a result of the Arab      Africa saw a steep increase in 2010 and 2011.              Afghanistan.
    Although the median value has increased 1             Spring protests.                                              Madagascar has the largest change in its score             The ‘Number of deaths from organised internal
whole point, this is primarily due to the addition            Although many countries saw their scores increase     going from 1.75 to 4.75 following the Malagasy             conflict’ contributes 6.67% to the overall GPI.
of new countries to the GPI. These additions to the       by 0.5 or 1, the median was pushed up further by the      political crisis which saw a wave of protests, riots and   In terms of banded scores most countries which
GPI are countries which score poorly. For example,        inclusion of new countries. As was the case with the      lootings. Libya also had a large change in score, going    have experienced cessation of internal conflict
Guinea, Guinea-Bissau, Guyana, Kyrgyz Republic            ‘Level of violent crime’ indicator, these new countries   from 2.25 to 5 after the overthrow of former dictator      have marginally improved their scores. Iraq, Israel,
and Tajikistan have all consistently received a score     often received relatively high scores.                    Muammar Gaddafi.                                           Ethiopia and Sri Lanka have all improved. On the
of 4 since their inclusion. Other countries like Nepal,                                                                                                                        other hand, countries like Mexico, Libya and Pakistan
Lesotho, Liberia and Sierra Leone received scores of 3                                                                                                                         have seen their peace decline reflecting the precarious
or 3.5. Hence, the inclusion of these countries, which                                                                                                                         situation of these countries. Mexico has gone from a
have relatively higher levels of violent crime, has                                                                                                                            1 to a 5 in two years whilst Libya has done this in just
pushed the median up.                                                                                                                                                          one year.
    Some countries have seen improvements: the
United Arab Emirates has seen its score drop from 2
to 1 during the 2007-2012 time period which stands
in contrast to the rest of the Middle East and North
Africa region which saw the largest increase in scores.
Cambodia and Costa Rica also saw improvements in


54                                                                                                                                                                                                                                  55
Correlation
                                                                                                                                                                                                                                                               trends


Correlation
trends

The existence of six years of data has allowed IEP to                                Chart 2.16 shows the relationship between the                     TABLE 2.7: CORRELATION BETWEEN socio-economic                Both the Corruption Perception Index and per capita
                                                                                                                                                       factors and the GPI, combined data 2007-2012
analyse which correlates of peace have the most robust                           Political Terror Scale and the GPI. Most interestingly,                                                                            GDP have a similar looking relationship with the
                                                                                                                                                       Corruption, governance, economic opportunity and education
relationship with the GPI, and also to assess which                              whilst good performance on the Political Terror                       are all closely correlated with peacefulness.                Global Peace Index. There appears to be a ‘tipping
of the 23 indicators in the GPI has been the best                                Scale is a good predictor of peacefulness, the same                                                                                point’ for countries with a score of around 2 on the
predictor of GPI performance over the last six years.                            relationship does not apply in reverse. Every country                                                                              GPI. This meant that at a score of 2 on the peace
                                                                                                                                                        Socio-Economic Factors                             R
    Table 2.6 below shows the correlation between                                which scores a 1 on the Political Terror Scale has                                                                                 index, small positive changes in peace had large
the GPI indicators. The Political Terror Scale has the                           a GPI score less than 2. By contrast, there are a                      Corruption Perceptions Index                      -0.71     positive impacts on corruption or per capita GDP.
strongest overall correlation with the Global Peace                              number of countries with scores less than 2 which                      Political culture                                 -0.65     Similarly once past the score of 2 on the GPI small
Index, at .8212. The correlation scatterplot below                               have Political Terror Scale scores greater than 3.5.                   Functioning of government                         -0.65     negative changes in corruption or per capita GDP
does show that this relationship may have some                                   All the countries with low levels of political terror are              Political Democracy Index                         -0.64
                                                                                                                                                                                                                    were associated with large decreases in peace. Both
predictive power.                                                                peaceful, but not all peaceful countries have low levels                                                                           of these datasets were also exhibited statistically
                                                                                                                                                        The extent of regional integration                 0.62
                                                                                 of political terror.                                                                                                               significant relationships with the GPI at the 5%
                                                                                                                                                        Hostility to foreigners/private property           0.62
                                                                                                                                                                                                                    level when the change in GPI score over the last five
                                                                                                                                                        Civil liberties                                   -0.58
TABLE 2.6: CORRELATION BETWEEN GPI INDICATORS AND GPI
                                                                                 Chart 2.16: GPI vs Political Terror Scale, Five Years of Data
                                                                                                                                                                                                                    years was regressed against the change in these two
OVERALL SCORE, COMBINED DATA 2007-2012                                                                                                                  Mean years of schooling                           -0.55     datasets.
                                                                                 All the countries with low levels of political terror are peaceful,
Of all the GPI indicators, the Political Terror Scale has the                    but not all peaceful countries have low levels of political terror.    Freedom of the Press Index                         0.52
strongest correlation with the index as a whole.
                                                                                                                                                        Infant mortality per 1,000 live births             0.52
                                                                                                         5                                              GDP per capita                                    -0.51
 Indicator                                            R
                                                                                                                                                        Electoral process                                 -0.51
 Political Terror Scale                                   0.8212
                                                                                                                                                        Secondary school enrolment ration (% Net)         -0.49
                                                                    Political Terror Scale (2007-2012)


 Level of organized internal conflict                     0.8210                                         4                                              Life expectancy                                   -0.49
 Access to small arms                                     0.7161
                                                                                                                                                        Higher education enrolment (% Gross)              -0.47
 Perception of criminality                                0.7134
                                                                                                                                                        Political participation                           -0.47
 Relations with neighbouring countries                    0.6616                                         3
                                                                                                                                                        Gender inequality                                 -0.47
 Likelihood of violent demonstrations                     0.6429
                                                                                                                                                        Primary school enrolment ratio (% Net)            -0.46
 Violent crime                                            0.6179
                                                                                                                                                        Adult literacy rate (% of population over 15)     -0.44
 Terrorist acts                                           0.6106                                         2
                                                                                                                                                        Willingness to fight                               0.38
 Political instability                                    0.5235
                                                                                                                                                        Number of visitors as % domestic population       -0.33
 Deaths from organized conflict (internal)                0.3882
                                                                                                                                                        Gini Index                                         0.33
 Internally displaced people as % of the                                                                 1
 population                                               0.3626
                                                                                                             1   2             3              4    5    15-34 year old males as % of adult population      0.33
                                                                                                                 Global Peace Index (2007-2012)
                                                                                                                                                        Women in parliament                               -0.30
 Homicide rate                                            0.3260
                                                                                                                                                        Current education spending                        -0.30
 Number of external and internal conflicts                                       Table 2.7 shows the correlation coefficient for the
 fought                                                   0.2944                                                                                        Unemployment %                                     0.21
                                                                                 various multidimensional factors of peace over the
 Peacekeeping Funding                                     0.2846                                                                                        Net migration (% of population)                   -0.18
                                                                                 six years of the GPI. Many of these factors have
 Military expenditure as a % of GDP                       0.2504                                                                                        Exports + imports                                 -0.15
                                                                                 consistently correlated strongly with the GPI, and the
 Armed forces personnel                                   0.1889                 combined correlation demonstrates the robustness of                    Foreign direct investment (flow) % of GDP         -0.12
 Number of deaths from external conflict                  0.0813                 this relationship. A number of factors have exhibited                  Nominal GDP (US$ bn)                              -0.10
 Incarceration rate                                       0.0562                 a close and robust relationship with the GPI over                      Nominal GDP (US$ PPP bn)                          -0.04
 Number of police officers                                0.0491                 time, most notably corruption perceptions but also                     Gender ratio of population: men/women              0.00
 Military capability                                      -0.0388                functioning of government, freedom of the press,
 Weapons imports                                          -0.1583
                                                                                 and civil liberties. Notably, when the log of GDP per
                                                                                 capita is taken and correlated against the GPI, the
                                                                                 strength of the correlation increases from -.51 to -.58.


56                                                                                                                                                                                                                                                                     57
Correlation                                                                                                                                                                                                                                                                                                                             Correlation
trends                                                                                                                                                                                                                                                                                                                                       trends


CORRUPTION                                                                                                                                         Chart 2.18: GPI vs Corruption perceptions INDEX, INTERNAL AND EXTERNAL PEACE
                                                                                                                                                   External Peace does not correlate against the CPI, while Internal Peace correlates strongly.

Chart 2.17: GPI vs Corruption perceptions
Full democracies are considerably more peaceful than any other                                                                                                                                10                                                                                             10
government type.


                                                                                                                                                                                                                                              Corruption Perceptions Index (2007-2012)
                                                                                                                                                   Corruption Perceptions Index (2007-2012)
                                                                                                                                                                                              8                                                                                              8
                                                 10


                                                                                                                                                                                              6                                                                                              6


                                                                                                                                                                                              4                                                                                              4
                                                 8


                                                                                                                                                                                              2                                                                                              2
      Corruption Perceptions Index (2007-2012)


                                                                                                                                                                                              0                                                                                              0
                                                                                                                                                                                                   1   2              3             4     5                                                   1.0     1.5            2.0         2.5         3.0         3.5
                                                 6
                                                                                                                                                                                                       GPI - Internal Peace (2007-2012)                                                                     GPI - External Peace (2007-2012)


                                                                                                                                                     Chart 2.18 shows the Corruption Perceptions                                                 Chart 2.19: LOG GPI vs LOG Corruption perceptions INDEX
                                                                                                                                                                                                                                                 Taking the log of the CPI and correlating it against the GPI
                                                 4                                                                                                   Index correlated against Internal Peace and Exernal
                                                                                                                                                                                                                                                 reveals a linear relationship between peace and corruption.
                                                                                                                                                     Peace respectively. The correlation with external
                                                                                                                                                     peacefulness is effectively zero, whilst the correlation                                                                                1.0

                                                                                                                                                     with internal peacefulness is almost identical to the


                                                                                                                                                                                                                                              Log Corruption Perceptions Index (2007-2012)
                                                                                                                                                     correlation with the GPI. This is partially the result
                                                                                                                                                                                                                                                                                             0.8
                                                 2
                                                                                                                                                     of external peacefulness having a much smaller range
                                                                                                                                                     than internal peacefulness, (from 1 to 3.1), but this
                                                                                                                                                     does not completely explain the dramatic difference in                                                                                  0.6

                                                                                                                                                     the correlation strength between internal and external
                                                                                                                                                     peacefulness.                                                                                                                           0.4
                                                                                                                                                         Chart 2.19 shows the approximate log relationship
                                                 0
                                                                                                                                                     between GPI and corruption. When the log of the
                                                     1.0   1.5   2.0                 2.5                3.0         3.5              4.0                                                                                                                                                     0.2
                                                                                                                                                     corruption score is correlated against the GPI, a linear
                                                                       Global Peace Index (2007-2012)
                                                                                                                                                     relationship emerges.
                                                                                                                                                                                                                                                                                             0.0
Transparency International’s Corruption Perceptions                                        clear, logarithmic relationship between peace and                                                                                                                                                    1.0   1.5        2.0        2.5       3.0          3.5    4.0
                                                                                                                                                                                                                                                                                                              Global Peace Index (2007-2012)
Index (CPI) attempts to assess the level of public                                         corruption. The one major outlying country which
sector corruption in a given country. Because                                              has relatively low levels of corruption but also low
corruption is often hidden and hard to assess, various                                     peacefulness is Israel, a country whose GPI score is
proxy measures and survey data are used in order                                           dominated by external components related to conflicts
to construct the CPI. The CPI looks at measures                                            with neighbours and measures of militarisation.
of public sector corruption like embezzlement,
kickbacks, bribery, and the effectiveness of anti-
corruption efforts.
    Chart 2.17 shows that there appears to be a


58                                                                                                                                                                                                                                                                                                                                                       59
Correlation                                                                                                                                                                                                                                    Correlation
trends                                                                                                                                                                                                                                              trends


GDP PER CAPITA

Chart 2.20: GPI vs GDP PER CAPITA (US DOLLARS)                                                                                     Chart 2.21: GPI vs GDP PER CAPITA (US DOLLARS) BY
There is a strong correlation between the GPI and GDP per                                                                          government type, BUBBLE SIZE IS PROPORTIONAL TO
capita.                                                                                                                            POPULATION SIZE.
                                                                                                                                   Full democracies are considerably more peaceful than any other
                                                                                                                                   government type.
                                         100000
                                                                                                                                                                                                                                           full democracy

                                                                                                                                                                                                                                      flawed democracy
                                                                                                                                                                      $55
                                                                                                                                                                                                                                            hybrI d regIme

                                          80000                                                                                                                       $50
                                                                                                                                                                                                                                    auThorIT arIa n regIme
        GDP Per Capita (USD) 2006-2011


                                                                                                                                                                      $45


                                          60000                                                                                                                       $40


                                                                                                                                    GDP Per Capita (PPP, Thousands)
                                                                                                                                                                      $35


                                                                                                                                                                      $30
                                          40000

                                                                                                                                                                      $25


                                                                                                                                                                      $20
                                          20000
                                                                                                                                                                      $15


                                                                                                                                                                      $10

                                              0
                                               1.0   1.5        2.0               2.5              3.0               3.5                                              $5

                                                            Global Peace Index (2007-2012)
                                                                                                                                                                      $0
                                                                                                                                                                            1   1.5                  2                        2.5      3                      3.5
                                                                                                                                                                                                    2010 Global Peace Index Score

There appears to be a similar relationship between the                     following bubble charts only use one year’s worth
GPI and GDP per capita. Countries with GPI scores                          of PPP GDP per capita data (from 2010). The most        However, there is a large amount of variance
less than 2 tend to have large increases in GDP for                        successful form of government in relation to peace      amongst the authoritarian regimes across population,
small increases in peacefulness, whilst countries less                     and GDP per capita income is democracy as can           peacefulness, and GDP per capita. A number of the
peaceful than this turning point seem to have little                       be seen in the chart. Both authoritarian and hybrid     smaller authoritarian regimes have very high GDP per
variance in their GDP per capita figures. The outlying                     regimes perform most poorly with flawed democracies     capita, and a few are both relatively rich and relatively
countries on this scatter plot are all resource rich.                      sitting between the two groups. It is interesting to    peaceful. Conversely, a number of larger authoritarian
Further exploring the GDP per capita correlation by                        note that flawed democracies are on the cusp of or      regimes have broken past the peace threshold, but
inserting governance and population data reveals                           just over the peace/GDP tipping point, and most         remain relatively poor, with GDPs per capita of less
some interesting trends. For the sake of clarity, the                      hybrid regimes sitting below the peace/GDP threshold.   than $5000 in PPP terms.


60                                                                                                                                                                                                                                                           61
Correlation
trends


                                                                                                                  Quintile
                                                                                                                  analysis

Chart 2.22: GPI vs GDP PER CAPITA BY REGION                                                                       Whilst the overall trend in peacefulness has shown              Table 2.8 highlights the distribution of scores in a
Full democracies are considerably more peaceful than any other
                                                                                                                  little deviation in terms of the global average, there          heat-map format for each quintile, from 2009 to
government type and are generally wealthier.
                                                                                                                  have been a number of changes that have occurred                2012. Four countries moved from the second to
                                                                                                                  at the quintile level. For the purposes of this report,         the first quintile over this time period, with Bhutan
                             GPI SCORE                           GPI SCORE
                                 2.0                                 2.0                                          the range of scores from the 2008 GPI was divided               having the most pronounced rise. Four countries also
                                                                                   full democracy
                                                                                                                  into five equal segments. Chart 2.23 below shows the            fell out of the first quintile and into the second, with
                                                                               flawed democracy
                                                                                                                  percentage of GPI countries that were found in each             Oman having the biggest fall. This was in large part
                                                                                     hybrI d regIme
                                                                                                                  quintile in 2009, and then again in 2012. Even though           due to the fall out of the Arab Spring uprising.
                                                                             auThorIT arIa n regIme               the average score in 2009 and 2012 was fairly similar,
                                                                                                                  there are now more countries in the middle quintile.            TABLE 2.8: peace trends by quintile, 2009-2012

                                                                                                                                                                                   COUNTRY                2009      2010     2011   2012

                                                                                                                                                                                   Iceland                1.23      1.21     1.15   1.11
                                                                                                                  CHART 2.23: % OF COUNTRIES THAT ARE PEACEFUL BY QUINTILE         Denmark                1.22      1.34     1.29   1.24
                                                                                                                  Although there was no change in overall average peacefulness
                                                                                                                                                                                   New Zealand            1.20      1.19     1.28   1.24
                                                                                                                  from 2009 to 2012, there are now more countries in the middle
                                                                                                                  quintile. Each square represents 1% of total GPI countries.      Canada                 1.31      1.39     1.35   1.32
$5000 PPP                                                                                             $5000 PPP
                                                                                                                                                                                   Japan                  1.27      1.25     1.29   1.33

                                                                                                                                      Most Peaceful Quintile                       Ireland                1.33      1.34     1.37   1.33
                                                                                                                                                                                   Austria                1.25      1.29     1.34   1.33
                                                                                                                                                                                   Slovenia               1.32      1.36     1.36   1.33
                                                                                                                                      Least Peaceful Quintile
                                                                                                                                                                                   Finland                1.32      1.35     1.35   1.35
                                                                                                                                                                                   Switzerland            1.39      1.42     1.42   1.35
                                                                                                           A
                                                                                                                                                                                   Belgium                1.36      1.40     1.41   1.38
                                                                                                                                             2009
                                                                                                                                                                                   Qatar                  1.39      1.39     1.40   1.39
                                                                                                                                                                                   Czech Republic         1.33      1.36     1.32   1.40
                                                                                                                                                                                   Sweden                 1.27      1.35     1.40   1.42
                                                                                                                                                                                   Germany                1.39      1.40     1.42   1.42
                                                                                                                                                                                   Portugal               1.35      1.37     1.45   1.47
$5000 PPP                                                                                             $5000 PPP
                                                                                                                                                                                   Hungary                1.58      1.50     1.50   1.48
                             GPI SCORE                           GPI SCORE                                                                                                         Norway                 1.22      1.32     1.36   1.48
                                 2.0                                 2.0
                                                                                                                                                                                   Bhutan                 1.67      1.68     1.69   1.48
                                                                                                                                             2012
                                                                                                                                                                                   Malaysia               1.56      1.54     1.47   1.48
                                                                                                                                                                                   Mauritius                                        1.49
                                                                                                                                                                                   Australia              1.48      1.47     1.46   1.49
                                                                                                                                                                                   Singapore              1.53      1.62     1.59   1.52
                                                                                                                                                                                   Poland                 1.60      1.62     1.54   1.52
                                                                                                                                                                                   Spain                  1.58      1.59     1.64   1.55
                                                                                                                                                                                   Slovakia               1.54      1.54     1.58   1.59
                                                                                                                                                                                   Taiwan                 1.65      1.66     1.64   1.60
                                                                                                                                                                                   Netherlands            1.53      1.61     1.63   1.61
                                                                                                                     The GPI has now had a uniform set of indicators
                                                                                                                                                                                   United Kingdom         1.65      1.63     1.63   1.61
                                                                                                                  since 2009, although there have been some small
                                                                                                                                                                                   Chile                  1.48      1.62     1.71   1.62
                                                                                                                  methodological changes since then.


62                                                                                                                                                                                                                                         63
Quintile                                                                                                                                                                                                             Quintile
analysis                                                                                                                                                                                                             analysis


 Botswana               1.64      1.64     1.69     1.62     Albania                 1.93   1.93   1.91   1.93    Saudi Arabia           2.17     2.22    2.19     2.18   Both Syria and Libya have experienced tremendous
 Romania                1.59      1.75     1.74     1.63     Moldova                 1.92   1.94   1.89   1.93    Haiti                   2.33    2.27     2.29    2.18
                                                                                                                                                                          conflict and upheaval since the beginning of the Arab
                                                                                                                                                                          Spring, with the Gaddafi regime being overthrown in
 Uruguay                1.56      1.57     1.52     1.63     Macedonia               2.04   2.05   2.05   1.93    Cambodia                2.18    2.26     2.30    2.21
                                                                                                                                                                          Libya and an as yet unresolved uprising still gripping
 Vietnam                1.66      1.69     1.67     1.64     Guyana                  2.10   2.09   2.11   1.94    Belarus                 2.10    2.24     2.28    2.21
                                                                                                                                                                          Syria.
                                                             Cuba                    1.86   1.96   1.96   1.95    Uzbekistan              2.20    2.25     2.26    2.22
Whilst only one country (Ecuador) moved from the
                                                             Ukraine                 2.01   2.12   1.99   1.95    Egypt                   1.77    1.78     2.02    2.22
third quintile into the second, 12 moved from the                                                                                                                                                 2009    2010    2011     2012
second to the third.                                         Tunisia                 1.70   1.68   1.76   1.95    El Salvador             2.07    2.20     2.22    2.22
                                                             Cyprus                  1.74   2.01   2.01   1.96    Jamaica                 2.11    2.14     2.24    2.22    Yemen                  2.36    2.56    2.67     2.60
                           2009     2010     2011     2012
                                                             Gambia                         1.90   1.91   1.96    Benin                                            2.23    Colombia               2.65    2.79    2.70     2.62
 Croatia                   1.74     1.71     1.70     1.65                                                                                                                 Chad                   2.88    2.96    2.74     2.67
                                                             Gabon                   1.76   1.98   2.06   1.97    Armenia                         2.27     2.26    2.24
 Costa Rica                1.58     1.59     1.68     1.66                                                                                                                 Nigeria                2.60    2.76    2.74     2.80
                                                             Paraguay                1.92   2.00   1.95   1.97    Niger                                    2.36    2.24
 Laos                      1.70     1.66     1.69     1.66                                                                                                                 Syria                  2.05    2.27    2.32     2.83
                                                             Greece                  1.78   1.89   1.95   1.98    Turkmenistan            2.11    2.29     2.25    2.24
 Italy                     1.65     1.70     1.77     1.69                                                                                                                 Libya                  1.71    1.84    2.82     2.83
                                                             Senegal                 1.98   2.03   2.05   1.99    Bahrain                 1.88    1.97     2.40    2.25
 Bulgaria                  1.77     1.78     1.85     1.70                                                                                                                 Pakistan               2.86    3.05    2.91     2.83
                                                             Peru                    1.97   2.07   2.08   2.00    Rwanda                  2.03    2.02     2.19    2.25
 France                    1.58     1.64     1.70     1.71                                                                                                                 Israel                 3.04    3.02    2.90     2.84
                                                             Nepal                   1.94   2.04   2.15   2.00    Kenya                   2.27    2.37     2.28    2.25
 Estonia                   1.66     1.75     1.80     1.72                                                                                                                 Central African        2.73    2.79    2.87     2.87
                                                             Montenegro              2.05   2.06   2.11   2.01    Algeria                 2.21    2.28     2.42    2.26
 South Korea               1.63     1.72     1.83     1.73                                                                                                                 Republic
                                                             Nicaragua               1.80   1.92   2.02   2.01    Eritrea                                  2.23    2.26
 Lithuania                 1.69     1.71     1.76     1.74                                                                                                                 North Korea            2.72    2.86    3.09     2.93
                                                             Brazil                  2.02   2.05   2.04   2.02    Venezuela               2.38    2.39     2.40    2.28
 Argentina                 1.85     1.88     1.85     1.76                                                                                                                 Russia                 2.75    3.01    2.97     2.94
                                                             Bolivia                 1.99   2.04   2.04   2.02    Guatemala               2.22    2.26     2.40    2.29
 Latvia                    1.77     1.83     1.79     1.77                                                                                                                 Democratic Republic    2.89    2.92    3.02     3.07
                                                             Swaziland                      1.98   2.00   2.03    Mauritania              2.48    2.39     2.43    2.30    of the Congo
 United Arab Emirates      1.67     1.74     1.69     1.78
                                                             Ecuador                 2.21   2.16   2.12   2.03    Thailand                2.35    2.39     2.25    2.30    Iraq                   3.34    3.41    3.30     3.19
 Kuwait                    1.68     1.69     1.67     1.79
                                                             Equatorial Guinea       1.80   1.95   2.04   2.04    South Africa            2.44    2.38     2.35    2.32    Sudan                  2.92    3.13    3.22     3.19
 Mozambique                1.77     1.78     1.81     1.80
                                                             United States of        2.01   2.06   2.06   2.06    Iran                    2.10    2.20     2.36    2.32    Afghanistan            3.28    3.26    3.21     3.25
 Namibia                   1.84     1.86     1.85     1.80   America
                                                                                                                  Honduras                2.26    2.39     2.33    2.34    Somalia                3.26    3.40    3.38     3.39
 Ghana                     1.76     1.78     1.75     1.81   China                   1.92   2.03   2.05   2.06
                                                                                                                  Turkey                  2.39    2.42     2.41    2.34
 Zambia                    1.78     1.81     1.83     1.83   Dominican Republic      1.89   2.04   2.12   2.07
                                                                                                                  Kyrgyz Republic                          2.30    2.36   Not one single country managed to climb out of
 Sierra Leone                       1.83     1.90     1.86   Bangladesh              2.04   2.06   2.07   2.07
                                                                                                                  Azerbaijan              2.33    2.37     2.38    2.36   the lowest quintile, although both North Korea
 Lesotho                                              1.86   Guinea                                2.13   2.07
                                                                                                                  Philippines             2.33    2.57     2.57    2.41   and Pakistan dipped in and out for one year
 Morocco                   1.81     1.87     1.89     1.87   Papua New Guinea        2.06   2.11   2.14   2.08
                                                                                                                  Cote d’Ivoire           2.34    2.30     2.42    2.42   periods. There were a number of countries that
 Tanzania                  1.80     1.83     1.86     1.87   Trinidad and Tobago     2.04   2.10   2.05   2.08                                                            managed to move from the fourth to the third
                                                                                                                  Mexico                  2.21    2.22     2.36    2.44
 Djibouti                                             1.88   Angola                  2.10   2.06   2.11   2.10                                                            quintile.
                                                                                                                  Lebanon                 2.72    2.64     2.60    2.46
 Burkina Faso              1.91     1.85     1.83     1.88   Guinea-Bissau                                2.11
                                                                                                                  Ethiopia                2.55    2.46     2.47    2.50
 Mongolia                  2.04     2.10     1.88     1.88   Cameroon                2.07   2.21   2.10   2.11
                                                                                                                  Burundi                 2.53    2.58     2.53    2.52
 Oman                      1.52     1.56     1.74     1.89   Uganda                  2.14   2.16   2.16   2.12
                                                                                                                  Myanmar                 2.50    2.58     2.54    2.52
 Malawi                    1.71     1.83     1.74     1.89   Madagascar              1.91   2.02   2.24   2.12
                                                                                                                  Zimbabwe                2.74    2.68     2.72    2.54
 Panama                    1.80     1.88     1.81     1.90   Tajikistan                            2.22   2.12
                                                                                                                  Georgia                 2.74    2.97     2.56    2.54
 Jordan                    1.83     1.95     1.92     1.91   Liberia                        2.20   2.16   2.13
                                                                                                                  India                   2.42    2.52     2.57    2.55
 Indonesia                 1.85     1.95     1.98     1.91   Mali                    2.09   2.25   2.19   2.13
 Serbia                    1.95     2.07     2.07     1.92   Sri Lanka               2.48   2.62   2.41   2.15   The largest movements occurred in the fourth
 Bosnia and                1.76     1.87     1.89     1.92   Republic of the Congo   2.20   2.19   2.16   2.15   quintiles, with Syria and Libya moving from the
 Herzegovina                                                                                                     second to the fourth quintile in the last four years.
                                                             Kazakhstan              2.02   2.11   2.14   2.15


64                                                                                                                                                                                                                           65
Executive
                   Summary


                   The Positive Peace Index (PPI) is a measure of the         of peace. Similarly, the inverse scenario suggests a fall
                   strength of the attitudes, institutions, and structures    in peacefulness may be more likely to occur. This is
                   of 108 nations to determine their capacity to create       referred to as a positive peace deficit, where the PPI
                   and maintain a peaceful society. The PPI is based on       ranking is substantially lower than the GPI ranking,
                   a statistical framework which groups these attributes      highlighting the weakness of the necessary pillars to
                   into eight key categories known as the ‘Pillars of         sustain peace in a society.
                   Peace’. These pillars have been identified as describing


     METHODOLOGY
                   what underpins a peaceful society. This approach           Key observations from the research are:
                   stands in contrast to the extensive quantitative
                   conflict literature which is predominately focused on      •	 The top five nations on the PPI are all Nordic

     RESULTS       understanding the causes for the outbreak of war or
                   civil unrest.
                                                                                 nations which all score highly in the GPI.
                                                                              •	 There are only two countries that are not high


     & FINDINGS
                       The PPI is different from the GPI as it uses the          income in the top 30. These are Chile and
                   definition ‘absence of violence or fear of violence’          Lithuania; both upper middle income nations.
                   to measure peace. While understanding the relative
                                                                              •	 The bottom ten is dominated by seven Sub-Saharan
                   levels and types of violence present in the world is
                                                                                 African nations. The other three are from the Asia
                   useful, this on its own will not identify the economic,
                                                                                 Pacific region.
                   political, and cultural factors that shape a peaceful
                   society. In contrast to negative peace, positive peace     •	 North America and Western Europe are the most
                   is about the appropriate attitudes, institutions,             positively peaceful regions. Sub-Saharan Africa is
                   and structures which when strengthened, lead to a             the least positively peaceful region.


        positive
                   more peaceful society. The imperative of deepening         •	 Singapore is the only hybrid regime in the top 20
                   understanding how to create peace has been                    and France is the only flawed democracy in the top
                   highlighted by the recent state-building experiences          20.

        peace      such as in Iraq and Afghanistan. Both of these nations
                   are still rooted at the bottom of the GPI.
                                                                              •	 The bottom ten nations on the PPI lag most on the
                                                                                 equitable distribution of resources and levels of


        index
                        One of the most notable observations is that             education compared to the world average.
                   the same attributes associated with peace are also
                                                                              •	 The top ten nations perform very well on
                   associated with many other positive social and
                                                                                 lower levels of corruption and well-functioning
                   economic outcomes such as high levels of education,
                                                                                 government.
                   higher GDP per capita, low levels of corruption and
                                                                              •	 Case study shows levels of violence in some of the
                   high social cohesion. Seen in this light, the Pillars
                                                                                 nations with the biggest PPI deficits are narrowing
                   of Peace provide a foundation for thinking about
                                                                                 due to increased political destabilization. Some
                   how to establish the optimal environment for human
                                                                                 examples are Syria, Egypt and Madagascar.
                   wellbeing and potential to flourish.
                                                                                 Madagascar would have had the highest positive
                       This analysis allows the comparison of the GPI
                                                                                 peace deficit in the world in 2007.
                   to the PPI to determine if nations have a positive
                   peace surplus or deficit. This gap is the difference in    •	 Full democracies have the highest average levels of
                   ranking between the two indices and provides a basic          peace both on the GPI and the PPI.
                   estimate of a nation’s potential to improve or decline     •	 Flawed democracies have the largest positive
                   in peace. If the ranking is lower on the GPI than the         peace surplus in terms of rank, indicating
                   PPI then there is an opportunity for an improvement           violence tends to be high in comparison to the
                   in peace as the society has the attitudes, institutions,      measured institutions and structures which score
                   and structures that are associated with higher levels         comparatively better.


66                                                                                                                                  67
Executive
Summary


                                                                                                                introduction


     Region Specific Highlights:                          strength of the entire wall is materially impacted.   The GPI represents one of the first rigorous attempts       These domains are:
•	 Latin America and Sub-Saharan Africa have                  The framework described in this paper does not    to measure the relative levels of the peacefulness          •	 Well-functioning government
   equally low scores on measures of Well-Functioning     aim at isolating causality; rather it describes the   of nations. By aggregating and generating a
                                                                                                                                                                            •	 Sound business environment
   Government.                                            ‘optimum’ environment for peace to flourish. This     comprehensive and reliable dataset which measures
                                                          means that peace-building efforts should aim at       direct violence, the GPI adds to the current stock of       •	 Equitable distribution of resources
•	 Sub-Saharan Africa scores worst on all three
                                                          enhancing and building these structures as much as    harmonized cross-country data. Since 2007 it has            •	 Acceptance of the rights of others
   indicators of Equitable Distribution of Resources
                                                          possible while dealing with tactical issues such as   informed policymakers, academics, and civil society         •	 Good relations with neighbours
•	 Central and Eastern Europe score worse than the
                                                          violence containment as they arise.                   organisations about the objective state of direct
   Asia Pacific and the Middle East and North Africa                                                                                                                        •	 Free flow of information
                                                                                                                violence in countries covering over 99% of the world’s
   on Sound Business Environment measures.                                                                                                                                  •	 High levels of education
                                                                                                                population. The purpose of this research is to better
•	 The Middle East and North Africa on average                                                                  understand the cultural, economic, and political            •	 Low levels of corruption
   scores lowest on Acceptance of the Rights Others                                                             conditions associated with peaceful environments.
   measures.                                                                                                        Up until now, the GPI has focused on measuring          From this framework, IEP has developed the PPI.
•	 Good Relations with Neighbours is the only                                                                   what is termed ‘negative peace’, which was described        There are a total of 21 indicators used in the PPI,
   positive peace indicator where North America does                                                            by Johan Galtung as the “absence of violence” and           each of these indicators have had their weightings
   not score the highest score.                                                                                 the “absence of the fear of violence”.1 Hence the GPI       determined empirically by the strength of the
                                                                                                                utilises 23 indicators of safety and security in society,   correlation or statistical association with the GPI.
•	 The Middle East and North Africa and Sub-
                                                                                                                militarisation, and ongoing domestic and international      The PPI indicators are all publically available datasets
   Saharan Africa have the poorest scores on Free
                                                                                                                conflict to determine the multidimensional nature of        from large intergovernmental organisations, research
   Flow of Information.
                                                                                                                negative peace in 158 countries. 2 This means nations       institutes, and civil society organisations.
•	 Sub-Saharan Africa is lagging on mean years of
                                                                                                                with a high ranking in the GPI are considered more
   schooling and secondary school enrolment rates.
                                                                                                                peaceful because they are relatively safer and more
   Latin America, Middle East and North Africa and
                                                                                                                secure than countries lower in the rankings.
   the Asia Pacific all have the similar scores on key
                                                                                                                    In contrast to negative peace, Galtung described
   peace-related education measures.
                                                                                                                a second dimension called positive peace. Broadly
•	 Latin America has the second highest levels of                                                               understood, positive peace is derived from
   corruption after Sub-Saharan Africa.                                                                         preventative solutions which are optimistic and
The lower ranked nations in the PPI tend to be lower                                                            facilitate a more integrated society. 3 According to
income nations with hybrid or authoritarian regimes.                                                            Galtung, this results in ‘cooperation for mutual
Hybrid regimes are on average slightly less peaceful                                                            benefit, and where individuals and society are in
than authoritarian regimes although they have similar                                                           harmony’.4 From this conceptual basis, IEP defines
scores on the PPI. Interestingly, the average positive                                                          positive peace as “the set of attitudes, institutions and
peace score is similar in four of the regions of the                                                            structures which when strengthened, lead to a more
world, Central and Eastern Europe, Asia Pacific, Latin                                                          peaceful society.”
America and the Middle East and North Africa.                                                                       IEP has empirically derived the key indicators
    The eight domains in the PPI are consistently                                                               and weightings of positive peace via statistical
associated with peaceful environments and can                                                                   analysis of six years of GPI data. The indicators
be seen as both interdependent and positively                                                                   used in the PPI attempt to comprehensively cover the
reinforcing of each other. This means the strength                                                              multidimensional factors associated with positive
of any one ‘pillar’ has the potential to either                                                                 peace. Over 300 cross-country datasets were compiled
positively or negatively influence peace. Due to the                                                            and statistically tested against the GPI to determine
inter-dependence within the PPI, the weakening or                                                               the strength of their association. The key factors
strengthening of any one ‘pillar’ will also weaken or                                                           identified are referred to as ‘Pillars of Peace’ and make
strengthen the presence of the other ‘pillars’. This is                                                         up eight separate domains of the PPI.
analogous to a brick wall, take out one brick and the


68                                                                                                                                                                                                                               69
why a                                                                                                                     Methodology
positive peace index?

In contrast to negative peace, positive peace can             and positive approach to peace and state building.          The Positive Peace Index is similar to the GPI in that    •	 Good relations with neighbours
inform our understanding of the appropriate attitudes,            The composite index approach of the PPI                 it is a composite index attempting to measure an          •	 High levels of education
institutions, and structures which when strengthened,         was chosen because positive peace is a latent and           unobserved multidimensional concept. The PPI is the
                                                                                                                                                                                    •	 Low levels of corruption.
lead to a nation’s capacity to harmoniously and               multidimensional concept which is represented in            first known attempt to build an empirically derived
non-violently resolve conflict. The approach in this          different social, political and economic forms.             index aiming to measure the latent variable of positive
paper stands in contrast to the extensive quantitative                                                                    peace from the definition of “the set of attitudes,
conflict literature which is predominately focused on         What is peace?                                              institutions and structures which when strengthened,
understanding the causes for outbreak of war as a             While there are many nuanced definitions of peace,          lead to a more peaceful society.”
key dependent variable. 5 The output of the PPI can           this paper uses two concepts, both of which have a               The starting point for developing the PPI was
be used for comparative studies which will further            rich history in peace studies. These two types of peace     to correlate the GPI against over 300 cross-country
inform the understanding of the key economic,                 are commonly referred to as ‘positive’ and ‘negative’       harmonized datasets measuring a variety of economic,
political and cultural factors that can improve peace         peace as defined by Johan Galtung. Negative peace is        governance, social, attitudinal and political factors.
and resilience of all societies, not just fragile states.     the absence of violence or fear of violence, an intuitive   This aggregation of data attempted to cover many
    By seeking to identify institutions which help a          definition that most people will agree with. This           known quantitative and qualitative datasets measuring
society move away from violence it is hoped a more            was used in defining the measures for the GPI which         factors at the nation-state level.8 Each dataset which
holistic picture of the key factors which drive peace         include indicators that measure both the internal           was significantly correlated was then organised under
can be identified. While a focus on ‘trigger’ factors         peacefulness of nations as well their external peace in     eight distinct headings or factors , these have been
or individual case studies is insightful they cannot          relation to other states.                                   previously referred to as the ‘Pillars of Peace’ and
reveal global or regional trends or help in identifying           In an effort to determine positive peace, the IEP       become the eight domains of the PPI. These structures
longer term causes of conflict. As the 2009/2010              has used a statistical framework to derive what are         were derived by empirical inspection and from the
Human Security Report identifies, there is still a            the attitudes, institutions and structures that are         large body of qualitative and quantitative literature
‘…remarkable lack of consensus in the research                associated with peace as measured by the GPI. This          highlighting the importance of these factors. Rather
findings on the causes of war and peace…also the              is the only known quantitative approach to defining         than attempting to isolate singular factors associated
inability of conflict models to predict the outbreak          positive peace and as such occupies a unique position       with peace, this approach is focused on identifying the
of conflicts.’6 To date, there are only a small number        in peace studies. The work provides a foundation            broad and complex associations that exist between
of robust findings which have widespread consensus            for researchers to deepen their understanding of            the drivers of violence and a multitude of formal and
in the research community. According to Hegre                 the empirical relationships between peace, social           informal cultural, economic, and political, variables.
and Sambanis 7 only three key findings have broad             development and other development variables.                     Under each of the eight domains, the data sources
agreement on the causes of civil war:                             The empirical link between negative peace and the       most closely correlated with the GPI were then
•	 The lower a country’s average income, the higher           factors in the PPI index appear to hold in developing       aggregated for each country. This resulted in the PPI
   the risk of war.                                           and developed contexts. Both negative and positive          having the following key features:
•	 War is more likely if a country has already                peace can be seen as the producer and product of
   experienced a war, the more recent the war the             forms of trust and cohesion that are a pre-requisite for
                                                                                                                          •	 21 indicators under eight domains
   more likely the risk.                                      well-functioning and prosperous societies. Countries
                                                                                                                          •	 108 countries covered
                                                              higher in positive peace also tend to have many other
•	 The risk of war increases as a country’s size
                                                              fundamentally positive social and economic outcomes.        •	 Time series covering only 2010
   increases.
                                                              For instance, IEP finds high peace countries have;
While some dispute the number of robust findings, it
                                                              higher per capita incomes, more equitable distribution      The key domains of the Positive Peace Index are:
is clear there are conflicting empirical conclusions as
                                                              of resources, better health and education outcomes,
to the causes of conflict. In contrast, by measuring
                                                              improved trust between citizens, greater social             •	 Well-functioning government
positive peace it is possible to determine another way
                                                              cohesion.                                                   •	 Sound business environment
to better understand how to reduce violence, but
more importantly how to build the resilience within              By moving countries away from direct violence and        •	 Equitable distribution of resources
societies so they are less likely to fall into conflict. It   towards positive peace, this demonstrates that it is
                                                                                                                          •	 Acceptance of the rights of others
is hoped this research can influence debate on how            also possible to reap a significant social and economic
                                                              dividend as a primary by-product of creating peace.         •	 Free flow of information
international institutions can facilitate a more holistic


70                                                                                                                                                                                                                      71
Methodology                                                                                                                                                                                                                                                  Methodology


Indicators


 Positive                                                                                                     % of
                                                                                                                            Indicator weightings                                                             statistical correlation to the 2011 GPI score. The
 Peace Domain     Indicator                         Data Source                                      Weight   Total Index
                                                                                                                                                                                                             stronger the correlation to the GPI, the higher the
                                                                                                                            All indicators are scored between one and five,                                  weighting portioned in the PPI. The lowest weighting
                  Government Effectiveness          World Bank, World Governance Indicators          0.73     5.64%         with one being the most ‘positively peaceful’ score                              is given to the Interpersonal Safety and Trust
Well-             Rule of Law                       World Bank, World Governance Indicators          0.77     5.94%         and five the least ‘positively peaceful’. This means                             indicator which accounts for 3.9 per cent of the index.
Functioning
Government        Political Culture                 Economist Intelligence Unit, Political           0.66     5.13%         countries which score closer to one are likely to have                           This is in comparison to the most heavily weighted
                                                    Democracy Index                                                         relatively more institutional capacity and resilience in                         factor of Intergroup Cohesion which is weighted at
                  Global Competitiveness Report     World Economic Forum, Global Competitiveness     0.60     4.63%         comparison to nations which score closer to five.                                0.80 and accounts for more than twice the portion of
                                                    Index                                                                       The weightings are between 0.5 and 0.8 and                                   Interpersonal Safety and Trust at 6.2 per cent of the
Sound Business    Index of Economic Freedom -       Heritage Foundation, Index of Economic Freedom   0.57     4.39%         have been derived by the strength of the indicator’s                             PPI.
Environment       Business Freedom
                  GDP Per Capita (PPP)              World Bank, World Governance Indicators          0.58     4.51%

                  Inequality Adjusted Human         United Nations Development Programme (UNDP)      0.53     4.14%
Equitable         Development Index (IHDI) 9
Distribution      Life Expectancy                   World Bank, World Development Indicators         0.51     3.94%
of Resources
                                                                                                                                                                                     GLOBAL PEACE INDEX
                  Infant Mortality                  World Bank, World Development Indicators         0.51     3.94%
                                                                                                                                                                             Measuring absence of violence
                  CIRI Empowerment Index            CIRI Human Rights Dataset                        0.74     5.76%                                                          and absence of fear of violence
Acceptance        Gender Gap Index                  World Economic Forum                             0.53     4.07%
of the Rights
of Others         Intergroup Cohesion               Indices for Social Development, International    0.80     6.19%
                                                    Institute of Social Studies (ISS)

                  Interpersonal Safety and Trust    Indices for Social Development, International    0.50     3.90%
Good Relations                                      Institute of Social Studies (ISS)                                                                  INTERNAL PEACE                                                    EXTERNAL PEACE
with Neighbours
                  Extent of Regional Integration    Economist Intelligence Unit (EIU)                0.64     4.99%                                A measure of internal                                         The extent to which a state
                                                                                                                                                    stability and safety                                        projects force externally, or
                  Press Freedom Index               Freedom House                                    0.60     4.65%                                                                                            suffers from external violence

Free Flow of      World Press Freedom Index         Reporters Without Borders                        0.56     4.34%
Information       Internet Usage                    International Telecommunications Union           0.62     4.82%
                                                    (ITU) and United Nations
                                                                                                                                         ACCEPTANCE OF THE                  LOW LEVELS OF             GOOD RELATIONS WITH                 WELL FUNCTIONING
                  Mean Years of Schooling           UNESCO, Institute of Statistics                  0.53     4.13%                       RIGHTS OF OTHERS                   CORRUPTION                  NEIGHBOURS                         GOVERNMENT
High Levels of
                                                                                                                                         Intergroup Cohesion, CIRI        World Bank Control of       Extent of Regional Integration,   Political Culture, Rule of Law,
Education         Secondary School Enrolment Rate   World Bank, World Development Indicators         0.48     3.69%
                                                                                                                                        Empowerment Index, Gender        Corruption, TI Corruption         Interpersonal Trust            Government Effectiveness
                                                                                                                                                 Gap Index                   Perceptions Index
                  Control of Corruption             World Bank, World Governance Indicators          0.73     5.69%
Low Levels of
Corruption        Corruptions Perception Index      Transparency International                       0.71     5.52%
                                                                                                                                             FREE FLOW OF                   HIGH LEVELS OF               SOUNDS BUSINESS                EQUITABLE SHARING OF
                                                                                                                                             INFORMATION                      EDUCATION                   ENVIRONMENT                        RESOURCES
                                                                                                                                          FH Press Freedom, RWB          Secondary Enrolment, Mean   Global Competitiveness, Business    IHDI, Infant Mortality, Life
                                                                                                                                        Freedom of the Press, Internet       Years of Schooling         Freedom, GDP per capita                  Expectancy
                                                                                                                                                   Usage


                                                                                                                                                                                    POSITIVE PEACE INDEX
                                                                                                                                                                            Formal and informal institutions
                                                                                                                                                                             that move a society away from
                                                                                                                                                                               violence and towards peace


72                                                                                                                                                                                                                                                                        73
Methodology                                                                                                                                                                                                           Methodology


Positive                                                    Description: Rule of law captures perceptions of the
                                                            extent to which agents have confidence in and abide
                                                                                                                      Equitable                                                   Infant Mortality

Peace Indicators                                            by the rules of society, and in particular the quality
                                                                                                                      Distribution of Resources                                   Definition: Infant mortality rate is the number of
                                                                                                                                                                                  infants dying before reaching one year of age, per
                                                            of contract enforcement, property rights, the police,     The Equitable Distribution of Resources in society
                                                                                                                                                                                  1,000 live births in a given year.
                                                            and the courts, as well as the likelihood of crime and    refers not just to income distribution but also to the
                                                                                                                                                                                  Source: World Bank, World Development Indicators.
                                                            violence.                                                 evenness of the broader development process, such as
                                                            Source: The total WGI compile and summarise               whether people have access to basic needs like water,
Well-functioning
                                                            information from 30 existing data sources that report     healthcare, transportation, education or access to just
Government                                                                                                            legal processes. Uneven distribution of resources can
                                                                                                                                                                                  Sound
                                                            the views and experiences of citizens, entrepreneurs,
Well-Functioning Government is dependent upon               and experts in the public, private and NGO sectors        generate fundamental inefficiencies within the system       Business Environment
levels of political participation, political culture,       from around the world, on the quality of various          as well as lead to alienation of groups and the depletion   The Sound Business Environment structure refers to
the separation of powers, the quality of democracy          aspects of governance. The rule of law sub-indicator      of human capital.                                           the strength of economic conditions as well as the
and public service delivery. It is dependent upon           uses approximately 76 data points from these sources.                                                                 formal institutions that support the operation of the
                                                                                                                      Inequality Adjusted Human
a multitude of formal and informal institutional                                                                                                                                  private sector. Strong private sector conditions are
                                                                                                                      Development Index (IHDI) - United
variables, such as:                                         Political Culture -                                                                                                   essential for employment and economic growth and
                                                                                                                      Nations Development Programme (UNDP)
                                                            Economist Intelligence Unit (EIU)
•	 The quality and quantity of public services                                                                                                                                    also ensure that there is a viable tax base upon which
                                                            Description: The EIU’s Democracy Index is based on                                                                    governments can fund other critical services which the
•	 The quality of the civil service and the degree of its                                                             Definition: The HDI covers three basic dimensions;
                                                            five categories: electoral process and pluralism; civil                                                               private sector cannot.
   independence from political pressures                                                                              health, education and income. It is possible in the
                                                            liberties; the functioning of government; political
•	 The quality of policy formulation and                                                                              standard HDI for two countries to achieve the same
                                                            participation; and political culture. IEP has used                                                                    Global Competitiveness
   implementation                                                                                                     score while very different results when measured by
                                                            the sub-index Political Culture in the PPI, as the                                                                    Report - World Economic Forum
                                                                                                                      the equitability of the distribution of the resources.
•	 The credibility of a government’s commitment to          other metrics in the Well-Functioning Government
                                                                                                                      In contrast to the HDI, the IHDI takes into account         Definition: The Global Competitiveness Report
   its policies.                                            PPI indicator cover the measurement of the formal
                                                                                                                      not only the average achievements of a country on           attempts to provide a holistic overview of factors
                                                            institutions of governance. Political Culture uses                                                                    that are critical to driving productivity and
Government Effectiveness                                                                                              health, education and income, but also how those
(sub-index) – World Bank,                                   survey data from World Values Survey and other                                                                        competitiveness. It is made up of over 110 variables,
                                                                                                                      achievements are distributed among its citizens.
World Governance Indicators (WGI)                           sources to determine the informal attitudes towards                                                                   of which two thirds come from the Executive
                                                                                                                      This means it measures inequality in the key human
Definition: Government effectiveness captures               democracy.                                                                                                            Opinion Survey, and one third comes from publicly
                                                                                                                      development variables. Note, several countries in the
perceptions of the quality of public services, the          Source: Composite index based on dichotomous and                                                                      available sources. The variables are organised into
                                                                                                                      PPI do not have a IHDI score. IEP has supplanted
quality of the civil service and the degree of its          three-point scoring10 qualitative scoring system by                                                                   twelve pillars, with each pillar representing an
                                                                                                                      missing values with the standard HDI score as these
independence from political pressures, the quality          country experts.                                                                                                      area considered as an important determinant of
                                                                                                                      tend to be close to IHDI scores. Those countries are:
of policy formulation and implementation, and the                                                                     Afghanistan, Algeria, Bahrain, Botswana, Equatorial         competitiveness.11
credibility of the government’s commitment to such                                                                    Guinea, Iran, Kuwait, Japan, Libya, Malaysia,               Source: Data is based on executive opinion surveys
policies.                                                                                                             Myanmar, New Zealand, Qatar, Papua New Guinea               (survey data) and publically available data from
Source: The full WGI data set compiles and                                                                            and Saudi Arabia.                                           various intergovernmental organisations.
summarises information from 30 existing data                                                                          Source: UNDP
sources. The data aims to report the views and
experiences of citizens, entrepreneurs, and experts                                                                   Life expectancy
in the public, private and NGO sectors from around                                                                    Definition: Life expectancy at birth indicates the
the world, on the quality of various aspects of                                                                       number of years a newborn infant would live if
governance. The government effectiveness sub-                                                                         prevailing patterns of mortality at the time of its birth
indicator uses approximately 41 data points from a                                                                    were to stay the same throughout its life.
mix of the above sources.                                                                                             Source: World Bank, World Development Indicators.

Rule of Law (sub index) – World
Bank, World Governance Indicators


74                                                                                                                                                                                                                                   75
Methodology                                                                                                                                                                                                          Methodology


Index of Economic                                        ranges from 0, no government respect for these seven     Intergroup Cohesion - Indices for Social                     Extent of Regional Integration -
Freedom - Business Freedom                               rights, to 14, full government respect for these seven   Development, International Institute of                      Economist Intelligence Unit (EIU)
sub-indicator, Heritage Foundation                       rights.                                                  Social Studies (ISS)                                         Definition: Extent of Regional Economic Integration.
Definition: This indicator is derived from the           Source: Constructed from the CIRI Human Rights           Definition: Intergroup cohesion refers to relations of       Source/Methodology: Qualitative Assessment on the
Heritage Foundation’s Index of Economic Freedom.         Dataset which takes its primary source of information    cooperation and respect between identity groups in a         level of membership of trade alliances by EIU country
Business Freedom is a sub indicator which measures       about human rights practices from the annual United      society. This is a composite index that measures ethnic      analysts on a one to five score.
an individual’s ability to start, operate, and close a   States Department of State’s Country Reports on          and sectarian tensions, and discrimination.                  5. Not a member of any regional trade grouping.
business.                                                Human Rights Practices. Coders for CIRI use this         Source: There are 43, mostly survey based, data
                                                                                                                                                                               4. Formally may be a member of regional trade
Source: The Index relies on the following sources        source for all variables. Coders also use a second       sources from Afrobarometer, Asian Barometer,
                                                                                                                                                                               grouping, but in practice intra-bloc trade remains
in determining business freedom scores, in order         source, Amnesty International’s Annual Report. Both      International Crime and Victim Survey,
                                                                                                                                                                               significantly restricted and any preferential access to
of priority: World Bank, Doing Business 2012;            reports can be found online for recent years. If there   Latinobarometer, World Development Indicators,
                                                                                                                                                                               major regional trade areas is limited.
Economist Intelligence Unit, Country Report and          are discrepancies between the two sources, coders        World Values Survey. Also includes data from Interpol
Country Commerce, 2008–2011; U.S. Department                                                                                                                                   3. The country is formally in a free trade area,
                                                         are instructed to treat the Amnesty International        and the WHO.14
of Commerce, Country Commercial Guide, 2008–                                                                                                                                   but there are a large number of sectoral and other
                                                         evaluation as authoritative.
2011; and official government publications of each                                                                                                                             restrictions. Or the country enjoys a very high level of
                                                                                                                  Good Relations                                               preferential access to a major regional trade area.
country.12                                               Gender Gap Index -
                                                         World Economic Forum
                                                                                                                  with Neighbours                                              2. The country is part of a free trade area, and there
GDP per Capita (PPP) - World                             Definition: The Gender Gap Index is designed to          This domain refers to both the relations between             are few sectoral restrictions. Or the country enjoys a
Bank, World Development Indicators                       measure gender-based gaps in access to resources         communities within a nation and to the relationships         very high level of preferential access to major regional
Definition: GDP per capita based on purchasing           and opportunities in individual countries rather         between neighbouring states. This is based on                trade area (i.e. NAFTA).
power parity (PPP). PPP GDP is gross domestic            than the actual levels of the available resources        the interdependent nature of the relationships                  1. The country belongs to an economic union. 		
product converted to international dollars using         and opportunities in those countries. The Index is       investigated, as countries with positive external             There is freedom of movement for goods, capital   	
purchasing power parity rates.                           constructed to rank countries on their gender gaps not   relations are more peaceful and also tend to be              fand people (i.e. the E.U.).
Source: World Bank, World Development Indicators         on overall development level.                            politically stable. This acknowledges the apparent
                                                         Source: The Global Gender Gap Index examines             close relationship between interpersonal and interstate
                                                         the gap between men and women in four categories:        violence.                                                    Free flow of
Acceptance of                                            economic participation and opportunity, educational
                                                                                                                                                                               information
                                                         attainment, health and survival and political            Interpersonal Safety and
the Rights of Others                                                                                              Trust - Indices for Social
                                                         empowerment. The data are from a variety of                                                                           Free Flow of Information captures how easily citizens
Acceptance of the Rights of Others is a category                                                                  Development, International
                                                         publically available sources such as the ILO,                                                                         can gain access to information, whether the media is
designed to include both the formal institutions                                                                  Institute of Social Studies (ISS)
                                                         UNESCO, WHO and World Economic Forum’s                                                                                free and independent, as well as the extent to which
that ensure basic rights and freedoms as well as the                                                              Definition: The focus of this composite index is on
                                                         Executive Opinion Survey.13                                                                                           citizens are informed and engaged in the political
informal social and cultural norms that relate to                                                                 perceptions and incidences of crime and personal
                                                                                                                                                                               process. In this sense, free flow of information is
the behaviours of citizens. These factors relate to                                                               transgressions. According to the Indices for Social
                                                                                                                                                                               an attempt to account for the degree of access to
tolerance between the different ethnic, linguistic,                                                               Development “interpersonal norms of trust and
                                                                                                                                                                               information as well as the independence of that
religious, and socio‑economic groups within a                                                                     security exist to the extent that individuals in a society
                                                                                                                                                                               information from vested political and economic
country.                                                                                                          feel they can rely on those whom they have not met
                                                                                                                                                                               interests.
                                                                                                                  before.”15
CIRI Empowerment Index -
CIRI Human Rights Dataset                                                                                         Source: There are 43, mostly survey based, data
                                                                                                                  sources from Afrobarometer, Asian Barometer,
Definition: Cingranelli-Richards (CIRI)
                                                                                                                  International Crime and Victim Survey,
Empowerment Index is an additive index constructed
                                                                                                                  Latinobarometer, World Development Indicators,
from the Foreign Movement, Domestic Movement,
                                                                                                                  World Values Survey. Also includes data from Interpol
Freedom of Speech, Freedom of Assembly &
                                                                                                                  and the WHO.15
Association, Workers’ Rights, Electoral Self-
Determination, and Freedom of Religion indicators. It


76                                                                                                                                                                                                                                   77
Methodology                                                                                                                                                                     Methodology


Press Freedom                                              High levels                                                Low levels
Index - Freedom House
                                                           of education                                               of corruption
Definition: The Freedom of the Press Index is an
annual survey of media independence in 197 countries       Effective educational institutions play an important       Two indices focusing on corruption, Transparency
and territories. The Index assesses the degree of print,   structural role in the most peaceful countries. A          International’s Corruption Perceptions Index (CPI)
broadcast, and internet freedom in every country in        broad education base creates a larger pool of human        and the World Bank’s World Governance Indicators
the world, analysing the events of each calendar year.16   capital which improves economic productivity, enables      Control of Corruption measure were chosen as the
Source: 23 methodology questions divided into three        political participation and increases social capital.      pre-eminent global measures of corruption.
subcategories; the legal environment, the political        The PPI indicators in this domain capture basic
                                                           outcomes in education.                                     Control of Corruption - World
environment, and the economic environment.17
                                                                                                                      Bank, World Governance Indicators
World Press Freedom Index - Reporters                      Mean Years of Schooling - UNESCO                           Definition: A sub-index of the World Governance
Without Borders (RWB)                                      Institute for Statistics                                   Indicators. Captures perceptions of the extent to
Definition: The Reporters Without Borders Index            Definition: Average number of years of education           which public power is exercised for private gain,
measures the state of press freedom in the world. It       received by people ages 25 and older, converted from       including both petty and grand forms of corruption,
reflects the degree of freedom of journalists and news     education attainment levels using official durations of    as well as “capture” of the state by elites and private
organisations and the efforts made by the authorities      each level.                                                interests.
to respect and ensure respect for this freedom.            Sources: UNESCO Institute for Statistics data on           Source: Based on 31 sources of expert and survey
Source: The data informing the RWB report is based         education attainment.                                      data. 20
on a questionnaire sent to partner organisations of
                                                           Secondary School                                           Corruptions Perception Index -
RWB and its 130 correspondents around the world, as
                                                           Enrolment (% net) - World                                  Transparency International
well as to journalists, researchers, jurists and human
                                                           Bank, World Development Indicators                         Definition: The CPI ranks countries according to
rights activists.18
                                                           Definition: Net enrolment ratio is the ratio of children   their perceived levels of public-sector corruption.
Internet Usage -                                           of official school age based on the International          Source: The data sources for the Transparency
International Telecommunications                           Standard Classification of Education 1997 who              International CPI vary each year but draw upon
Union (ITU) and United Nations                             are enrolled in school to the population of the            different assessments and business opinion surveys
Definition: Internet users are people with access to the   corresponding official school age.                         carried out by independent institutions. The surveys
worldwide network. Internet Users data is recorded         Source: World Bank, World Development Indicators.          and assessments used to compile the index include
per 100 of population.                                                                                                questions relating to the bribery of public officials,
Source: Data is from the ITU, World                                                                                   kickbacks in public procurement, embezzlement of
Telecommunication/ICT Development Report and                                                                          public funds, and questions that probe the strength
database. Over 500 in-country and survey data                                                                         and effectiveness of public-sector anti-corruption
sources are used.19 Data is updated annually.                                                                         efforts.


78                                                                                                                                                                                      79
results


     most positive peace


     least positive peace


      no data


     Rank       Country            Score                                                             Rank   Country        Score
          1     Sweden             1.170   22   Slovenia         1.839   43   Botswana       2.561     63   Saudi Arabia   2.924    84   Bolivia        3.208   105   Pakistan        3.808
          2     Norway             1.174   23   Czech Republic   1.913   44   Jamaica        2.585     64   Guyana         2.939    85   Honduras       3.210   106   Nigeria         3.845
          2     Finland            1.240   24   Portugal         1.931   45   Trinidad and             65   Mongolia       2.942    85   Guatemala      3.223   107   Cote d’Ivoire   3.881
          4                                25                                 Tobago         2.589     66                           87                          108
                Denmark            1.267        Cyprus           2.003                                      Thailand       2.982         India          3.297         Zimbabwe        4.016
          5                                26                            46   Bahrain        2.592     66                           88
                Iceland            1.328        South Korea      2.009                                      Jordan         2.997         Senegal        3.338
          6                                27                            47   Malaysia       2.595     68                           89
                Netherlands        1.381        Chile            2.058                                      Moldova        2.998         Venezuela      3.346
          6                                28                            48   Argentina      2.630     69                           90
                Switzerland        1.382        Hungary          2.088                                      Ukraine        3.001         Malawi         3.374
          8                                29                            49   Macedonia      2.677     70                           91
                Canada             1.383        Lithuania        2.139                                      Kazakhstan     3.019         Tanzania       3.385
          9                                30                            50   Albania        2.684     71                           92
                New Zealand        1.412        Slovakia         2.141                                      Ghana          3.021         Zambia         3.395
         10                                31                            51   South Africa   2.698     72                           93
                Ireland            1.472        Italy            2.157                                      Armenia        3.027         Syria          3.400
         11                                32                            52   Panama         2.700     73                           94
                Germany            1.491        Qatar            2.181                                      Nicaragua      3.102         Madagascar     3.400
         12                                33                            53   Namibia        2.783     74                           95
                Australia          1.507        Poland           2.185                                      Morocco        3.104         Iran           3.427
         13                                34                            54   Brazil         2.784     75                           95
                Belgium            1.520        Latvia           2.187                                      Azerbaijan     3.108         Kenya          3.459
         14                                35                            55   Mexico         2.785     76                           97
                United Kingdom     1.521        Uruguay          2.200                                      Egypt          3.112         Mozambique     3.485
         15                                36                            56   Georgia        2.828     77                           98
                Austria            1.522        Greece           2.216                                      Ecuador        3.114         Mali           3.495
         16                                37                            56   Peru           2.829     78                           99
                United States of                United Arab                                                 China          3.114         Bangladesh     3.526
                America            1.545        Emirates         2.242   58   El Salvador    2.858     79                           99
                                                                                                            Philippines    3.117         Cambodia       3.528
         17     Japan              1.634   38   Costa Rica       2.296   59   Dominican                80                          101
                                                                                                            Paraguay       3.118         Uganda         3.542
         18                                39                                 Republic       2.885
                France             1.707        Israel           2.353                                 81                          102
                                                                                                            Russia         3.128         Burkina Faso   3.589
         19                                40                            60   Colombia       2.889
                Singapore          1.747        Croatia          2.421                                 81                          103
                                                                                                            Sri Lanka      3.147         Cameroon       3.760
         20                                41                            61   Turkey         2.910
                Spain              1.829        Bulgaria         2.516                                 83                          104
                                                                                                            Indonesia      3.150         Ethiopia       3.761
         21                                42                            62   Tunisia        2.915
                Estonia            1.838        Kuwait           2.547


80                                                                                                                                                                                            81
results                                                                                                                                                                                                                                                         results


                                                               table 3.2: bottom Ten Positive Peace Countries                   CHART 3.1: positive Peace Averages by Region
Due to the small difference in scores between some
                                                               The bottom ten positive peace countries are a mix of low and
nations the results are best understood in groups of
                                                                                                                                                     4.0


                                                                                                                               LESS POSITIVE PEACE
                                                               lower middle income countries and authoritarian and hybrid
ten, as in the top ten, 11 to 20 and so on.                    government regimes.
Key observations from the results are:                                                                                                               3.5
                                                                PPI                           PPI          2011 GPI     GPI
•	 The top five nations are all Nordic nations which            Rank        Country           Score        Score        Rank
   all score highly in the GPI.                                                                                                                      3.0
                                                                99           Bangladesh        3.526       2.070        70
•	 There are only two countries that are not high                                                                                                    2.5
                                                                100          Cambodia          3.528       2.301        86
   income in the top 30, Chile and Lithuania. Both are
                                                                101          Uganda            3.542       2.159        77
   upper middle income nations.                                                                                                                      2.0
                                                                102          Burkina Faso      3.589       1.832        45
•	 The bottom ten nations are dominated by seven
                                                                103          Cameroon          3.760       2.104        72                           1.5


                                                                                                                               MORE POSITIVE PEACE
   Sub-Saharan African nations. The remaining three
   are from the Asia Pacific region.                            104          Ethiopia          3.761       2.468        99
                                                                105          Pakistan          3.808       2.905        107
                                                                                                                                                     1.0
•	 North America and Western Europe are the most
   positively peaceful regions on average.                      106          Nigeria           3.845       2.743        105
                                                                                                                                                     0.5
                                                                107          Cote d'Ivoire     3.881       2.417        98
•	 Sub-Saharan Africa is the least positively peaceful
   region on average.                                           108          Zimbabwe          4.016       2.722        104                          0.0
                                                                                                                                                               North         Western        Central and      Asia Pacific       Latin      Middle East and    Sub-Saharan
•	 Positive peace is close to equal in Central and                                                                                                            America        Europe        Eastern Europe                      America      North Africa         Africa
   Eastern Europe, Asia Pacific, Latin America and the
   Middle East and North Africa.
•	 Singapore is the only hybrid regime in the top 20.
•	 France is the only flawed democracy in the top 20.                                                                           chart 3.2: the world average for each pillar of peace in the ppi
                                                                                                                                                                                                                                                Bottom Ten Average
                                                                                                                                The bottom ten nations lag most on the equitable distribution of
                                                                                                                                resources and levels of education compared to the world average, while                                              World Average
                                                                                                                                the top ten nations are well ahead of the world average on levels of                                               Top Ten Average
                                                                                                                                corruption and well-functioning government.
TABLE 3.1: Top Ten Positive Peace Countries
All of the top positive peace nations are in the high


                                                                                                                               LESS POSITIVE PEACE
                                                                                                                                                     5.0
income category and are full democracies.
                                                                                                                                                     4.5
 PPI                           PPI           2011 GPI   GPI
                                                                                                                                                     4.0
 Rank        Country           Score         Score      Rank
                                                                                                                                                     3.5
 1            Sweden            1.170        1.401      13
 2            Norway            1.174        1.356      9                                                                                            3.0

 3            Finland           1.240        1.352      7                                                                                            2.5
 4            Denmark           1.267        1.289      4
                                                                                                                                                     2.0
                                                                                                                               MORE POSITIVE PEACE

 5            Iceland           1.328        1.148      1
                                                                                                                                                     1.5
 6            Netherlands       1.381        1.628      25
 7            Switzerland       1.382        1.421      16                                                                                           1.0

 8            Canada            1.383        1.355      8                                                                                            0.5
 9            New Zealand       1.412        1.279      2
                                                                                                                                                     0.0
 10           Ireland           1.472        1.370      11                                                                                                    Well          Sound        Equitable     Acceptance      Good           Free           High           Low
                                                                                                                                                           Functioning     Business    Distribution   of the Rights  Relations      Flow of       Levels of      Levels of
                                                                                                                                                           Government    Environment   of Resources     of Others with Neighbours Information     Education     Corruption
                                                                                                                                                              (2010)        (2010)         (2010)         (2010)       (2010)        (2010)         (2010)         (2010)


82                                                                                                                                                                                                                                                                    83
results                                                                                                                                                                                                                                                         results


table 3.3: pillarS of peace scores by country
                                                                                                                                                                                                                    Good
Country scores on the PPI on each pillar of peace. A darker blue
                                                                                                                                                         Well-         Sound         Equitable      Acceptance      Relations                   High        Low
represents a score in a lower quintile.
                                                                                                                                                         Functioning   Business      Distribution   of the Rights   with         Free Flow of   Levels of   Levels of
                                                                                                                                        Country          Government    Environment   of Resources   of Others       Neighbours   Information    Education   Corruption
                                                                                   Good
                                                                                                                                        by Rank          (2010)        (2010)        (2010)         (2010)          (2010)       (2010)         (2010)      (2010)
                 Well-          Sound            Equitable         Acceptance      Relations                   High        Low
                 Functioning    Business         Distribution      of the Rights   with         Free Flow of   Levels of   Levels of
                                                                                                                                        Latvia           2.32          3.15          1.74           2.03            1.75         1.54           1.44        3.25
 Country         Government     Environment      of Resources      of Others       Neighbours   Information    Education   Corruption
                                                                                                                                        Uruguay          2.06          3.31          1.71           1.88            2.87         1.77           2.00        2.23
 by Rank         (2010)         (2010)           (2010)            (2010)          (2010)       (2010)         (2010)      (2010)
                                                                                                                                        Greece           2.19          2.73          1.31           2.44            1.65         2.09           1.38        3.50
 Sweden          1.06            1.60             1.17             1.26            1.29         1.00           1.18        1.13
                                                                                                                                        United Arab      2.46          1.83          1.38           3.13            2.00         2.41           1.70        2.39
 Norway          1.15            1.47             1.10             1.26            1.17         1.00           1.01        1.42         Emirates
 Finland         1.00            1.69             1.26             1.30            1.28         1.00           1.41        1.21         Costa Rica       2.30          3.35          1.71           2.06            2.33         1.84           1.83        2.82
 Denmark         1.02            1.59             1.29             1.65            1.23         1.04           1.41        1.02         Israel           1.85          2.58          1.27           3.64            3.27         1.74           1.35        2.62
 Iceland         1.25            1.93             1.18             1.18            1.77         1.00           1.39        1.35         Honduras         3.42          3.65          2.29           2.67            2.85         3.54           2.84        4.25
 Netherlands     1.28            1.79             1.21             1.82            1.43         1.06           1.26        1.27         Guatemala        3.47          3.75          2.49           2.84            2.87         3.08           3.41        3.88
 Switzerland     1.12            1.67             1.17             1.70            1.70         1.05           1.50        1.28         India            2.87          3.89          2.92           3.40            3.07         3.03           3.30        3.80
 Canada          1.17            1.61             1.23             1.56            1.82         1.23           1.20        1.35         Senegal          3.01          3.73          3.39           2.85            2.73         3.24           4.10        3.97
 New Zealand     1.22            2.00             1.09             1.55            2.53         1.07           1.03        1.01         Venezuela        3.72          3.83          1.99           2.99            3.55         3.30           2.51        4.55
 Ireland         1.42            1.85             1.26             1.45            1.61         1.34           1.18        1.67         Malawi           2.93          4.22          3.72           2.41            3.28         3.22           3.98        3.82
 Germany         1.39            1.76             1.25             1.97            1.43         1.15           1.08        1.69         Tanzania         3.06          4.12          3.43           2.80            2.98         3.08           3.88        4.01
 Australia       1.20            1.80             1.11             1.78            2.61         1.27           1.11        1.36         Zambia           3.04          3.82          4.01           2.77            3.27         3.34           3.17        3.97
 Belgium         1.55            1.84             1.28             1.63            1.29         1.11           1.36        2.04         Syria            3.08          3.74          2.05           3.68            2.61         4.29           2.89        4.30
 United          1.37            1.76             1.32             1.72            1.53         1.21           1.58        1.85         Madagascar       3.21          3.78          2.96           2.84            3.55         3.53           3.78        3.81
 Kingdom
                                                                                                                                        Iran             3.69          3.22          1.84           3.83            3.46         3.97           2.31        4.36
 Austria         1.29            2.07             1.28             1.77            1.38         1.26           1.50        1.68
                                                                                                                                        Kenya            3.24          3.78          3.46           3.24            3.47         3.13           2.87        4.41
 United States   1.46            1.38             1.35             1.77            2.01         1.23           1.17        2.08
                                                                                                                                        Mozambique       3.04          4.09          4.31           2.25            3.30         3.11           4.64        4.02
 of America
                                                                                                                                        Mali             3.15          4.26          4.51           3.00            2.51         2.63           4.29        4.08
 Japan           1.65            1.91             1.04             1.88            2.31         1.22           1.21        1.95
                                                                                                                                        Bangladesh       3.45          3.91          2.75           3.35            3.05         3.56           3.62        4.34
 France          1.55            2.00             1.24             2.15            1.56         1.54           1.39        2.10
                                                                                                                                        Cambodia         3.43          4.23          2.96           2.84            3.18         3.63           3.48        4.54
 Singapore       1.27            1.18             1.13             2.65            2.30         2.54           1.66        1.13
                                                                                                                                        Uganda           2.97          3.96          3.71           3.34            3.08         3.17           3.95        4.26
 Spain           1.82            2.49             1.25             1.80            1.54         1.66           1.40        2.48
                                                                                                                                        Burkina Faso     3.29          4.05          4.35           2.70            3.82         2.97           4.71        3.75
 Estonia         1.77            2.67             1.57             2.08            1.68         1.20           1.13        2.39
                                                                                                                                        Cameroon         3.42          4.27          4.03           3.44            3.47         3.69           3.44        4.35
 Slovenia        1.99            2.44             1.34             1.77            1.35         1.65           1.70        2.35
                                                                                                                                        Ethiopia         3.11          3.87          3.70           3.64            3.53         3.99           4.35        4.14
 Czech           1.78            2.74             1.38             2.02            1.50         1.45           1.17        3.07
                                                                                                                                        Pakistan         3.42          3.67          3.13           4.48            3.78         3.65           3.80        4.38
 Republic
                                                                                                                                        Nigeria          3.88          3.94          4.16           4.05            3.14         3.19           3.84        4.31
 Portugal        1.79            2.65             1.47             1.84            1.56         1.78           1.80        2.53
                                                                                                                                        Cote d’ Ivoire   3.48          4.21          3.90           3.96            3.40         3.57           4.22        4.46
 Cyprus          1.96            2.46             1.43             2.21            1.93         1.96           1.52        2.36
                                                                                                                                        Zimbabwe         3.88          4.75          4.06           3.66            3.83         3.77           3.22        4.60
 South Korea     1.83            2.07             1.37             2.40            2.32         1.47           1.83        2.89

 Chile           1.91            2.98             1.61             1.92            2.43         1.85           1.72        2.17         World
                                                                                                                                                         2.59          3.07          2.11           2.57            2.52         2.50           2.19        3.28
                                                                                                                                        Average
 Hungary         2.11            2.91             1.60             2.30            1.58         1.59           1.23        3.01

 Lithuania       2.22            2.84             1.71             2.21            1.82         1.53           1.33        3.18

 Slovakia        2.40            2.90             1.53             2.32            1.61         1.44           1.36        3.22

 Italy           2.20            2.60             1.29             2.22            1.72         2.05           1.51        3.41

 Qatar           2.17            1.71             1.36             3.30            1.75         2.56           2.25        1.95

 Poland          2.55            3.10             1.58             2.04            1.71         1.68           1.48        3.04


84                                                                                                                                                                                                                                                                      85
results


                                                                                                                   Positive
                                                                                                                   Peace Gap

Table 3.3 shows the Positive Peace Index scores              Regional Integration are both very low.               The positive peace gap is the difference between a                             be fragile due to weaker than expected institutional
for each pillar of peace or domain of the PPI. This       •	 Conversely South Africa and Georgia are examples      nation’s GPI score and PPI score. 22 The closer a nation                       capacity.
shows the relative strengths and weaknesses of each          of two middle ranked countries (51 and 56             is to the red line in figure 3.3, the closer the alignment                         Conceptually, the nations in the lower third
country’s positive peace. As would be expected,              respectively) which score in the top quintile for     between the PPI and GPI scores.                                                (bottom right of figure one) have a relatively high
the top ten and bottom ten countries tend to score           High Levels of Education. These are outlying              The divergence from the line is referred to as the                         level of violence but a comparatively high level
either consistently well or badly on each of the eight       scores in otherwise struggling positive peace         ‘Peace Gap’. A surplus means that the institutions,                            of institutional capacity to deal with shocks and
factors. However, in the middle of the PPI some more         environments. South Africa scores notably poorly      structures and attitudes of the country can support a                          potential to become a more peaceful society. Three
interesting facts emerge where some states score in the      on the Equitable Distribution of Resources.           higher level of peace than is being experienced, while                         notable examples are Bahrain, Israel, and the United
top quintile for some factors and in the bottom for                                                                the inverse, a deficit, signifies that the country may                         States which have the largest positive peace surpluses.
                                                          •	 Saudi Arabia has a diverse positive peace profile,
others.                                                      scoring relatively well on Sound Business
                                                             Environment and Equitable Distribution of
     Some notable facts to be drawn from this include:       Resources but very poorly on Acceptance of the
                                                                                                                   CHART3.3: Positive Peace Gap - the GPI score compared
                                                                                                                   to the PPI score.
•	 New Zealand is the only country in the top ten            Rights of Others and Free Flow of Information.
   with a score below the world average for one
   pillar of peace. This is in the Good Relations with                                                                                        120
   Neighbours, in which there is a clear imbalance.                                                                                                     Positive
                                                                                                                                                        Peace Deficit
•	 Australia also notably lags on the Good Relations
   with Neighbors score, due to a poor score on the
   extent of regional integration and interpersonal                                                                                           100
   safety and trust measure.
•	 Out the top 20 nations Singapore is the only
   country which scores relatively poorly on three
   domains of the PPI. Compared to other nations in                                                                                            80
   the top 20 it is lagging on the Acceptance of the


                                                                                                                  POSITIVE PEACE INDEX RANK
   Rights of Others, Good Relations with Neighbours,
   and the Free Flow of Information.
•	 The Czech Republic is comparatively lagging on the                                                                                          60
   Levels of Corruption.
•	 Qatar has a large imbalance in its positive peace
                                                                                                                                                                                                         BAHRAIN
   score, scoring well below the world average on the
   Acceptance of the Rights of Others. It scores poorly                                                                                        40                                                                  ISRAEL
   on all three factors of the CIRI Empowerment
   measure, the Gender Gap Index and levels of
   Intergroup Cohesion as measured by the ISS. The
   United Arab Emirates also has a similar score on
                                                                                                                                               20
   the same factor.                                                                                                                                                                    USA                  Positive
                                                                                                                                                                                                            Peace surplus
•	 Israel scores well in all factors except for the
   Acceptance of the Rights of Others and Good
   Relations with Neighbours domains.
                                                                                                                                                0
•	 Jamaica has one of the most extreme imbalances in                                                                                                0         20        40    60             80             100             120
   its positive peace profile. A middle ranked nation                                                                                                                        2011 GLOBAL PEACE INDEX RANK
   (44) on the PPI, its score on Good Relations with
   Neighbours is close to the bottom of the PPI.
   Interpersonal Safety and Trust and the Extent of


86                                                                                                                                                                                                                                                    87
Positive                                                                                                                                                                                                                                                      Positive
 Peace Gap                                                                                                                                                                                                                                                   Peace Gap


                                                                                                                                            “The top ten positive peace deficit countries are
                                                                                                                                            mostly in Sub-Saharan Africa...These nations
                                                                                                                                            are relatively peaceful but lack the institutions to
                                                                                                                                            adequately deal with external shocks.”

 CHART 3.4: Positive Peace RANK CORRELATION TO INTERNAL GPI SCORE.                                                                          TABLE 3.4: Top 10 Positive Peace Deficit Countries
 The positive peace score is highly correlated with the internal peace score
 (0.84).                                                                                                                                     Positive
                                                                                                                                             Peace Deficit      Country          GPI Rank    PPI Rank   Region                  Income Group          Government Type
                             4.5
                                                                                                                                                    -57          Burkina Faso    45              102    Sub-Saharan Africa      Low income            Authoritarian regime
                                                                                                                                                    -55          Malawi          35              90     Sub-Saharan Africa      Low income            Hybrid regime
                                                                                                                                                    -55          Mozambique      42              97     Sub-Saharan Africa      Low income            Hybrid regime
                             4.0
                                                                                                                                                    -46          Zambia          46              92     Sub-Saharan Africa      Low income            Hybrid regime
                                                                                                                                                    -41          Tanzania        50              91     Sub-Saharan Africa      Low income            Hybrid regime
                                                                                                                                                    -35          Ghana           36              71     Sub-Saharan Africa      Low income            Flawed democracy
                             3.5
                                                                                                                                                    -31          Cameroon        72              103    Sub-Saharan Africa      Lower middle income   Authoritarian regime
                                                                                                                                                    -29          Bangladesh      70              99     Asia Pacific            Low income            Hybrid regime
POSITIVE PEACE INDEX SCORE


                                                                                                                                                    -28          Malaysia        19              47     Asia Pacific            Upper middle income   Flawed democracy
                             3.0                                                                                                                    -25          Indonesia       58              83     Asia Pacific            Lower middle income   Flawed democracy


                                                                                                                                            “The positive peace surplus countries are more
                                                                                                                                            diverse both geographically and in terms of their
                             2.5
                                                                                                                                            type of government. Many of the countries are in
                                                                                                                                            high income or upper middle income groups. These
                                                                                                                                            countries have greater institutional capacity to
                             2.0                                                                                                            deal with external shocks and reduce their level of
                                                                                                                                            violence.”

                                                                                                                                            table 3.5: Top 10 Positive Peace Surplus Countries

                             1.5
                                                                                                                                             Positive Peace
                                                                                                                                             Surplus            Country          GPI Rank    PPI Rank   Region                  Income Group          Government Type

                                                                                                                                                    67           Israel          106             39     Middle East and North   High income           Flawed democracy
                             1.0
                                                                                                                                                                                                        Africa
                                   1.0   1.5   2.0    2.5             3.0      3.5          4.0          4.5
                                                                                                                                                                 United States                          North America           High income           Full democracy
                                                     INTERNAL PEACE 2011                                                                            53           of America      69              16
                                                                                                                                                    47           Bahrain         93              46     Middle East and North   High income           Authoritarian regime
 As shown in table 3.4, the top ten positive peace                                                                                                                                                      Africa
                                                                               higher positive peace they are unlikely to see declines
 deficit countries are mostly in Sub-Saharan Africa                            in violence, while also remaining vulnerable to
                                                                                                                                                    44           Georgia         100             56     Central and Eastern     Lower middle income   Hybrid regime
                                                                                                                                                                                                        Europe
 with three Asia Pacific countries, Bangladesh,                                external shock or violence.
 Indonesia, and Malaysia making up the ten. This                                                                                                    43           Colombia        103             60     Latin America           Upper middle income   Flawed democracy
                                                                                   The stand-out example of the relationship between
 highlights a common trend in these nations where                              negative and positive peace is Tunisia which was the
                                                                                                                                                    38           Jamaica         82              44     Latin America           Upper middle income   Flawed democracy
 they are relatively peaceful but theoretically lack the                       eleventh-ranked positive peace deficit country on 2010               38           South Africa    89              51     Sub-Saharan Africa      Upper middle income   Flawed democracy
 institutions to adequately deal with external shocks or                       data. It has since seen a significant increase in violence           36           Mexico          91              55     Latin America           Upper middle income   Flawed democracy
 move closer to peace. This suggests that while these                          with the outbreak of the Arab Spring in late 2010. In                36           Turkey          97              61     Central and Eastern     Upper middle income   Hybrid regime
 countries have relatively moderate levels of violence,                        the 2012 GPI, Tunisia’s outright GPI rank has fallen                                                                     Europe
 they comparatively lack positive peace. Without                               to 72nd.                                                             35           Cyprus          60              25     Western Europe          High income           Flawed democracy


88                                                                                                                                                                                                                                                                       89
Positive Peace
                                                                                                                                                                                                                                                                        deficit CASE STUDY


      Positive Peace
      deficit CASE STUDY

      Three countries which have fallen significantly on                         The closer these two lines, the closer the positive                         Chart 3.6. Egypt Positive Peace Scores compared to the
                                                                                                                                                             Global Average
      the GPI in recent years are Egypt, Madagascar, and                         peace gap will be. It is assumed the 2010 positive
                                                                                                                                                             Egypt lags in Acceptance of the Rights of Others, Levels of
      Syria, which have all seen serious increases in the level                  peace data is fairly representative of the previous years                   Corruption and Free Flow of Information compared to the global
      of violence over the four years since 2008. As can be                      as these institutions are thought to change slowly over                     average.
                                                                                                                                                                                                                                                                                      egypt
      seen in chart 3.5, the six year trend in the GPI score                     time.
                                                                                                                                                                                                                                                                           global average
      is plotted against the 2010 Positive Peace Index score                         This shows that the levels of violence are ‘catching                    3.25
      adjusted and held constant for the six year period.                        up’ with the lower levels of positive peace. In 2008
      This allows one to compare the level of violence or                        these countries were amongst the highest positive
                                                                                                                                                             2.75
      negative peace to the level of positive peace.                             peace deficits countries in the world. This would
          What is clear is the solid lines, indicating negative                  indicate that the set of attitudes, structures, and
                                                                                                                                                             2.25
      peace, have been converging or overlapping with the                        institutions that are in place are not adequate to
      dotted lines which show the level of positive peace.                       maintain the current level of peace.
                                                                                                                                                             1.75


3.0   CHART 3.5. Three Positive Peace deficit countries to                         3.0
                                                                                                 Syria Positive Peace Average                                1.25
2.7   have fallen dramatically in the GPI                                          2.7
                                                                                                 Syria
2.5   Madagascar would have had the highest positive peace deficit                 2.5
      in the world in 2007.                                                                      Madagascar Positive Peace Average                           0.75
2.3                                                                                2.3                                                                                 Well       Sound          Equitable      Acceptance       Good         Free        High         Low
                                                                                                 Madagascar
2.1                                                                                2.1                                                                              Functioning  Business       Distribution   of the Rights Relations with Flow of    Levels of     Levels of
                                                                                                 Egypt Positive Peace Average                                       Government Environment      of Resources     of Others    Neighbours Information   Education    Corruption
1.9                                                                                1.9                                                                                 (2010)     (2010)            (2010)         (2010)         (2010)     (2010)      (2010)       (2010)
                                                                                                 Egypt
1.7                                                                                1.7

1.5                                                                                1.5
      3.0 2007          2008         2009          2010          2011     2012                                       3.0
                                                                                                                                        Syria Positive Peace Average
                                                                                                                                                          chart 3.7 Madagascar Positive Peace Scores compared to
      2.7                                                                                                            2.7
                                                                                                                                        Syria                the Global Average
      2.5                                                                                                            2.5                                   Madagascar lags in all of the positive peace indicators, but
                                                                                                                                        Madagascar    Positive Peace Average Flow of Information and Relations
                                                                                                                                                           mostly in Education, Free
      2.3                                                                                                            2.3                                   with Neighbours.
                                                                                                                                                           3.25
                                                                                                                                        Madagascar                                                                                                                               Madagascar
      2.1                                                                                                            2.1                                                                                                                                                   global average
                                                                                                                                        Egypt Positive Peace Average
                                                                                                                                                          2.75
      1.9                                                                                                            1.9
                                                                                                                                        Egypt
      1.7                                                                                                            1.7
                                                                                                                                                             2.25
      1.5                                                                                                            1.5
                 2007               2008                  2009          2010             2011            2012
                                                                                                                                                             1.75


                                                                                                                                                             1.25


                                                                                                                                                             0.75
                                                                                                                                                                       Well       Sound      Equitable      Acceptance       Good         Free            High          Low
                                                                                                                                                                    Functioning  Business  Distribution of of the Rights Relations with Flow of         Levels of    Levels of
                                                                                                                                                                    Government Environment   Resources       of Others    Neighbours Information       Education    Corruption
                                                                                                                                                                       (2010)     (2010)        (2010)         (2010)         (2010)     (2010)          (2010)        (2010)


      90                                                                                                                                                                                                                                                                                      91
Positive Peace
deficit CASE STUDY


                                                                                                                                   Positive Peace
                                                                                                                                   by region

Figure 3.8: Syria Positive Peace Scores compared to the                                                                            CHART 3.9. PPI compared to GPI by region.
Global Average                                                                                                                     The positive peace gap widens for countries outside
Syria lags in Levels of Corruption, Free Flow of Information                                                                       of the top 40 of the GPI and PPI
and Acceptance of the Rights of Others.                                                                                   syria
                                                                                                                                                              120                                                                                                             western europe
                                                                                                                 global average
3.25
                                                                                                                                                                                                                                                                                   asia pacific

                                                                                                                                                                                                                                                                                  central and
                                                                                                                                                              100
2.75                                                                                                                                                                                                                                                                           eastern europe
                                                                                                                                                                                                                                                                                latin america


                                                                                                                                  POSITIVE PEACE INDEX RANK
2.25                                                                                                                                                          80                                                                                                        middle east and north
                                                                                                                                                                                                                                                                                        africa
                                                                                                                                                                                                                                                                          sub-saharan africa
1.75
                                                                                                                                                              60                                                                                                               north america


1.25

                                                                                                                                                              40
0.75
           Well         Sound        Equitable    Acceptance       Good       Free Flow of      High     Low Levels of
       Functioning     Business     Distribution of the Rights Relations with Information    Levels of    Corruption
       Government    Environment    of Resources   of Others    Neighbours       (2010)      Education      (2010)                                            20
          (2010)        (2010)          (2010)       (2010)        (2010)                      (2010)


                                                                                                                                                               0
                                                                                                                                                                    0              20          40             60              80              100           120
                                                                                                                                                                                                    GLOBAL PEACE INDEX RANK

                                                                                                                                   CHART 3.10: Total Positive Peace Gap by Region
                                                                                                                                   The majority of the world’s positive peace deficit is
                                                                                                                                   in Sub-Saharan Africa.


                                                                                                                                                                               Asia pacific

                                                                                                                                               Central and Eastern Europe

                                                                                                                                                                             Latin America

                                                                                                                                   Middle East and North Africa

                                                                                                                                                                            North America

                                                                                                                                                                        Sub-Saharan Africa

                                                                                                                                                                          Western Europe

                                                                                                                                                                                        -500         -400          -300            -200             -100            0             100             200


                                                                                                                                   Chart 3.10 shows the majority of the world’s positive                                                  peace deficit on average is the Asia Pacific region
                                                                                                                                   peace deficit is in Sub-Saharan Africa, indicating                                                     which has large positive peace deficit countries in
                                                                                                                                   institutional capacity to move countries further away                                                  Bangladesh, Indonesia, and Malaysia.
                                                                                                                                   from conflict and vulnerability to conflict remains
                                                                                                                                   lowest there. The only other region with a positive


92                                                                                                                                                                                                                                                                                                93
Positive Peace                                                                                                                                                                                                             Positive Peace
by region                                                                                                                                                                                                                      by region


western                                                                                                           Central and
europe                                                                                                            Eastern Europe


                                                                                                                  table 3.7: Central and Eastern Europe PPI rankings
table 3.6. Western Europe PPI rankings


 Country           Regional Rank         2011 GPI Rank   PPI Rank   PPI Score   Income Group   Government Type     Country          Regional Rank     2011 GPI Rank    PPI Rank   PPI Score   Income Group          Government Type

 Sweden             1                    13              1          1.170       High Income    Full democracy      Estonia          1                 41               21         1.838       High income           Flawed democracy

 Norway             2                    9               2          1.174       High Income    Full democracy      Slovenia         2                 10               22         1.839       High income           Flawed democracy

 Finland            3                    7               3          1.240       High Income    Full democracy      Czech Republic   3                 5                23         1.913       High income           Full democracy

 Denmark            4                    4               4          1.267       High Income    Full democracy      Hungary          4                 20               28         2.088       High income           Flawed democracy

 Iceland            5                    1               5          1.328       High Income    Full democracy      Lithuania        5                 37               29         2.139       Upper middle income   Flawed democracy

 Netherlands        6                    25              6          1.381       High Income    Full democracy      Slovakia         6                 23               30         2.141       High income           Flawed democracy

 Switzerland        7                    16              7          1.382       High Income    Full democracy      Poland           7                 22               33         2.185       High income           Flawed democracy

 Ireland            8                    11              10         1.472       High Income    Full democracy      Latvia           8                 40               34         2.187       High income           Flawed democracy

 Germany            9                    15              11         1.491       High Income    Full democracy      Croatia          9                 33               40         2.421       High income           Flawed democracy

 Belgium            10                   14              13         1.520       High Income    Full democracy      Bulgaria         10                47               41         2.516       Upper middle income   Flawed democracy

 United Kingdom     11                   26              14         1.521       High Income    Full democracy      Macedonia        11                66               49         2.677       Upper middle income   Flawed democracy

 Austria            12                   6               15         1.522       High Income    Full democracy      Albania          12                54               50         2.684       Upper middle income   Hybrid regime

 France             13                   32              18         1.707       High Income    Flawed democracy    Georgia          13                100              56         2.828       Lower middle income   Hybrid regime

 Spain              14                   27              20         1.829       High Income    Full democracy      Turkey           14                97               61         2.910       Upper middle income   Hybrid regime

 Portugal           15                   17              24         1.931       High Income    Full democracy      Mongolia         15                51               65         2.942       Upper middle income   Flawed democracy

 Cyprus             16                   60              25         2.003       High Income    Flawed democracy    Moldova          16                53               68         2.998       Lower middle income   Flawed democracy

 Italy              17                   39              31         2.157       High Income    Flawed democracy    Ukraine          17                59               69         3.001       Lower middle income   Flawed democracy

 Greece             18                   56              36         2.216       High Income    Flawed democracy    Kazakhstan       18                76               70         3.019       Upper middle income   Authoritarian regime
                                                                                                                   Armenia          19                84               72         3.027       Lower middle income   Hybrid regime
                                                                                                                   Azerbaijan       20                92               75         3.108       Upper middle income   Authoritarian regime
                                                                                                                   Russia           21                108              81         3.128       Upper middle income   Hybrid regime


94                                                                                                                                                                                                                                         95
Positive Peace                                                                                                                                                                                                           Positive Peace
by region                                                                                                                                                                                                                    by region


asia                                                                                                                       latin
pacific                                                                                                                    america


Table 3.8: Asia Pacific PPI rankings                                                                                       Table 3.9. LATIN AMERICA PPI rankings


 Country           Regional Rank       2011 GPI Rank   PPI Rank   PPI Score   Income Group          Government Type         Country          Regional Rank 2011 GPI Rank   PPI Rank   PPI Score   Income Group          Government Type

 New Zealand       1                   2               9          1.412       High income           Full democracy          Chile            1                     34      27         2.058       Upper middle income   Flawed democracy
 Australia         2                   18              12         1.507       High income           Full democracy          Uruguay          2                     21      35         2.200       Upper middle income   Full democracy
 Japan             3                   3               17         1.634       High income           Full democracy          Costa Rica       3                     29      38         2.296       Upper middle income   Full democracy
 Singapore         4                   24              19         1.747       High income           Hybrid regime           Jamaica          4                     82      44         2.585       Upper middle income   Flawed democracy
 South Korea       5                   44              26         2.009       High income           Full democracy          Trinidad and     5                     67      45         2.589       High Income           Flawed democracy
                                                                                                                            Tobago
 Kuwait            6                   28              42         2.547       Low income            Authoritarian regime
                                                                                                                            Argentina        6                     49      48         2.630       Upper middle income   Flawed democracy
 Malaysia          7                   19              47         2.595       Upper middle income   Flawed democracy
                                                                                                                            Panama           7                     43      52         2.700       Upper middle income   Flawed democracy
 Thailand          8                   83              66         2.982       Lower middle income   Flawed democracy
                                                                                                                            Brazil           8                     63      54         2.784       Upper middle income   Flawed democracy
 China             9                   68              78         3.114       Lower middle income   Authoritarian regime
                                                                                                                            Mexico           9                     91      55         2.785       Upper middle income   Flawed democracy
 Philippines       10                  102             79         3.117       Lower middle income   Flawed democracy
                                                                                                                            Peru             10                    71      57         2.829       Upper middle income   Flawed democracy
 Sri Lanka         11                  96              82         3.147       Lower middle income   Flawed democracy
                                                                                                                            El Salvador      11                    80      58         2.858       Lower middle income   Flawed democracy
 Indonesia         12                  58              83         3.150       Lower middle income   Flawed democracy
                                                                                                                            Dominican        12                    75      59         2.885       Upper middle income   Flawed democracy
 India             13                  101             87         3.297       Lower middle income   Flawed democracy
                                                                                                                            Republic
 Bangladesh        14                  70              99         3.526       Low income            Hybrid regime
                                                                                                                            Colombia         13                    103     60         2.889       Upper middle income   Flawed democracy
 Cambodia          15                  86              100        3.528       Low income            Hybrid regime
                                                                                                                            Guyana           14                    73      64         2.939       Low income            Hybrid regime
 Pakistan          16                  107             105        3.808       Lower middle income   Hybrid regime
                                                                                                                            Ecuador          15                    74      77         3.114       Lower middle income   Hybrid regime
                                                                                                                            Paraguay         16                    57      80         3.118       Lower middle income   Flawed democracy
                                                                                                                            Bolivia          17                    64      84         3.208       Lower middle income   Hybrid regime
                                                                                                                            Honduras         18                    88      85         3.210       Lower middle income   Hybrid regime
                                                                                                                            Guatemala        19                    95      86         3.223       Lower middle income   Flawed democracy
                                                                                                                            Venezuela        20                    94      89         3.346       Upper middle income   Hybrid regime


96                                                                                                                                                                                                                                         97
Positive Peace                                                                                                                                                                                                              Positive Peace
by region                                                                                                                                                                                                                       by region


middle east                                                                                                                 north america
and north africa


Table 3.10: Middle East and North Africa PPI rankings                                                                       Table 3.11: North America PPI rankings


 Country          Regional Rank       2011 GPI Rank     PPI Rank   PPI Score   Income Group          Government Type         Country           Regional Rank         2011 GPI Rank   PPI Rank   PPI Score   Income Group   Government Type

 Qatar            1                   12                32         2.181       High Income           Authoritarian regime    Canada             1                    8               8          1.383       High income    Full democracy
 United Arab      2                   30                37         2.242       High Income           Authoritarian regime    United States
 Emirates                                                                                                                    of America         2                    69              16         1.545       High income    Full democracy
 Israel           3                   106               39         2.353       High Income           Flawed democracy
 Bahrain          4                   93                46         2.592       High Income           Authoritarian regime
 Tunisia          5                   38                62         2.915       Lower middle income   Authoritarian regime
 Saudi Arabia     6                   79                63         2.924       High Income           Authoritarian regime
 Jordan           7                   55                67         2.997       Lower middle income   Authoritarian regime
 Morocco          8                   52                74         3.104       Lower middle income   Authoritarian regime
 Egypt            9                   62                76         3.112       Lower middle income   Authoritarian regime
 Syria            10                  87                93         3.400       Lower middle income   Authoritarian regime
 Iran             11                  90                95         3.427       Upper middle income   Authoritarian regime


98                                                                                                                                                                                                                                          99
Positive Peace
by region


                                                                                                                           Positive Peace
                                                                                                                           by Income Group

Sub-Saharan                                                                                                               Low Income countries have a high                         chart 3.12: PPI BY INCOME GROUP

Africa
                                                                                                                          positive peace deficit on average, but                                           4.0


                                                                                                                                                                                  LESS PEACEFUL
                                                                                                                                                                                                                                             average
                                                                                                                          there is little difference between upper                                                                                ppi
                                                                                                                          middle and high income countries                                                 3.5

                                                                                                                          suggesting positive peace is only
                                                                                                                                                                                                           3.0
                                                                                                                          associated with income at a certain
                                                                                                                          threshold.                                                                       2.5
                                                                                                                          •	 There is a graduated relationship between positive
                                                                                                                             peace and income. High income countries tend to                               2.0

                                                                                                                             be the most peaceful and low incomes countries
                                                                                                                             tend to be the least peaceful.                                                1.5

                                                                                                                          •	 The smallest gap is between the high income group


                                                                                                                                                                                  MORE PEACEFUL
                                                                                                                                                                                                           1.0
                                                                                                                             and upper middle income group.
                                                                                                                          •	 There is a large positive peace deficit for low                               0.5
Table 3.12: Sub-Saharan Africa PPI rankings                                                                                  income countries and a small net positive peace
                                                                                                                             deficit for lower middle income countries.                                    0.0
                                                                                                                                                                                                                   Low     Lower    Upper         High
                                                                                                                                                                                                                  Income   Middle   Middle       income
 Country           Regional Rank      2011 GPI Rank   PPI Rank   PPI Score   Income Group          Government Type                                                                                                         Income   Income

 Botswana           1                 31              43         2.561       Upper middle income   Flawed democracy
                                                                                                                          CHART 3.11: GPI BY INCOME GROUP                          chart 3.13: Income Group Peace Gap by Rank
 South Africa       2                 89              51         2.698       Upper middle income   Flawed democracy
 Namibia            3                 48              53         2.783       Upper middle income   Flawed democracy       2.5                                        average                                                          positive peace
                                                                                                                                                                                                           400
                                                                                                                                                                          gpi                                                           gap by rank


                                                                                                                                                                                  POSITIVE PEACE SURPLUS
 Ghana              4                 36              71         3.021       Low income            Flawed democracy
 Nicaragua          5                 61              73         3.102       Low income            Authoritarian regime                                                                                    300
 Senegal            6                 65              88         3.338       Low income            Hybrid regime          2.0
                                                                                                                                                                                                           200
 Malawi             7                 35              90         3.374       Low income            Hybrid regime
 Tanzania           8                 50              91         3.385       Low income            Hybrid regime                                                                                           100
 Zambia             9                 46              92         3.395       Low income            Hybrid regime          1.5
                                                                                                                                                                                                             0
 Madagascar         10                81              94         3.400       Low income            Authoritarian regime

 Kenya              11                85              96         3.459       Low income            Hybrid regime                                                                                           -100
                                                                                                                          1.0
 Mozambique         12                42              97         3.485       Low income            Hybrid regime


                                                                                                                                                                                  POSITICE PEACE DEFLICT
                                                                                                                                                                                                           -200
 Mali               13                78              98         3.495       Low income            Authoritarian regime
 Uganda             14                77              101        3.542       Low income            Hybrid regime                                                                                           -300
                                                                                                                          0.5
 Burkina Faso       15                45              102        3.589       Low income            Authoritarian regime
                                                                                                                                                                                                           -400
 Cameroon           16                72              103        3.760       Lower middle income   Authoritarian regime
 Ethiopia           17                99              104        3.761       Low income            Authoritarian regime                                                                                    -500
                                                                                                                          0.0                                                                                      Low     Lower    Upper          High
 Nigeria            18                105             106        3.845       Lower middle income   Authoritarian regime           Low         Lower         Upper        High
                                                                                                                                                                                                                  Income   Middle   Middle        income
                                                                                                                                 Income       Middle        Middle      income
 Cote d'Ivoire      19                98              107        3.881       Lower middle income   Authoritarian regime                                                                                                    Income   Income
                                                                                                                                              Income        Income
 Zimbabwe           20                104             108        4.016       Low income            Authoritarian regime


100                                                                                                                                                                                                                                                     101
Positive Peace by
                                                                                                                                                                                                                                           Government Type


 Positive Peace by
 Government Type

 CHART 3.14: GPI VS. PPI by government type                                                                          •	 Full democracies on average clearly have the best        chart 3.16: PPI Average by government type
 It is clear full democracies have the highest levels of peace on both the
                                                                                                                        average PPI and GPI scores. They also have the
 GPI and PPI and the lowest average peace gap.
                                                                                                                        smallest average positive peace deficit.                                          3.5                                PPI AVERAGE

                            120                                                                                      •	 Hybrid regimes are on average slightly less peaceful
                                                                                                                                                                                                          3.0
                                                                                                                        on the GPI than authoritarian regimes. They have
                                                                                                                        the same average PPI score and close to the same
                                                                                                                                                                                                          2.5
                                                                                                                        average positive peace deficit.
                            100                                                                 Flawed Democracy     •	 Flawed democracies notably have the largest                                       2.0
                                                                                              Authoritarian regime      positive peace surplus which is noted above.
                                                                                                     Hybrid Regime                                                                                        1.5

                                                                                                   Full Democracy
                             80                                                                                                                                                                           1.0
POSITIVE PEACE INDEX RANK


                                                                                                                                                                                                          0.5
                                                                                                                     chart 3.15: GPI Average by government type

                                                                                                                                                                                                          0.0
                             60                                                                                                                                                                              Authoritarian      Hybrid     Flawed     Full
                                                                                                                     2.5                                           2011 gpi                                    Regimes          regime    democracy democracy
                                                                                                                                                                  average


                                                                                                                     2.0
                             40                                                                                                                                                                           chart 3.17: Peace gap by government type

                                                                                                                                                                                                         400


                                                                                                                                                                                POSITIVE PEACE SURPLUS
                                                                                                                                                                                                                                                   peace gap

                                                                                                                     1.5
                                                                                                                                                                                                         300
                             20

                                                                                                                                                                                                         200
                                                                                                                     1.0


                                                                                                                                                                                                         100
                              0
                                  0   20   40              60                80   100   120                          0.5
                                             GPI PEACE INDEX RANK                                                                                                                                          0


                                                                                                                                                                                POSITICE PEACE DEFLICT
                                                                                                                                                                                                         -100
                                                                                                                     0.0
 Authoritarian and hybrid regimes                                                                                          Authoritarian   Hybrid    Flawed            Full
                                                                                                                              regime       regime   democracy       democracy
 on average have the same levels of                                                                                                                                                                      -200

 positive peace deficits whereas flawed
 democracies on average have a positive                                                                                                                                                                  -300
                                                                                                                                                                                                                Authoritarian    Hybrid      Flawed          Full
 peace surplus. This suggests comparative                                                                                                                                                                          regime        regime     democracy      democracy

 to other governance types, there could
 be a potential for flawed democracies
 to increase in peace and conversely,
 downside risks for authoritarian and
 hybrid regimes.


102                                                                                                                                                                                                                                                              103
Positive Peace by
                                                                                                                                                                                                                                          Indicator Domain


Positive Peace by
Indicator Domain

                                                                                                                                 chart 3.21: Acceptance of the Rights of Others Score

chart 3.18. Well-Functioning Government score by region                                                                          by region

Latin America and Sub-Saharan Africa are the poorest performers on                                                               The Middle East and North Africa has the poorest performance on
Well-Functioning Government.                                                                                                     Acceptance of the Rights of Others measures.


                  Asia Pacific                                                                                                                    Asia Pacific
 Central and Eastern Europe                                                                                                       Central and Eastern Europe
               Latin America                                                                                                                    Latin America
Middle East and North Africa                                                                                                     Middle East and North Africa
               North America                                                                                                                   North America
          Sub-Saharan Africa                                                                                                              Sub-Saharan Africa
            Western Europe                                                                                                                   Western Europe
                                 0.0                 0.5               1.0         1.5               2.0                   2.5                                   0.0            0.5                   1.0         1.5         2.0                2.5             3.0
                                 MORE POSITIVE PEACE                                                   LESS POSITIVE PEACE                                       MORE POSITIVE PEACE                                                             LESS POSITIVE PEACE


chart 3.19. Equitable Distribution of Resources                                                                                  chart 3.22: Good Relations with Neighbours score
score by region                                                                                                                  by region
Sub-Saharan Africa is the worst performer on the three indicators                                                                Good Relations with Neighbours is the only positive peace
of Equitable Distribution of Resources.                                                                                          indicator where North America is not the highest performer.


                  Asia Pacific                                                                                                                    Asia Pacific
 Central and Eastern Europe                                                                                                       Central and Eastern Europe
               Latin America                                                                                                                    Latin America
Middle East and North Africa                                                                                                     Middle East and North Africa
               North America                                                                                                                   North America
          Sub-Saharan Africa                                                                                                              Sub-Saharan Africa
            Western Europe                                                                                                                   Western Europe
                                 0.0      0.2        0.4         0.6   0.8   1.0   1.2   1.4         1.6         1.8                                             0.0      0.2         0.4       0.6         0.8   1.0   1.2         1.4    1.6         1.8       2.0
                                 MORE POSITIVE PEACE                                           LESS POSITIVE PEACE                                               MORE POSITIVE PEACE                                                             LESS POSITIVE PEACE


chart 3.20 Sound Business Environment score by region                                                                            chart 3.23: Free Flow of Information score by region
Central and Eastern Europe score more poorly than the Asia                                                                       The Middle East and North Africa and Sub-Saharan Africa have
Pacific and the Middle East and North Africa on Sound Business                                                                   equally poor scores on Free Flow of Information.
Environment measures.
                                                                                                                                                  Asia Pacific
                  Asia Pacific                                                                                                    Central and Eastern Europe
 Central and Eastern Europe                                                                                                                     Latin America
               Latin America                                                                                                     Middle East and North Africa
Middle East and North Africa                                                                                                                   North America
               North America                                                                                                              Sub-Saharan Africa

          Sub-Saharan Africa                                                                                                                 Western Europe

            Western Europe                                                                                                                                       0.0                  0.5                   1.0         1.5                2.0                   2.5

                                 0.0                 0.5               1.0         1.5               2.0                   2.5                                   MORE POSITIVE PEACE                                                             LESS POSITIVE PEACE

                                 MORE POSITIVE PEACE                                                       LESS POSITIVE PEACE


104                                                                                                                                                                                                                                                            105
Positive Peace by
Indicator Domain


                                                                                                                                        Trends in
                                                                                                                                        Individual Positive
                                                                                                                                        Peace Indicators
chart 3.24: High Levels of Education score by region                                                                                    Several data points in the PPI have a time series going
Sub-Saharan Africa is lagging on mean years of schooling and
                                                                                                                                        back several years, allowing one to visualise broad
secondary school enrolment rates. Latin America, Middle East
and North Africa and the Asia Pacific all have similar scores.                                                                          global and regional trends. The entire PPI cannot be
                                                                                                                                        taken back consistently as some data points, such as
                  Asia Pacific                                                                                                          the United Nation’s IHDI only go back as far as 2010
 Central and Eastern Europe
                                                                                                                                        and is limited by number of countries covered.
                Latin America
Middle East and North Africa                                                                                                                                                                                      Global Trend    Decreasing Cohesion
                                                                                                                                        chart 3.26: Acceptance of the Rights of Others – ISS’s
               North America                                                                                                                                                                                     Biggest Faller   Western Europe
                                                                                                                                        Intergroup Cohesion 1990 - 2010
          Sub-Saharan Africa                                                                                                            The data suggests intergroup cohesion as measured by the ISS                      Note    Data collected for each period
             Western Europe                                                                                                             has fallen since 2000.                                                                    varies.

                                 0.0      0.2          0.4        0.6         0.8   1.0   1.2         1.4   1.6         1.8       2.0
                                                                                                                                        0.9
                                 MORE POSITIVE PEACE                                                              LESS POSITIVE PEACE                                                                                                                  Western Europe
                                                                                                                                                                                                                                               western europe
                                                                                                                                        0.8                                                                                                         asia pacific
                                                                                                                                        0.7                                                                                                            Sub-Saharan Africa
                                                                                                                                                                                                                                                   central and
chart 3.25: Low Levels of Corruption score by region
Latin America has the second highest levels of corruption after
                                                                                                                                        0.6                                                                                                            North America
                                                                                                                                                                                                                                                eastern europe

                                                                                                                                        0.5                                                                                                      latin america
Sub-Saharan Africa.
                                                                                                                                                                                                                                                       Middle East and Nort
                                                                                                                                                                                                                                                  middle east
                                                                                                                                        0.4
                                                                                                                                                                                                                                             and north africa
                  Asia Pacific
                                                                                                                                        0.3                                                                                                            Latin America
                                                                                                                                                                                                                                                   sub-saharan
 Central and Eastern Europe
                Latin America
                                                                                                                                        0.2                                                                                                            Central and Eastern E
                                                                                                                                                                                                                                                         africa

                                                                                                                                        0.1                                                                                                     north america
Middle East and North Africa                                                                                                                                                                                                                           Asia-Pacific
                                                                                                                                        0.0
               North America
                                                                                                                                                         1990          1995               2000            2005          2010
          Sub-Saharan Africa
             Western Europe
                                                                                                                                        chart 3.27: Free Flow of Information – International
                                 0.0             0.5                    1.0         1.5         2.0               2.5             3.0                                                                             Global Trend    Decreasing Press Freedom
                                                                                                                                        Press Freedom Index
                                 MORE POSITIVE PEACE                                                              LESS POSITIVE PEACE                                                                             Biggest Riser   N/A
                                                                                                                                        Press Freedom has been decreasing globally since 2008. The
                                                                                                                                        biggest loss in press freedom over the period is in Sub-Saharan          Biggest Faller   Sub-Saharan Africa
                                                                                                                                        Africa.


                                                                                                                                                        70                                                                                         western europe


                                                                                                                                        PRESS FREEDOM
                                                                                                                                                                                                                                                        asia pacific
                                                                                                                                                        60
                                                                                                                                                                                                                                                      central and
                                                                                                                                                        50                                                                                         eastern europe

                                                                                                                                        LESS
                                                                                                                                                                                                                                                     latin america
                                                                                                                                                        40
                                                                                                                                                                                                                                                     middle east
                                                                                                                                                        30                                                                                      and north africa
                                                                                                                                        PRESS FREEDOM


                                                                                                                                                                                                                                                       sub-saharan
                                                                                                                                                        20                                                                                                   africa
                                                                                                                                                                                                                                                   north america
                                                                                                                                                        10
                                                                                                                                        MORE


                                                                                                                                                         0
                                                                                                                                                             2002   2003      2004      2005       2006   2007   2008     2009     2010


106                                                                                                                                                                                                                                                                    107
Trends in
Individual Positive
Peace Indicators


                                                                                                                                          Conclusion


                                                                              Global Trend         Slight increase in corruption
Figure 3.28: Low Levels of Corruption – WGI - Control of                          Biggest Riser    Central & Eastern Europe (falling      In contrast to the Global Peace Index which measures        peace gap, with a surplus indicating a high level
Corruption (1996 – 2009)                                                                           corruption)
                                                                                                                                          negative peace, this study is the first attempt by          of institutional capacity to support lower levels
Corruption in Central and Eastern Europe has been steadily
                                                                              Biggest Faller       Asia-Pacific (increasing corruption)   the Institute for Economics and Peace to build a            of violence as measured by the GPI. Countries
falling while it has increased in the Asia Pacific since 1996.
                                                                                           Note    Does not consider standard errors      Positive Peace Index from six years of GPI data for         with a peace deficit have a comparatively greater
                                                                                                                                          over 108 countries. Defining positive peace as “the         vulnerability to external shocks and a higher risk
             1.2
CORRUPTION


                                                                                                                    western europe        set of attitudes, institutions and structures which         of an increased level of violence. On average, the
             1.0
                                                                                                                         asia pacific
                                                                                                                                          when strengthened, lead to a more peaceful society”         majority of the world’s positive peace deficit is in Sub-
             0.8
                                                                                                                                          it is possible to empirically derive key indicators and     Saharan Africa with the peace gap greatest for low
LESS


             0.6                                                                                                       central and
                                                                                                                    eastern europe        weightings of positive peace via analysis of six years of   income countries.
             0.4
                                                                                                                      latin america       GPI data. The outcome is the first known attempt to             Countries such as Egypt, Madagascar and Syria
             0.2
             0.0                                                                                                       middle east
                                                                                                                                          build a statistically derived comprehensive composite       are clear examples of countries with peace deficits
                                                                                                                                          index of positive peace.                                    in 2008 which subsequently experienced large
CORRUPTION


                                                                                                                  and north africa
             -0.2
             -0.4                                                                                                      sub-saharan             The results of the PPI enable to conceptualise a       increases in violence over the next four years. Their
                                                                                                                             africa
                                                                                                                                          nation’s multidimensional institutional capacity and        respective falls on the GPI ranking leads to the GPI
MORE


             -0.6
                                                                                                                     north america
             -0.8                                                                                                                         resilience to deal with external shocks and avoid           and PPI scores converging, showing levels of violence
                     1996     1998   2000   2002   2003      2004   2005   2006     2007    2008     2009
                                                                                                                                          conflict. Perhaps unsurprisingly, the nations at the        ‘catching up’ with levels of positive peace. In 2008,
                                                                                                                                          top of the PPI tend to be high on the GPI, in the high      these countries would have had amongst the highest
Chart 3.29: High Levels of Education – Mean years of                                                                                      income category, and full democracies as defined            positive peace deficits in the world, indicating the
schooling (1980 – 2010)
                                                                              Global Trend         Increasing mean years of schooling     by the EIU Democracy Index. On average, North               set of attitudes, structures, and institutions in place
Since 1980, the Middle East and North Africa has seen the
largest rises in mean years of schooling.                                         Biggest Riser    Middle East & North Africa             America and Western Europe are the most positively          compared to other countries were not adequately
                                                                                                                                          peaceful regions, with Sub-Saharan Africa clearly well      aligned to facilitate a peaceful resolution of conflict.
                                                                                                                    western europe        behind on positive peace. Interestingly, the average            Ultimately, the analysis presented here is a first
                    14                                                                                                                    positive peace score is close to equal in Central and       attempt at quantifying positive peace. It is hoped to be
     MORE MEAN


                                                                                                                         asia pacific
     SCHOOLING


                                                                                                                                          Eastern Europe, the Asia Pacific, Latin America and         further complemented by qualitative country-specific
     YEARS OF


                    12                                                                                                 central and
                                                                                                                    eastern europe        the Middle East and North Africa. This suggests these       research.
                    10                                                                                                latin america       diverse regions on average face similar challenges in
                                                                                                                       middle east
                                                                                                                                          terms building resilience and institutional capacity.
                    8
                                                                                                                  and north africa             The lower ranked nations in the PPI tend to be
                    6                                                                                                  sub-saharan        lower income nations with hybrid or authoritarian
                                                                                                                             africa
                                                                                                                                          regimes. Despite the fact that hybrid regimes are
     FEWER MEAN


                    4
     SCHOOLING


                                                                                                                     north america
                                                                                                                                          on average slightly less peaceful than authoritarian
     YEARS OF


                    2                                                                                                                     regimes on the GPI, they tend to have the same
                    0                                                                                                                     average PPI score. Evidently, the countries facing
                         1980 1985 1990 1995 2000 2001 2002 2003 2004 2005 2006 2007 2008 2009 2010                                       governance or economic constraints will have ongoing
                                                                                                                                          challenges in boosting their levels of positive peace.
                                                                                                                                          Additionally, with the available trend data showing
                                                                                                                                          purported declines in intergroup cohesion, slight
                                                                                                                                          increases in corruption and declines in press freedom,
                                                                                                                                          there may be future challenges to boosting positive
                                                                                                                                          peace.
                                                                                                                                               This analysis has enabled a comparison between
                                                                                                                                          a nation’s positive peace score and GPI score, which
                                                                                                                                          measures negative peace. The difference between
                                                                                                                                          the GPI and PPI rank has been referred to as the


108                                                                                                                                                                                                                                                        109
Annex A


Annex A                                                              Number of internal security
                                                                     officers and police per 100,000 people
                                                                                                                                        Number of homicides
                                                                                                                                        per 100,000 people
                                                                                                                                                                                                            Number of jailed
                                                                                                                                                                                                            population per 100,000 people
GPI INDICATOR SOURCES, DEFINITIONS
AND SCORING CRITERIA                                                 Weight (1 to 5)                                                3   Weight (1 to 5)                                                4    Weight (1 to 5)                                                  3
                                                                     Type                                               Quantitative    Type                                                 Quantitative   Type                                               Quantitative
                                                                     Main source                                 12th UNODC Survey      Main source                                12th UNODC Survey        Main source                            International Centre for
The information below details the sources, definitions and
scoring criteria of the 23 indicators that form the Global           Year                                 2004-09, depending upon       Year                                 2004-10, depending upon                                          Prison Studies, World Prison
Peace Index. All scores for each indicator are “banded”,                                                           data availability                                                  data availability                                       Population List (9th edition)
either on a scale of 1-5 (for qualitative indicators) or 1-9                                                                                                                                                Year                                 2002-11, depending upon
                                                                     Alternate source                                                   Alternate source
(for quantitative data). However, those in the latter group                                                                                                                                                                                               data availability
have then been converted to a 1-5 scale for comparability            Economist Intelligence Unit. Where data is not provided,           Economist Intelligence Unit. Where data is not provided, the
when compiling the final index. Where there are gaps                 the Economist Intelligence Unit’s analysts have filled them        EIU’s analysts have filled them based on likely scores from         Definition
in data, the Economist Intelligence Unit’s analysts have             based on likely scores from the set bands of the actual data.      the set bands of the actual data.                                   Figures are from the International Centre for Prison
estimated scores. The latest available data are always used.                                                                                                                                                Studies, and are compiled from a variety of sources. In
                                                                     Definition                                                         Definition
                                                                                                                                                                                                            almost all cases the original source is the national prison
                                                                     This indicator comes from the United Nations Survey                Intentional homicide refers to death deliberately inflicted
                                                                                                                                                                                                            administration of the country concerned, or else the
INTERNAL PEACE: 60%                                                  of Crime Trends and Operations of Criminal Justice                 on a person by another person, including infanticide. The
                                                                                                                                                                                                            Ministry responsible for the prison administration. Prison
                                                                     Systems (UN-CTS), and refers to the civil police force.            figures refer to the total number of penal code offences
                                                                                                                                                                                                            population rates per 100,000 of the national population are
                                                                     Police Personnel means personnel in public agencies whose          or their equivalent, but excluding minor road traffic and
                                                                                                                                                                                                            based on estimates of the national population.
                                                                     principal functions are the prevention, detection and              other petty offences, brought to the attention of the police
LEVEL OF PERCEIVED
                                                                     investigation of crime and the apprehension of alleged             or other law enforcement agencies and recorded by one of                In order to compare prison population rates, and
CRIMINALITY in society
                                                                     offenders. It is distinct from national guards or local militia.   those agencies.                                                     to estimate the number of persons held in prison in the
Weight (1 to 5)                                                  3                                                                                                                                          countries for which information is not available, median
Type                                               Qualitative                                                                                                                                              rates have been used by the International Center for Prison
                                                                     Scoring criteria                                                   Scoring criteria
                                                                                                                                                                                                            Studies to minimise the effect of countries with rates that
Main source                       Economist Intelligence Unit         1            2           3             4           5               1            2           3            4              5
                                                                                                                                                                                                            are untypically high or low. Indeed, comparability can be
                                                                      0 - 199.8    199.9 -      399.9 -      599.9 -      > 799.9        0 - 1.99     2 - 5.99    6 - 9.99      10 - 19.99     > 20
Year                                                    2011-12                                                                                                                                             compromised by different practice in different countries,
                                                                                   399.8        599.8        799.8
                                                                                                                                                                                                            for example with regard to pre-trial detainees and juveniles,
                                                                                                                                        Additional notes
                                                                     Additional notes                                                                                                                       but also psychiatrically ill offenders and offenders being
Definition                                                                                                                              This year’s GPI smoothes data for Burkina Faso, Cambodia,
                                                                     For Jordan, data for “paramilitary under the command                                                                                   detained for treatment for alcoholism and drug addiction.
Assessment of the level of perceived criminality in society,                                                                            Cameroon, Cote d’Ivoire, Ethiopia, Ghana, Guinea, Kenya,
                                                                     of the Ministry of Interior” provided by the IISS Military                                                                             People held in custody are usually omitted from national
ranked from 1-5 (very low to very high) by the Economist                                                                                Sierra Leone, and Uganda. This was due to new and more
                                                                     Balance 2011 was used to estimate the total number of                                                                                  totals if they are not under the authority of the prison
Intelligence Unit’s Country Analysis team. Country analysts                                                                             reliable data becoming available. Smoothing the data over
                                                                     internal security and police officers.                                                                                                 administration.
are asked to assess this indicator on an annual basis, for the                                                                          a period of two to three years means that these countries’
period March to March.                                                                                                                  scores for this indicator do not move substantially in just
                                                                                                                                                                                                            Scoring criteria
                                                                                                                                        one year, which could lead to false assumptions being made
Scoring criteria                                                                                                                        about an improvement or deterioration in score.                      1            1.5        2             2.5          3
1=Very low: the majority of other citizens can be trusted.                                                                                                                                                   0 - 109.74   109.75 -    199.5         289.25 -     379.0 -
Very low levels of domestic security.                                                                                                                                                                                     199.4       -289.24       378.9        468.74

2= Low: an overall positive climate of trust with other                                                                                                                                                      3.5          4          4.5           5
citizens.                                                                                                                                                                                                    468.75 -     558.5 -     648.25 -      > 738
3=Moderate: reasonable degree of trust in other citizens.                                                                                                                                                    558.4        648.24      737.9

4= High: high levels of distrust in other citizens. High levels
                                                                                                                                                                                                            Additional notes
of domestic security.
                                                                                                                                                                                                            The data provided by World Prison Briefs are not annual
5= Very high: very high levels of distrust in other citizens -                                                                                                                                              averages but indicate the number of jailed population per
people are extremely cautious in their dealings with others.                                                                                                                                                100,000 inhabitants in a particular month during the year.
Large number of gated communities, high prevalence of                                                                                                                                                       The year and month may differ from country to country.
security guards.

 1            2           3            4            5
 Very         Low          Moderate     High        Very High
 Low

Additional notes
The weighting for this indicator has decreased this year
from 4 to 3.


110                                                                                                                                                                                                                                                                        111
Annex A                                                                                                                                                                                                                                                          Annex A


Ease of access to small                                               Level of organised                                                   Likelihood of                                                      Level of
arms and light weapons                                                conflict (internal)                                                  violent demonstrations                                             violent crime


Weight (1 to 5)                                                   3   Weight (1 to 5)                                                 5    Weight (1 to 5)                                                3   Weight (1 to 5)                                                4
Type                                                 Qualitative      Type                                                   Qualitative   Type                                                Qualitative    Type                                                Qualitative
Main source                         Economist Intelligence Unit       Main source                            Economist Intelligence Unit   Main source                         Economist Intelligence Unit    Main source                         Economist Intelligence Unit
Year                                                     2011-12                                                                           Year                                                    2011-12    Year                                                    2011-12
                                                                      Year                                                       2011-12
Definition                                                            Definition                                                           Definition
Assessment of the accessibility of small arms and light                                                                                                                                                       Definition
                                                                      Assessment of the intensity of conflicts within the country,         Assessment of the likelihood of violent demonstration
weapons (SALW), ranked from 1-5 (very limited access                                                                                                                                                          Assessment of the likelihood of violent crime ranked from
                                                                      ranked from 1-5 (no conflict to severe crisis) by the                ranked from 1-5 (very low to very high) by the Economist
to very easy access) by the Economist Intelligence Unit’s                                                                                                                                                     1 to 5 (very low to very high) by the Economist Intelligence
                                                                      Economist Intelligence Unit’s Country Analysis team.                 Intelligence Unit’s Country Analysis team, based on the
Country Analysis team.                                                                                                                                                                                        Unit’s Country Analysis team based on the question
                                                                         Country analysts are asked to assess this indicator on an         question “Are violent demonstrations or violent civil/labour
    Country analysts are asked to assess this indicator on an                                                                                                                                                 “Is violent crime likely to pose a significant problem for
                                                                      annual basis, for the period March to March.                         unrest likely to pose a threat to property or the conduct of
annual basis, for the period March to March.                                                                                                                                                                  government and/or business over the next two years?”.
                                                                                                                                           business over the next two years?”.
                                                                      Scoring criteria                                                                                                                            Country analysts assess this question on a quarterly
                                                                                                                                              Country analysts assess this question on a quarterly
Scoring criteria                                                      1 = No conflict                                                                                                                         basis. The score provided for March 2011 - March 2012 is
                                                                                                                                           basis. The score provided for March 2011 - March 2012 is
1 = Very limited access: the country has developed policy                                                                                                                                                     the average of the scores given for each quarter.
                                                                      2 = Latent conflict: positional differences over definable           the average of the scores given for each quarter.
instruments and best practices, such as firearm licences,
                                                                      values of national importance.
strengthening of export controls, codes of conduct, firearms
or ammunition marking.                                                3 = Manifest conflict: explicit threats of violence.                                                                                    Scoring criteria
                                                                                                                                           Scoring criteria
                                                                      Imposition of economic sanctions by other countries.                                                                                     1            2          3              4           5
2 = Limited access: the regulation implies that it is difficult,                                                                            1            2          3              4           5
time-consuming and costly to obtain firearms. Domestic                4 = Crisis: a tense situation across most of the country. At                                                                             Strongly     No          Somewhat       Yes        Strongly
                                                                                                                                            Strongly     No          Somewhat       Yes        Strongly
                                                                      least one group uses violent force in sporadic incidents.                                                                                no                       of a                      yes
firearms regulation also reduces the ease with which legal                                                                                  no                       of a                      yes
                                                                      5 = Severe crisis: civil war - violent force is used with a                                                                                                       problem
arms are diverted to illicit markets.                                                                                                                                problem
                                                                      certain continuity in an organized and systematic way
3 = Moderate access: there are regulations and commitment
                                                                      throughout the country.
to ensure controls on civilian possession of firearms,
although inadequate controls are not sufficient to stem the            1            2            3               4           5
flow of illegal weapons.                                               No           Latent        Manifest        Crisis     Severe
4 = Easy access: there are basic regulations, but they are not         conflict     conflict      conflict                   crisis

effectively enforced. Obtaining firearms is straightforward.
5 = Very easy access: there is no regulation of civilian
possession, ownership, storage, carriage and use of firearms

 1            2            3            4            5
 Very         Limited      Moderate      Easy         Very easy
 limited      access       access        access       access
 access


112                                                                                                                                                                                                                                                                      113
Annex A                                                                                                                                                                                                                                                        Annex A


Political                                                           Political                                                          Political Terror Scale (CONT.)                                         Volume of transfers of major conventional
instability                                                         Terror Scale                                                                                                                              weapons, as recipient (Imports) per 100,000
                                                                                                                                                                                                              people
                                                                                                                                        1                       2                       3
Weight (1 to 5)                                                 4   Weight (1 to 5)                                               4     Secure rule of law       Limited amount of      Extensive political
Type                                               Qualitative                                                                                                   imprisonment for       imprisonment          Weight (1 to 5)                                               2
                                                                    Type                                               Qualitative
                                                                                                                                                                 nonviolent political
Main source                       Economist Intelligence Unit                                                                                                                                                 Type                                             Quantitative
                                                                    Main source                       Gibney, M., Cornett, L., &                                 activity

Year                                                   2011-12                                   Wood, R., Political Terror Scale                                                                             Main source                  SIPRI Arms Transfers Database;
                                                                                                 1976-2011. Data retrieved from                                                                               Year
                                                                                                                                        4                                    5                                                                                      2006-10
                                                                                              http://www.politicalterrorscale.org
Definition
                                                                                                                                        Civil and political rights           Terror has expanded to the
Assessment of political instability ranked from 0 to 100            Year                                                        2010    violations have expanded to          whole population                 Definition
(very low to very high instability) by the Economist                                                                                    large numbers of the population                                       Measures the total volume of major conventional weapons
Intelligence Unit’s Country Analysis team, based on the             Definition                                                                                                                                imported by a country between 2006 and 2010, divided by
question “Are political institutions sufficiently stable to         The Political Terror Scale measures levels of political                                                                                   the average population in this time period at the 100,000
support the needs of businesses and investors?”. This               violence and terror that a country experiences in a                                                                                       people level (population data supplied by the Economist
                                                                                                                                       Additional notes
indicator aggregates 5 other questions on social unrest,            particular year based on a 5-level “terror scale”. The data                                                                               Intelligence Unit).
orderly transfers, opposition stance, excessive executive                                                                              Renamed Political Terror Scale from ‘Level of disrespect of
                                                                    used in compiling this index comes from two different                                                                                         The SIPRI Arms Transfers Database covers all
authority, and an international tension sub-index (each of                                                                             human rights (Political Terror Scale)’.
                                                                    sources: the yearly country reports of Amnesty International                                                                              international sales and gifts of major conventional weapons
which is ranked from 0 to 20).                                      and the U.S. State Department Country Reports on Human                                                                                    and the technology necessary for the production of them.
    Country analysts assess this question on a quarterly            Rights Practices. The average of the two scores is taken for                                                                              The transfer equipment or technology is from one country,
basis. The score provided for March 2011 - March 2012 is            our assessment.                                                                                                                           rebel force or international organisation to another
the average of the scores given for each quarter.                                                                                                                                                             country, rebel force or international organisation. Major
                                                                    Scoring criteria                                                                                                                          conventional weapons include: aircraft, armoured vehicles,
                                                                    1 = Countries under a secure rule of law, people are not                                                                                  artillery, radar systems, missiles, ships, engines.
Scoring criteria
                                                                    imprisoned for their view, and torture is rare or exceptional.
 1            2           3           4            5
                                                                    Political murders are extremely rare.
                                                                                                                                                                                                              Scoring criteria
 0 - 20       20.5 - 40   40.5 - 60    60.5 - 80   80.5 - 100
                                                                    2 = There is a limited amount of imprisonment for
                                                                                                                                                                                                               1            1.5        2           2.5          3
                                                                    nonviolent political activity. However, few persons are
                                                                    affected, torture and beatings are exceptional. Political                                                                                   0 - 7.596   7.597 -    15.193 -     22.789 -     30.385 -
                                                                                                                                                                                                                            15.192     22.788       30.384       37.980
                                                                    murder is rare.
                                                                    3 = There is extensive political imprisonment, or a recent                                                                                 3.5          4          4.5         5
                                                                    history of such imprisonment. Execution or other political                                                                                 37.981 -     45.577 -   53.173 -     > 60.769
                                                                    murders and brutality may be common. Unlimited                                                                                             45.576       53.172     60.768
                                                                    detention, with or without a trial, for political views is
                                                                    accepted.
                                                                    4 = Civil and political rights violations have expanded to
                                                                    large numbers of the population. Murders, disappearances,
                                                                    and torture are a common part of life. In spite of its
                                                                    generality, on this level terror affects those who interest
                                                                    themselves in politics or ideas.
                                                                    5 = Terror has expanded to the whole population. The
                                                                    leaders of these societies place no limits on the means
                                                                    or thoroughness with which they pursue personal or
                                                                    ideological goals.


114                                                                                                                                                                                                                                                                       115
Annex A                                                                                                                                                                                                                                                                   Annex A


TerrorisT acts                                                               Number of deaths from                                                 external PEACE : 40%                                             Number of armed services
                                                                             organised conflict (internal)                                                                                                          personnel per 100,000 people

Weight (1 to 5)                                                          2
                                                                             Weight (1 to 5)                                                   5   Military expenditure                                             Weight (1 to 5)                                                      2
Type                                                       Quantitative
                                                                                                                                                   as a percentage of GDP
                                                                             Type                                                 Qualitative                                                                       Type                                                  Quantitative
Main source                      National Consortium for the
                            Study of Terrorism and Responses                 Main source                           International Institute for                                                                      Main source                       The International Institute for
                                        to Terrorism (START).                                               Strategic Studies Armed Conflict       Weight (1 to 5)                                             2                                     Strategic Studies, The Military
                                   Global Terrorism Database                                                            Database (IISS ACD)        Type                                            Quantitative                                                        Balance 2012
                               (2011), Institute for Economics               Year                                                      2010-11     Main source                    The International Institute for   Year                                                       2010-11
                                                      and Peace
                                                                                                                                                                                 Strategic Studies, The Military
Year                                                               2012      Alternate source                                                                                                      Balance 2012     Alternate source
                                                                             EIU. When no data was provided by the IISS ACD, then EIU              Year                                                  2010-11    When no data was provided, two alternative sources were
Definition                                                                   analysts have scored the figures available for 2010 and 2011                                                                           used: FIRST database - SIPRI BICC, and the Military
This indicator is a weighted average score relying on                        according to the set bands of the actual data.                                                                                         Balance 2011. Alternative data are from 2009-10. World
                                                                                                                                                   Alternate source
different types of attacks. Terrorism incidents are defined                                                                                                                                                         Bank population data used if unavailable from the EIU.
                                                                             Definition                                                            When no data was provided, several alternative sources
as “intentional acts of violence or threat of violence by a
                                                                                 This indicator uses the UCDP’s definition of conflict.            were used: National Public Expenditure Accounts, SIPRI           Definition
non-state actor”. For all incidents listed, at least two of the
                                                                             UCDP defines conflict as: “a contested incompatibility                information, and the Military Balance 2011. Alternative
following three criteria must be present:                                                                                                                                                                           Active armed services personnel comprise all servicemen
                                                                             that concerns government and/or territory where the use               data are from 2007 to 2010, depending upon data
1. The act must be aimed at attaining a political, economic,                                                                                                                                                        and women on full-time duty in the army, navy, air force
                                                                             of armed force between two parties, of which at least one             availability.
religious, or social goal.                                                                                                                                                                                          and joint forces (including conscripts and long-term
                                                                             is the government of a state, results in at least 25 battle-                                                                           assignments from the reserves). Population data provided by
2. There must be evidence of an intention to coerce,                                                                                               Definition
                                                                             related deaths in a year”. It excludes fatalities that took                                                                            the EIU.
intimidate, or convey some other message to a larger                                                                                               Cash outlays of central or federal government to meet the
                                                                             place during UN-mandated peacekeeping missions during
audience (or audiences) than the immediate victims.                                                                                                costs of national armed forces—including strategic, land,
                                                                             2010-11.
3. The action must be outside the context of legitimate                                                                                            naval, air, command, administration and support forces           SCORING CRITERIA
                                                                                 Statistics are compiled from the most recent edition              as well as paramilitary forces, customs forces and border
warfare activities.                                                                                                                                                                                                  1            1.5          2             2.5           3
                                                                             of the IISS ACD, which has the following definition of                guards if these are trained and equipped as a military force.
                                                                             armed conflict-related fatalities: ‘Fatality statistics relate to     Published EIU data on nominal GDP (or the World Bank              0 - 660.94   660.95 -     1,311.91 -    1,962.86 -     2,613.82 -
Scoring criteria                                                             military and civilian lives lost as a direct result of an armed       when unavailable) was used to arrive at the value of military
                                                                                                                                                                                                                                  1,311.90     1,962.85      2,613.81       3,264.76
                                                                             conflict’.                                                            expenditure as a percentage of GDP.
 1            1.5           2                 2.5            3                                                                                                                                                       3.5          4            4.5           5
                                                                                 The figures relate to the country which is the main
 0 - 3.369    3.370 -       11.362 -          38.301 -       129.110 -                                                                                                                                                3,264.77    3,915.73 -   4,566.68 -     >5,217.64
                                                                             area of conflict. For some conflicts no reliable statistics
              11.361        38.300            129.109        435.210                                                                               SCORING CRITERIA                                                  - 3,915.72   4,566.67     5,217.63
                                                                             are available. Estimates of war fatalities vary according to
 3.5          4             4.5                     5                        source, sometimes by a wide margin. In compiling data on              A sliding scale from 1 through 5 with bandings set at the 0.1
                                                                                                                                                                                                                    Additional notes
                                                                             fatalities, the IISS has used its best estimates and takes full       level of detail is used for this indicator.
 435.211 -    1,467.034 -       4,945.158 -         16,669.411                                                                                                                                                      Israel’s reservist force is used to calculate Israel’s number of
 1,467.033    4,945.157         16,669.410                                   responsibility for these figures. Some overall fatality figures
                                                                                                                                                                                                                    armed services personnel.
                                                                             have been revised in light of new information. Changes                 1            2           3           4           5
                                                                             in fatality figures may therefore occur as a result of such            0 - 3.11     3.12-6.39   6.4-9.67    9.68-        >12.97
Additional notes                                                             revisions as well as because of increased fatalities. Fatality                                              12.96
As recommended by the expert panel, this indicator which                     figures for terrorism may include deaths inflicted by the             Additional notes
uses the Global Terrorism Database has replaced the                          government forces in counter-terrorism operations.                    This year’s scoring system for this indicator has changed to
qualitative indicator ‘Potential for Terrorist Acts’.                                                                                              become more precise. Instead of using bandings at the 0.5
The weighting of this indicator has increased from 1 to 2 .                  Scoring criteria                                                      level, bandings at the 0.1 level are now used.
                                                                              1            2            3             4            5                  Iceland has no armed force. Budget is mainly for Coast
                                                                              0 - 24.8      24.9 -       999.9 -      4,999.9 -    > 9,999.9
                                                                                                                                                   Guards.
                                                                                            999.8        4,999.8      9,999.8                         For GDP data on Afghanistan and Montenegro, the
                                                                                                                                                   latest figures provided by the World Bank (2010) have been
                                                                                                                                                   used.


116                                                                                                                                                                                                                                                                                117
Annex A                                                                                                                                                                                                                                                    Annex A


Financial contribution                                               Aggregate weighted number                                         Volume of transfers of                                            Military capability/
to UN peacekeeping missons                                           of heavy weapons per 100,000 people                               major conventional weapons as                                     sophistication
                                                                                                                                       supplier (exports) per 100,000 people

Weight (1 to 5)                                                 2    Weight (1 to 5)                                               3                                                                     Weight (1 to 5)                                                2
                                                                                                                                       Weight (1 to 5)                                               3
Type                                                 Quantitative    Type                                             Quantitative                                                                       Type                                              Qualitative
                                                                                                                                       Type                                             Quantitative
Main source                           Institute for Economics and    Main source                        Institute of Economics and                                                                       Main source                      Economist Intelligence Unit
                                Peace; United Nations Committee                                       Peace; SIPRI; United Nations     Main source                              SIPRI Arms Transfers
                                                                                                                                                                                                         Year                                                  2011-12
                                                  on Contributions                                                                                                                        Database;
                                                                     Year                                                     2010
Year                                                       2008-10                                                                     Year                                                   2006-10
                                                                                                                                                                                                         Definition
                                                                     Definition                                                                                                                          Assessment of the grade of sophistication and the extent of
Definition                                                           This indicator is based on a categorised system for rating        Definition                                                        military research and development (R&D), ranked from 1-5
Calculates the percentage of countries’ “outstanding                 the destructive capability of heavy weapons. There are            Measures the total volume of major conventional weapons           (very low to very high) by the Economist Intelligence Unit’s
payments versus their annual assessment to the budget of             five categories of weapons, each of which receive a certain       exported by a country between 2006 and 2010 divided by            Country Analysis team.
the current peacekeeping missions” over an average of three          number of weighted points. The total is then divided by           the average population during this time period (population            Country analysts are asked to assess this indicator on an
years. This ratio is derived from United Nations Committee           the population at the 100,000 level. The five weapons             data supplied by the EIU).                                        annual basis, for the period March to March.
on Contributions Status reports.                                     categories are weighted as follows: each armoured vehicle             The SIPRI Arms Transfers Database covers all
                                                                     and artillery piece = 1 point; each tank = 5 points; each         international sales and gifts of major conventional weapons       Scoring criteria
                                                                     combat aircraft and combat helicopter = 20 points; each           and the technology necessary for the production of them.          1 = Very low: no investment in military R&D. Principal
SCORING CRITERIA
                                                                     warship = 100 points; and each aircraft carrier and nuclear       The transfer equipment or technology is from one country,         equipment is very old or obsolete.
 1            1.5           2             2.5          3             submarine = 1000 points.                                          rebel force or international organisation to another              2 = Low: minimal investment in military R&D. High
  0 - 1.71    1.72 - 3.43   3.44 -         5.16 -      6.88 -            Holdings are those of government forces and do not            country, rebel force or international organisation. Major         percentage of old and unsophisticated equipment.
                            5.15           6.87        8.59          include holdings of armed opposition groups. Heavy                conventional weapons include: aircraft, armoured vehicles,
                                                                                                                                                                                                         3 = Moderate: the country invests a small part of its military
                                                                     weapons numbers were determined using a combination               artillery, radar systems, missiles, ships and engines.
 3.5          4             4.5           5                                                                                                                                                              expenditure in R&D. Principal equipment is a mixture of
                                                                     of: the International Institute for Strategic Studies, The
                                                                                                                                        1            1.5        2           2.5           3              new and old and moderately sophisticated.
  8.60 -      10.32 -       12.04 -        >13.76                    Military Balance and the United Nations Register of
 10.31        12.03         13.75                                    Conventional Arms. Population data is supplied by the EIU.          0 - 2.972   2.973 -    5.945 -     8.918 -       11.891 -       4 = High: substantial investments in military R&D and in
                                                                                                                                                     5.944      8.917       11.890        14.863         maintenance. Principal equipment is relatively modern and
Additional notes                                                      1            1.5        2            2.5         3                                                                                 sophisticated and is well maintained.
All United Nations Member States share the costs of                                                                                     3.5          4          4.5         5
                                                                       0 - 23.62   23.63 -    47.26 -       70.89 -     118.16 -                                                                         5 = Very high: huge investment in military R&D and
United Nations peacekeeping operations. The General                                47.25      70.88         118.15      141.78          14.864 -     17.836 -   20.809 -    > 23.782                     armament production projects. Principal equipment is new
Assembly apportions these expenses based on a special                                                                                   17.835       20.808     23.781
                                                                                                                                                                                                         and highly sophisticated.
scale of assessments applicable to peacekeeping. This scale           3.5          4          4.5          5
takes into account the relative economic wealth of member              141.79 -    165.42 -    189.06 -     >212.69                                                                                       1            2           3           4           5
states, with the permanent members of the Security Council            165.41       189.05     212.68                                                                                                      Very low     Low         Moderate     High        Very high
required to pay a larger share because of their special
responsibility for the maintenance of international peace
and security.


118                                                                                                                                                                                                                                                                119
Annex A                                                                                                                                                                                                                                                     Annex A


Number of refugees and displaced                                  RELATIONS WITH NEIGHBOURING COUNTRIES                               NUMBER OF EXTERNAL AND INTERNAL                                    Estimated number of deaths from
people as a percentage of the population                                                                                              CONFLICTS FOUGHT                                                   organised conflict (external)
                                                                  Weight (1 to 5)                                                 5
Weight (1 to 5)                                              4                                                                        Weight (1 to 5)                                               5    Weight (1 to 5)                                                  5
                                                                  Type                                               Qualitative
Type                                            Quantitative                                                                          Type                                               Quantitative    Type                                               Quantitative
                                                                  Main source                      Economist Intelligence Unit
Main source                    UNHCR Statistical Yearbook                                                                             Main source                       UCDP/PRIO Armed Conflict         Main source                     UCDP/PRIO Armed Conflict
                                                                  Year                                                   2011-12
                             2010; The Internal Displacement                                                                                                                     Dataset v.4-2011                                                 Dataset v.4-2011
                                          Monitoring Centre
                                                                  Definition                                                          Year                                                    2004-09    Year                                                    2010-11
Year                                                       2010
                                                                     Assessment of the intensity of contentiousness of
                                                                  neighbours, ranked from 1-5 (peaceful to very aggressive) by        Alternate source                                                   Alternate source
Definition                                                        the Economist Intelligence Unit’s Country Analysis team. 	          Economist Intelligence Unit. Where there are data gaps, the        When no data was provided, several alternative sources have
Refugee population by country or territory of origin, plus            Country analysts are asked to assess this indicator on          EIU’s analysts have filled them based on likely scores from        been used: International Institute for Strategic Studies (IISS)
the number of a country’s internally displaced people (IDPs)      an annual basis, for the period March to March.                     the set bands of the actual data.                                  Armed Conflict Database; the Iraq Coalition Casualty
as a percentage of the country’s total population.                                                                                    Definition                                                         Count, and the Economist Intelligence Unit.
                                                                                                                                      This indicator measures conflicts, as defined by UCDP,
                                                                  Scoring criteria                                                                                                                       Definition
Scoring criteria                                                                                                                      which began in 2004 and were extant in 2004-09,
                                                                                                                                      irrespective of whether or not they ended during that period.      This indicator uses the UCDP’s definition of conflict
 1            1.5        2            2.5        3                1 = Peaceful: none of the neighbours has attacked the                                                                                  (see above). It excludes fatalities that took place during
                                                                  country since 1950.                                                     UCDP defines conflict as: “a contested incompatibility
  0 - 1.50     1.51 -    3.03 -       4.55 -      6.07 -                                                                              that concerns government and/or territory where the use of         UN-mandated peacekeeping missions during 2010-11.
              3.02       4.54         6.06        7.58            2 = Low: the relationship with neighbours is generally good,        armed force between two parties, of which at least one is          Calculating each country’s external conflict-related deaths
                                                                  but aggressiveness is manifest in politicians’ speeches or in                                                                          during 2010-11 involved consulting several sources.
                                                                                                                                      the government of a state, results in at least 25 battle-related
 3.5          4          4.5          5                           protectionist measures
                                                                                                                                      deaths in a year”.
 7.59 -       9.11 -     10.63 -       >12.15                     3 = Moderate: there are serious tensions and consequent                                                                                Scoring criteria
 9.10         10.62      12.14                                    economic and diplomatic restrictions from other countries
                                                                                                                                      Scoring criteria                                                    1            2           3            4            5
                                                                  4 = Aggressive: open conflicts with violence and protests
                                                                                                                                       1             1.5        2            2.5          3               0 - 24.8     24.9 -      999.9 -      4,999.9 -     > 9,999.9
                                                                                                                                                                                                                       999.8       4,999.8      9,999.8
                                                                  5 = Very aggressive: frequent invasions by neighbouring               0 - 0.5874   0.5875 -    1.075 -      1.5625 -     2.05 -
                                                                  countries.                                                                         1.074       1.5624       2.04         2.5374        Additional notes
                                                                                                                                       3.5           4          4.5          5                           For countries involved in the conflict in Afghanistan as part
                                                                   1            2          3            4            5
                                                                                                                                                                                                         of the NATO-led International Security Assistance Force
                                                                   Peaceful     Low         Moderate    Aggressive   Very              2.5375 -       3.025 -    3.5125 -     >4
                                                                                                                                                                                                         (which UCDP describe as “providing secondary warring
                                                                                                                     aggressive        3.024         3.5124      3.99
                                                                                                                                                                                                         support to the government of Afghanistan in the intra-state
                                                                                                                                      Additional notes                                                   conflict with the Taleban that began in 2003”), statistics of
                                                                                                                                      This year’s GPI has not updated the figures for this               fatalities provided by icasualties.org were used. This was
                                                                                                                                      indicator from the previous year, due to methodological            also the source for the number of fatalities recorded among
                                                                                                                                      issues surrounding the new data.                                   US and UK troops serving in the conflict in Iraq.
                                                                                                                                                                                                             For fatalities relating to the conflict between Armenia
                                                                                                                                                                                                         and Azerbaijan over Nagonro Karabakh, and relating to
                                                                                                                                                                                                         the conflict between India and Pakistan over Kashmir, the
                                                                                                                                                                                                         Armed Conflict Database compiled by the International
                                                                                                                                                                                                         Institute of Strategic Studies, adcd.iss.org is used.


120                                                                                                                                                                                                                                                                  121
Annex B


Annex B
SOCIO-ECONOMIC FACTORS


DEMOCRACY AND                                                   Definition                                                        Definition                                                        INTERNATIONAL
TRANSPARENCY                                                    Qualitative assessment of voter participation/turn-out for        Percentage of the total number of representatives in the          OPENNESS
                                                                national elections, citizens’ engagement with politics. Ranked    lower house.
                                                                from 1 to 10 (very low to very high) by the Economist
                                                                                                                                  Additional notes
                                                                Intelligence Unit’s Country Analysis team.
Democracy Index                                                                                                                   Figures are based on information provided by national
                                                                                                                                                                                                    Exports + Imports as a % of GDP
Main source                      Economist Intelligence Unit,                                                                     parliaments by December 31st 2011 (except for the                 Main source                Economist Intelligence Unit
                                                                Political culture
                                     Democracy Index 2011                                                                         Democratic Republic of Congo for which no data was
                                                                Main source                      Economist Intelligence Unit,                                                                       Year                       2011
                                                                                                                                  available for December at the time of collection; so October
Year                                                     2011                                        Democracy Index 2011
                                                                                                                                  2011 31st data was used).                                         Definition
Definition                                                      Year                                                      2011                                                                      Measure of merchandise goods exports free on board and
Qualitative assessment of the state of democracy in a                                                                             Gender inequality                                                 merchandise goods imports free on board.
                                                                Definition
country. Ranked from 1 to 10 (very low to very high)                                                                              Main source                        World Economic Forum,
by the Economist Intelligence Unit’s Country Analysis           Qualitative assessment of the degree of societal consensus                                                                          Additional notes
                                                                                                                                                              Global Gender Gap Report 2011
team. The overall Democracy index is based on five              and cohesion to underpin a stable, functioning democracy;                                                                           2010 data used for Mongolia and North Korea.
                                                                as well as the level of separation of church and state. Ranked    Year                                                       2011
categories: electoral process and pluralism; civil liberties;
the functioning of government; political participation; and     from 1 to 10 (very low to very high) by the Economist                                                                               Foreign Direct Investment (flow) as
                                                                                                                                  Definition
political culture.                                              Intelligence Unit’s Country Analysis team.                                                                                          a % of GDP
                                                                                                                                  A composite index that assesses countries on how well they
                                                                                                                                                                                                    Main source                       Economist Intelligence Unit
                                                                Civil liberties                                                   are dividing their resources and opportunities among their
Electoral process                                                                                                                 male and female populations, regardless of the overall levels     Year                                                     2011
Main source                      Economist Intelligence Unit,   Main source                      Economist Intelligence Unit,
                                                                                                                                  of these resources and opportunities.
                                     Democracy Index 2011                                            Democracy Index 2011                                                                           Definition
                                                                                                                                  Additional notes                                                  Net flows of direct investment capital by non-residents into
Year                                                     2011   Year                                                      2011
                                                                                                                                  2007 data used for Belarus and Uzbekistan.                        the country, as a percentage of GDP.
Definition                                                      Definition
                                                                Qualitative assessment of the prevalence of civil liberties. Is   Freedom of the press                                              Additional notes
Qualitative assessment of whether elections are competitive
                                                                there a free electronic media? Is there a free print media? Is                                                                      2010 data used for Central African Republic, Djibouti, and
in that electors are free to vote and are offered a range of                                                                      Main source                Reporters Without Borders,
                                                                there freedom of expression and protest? Are citizens free to                                                                       North Korea.
choices. Ranked from 1 to 10 (very low to very high) by the                                                                                                  World Press Freedom Index
Economist Intelligence Unit’s Country Analysis team.            form professional organisations and trade unions? Ranked                                     2011-12
                                                                from 1 to 10 (very low to very high).                                                                                               Number of visitors as a %
                                                                                                                                  Year                       2011                                   of domestic population
Functioning of
government                                                      Corruption perceptions                                            Definition                                                        Main source                 UNWTO Yearbook of Tourism
                                                                                                                                                                                                                                      Statistics, Compendium of
Main source                      Economist Intelligence Unit,                                                                     The index measures the state of press freedom in the world,
                                                                Main source                      Transparency International,                                                                                                    Tourism Statistics and data files;
                                     Democracy Index 2011                                                                         reflecting the degree of freedom journalists and news
                                                                                                Corruption Perceptions Index                                                                                                        Economist Intelligence Unit
                                                                                                                                  organisations enjoy in each country, and the efforts made by
Year                                                     2011                                                           2011
                                                                                                                                  the state to respect and ensure respect for this freedom.         Year                          2009-10, depending upon data
                                                                Year                                                      2011                                                                                                                      availability
Definition
                                                                                                                                  Additional notes
Qualitative assessment of whether freely elected                Definition                                                        A different scoring system has been used for the Press            Definition
representatives determine government policy and whether
                                                                The Index draws on multiple expert opinion surveys that poll      Freedom Index this year. Reporters without Borders states         Number of visitors as a percentage of the domestic
there is an effective system of checks and balances on the
                                                                perceptions of public sector corruption, scoring countries        that “In order to have a bigger spread in the scores and          population (population data supplied by the Economist
exercise of government authority. Ranked from 1 to 10
                                                                on a scale from 0 to 10, with 0 indicating high levels of         increase the differentiation between countries, this year’s       Intelligence Unit). Arrivals data correspond to international
(very low to very high) by the Economist Intelligence Unit’s
                                                                perceived corruption and 10 indicating low levels of perceived    questionnaire had more answers assigning negative points.         visitors to the economic territory of the country. International
Country Analysis team.
                                                                corruption.                                                       That is why countries at the top of the index have negative       inbound tourists (overnight visitors) are the number of
                                                                                                                                  scores this year. Although the point system has produced a        tourists who travel to a country other than that in which
Political participation                                         Women in parliament                                               broader distribution of scores than in 2010, each country’s       they usually reside, and outside their usual environment, for
Main source                      Economist Intelligence Unit,   Main source                        Inter-parliamentary Union      evolution over the years can still be plotted by comparing its    a period not exceeding 12 months and whose main purpose
                                     Democracy Index 2011                                                                         position in the index rather than its score.”                     in visiting is other than an activity remunerated from within
                                                                Year                                                      2011
                                                                                                                                                                                                    the country visited. When data on number of tourists are not
                                                                                                                                                                                                    available, the number of visitors, which includes tourists,


122                                                                                                                                                                                                                                                            123
Annex B                                                                                                                                                                                                                                             Annex B


same-day visitors, cruise passengers, and crew members, is      Extent of                                                        Primary school                                                  Adult literacy rate
shown instead.                                                  regional integration                                             enrolment ratio                                                 Main source                           UNESCO, Institute for
                                                                Main source                       Economist Intelligence Unit    Main source                            World Bank, World
                                                                                                                                                                                                                                                  Statistics
Net migration as a %                                                                                                                                           Development Indicators (WDI)
of total population                                             Year                                                      2011                                                                   Year                                2005-09, depending upon
                                                                                                                                 Year                           2001-10, depending upon data                                                  data availability
Main source               World Bank, World Development         Definition                                                                                                        availability
                                       Indicators (WDI)         Qualitative assessment of the level of membership of                                                                             Definition
                                                                trade alliances, as NAFTA, ASEAN, etc. Ranked from 1             Definition
Year                                                     2010                                                                                                                                    Refers to the % of population over the age of 15. Data
                                                                to 5 (very high integration to very low) by the Economist        The net enrolment ratio is the ratio of the number of           are based on national literacy estimates from censuses or
Definition                                                      Intelligence Unit’s Country Analysis team.Country analysts       children of official school age (as defined by the national     surveys.
Measure of merchandise goods exports free on board and          assess this indicator on an annual basis.                        education system) who are enrolled in school to the
                                                                                                                                 population of the corresponding official school age.            Additional notes
merchandise goods imports free on board.
                                                                Additional notes                                                                                                                 The UNDP’s Human Development Report is used as an
Additional notes                                                Scoring criteria:                                                Secondary school                                                alternate source when no data available from UNESCO.
2010 data used for Mongolia and North Korea.                    1 = Very high: the country belongs to an economic union.         enrolment ratio
                                                                There is freedom of movement for goods, people and capital
                                                                                                                                 Main source                            World Bank - World       CULTURE
                                                                (eg the European Union).
DEMOGRAPHICS                                                                                                                                                   Development Indicators (WDI)
                                                                2 = High: the country is a part of a free trade area (eg
                                                                                                                                 Year                           2001-10, depending upon data
                                                                NAFTA), and there are few sectoral restrictions. Or the
                                                                                                                                                                                  availability   Hostility to foreigners/
                                                                country enjoys a very high level of preferential access to a
15-34 year-old males as a                                                                                                                                                                        private property
                                                                major regional trade area.
% of adult population                                                                                                            Definition
                                                                                                                                                                                                 Main source                       Economist Intelligence Unit
                                                                3 = Moderate: the country is formally part of a free trade       The net enrolment ratio is the ratio of the number of
Main source               U.S. Census Bureau, International
                                                                area, but there are a large number of sectoral and other         children of official school age (as defined by the national     Year                                                      2011
                                            Database (IDB
                                                                restrictions (eg Mercosur or ASEAN). Or the country              education system) who are enrolled in school to the
Year                                                     2011   enjoys considerable preferential access to a major regional                                                                      Definition
                                                                                                                                 population of the corresponding official school age.
                                                                trade area.                                                                                                                      Qualitative assessment of the extent to which
Definition                                                                                                                                                                                       demonstrations/civil unrest or parties in armed conflict
                                                                4 = Low: formally may be a member of a trade regional            Higher education
Male population 15-34 year olds as a proportion of the                                                                                                                                           have specifically shown hostility to foreigners or private
                                                                grouping, but in practice, intra-bloc trade remains              enrolment
adult population.                                                                                                                                                                                ownership. Ranked from 1 to 5 (virtually no hostility to
                                                                significantly restricted and any preferential access to major    Main source                            World Bank, World        very high) by the Economist Intelligence Unit’s Country
                                                                regional trade areas is limited.                                                               Development Indicators (WDI)      Analysis team.
                                                                5 = Very low: not member of any regional trade grouping.
                                                                                                                                 Year                           2002-10, depending upon data       Country analysts assess this question on a quarterly
Gender ratio of population:
                                                                                                                                                                                  availability   basis. The score provided is the average of the scores given
women/men
                                                                EDUCATION                                                                                                                        for each quarter.
Main source                          UN Statistics Division                                                                      Definition
                                                                                                                                 The gross enrolment ratio is the ratio of total enrolment,      Additional notes
Year                                                     2011
                                                                                                                                 regardless of age, to the population of the age group that      Scoring criteria:
                                                                Current education
Definition                                                                                                                       officially corresponds to the level of education shown.         1 = Virtually no hostility to foreigners and/or private
                                                                spending as a % of GDP
Male population divided by the female population.                                                                                                                                                ownership.
                                                                Main source                            UNESCO, Institute for
                                                                                                                                 Mean years                                                      2 = Low hostility to foreigners and/or private ownership.
                                                                                                                  Statistics
                                                                                                                                 of schooling                                                    3 = Moderate hostility to foreigners and/or private
Additional notes                                                Year                           2001-11, depending upon data
                                                                                                                                 Main source                         UNESCO, Institute for       ownership.
2010 data used for Taiwan.                                                                                       availability
                                                                                                                                                                                Statistics       4 = High hostility to foreigners and/or private ownership.
                                                                                                                                 Year                       2001-11, depending upon data         5 = Very high hostility to foreigners and/or private
REGIONAL & INTERNATIONAL
                                                                Definition                                                                                                                       ownership.
FRAMEWORK/CONDITIONS                                                                                                                                                          availability
                                                                Total public spending on education as % of GDP.
                                                                                                                                 Definition
                                                                                                                                 School life expectancy (years), primary to tertiary.


124                                                                                                                                                                                                                                                          125
Annex B                                                                                                                                                                                                                                   Annex B


                                                                                                                                                                                               References


Willingness to fight                                             Nominal GDP                                                   Unemployment (%)                                                (2011). Human Security Report 2009/2010, The
Main source                       Economist Intelligence Unit
                                                                 (US$ bn)                                                      Main source                       Economist Intelligence Unit   Causes of Peace and the Shrinking Costs of War A.
                                                                 Main source                     Economist Intelligence Unit                                                                   Mack. New York Simon Frazer University, Canada.
Year                                                     2011                                                                  Year                                                     2011
                                                                 Year                                                   2011                                                                   (2011). World Development Report 2011 Conflict,
                                                                                                                               Definition                                                      Security, and Development Washington D.C World
Definition                                                       Definition                                                    Recorded official unemployment as a percentage of total         Bank
Qualitative assessment of the willingness of citizens to fight   Nominal gross domestic product US$ market prices.             labour force. The ILO defines the unemployed as members
in wars. Ranked from 1 to 5 (very low to very high) by the                                                                     of the economically active population who are without work      (April 2011). Violence in the City, Washington D.C.,
                                                                 Additional notes
Economist Intelligence Unit’s Country Analysis team.                                                                           but available for and seeking work, including people who        The World Bank 	
   Country analysts assess this indicator on an annual           2010 data used for Montenegro. 2009 data used for
                                                                                                                               have lost their jobs and those who have voluntary left work.
basis.                                                           Afghanistan, North Korea and Somalia.                                                                                         Collier, P. (2007). The Bottom Billion, New York
                                                                                                                               Additional notes                                                Oxford University Press.	
Additional notes                                                 GDP per capita                                                When no data was available, the ILO was used as an
1 = Very low: no compulsory military service or conscription.                                                                  alternate source (2000-11, year depending upon data             Cortright, D. (2008). Peace, A History of Movements
                                                                 Main source                     Economist Intelligence Unit
A small standing army. Mass demonstrations against any                                                                         availability).                                                  and Ideas, New York Cambridge University Press.	
                                                                 Year                                                   2011
government attempt to engage in warfare abroad.
                                                                                                                                                                                               Gangopadhyay, P. (2009). Peace Science: Theory and
2 = Low: no compulsory military service. Conscription            Definition
                                                                                                                               Life expectancy
                                                                                                                                                                                               Cases. United Kingdom Emerald Group Publishing 	
exists, but generally unpopular. Some protests and                                                                             Main source                            World Bank, World
                                                                 Nominal gross domestic product (US$) per capita.
demonstrations against any attempt to wage war abroad.                                                                                                       Development Indicators (WDI)      Gangopadhyay, P. (2011). Economics of Rivalry,
3 = Moderate: compulsory military service for up to one          Additional notes
                                                                                                                               Year                                                     2009   Conflict and Cooperation Singapore, World Scientific
year. Conscription exists but only moderately supported.         2010 data used for Montenegro. 2009 data used for
Relatively few supporting civilian forces.                       Afghanistan, North Korea and Somalia.                                                                                         Karstedt, S. and M. Eisner (2009). “Is a General
                                                                                                                               Definition
4 = High: compulsory military service for 1- 2 years and                                                                                                                                       Theory of Violence Possible?” International Journal of
                                                                                                                               Life expectancy at birth is the number of years a newborn
conscription generally accepted but not popular. Most            Gini coefficient                                              infant would live if prevailing patterns of mortality at the    Conflict and Violence 3(1): pp4-8.	
military in standing forces.                                     Main source                    UNDP, Human Development        time of its birth were to stay the same throughout its life.
                                                                                                                                                                                               Loader, I. and N. Walker (2007). Civilizing Security
5 = Very high: compulsory military service for more                                                         Report 2011
                                                                                                                                                                                               New York Cambridge University Press.
than two years and conscription historically entrenched.         Year                         2000-10, depending upon data     Infant mortality rate
Large territorial army. Unwillingness to stage anti-war                                                         availability   Main source                            World Bank, World        Hegre and Sambanis, “Sensitivity Analysis of
demonstrations against government.                                                                                                                           Development Indicators (WDI)      Empirical Results on Civil War Onset,” Journal of
                                                                 Definition
                                                                                                                               Year                                                     2010
                                                                                                                                                                                               Conflict Resolution 50, no. 3 (August 2006): 508-535
MATERIAL                                                         The Gini index measures the extent to which the
                                                                 distribution of income among individuals or households                                                                        The Cingranelli-Richards (CIRI) Human Rights
WELL-BEING                                                                                                                     Definition
                                                                 within an economy deviates from a perfectly equal                                                                             Dataset, David L. Cingranelli and David L. Richard,
                                                                                                                               Infant mortality rate is the number of infants dying before
                                                                 distribution.                                                                                                                 2010, Dataset Version: 2011.12.09 URL: http://www.
                                                                                                                               reaching one year of age, per 1,000 live births in a given
                                                                                                                               year.                                                           humanrightsdata.org
Nominal GDP                                                      Additional notes
(US$PPP bn)                                                      When data was missing, the World Bank was used as an
Main source                       Economist Intelligence Unit    alternate source, as well as estimates from the Economist
                                                                 Intelligence Unit’s country analysts.
Year                                                     2011

Definition
Nominal gross domestic product at 2005 US$ purchasing
power parities. 2010 data used for Montenegro. Analysis
team.

Additional notes
Nominal gross domestic product at 2005 US$ purchasing
power parities. 2010 data used for Montenegro. 	
2009 data used for Afghanistan, North Korea and Somalia.


126                                                                                                                                                                                                                                               127
endnotes


1
  The definition of violence is adapted from the World    11
                                                            World Economic Forum’s Global Competitiveness
Health Organization: ‘the intentional use of physical     Report is available here: http://www3.weforum.org/docs/
force or power, threatened or actual, against oneself,    WEF_GCR_Report_2011-12.pdf methodology section on
another person, or against a group or community, that     pp 48 for further detail.
either results in or has a high likelihood of resulting   12
                                                            Heritage Foundation Index of Economic Freedom,
in injury, death, psychological harm, destruction of
                                                          business freedom sub indicator methodology can be found
property, maldevelopment, or deprivation’.
                                                          here: http://www.heritage.org/index/business-freedom
2
    Refer to Annex A for a full list of GPI indicators.   13
                                                            World Economic Forum, Global Gender Gap Report
3
 Galtung, J. (1985). Twenty-Five Years of Peace           2011. URL: http://www3.weforum.org/docs/WEF_
Research: Ten Challenges and Some Responses. Journal      GenderGap_Report_2011.pdf
of Peace Research, 22 (2), 141-158.                       14
                                                            Indices of Social Development, URL: http://www.
4
    Ibid.                                                 IndSocDev.org/
5
 Human Security Report 2009-2010, The Causes of           15
                                                            Indices of Social Development, URL: http://www.
Peace and the Shrinking Costs of War, Human Security      IndSocDev.org/
Report Project, Oxford University Press pp36
                                                           Freedom House, Freedom of the Press Index: http://
                                                          16

6
    Ibid. pp35                                            www.freedomhouse.org/sites/default/files/2012%20
                                                          Methodology.pdf
7
 Hegre and Sambanis, “Sensitivity Analysis of
Empirical Results on Civil War Onset,” Journal of         17
                                                               Ibid.
Conflict Resolution 50, no. 3 (August 2006): 508-535      18
                                                            Reporters Without Borders, World Press
8
  Significance (or significance threshold) is the         Freedom 2012 Index. URL: http://en.rsf.org/IMG/
qualitative level at which IEP considers that a           CLASSEMENT_2012/C_GENERAL_ANG.pdf
relationship between two variables is meaningful.         Methodology available here: http://www.rsf.org/IMG/
Statistical significance (significance level) indicates   pdf/note_methodo_en.pdf
something that passes the appropriate statistical test    19
                                                            For the full list of sources informing the World
(for correlation, the t-test which distinguishes the
                                                          Communication/ICT Indicators database refer to the
correlation from zero). All correlations presented,
                                                          United Nations URL: http://mdgs.un.org/unsd/mdg/
other than societal attitudes, have a determined level
                                                          SeriesDetail.aspx?srid=605
of significance > 0.5 or < - 0.5. The threshold for
a meaningful correlation from global surveys was          20
                                                            Control of Corruption, World Bank, World Governance
considered more appropriate at > 0.4 or < -0.4.           Indicators URL: http://info.worldbank.org/governance/
                                                          wgi/pdf/cc.pdf
9
 Some data points for the Inequality Adjusted Human
Development Index are missing, so the standard HDI        21
                                                            Transparency International Corruptions Perceptions
measure has been supplemented for countries missing       Index URL: http://www.transparency.org/content/
the IHDI. Those countries are: Afghanistan, Malaysia,     download/64426/1030807
Japan, Botswana, Papua New Guinea, New Zealand,           22
                                                            Note this is only the GPI rank calculated for the 108
Libya, Iran, Bahrain, Qatar, Myanmar, Kuwait,
                                                          positive peace countries. Actual full GPI ranks are likely
Equatorial Guinea, Algeria and Saudi Arabia.
                                                          to differ.
10
  A dichotomous 1-0 scoring system (1 for a yes and       23
                                                            The PPI scores have been brought on average closer to
0 for a no answer), a three point system allows for 0.5
                                                          the GPI score by subtracting the difference between the
scores.
                                                          global GPI average and the global PPI average.


128                                                                                                                    129
PO Box 42, St. Leonards, Sydney NSW 1590, Australia
      email: info@economicsandpeace.org web: www.economicsandpeace.org

                       ©Institute for Economics and Peace 2012


130

2012 Global Peace Index Report

  • 1.
    institute for economicsand peace global peace index 2012 1
  • 2.
    The Institute for Economicsand Peace global Quantifying peace and its benefits peace index The Institute for Economics and Peace (IEP) is an independent, non-partisan, non-profit research 2012 organization dedicated to shifting the world’s focus to peace as a positive, achievable, and tangible measure of human well-being and progress. IEP achieves its goals by developing new This is the sixth edition of the Global Peace Index peaceful environments. conceptual frameworks to define peacefulness; (GPI), which ranks nations according to their level In the spirit of deepening knowledge and providing metrics for measurement; uncovering the of peacefulness. It is composed of 23 qualitative and understanding of the relative peacefulness of nations, relationship between peace, business and prosperity; quantitative indicators from highly respected sources, IEP has developed the first known attempt to quantify and by promoting a better understanding of the which gauge three broad themes: the level of safety measures of positive peace through the Positive Peace cultural, economic and political factors that drive and security in society; the extent of domestic or Index (PPI). This study measures the strength of the peacefulness. international conflict; and the degree of militarisation. attitudes, institutions, and structures within nations IEP has offices in Sydney, New York, and The 2012 GPI has been expanded to rank 158 which sustain peace. This provides a framework Washington, D.C. It works with a wide range of independent states and updated with the latest to determine a nation’s institutional capacity and partners internationally and collaborates with available figures and information. resilience to fundamentally create and maintain a intergovernmental organizations on measuring and This year’s report is divided into three main peaceful society. communicating the economic value of peace. sections; the first is the methodology, results and findings from the 2012 index, the second is an analysis of trends in peacefulness since the inception of the GPI in 2007, and the final section is IEP’s first For more information: attempt at defining a Positive Peace Index. www.economicsandpeace.org The methodology, results and findings section www.visionofhumanity.org provides highlights for the ten most and least peaceful countries, as well as for the five most improved and five most deteriorated over the one-year period. Indicator sources and weights are provided along with explanation on the changes to the methodology. The trends in peacefulness analysis tracks key global trends in peace over the past six years and utilises the GPI’s comprehensive 23 indicator dataset to understand nuanced changes in the many multidimensional aspects of peace. The data has been evaluated against many other socio-economic factors to understand key correlations and associations with 2 3
  • 3.
    Contents Contents Methodology, Risers and fallers 52 Results Indicator trends 52 and Findings Correlation trends 56 Highlights 7 Corruption 58 2012 Global Peace Index rankings 8 GDP per capita 60 Constructing the Index 10 Quintile analysis 63 Measuring states of peace 10 The research team 10 Positive The indicators 11 Peace Index Changes to the methodology 2012 12 EXECUTIVE SUMMARY 67 Analysis of the results 13 Introduction 69 Regional overview 13 Why a Positive Peace Index? 70 The ten countries most at peace 18 Methodology 71 The ten countries least at peace 23 Results 80 Risers and fallers 29 Positive peace gap 81 Top-five national improvements in peacefulness 29 Positive peace deficit case study 90 Top-five national deteriorations in peacefulness 31 Positive peace by region 93 Methodological notes 34 Positive peace by income group 101 Weighting the Index 34 Qualitative scoring 35 Positive peace by government type 102 Positive peace by indicator domain 104 Trends in Trends in individual positive peace indicators 107 Peacefulness Conclusion 109 Highlights 37 Annex A Trends in peacefulness from 2009-2012 38 GPI indicator sources, definitions and scoring criteria 110 Methodology of trend analysis 40 Twenty year trends 40 Annex B Overall trend 45 socio - economic factors 122 By region 45 References 127 Sub-Saharan Africa 46 Endnotes 128 By government type 50 Internal Peacefulness 51 4 5
  • 4.
    HIGHLIGHTS the main developments in 2012 deteriorations in several measures of militarisation. Sri Lanka experienced the greatest improvement in its Calculating the 2012 Global Peace Index (GPI) by overall peacefulness, following the ending of decades examining 23 indicators across 158 countries reveals of civil war. that the world has become slightly more peaceful War-ravaged Somalia remains the country least in the past year. This follows two consecutive years at peace in 2012 for the second successive year, when an overall decline in peacefulness was observed; with ongoing conflict in several regions (with the many countries experienced growing instability and notable exception of Somaliland). Afghanistan’s score METHODOLOGY heightened disharmony linked to rapid rises in food, deteriorated and it dropped to the second-lowest fuel, and commodity prices and the global economic position. Syria’s descent into civil war caused its score downturn. to deteriorate by the largest margin and it dropped by RESULTS There were improvements in the overall scores across all regions, apart from the Middle East and 31 places, to 147th position. Among the GPI indicators, ‘Level of perceived & FINDINGS North Africa, where many countries experienced criminality in society’ registered the largest year-on- waves of uprisings, protests and revolutions, sparked year change from the 2011 GPI, showing a substantial by the Arab Spring. GPI scores deteriorated most deterioration. The five indicators showing the most sharply in Syria, Egypt and Tunisia. The Asia- significant year-on-year deterioration were all Pacific region experienced the largest average rise in measures of the security situation and reflected the peacefulness, with the most significant gains in Sri upheaval and turmoil that has rippled across the Arab Lanka, Bhutan, Philippines and Nepal. Sub-Saharan world and beyond. The Political Terror Scale showed the greatest Syria’s descent into civil war caused improvement and there were gains in several its score to deteriorate by the largest indicators of militarisation as defence budgets were margin and it dropped by 31 places, to squeezed. 147th position. Africa became slightly more peaceful, with notable improvements in Zimbabwe, Madagascar and Gabon and, for the first time since the GPI was launched in 2007, it is not the least peaceful region—that dubious honour falls to the Middle East and North Africa this year. Iceland is, for the second successive year, the country most at peace, followed by Denmark and New Zealand. Small, stable democracies again dominate the top ten. Qatar is the highest-placed Middle-Eastern country (and non-democracy), in 12th position. Bhutan moved into the top 20 for the first time, mainly as a result of easing tensions surrounding ethnic Nepali refugees. Norway dropped out of the top ten to 18th position, the result of the violent attack by Anders Breivik in July 2011, killing 77 and injuring more than 300. Norway also saw 6 7
  • 5.
    2012 global peace index rankings mostpeaceful least peaceful no data Rank Country Score Rank Country Score 1 Iceland 1.113 29 United Kingdom 1.609 56 Djibouti 1.881 85 Ecuador 2.028 109 Belarus 2.208 137 Ethiopia 2.504 2 Denmark 1.239 30 Chile 1.616 58 Mongolia 1.884 85 Swaziland 2.028 110 Uzbekistan 2.219 138 Burundi 2.524 2 New Zealand 1.239 31 Botswana 1.621 59 Oman 1.887 87 Equatorial Guinea 2.039 111 Egypt 2.220 139 Myanmar 2.525 4 Canada 1.317 32 Romania 1.627 60 Malawi 1.894 88 United States of 111 El Salvador 2.220 140 Zimbabwe 2.538 5 Japan 1.326 33 Uruguay 1.628 61 Panama 1.899 America 2.058 113 Jamaica 2.222 141 Georgia 2.541 6 34 Vietnam 1.641 62 Jordan 1.905 89 China 2.061 114 Benin 2.231 142 India 2.549 Austria 1.328 6 35 Croatia 1.648 63 Indonesia 1.913 90 Dominican 115 Armenia 2.238 143 Yemen 2.601 Ireland 1.328 36 Costa Rica 1.659 64 Republic 2.068 116 144 8 Slovenia 1.330 Serbia 1.920 Niger 2.241 Colombia 2.625 37 91 Bangladesh 2.071 9 Finland 1.348 Laos 1.662 65 Bosnia and 117 Turkmenistan 2.242 145 Chad 2.671 38 Herzegovina 1.923 92 Guinea 2.073 10 Switzerland 1.349 Italy 1.690 118 Bahrain 2.247 146 Nigeria 2.801 66 93 Papua New 11 Belgium 1.376 39 Bulgaria 1.699 Albania 1.927 119 Rwanda 2.250 147 Libya 2.830 66 Guinea 2.076 12 Qatar 1.395 40 France 1.710 Moldova 1.927 120 Kenya 2.252 147 Syria 2.830 94 Trinidad and 13 41 Estonia 1.715 68 Macedonia (FYR) 1.935 121 Algeria 2.255 149 Pakistan 2.833 Czech Republic 1.396 Tobago 2.082 14 42 South Korea 1.734 69 Guyana 1.937 122 Eritrea 2.264 150 Israel 2.842 Sweden 1.419 95 Angola 2.105 15 43 Lithuania 1.741 70 Cuba 1.951 123 Venezuela 2.278 151 Central African Germany 1.424 95 Guinea-Bissau 2.105 16 44 Argentina 1.763 71 Ukraine 1.953 124 Guatemala 2.287 Republic 2.872 Portugal 1.470 97 Cameroon 2.113 17 45 Latvia 1.774 72 Tunisia 1.955 125 Mauritania 2.301 152 North Korea 2.932 Hungary 1.476 98 Uganda 2.121 18 46 United Arab 73 Cyprus 1.957 126 Thailand 2.303 153 Russia 2.938 Norway 1.480 99 Madagascar 2.124 Emirates 1.785 74 Gambia 1.961 127 154 Democratic 19 Bhutan 1.481 99 Tajikistan 2.124 South Africa 2.321 47 Kuwait 1.792 75 Gabon 1.972 Republic of the 20 Malaysia 1.485 101 Liberia 2.131 128 Iran 2.324 48 Mozambique 1.796 76 Paraguay 1.973 Congo 3.073 21 Mauritius 1.487 102 Mali 2.132 129 Honduras 2.339 49 Namibia 1.804 77 155 Iraq 3.192 22 Australia 1.494 Greece 1.976 103 130 Turkey 2.344 Sri Lanka 2.145 156 Sudan 3.193 50 Ghana 1.807 78 Senegal 1.994 131 23 Singapore 1.521 104 Republic Kyrgyz Republic 2.359 51 Zambia 1.830 79 157 Afghanistan 3.252 24 Peru 1.995 of Congo 2.148 132 Azerbaijan 2.360 Poland 1.524 158 Somalia 3.392 52 Sierra Leone 1.855 80 Nepal 2.001 105 25 Spain 1.548 Kazakhstan 2.151 133 Philippines 2.415 53 Lesotho 1.864 81 Montenegro 2.006 106 26 Slovakia 1.590 Saudi Arabia 2.178 134 Cote d’Ivoire 2.419 54 Morocco 1.867 81 Nicaragua 2.006 107 27 Taiwan 1.602 Haiti 2.179 135 Mexico 2.445 55 Tanzania 1.873 83 Brazil 2.017 108 28 Netherlands 1.606 Cambodia 2.207 136 Lebanon 2.459 56 Burkina Faso 1.881 84 Bolivia 2.021 8 9
  • 6.
    Constructing the index Constructing the index Measuring states of peace a range of potential determinants, or “drivers”, which Peace Research (AIPAZ), Madrid, Spain Societal safety may influence the creation and nurturance of peaceful and security Dr Ekaterina Stepanova Peace is notoriously difficult to define. Perhaps the societies, both internally and externally. Level of perceived criminality in society simplest way of approaching it is in terms of harmony Head, Unit on Peace and Conflict Studies, Institute Qualitative assessment by Economist Intelligence Unit achieved by the absence of war or conflict. Applied to of the World Economy and International Relations analysts nations, this would suggest that those not involved in The research team (IMEMO), Russian Academy of Sciences, Moscow. violent conflicts with neighbouring states or suffering The GPI was founded by Steve Killelea, an Australian internal wars have achieved a state of peace, which Number of refugees and displaced people as a technology entrepreneur and philanthropist. It is The indicators has been described as a “negative peace”. percentage of the population produced by the Institute for Economics and Peace. In attempting to gauge peacefulness, the GPI The GPI is collated and calculated by the Economist UNHCR Statistical Yearbook and the Internal The GPI comprises 23 indicators measuring the investigates the extent to which countries are involved Intelligence Unit, with whom sections of this report Displacement Monitoring Centre (IDMC) absence of voilence or fear of voilence. Selected with in ongoing domestic and international conflicts. It are written in co-operation. the assistance of an international panel of independent Political instability also seeks to evaluate the level of harmony or discord experts. All scores for each indicator are “banded”, Qualitative assessment by Economist Intelligence Unit AN ADDITIONAL AIM OF THE GPI IS TO EXPLORE An international panel of independent experts played either on a scale of 1-5 (for qualitative indicators) or analysts THE CONCEPT OF A “POSITIVE PEACE”. a key role in establishing the Global Peace Index in 1-9 (for quantitative data). The Economist Intelligence 2007—in selecting the indicators that best assess a Unit’s team of country analysts has scored eight Political Terror Scale within a nation; ten indicators broadly assess what nation’s level of peace and in assigning a weighting to of the nine qualitative indicators. They have also Qualitative assessment of Amnesty International and might be described as safety and security in society. each of them. The panel has overseen each edition of provided estimates where there have been gaps in US Department of State yearly reports The assertion is that low crime rates, minimal the GPI; this year, it included: the quantitative data. A detailed explanation of the incidences of terrorist acts and violent demonstrations, Terrorist acts scoring criteria used for each indicator is supplied in harmonious relations with neighbouring countries, Global Terrorism Database, University of Maryland a stable political scene and a small proportion of the Professor Kevin P. Clements, chairperson Annex A. and Institute for Economics and Peace population being internally displaced or refugees can Foundation Chair of Peace and Conflict Studies and Director, National Centre for Peace and Conflict Ongoing domestic and Number of homicides per 100,000 people be equated with peacefulness. international conflict United Nations Office on Drugs and Crime (UNODC) Eight further indicators are related to a country’s Studies, University of Otago, Dunedin, New Zealand Number of external and internal conflicts fought military build-up—reflecting the assertion that Dr Ian Anthony Level of violent crime Uppsala Conflict Data Program (UCDP), University the level of militarisation and access to weapons is Research co-ordinator and Leader of the Arms Qualitative assessment by Economist Intelligence Unit of Uppsala, Sweden and the Centre for the Study of directly linked to how at peace a country feels, both Control and Non-proliferation Programme, analysts Civil War at PRIO (International Peace Research domestically and internationally. Comparable data on Stockholm International Peace Research Institute Institute Oslo) Likelihood of violent demonstrations military expenditure as a percentage of GDP and the (SIPRI), Sweden number of armed service officers per head are gauged, Qualitative assessment by Economist Intelligence Unit Estimated number of deaths from organised conflict as are financial contributions to UN peacekeeping Professor Sultan Barakat (external) analysts missions. Director, Post-war Reconstruction and Development UCDP, University of Uppsala, Sweden and the Centre Number of jailed population per 100,000 people An additional aim of the GPI is to explore the Unit (PRDU), Department of Politics, University of for the Study of Civil War at PRIO International Centre for Prison Studies, University of concept of a “positive peace”. Various studies have York, United Kingdom Essex proposed that a culture of peace might be based Number of deaths from organised conflict (internal) Mr Nick Grono International Institute for Strategic Studies (IISS) on human rights, gender equality, democratic Number of internal security officers and police per Deputy President International Crisis Group (ICG), Armed Conflict Database participation, tolerant solidarity, open communication 100,000 people Brussels, Belgium and international security. However, these links Level of organised conflict (internal) UNODC between peace and its causes tend to be presumed, Dr Toshiya Hoshino Qualitative assessment by Economist Intelligence Unit rather than systematically measured. This report also Professor, Osaka School of International Public Militarisation analysts examines relationships between the GPI and reliable Policy, Osaka University, Japan Military expenditure as a percentage of GDP international measures, including democracy and Relations with neighbouring countries IISS, The Military Balance Dr Manuela Mesa Qualitative assessment by Economist Intelligence transparency, education and material wellbeing. As Director, Centre for Education and Peace Research Unit analysts such, it seeks to understand the relative importance of (CEIPAZ) and President, Spanish Association for 10 11
  • 7.
    Constructing the index Analysis of the Results Number of armed-services personnel per 100,000 Maryland, would be a useful addition to the GPI. This Regional overview Western Overall Overall Regional people year it has been included (named Terrorist acts) and it Europe Rank Score Rank IISS, The Military Balance replaces the qualitative indicator Potential for terrorist Western Europe remains markedly the most peaceful Belgium 11 1.38 7 acts, which was scored by Economist Intelligence region, with the majority of the countries in this Volume of transfers of major conventional weapons group ranking in the top 20 overall. The average GPI Sweden 14 1.42 8 Unit analysts. The weighting of this indicator was as recipient (imports) per 100,000 people score in 2011 for the region improved slightly, after Germany 15 1.42 9 increased from 1 to 2. Stockholm International Peace Research Institute The remaining eight qualitative indicators that are deteriorations in the two previous years associated Portugal 16 1.47 10 (SIPRI) Arms Transfers Database scored by Economist Intelligence Unit analysts refer with the global financial and economic crisis. Between Norway 18 1.48 11 to the period 16th March 2011 to 15th March 2012, 2007 (the first year of the GPI) and 2009 the region Spain 25 1.55 12 in line with the approach last year, when the review became more peaceful. Norway dropped out of Netherlands 28 1.61 13 Volume of transfers of major conventional weapons period was amended to take account of the events that the top ten for the first time, to 18th position, the United as supplier (exports) per 100,000 people unfolded in the Middle East and North Africa last result of the violent attack by Anders Breivik in July Kingdom 29 1.61 14 SIPRI Arms Transfers Database spring. 2011, killing 77 and injuring more than 300. There Italy 38 1.69 15 The panel recommended that the weighting of were also deteriorations in several GPI gauges of the Financial contribution to UN peacekeeping missions France 40 1.71 16 ‘Level of perceived criminality’ in society should be country’s militarisation. Three Nordic nations are United Nations Committee on Contributions and Cyprus 73 1.96 17 reduced from 4 to 3. The scoring system for ‘Military again ranked in the GPI’s top ten, with high levels of Institute for Economics and Peace Greece 77 1.98 18 expenditure as a percentage of GDP’ was adjusted safety and security indicating broadly harmonious Aggregate weighted number of heavy weapons per societies, free from civil conflict. Average 23 1.50 from bandings of 0.5 to a sliding scale of 0.1 to 100,000 people provide a more precise coverage. Sweden ranks lower than its Scandinavian IISS, The Military Balance and Institute for Economics neighbours (14th) on account of its thriving arms- Greece’s score deteriorated for the fourth successive This brings the total coverage in the 2012 and Peace manufacturing industry and the volume of exports of year, and by the second-largest margin in the GPI to 158 nations, encompassing more conventional weapons. As in previous editions of the region, behind Norway, with an increasing risk Ease of access to small arms and light weapons than 99% of the world’s population. GPI, the majority of the Western European nations of demonstrations and rises in the level of violent Qualitative assessment by Economist Intelligence Unit The scores for 10 countries for ‘Number of recorded only small year-on-year changes to their crime linked to the ongoing sovereign debt crisis and analysts homicides per 100,000’ people were “smoothed” scores. Spain experienced the largest improvement, spiralling unemployment. It tumbled to 77th position, Military capability/sophistication owing to the availability of new and more reliable in part owing to the Basque separatist group, ETA, replacing Cyprus as the lowest-ranked nation in Qualitative assessment by Economist Intelligence data. This has reduced some substantial movements announcing a “definitive cessation” to its campaign the region, in spite of an austerity-induced sharp Unit analysts in scores that may not accurately reflect conditions in of bombings and shootings, which lasted for more drop in military expenditure. Very large numbers of a country and could lead to false assumptions being than 40 years and killed more than 800 people. The heavy weapons per head in both Greece and Cyprus made. Political Terror Scale also registered an improvement continue to contribute to their relatively high overall changes to the methodology 2012 Data for ‘Number of external and internal in Spain and there was a drop in military expenditure scores and low ranks. The UK and France have conflicts fought’ remains the same as those used in the as austerity measures kicked in. Switzerland’s score been accorded low positions compared with their The advisory panel that oversees the compilation of 2011 GPI owing to methodological issues concerning improved by the second-largest margin in the region neighbouring countries in previous editions of the the GPI agreed to include five additional countries the latest data. and the country moved into the top ten for the first GPI, owing to their sophisticated military spheres, in the 2012 edition: Benin, Djibouti, Guinea-Bissau, time. substantial arms exports, involvement in external Lesotho and Mauritius. This brings the total coverage conflicts and relatively high homicide rates. This year, in the 2012 GPI to 158 nations, encompassing more Western Overall Overall Regional the UK’s score improved slightly, although it dropped than 99% of the world’s population. Europe Rank Score Rank to 29th place, with falls in military expenditure and Subsequent editions of the GPI will include other Iceland 1 1.11 1 an improvement in its rank in the Political Terror nations, but not micro-states; the panel and the Denmark 2 1.24 2 Scale just outweighing mounting political instability, compilers agreed that countries covered by the GPI an increased likelihood of violent demonstrations and must either have a population of more than 1 million Austria 6 1.33 3 a rise in violent crime linked to a spate of riots and or a land area greater than 20,000 square kilometers. Ireland 6 1.33 3 disturbances in August 2011. The panel recommended that the Global Terrorism Finland 9 1.35 5 North America experienced a slight Database, an authoritative and up-to-date quantitative Switzerland 10 1.35 6 improvement, continuing a trend since 2007. There measure of terrorist acts compiled by the University of 12 13
  • 8.
    Analysis of Analysis of the results the results was an upturn in Canada’s score and ranking (to Boris Tadic; a pro-EU coalition presided over a Central scene. Ongoing internal conflicts and related security fourth position) as a result of a reduction in the modest economic recovery in 2011. There were also and Eastern Overall Overall Regional concerns in Afghanistan and Pakistan explain their number of deaths from external conflict (fewer improvements in some of Serbia’s GPI measures of Europe Rank Score Rank continued presence in the bottom ten of the GPI. The casualties among Canadian troops stationed in militarisation. Kazakhstan 105 2.15 20 lowly positions of North Korea (152nd) and Myanmar Afghanistan). The US’s overall score also improved Tajikistan heads the Caucasian and Central Asian (139th) reflect tense security situations and very high Belarus 109 2.21 21 slightly, although it slipped seven places to 88th nations for the first time, in 99th position, amid an levels of militarisation, although both experienced Uzbekistan 110 2.22 22 position as a result of larger gains in several countries improving security situation and a decline in military improvements and more benign environments in 2011. Armenia 115 2.24 23 previously ranked below it. The US’s fairly low rank expenditure to a very low level. Kyrgyz Republic largely reflects much higher levels of militarisation experienced the largest deterioration in peacefulness, Turkmenistan 117 2.24 24 Asia- Overall Overall Regional and involvement in external conflicts than its northern with a decline in respect for human rights (the Turkey 130 2.34 25 Pacific Rank Score Rank neighbour. Several measures of societal safety and Political Terror Scale) linked to the revolution in Kyrgyz New Zealand 2 1.24 1 security also receive higher scores, including the April 2010 and subsequent clashes between Kyrgyz Republic 131 2.36 26 Japan 5 1.33 2 proportion of people in jail. and Uzbek ethnic communities in the southern cities Azerbaijan 132 2.36 27 Bhutan 19 1.48 3 of Osh and Jalalabad. There was also an increase in Georgia 141 2.54 28 Malaysia 20 1.49 4 North Overall Overall Regional the country’s jailed population to 267 per 100,000, a Russia 153 2.94 29 America Rank Score Rank lower proportion of its population than in Kazakhstan Australia 22 1.49 5 Average 74 1.96 and Uzbekistan, but higher than in Turkmenistan and Singapore 23 1.52 6 Canada 4 1.32 1 Tajikistan. Taiwan 27 1.60 7 United States of The Asia Pacific region is on average the fourth-most America 88 2.06 2 Vietnam 34 1.64 8 peaceful region. Its overall GPI score improved by Average 46 1.69 Central Laos 37 1.66 9 and Eastern Overall Overall Regional the largest extent from last year, with the average for South Korea 42 1.73 10 Europe Rank Score Rank the 25 nations falling from 2.07 to 2.01, following a Mongolia 58 1.88 11 Central and Eastern Europe remains, on average, slight improvement in the 2011 edition. Asia Pacific Slovenia 8 1.33 1 countries exhibit wide variation in the GPI; the OECD Indonesia 63 1.91 12 the third-most peaceful region, after North America, Czech Republic 13 1.40 2 and the situation improved for the second successive nations rank highly, with New Zealand coming joint- Nepal 80 2.00 13 Hungary 17 1.48 3 year and by a greater extent than in Western Europe. second overall and Japan fifth, a two-pronged impact China 89 2.06 14 Poland 24 1.52 4 of very strong scores for overall domestic peace and The newest members of the EU are ranked highest, Bangladesh 91 2.07 15 with Slovenia consolidating its position in the top ten Slovakia 26 1.59 5 low levels of militarisation. Bhutan experienced a Papua New (8th position), although the Czech Republic slipped to Romania 32 1.63 6 robust gain in its GPI score and it rose into the top 20 Guinea 93 2.08 16 13th place. Croatia 35 1.65 7 for the first time, (19th place), above Malaysia, mainly Sri Lanka 103 2.15 17 Non-EU countries in the Balkans are ranked Bulgaria 39 1.70 8 because of the easing of the ethic-Nepali refugee Cambodia 108 2.21 18 between 34th and 78th in the 2012 GPI and nations Estonia 41 1.72 9 situation. Thailand 126 2.30 19 in the Caucasus and Central Asia occupy the lower The divide in South-East Asia remained marked, Lithuania 43 1.74 10 Philippines 133 2.42 20 reaches of the index, as before. with Taiwan and Vietnam in the top 35 and Latvia 45 1.77 11 Myanmar 139 2.53 21 Cambodia, Thailand and Philippines ranked below Bulgaria’s score improved most markedly Serbia 64 1.92 12 India 142 2.55 22 100th. Cambodia’s score improved solidly from a in the region, mainly as a result of Bosnia and sharp deterioration the previous year, amid growing Pakistan 149 2.83 23 contractions in its military sphere Herzegovina 65 1.92 13 political stability under the ruling Cambodian North Korea 152 2.93 24 Albania 66 1.93 14 brought on by budgetary pressures. Peoples’ Party, which secured a victory in elections to Afghanistan 157 3.25 25 Moldova 66 1.93 14 Bulgaria’s score improved most markedly in the Senate in late January 2012. There were also fewer Average 77 2.01 Macedonia violent crimes and a fall in the homicide rate. the region, mainly as a result of contractions in its (FYR) 68 1.94 16 military sphere brought on by budgetary pressures. With the exception of Bhutan, South Asian nations Ukraine 71 1.95 17 Latin America also experienced an overall gain Serbia’s overall score underwent the second-largest occupy the lower half of the regional table, headed Montenegro 81 2.01 18 in peacefulness, with 16 of the 23 nations seeing improvement in the region, amid increased political by Nepal, which rose to 80th place amid an easing improvements to their GPI scores. Chile is ranked stability led by the reformist (now former) president, Tajikistan 99 2.12 19 of the security situation and a more stable political highest, above Uruguay, with a decline in military 14 15
  • 9.
    Analysis of Analysis of the results the results expenditure and gains in its human-rights situation Latin Overall Overall Regional the position of the president, Ali Bongo Ondimba. Sub- (Political Terror Scale) and the homicide rate. America Rank Score Rank Improvements to five GPI indicators point to a more Saharan Overall Overall Regional Costa Rica’s high ranking (36th) in the GPI partly peaceful environment in Chad in 2011—a fall in the Africa Rank Score Rank Trinidad reflects very low scores for almost all its measures and Tobago 94 2.08 15 number of refugees and internally displaced people Malawi 60 1.89 12 of militarisation, in step with the abolition of the reflects the easing of the conflict and humanitarian Haiti 107 2.18 16 Gambia 74 1.96 13 country’s army at the end of the civil war in 1948. disaster in Darfur. Nevertheless, risk of civil unrest El Salvador 111 2.22 17 Gabon 75 1.97 14 Venezuela’s rise in peacefulness (it was the second- remains and many of the country’s measures of Jamaica 113 2.22 18 Senegal 78 1.99 15 biggest “improver” after Guyana) reflected warming societal safety and security remain at high levels, Venezuela 123 2.28 19 Swaziland 85 2.03 16 relations with neighbouring countries, particularly a hence its low rank (145th). rapprochement between the president, Hugo Chávez, Guatemala 124 2.29 20 Among Sub-Saharan nations, Malawi experienced Equatorial Guinea 87 2.04 17 and his Colombian counterpart, Juan Manuel Santos, Honduras 129 2.34 21 the largest decline in its GPI score and rank (falling Guinea 92 2.07 18 who was elected president in June 2010. There was Mexico 135 2.45 22 19 places to 60th position), largely as a result of a also a steep decline in military expenditure as a police crackdown on mass protests in July 2011 that Angola 95 2.11 19 Colombia 144 2.63 23 percentage of GDP. Mexico’s GPI score deteriorated Average 87 2.05 left at least 18 people dead. Nigeria underwent the Guinea-Bissau 95 2.11 19 significantly again and it slipped to 135th position second-largest deterioration, with a sharp rise in Cameroon 97 2.11 21 amid mounting drug-related violence and widespread the measure of internal conflict in response to the Uganda 98 2.12 22 crime that spread to areas that were previously Sub-Saharan Africa experienced a modest rise in wave of deadly attacks in the north of the country by Madagascar 99 2.12 23 peacefulness and, for the first time since the GPI was relatively unscathed. During 2011 the majority of the radical Islamist group, Boko Haram. A suicide launched in 2007, it was not ranked the least peaceful Liberia 101 2.13 24 murders were concentrated in Chihuahua, Nuevo bombing of UN headquarters in Abuja in August region. This was primarily the consequence of a Mali 102 2.13 25 Leon, Guerrero and Sinaloa. The efficacy of the 2011 killed 23 people. At least 186—and possibly second successive sharp deterioration in the overall Republic of the government’s military crackdown is being increasingly more than 200—people were killed on January 20th score for the Middle East and North Africa region. Congo 104 2.15 26 questioned by civil society and it is likely to become in the northern city of Kano in a co-ordinated series There were improvements in 23 of the 38 (60%) Benin 114 2.23 27 one of the presidential campaign issues. Rates of of bomb and gun attacks. The carnage in Nigeria’s countries surveyed. Zimbabwe underwent the greatest Niger 116 2.24 28 kidnapping in some states are among the highest in second-largest city was the most deadly strike by improvement—a tense security situation eased amid a the world. the fanatical sect since it began an uprising in 2009 Rwanda 119 2.25 29 more stable political scene under the unity government to topple democracy and impose Islamic rule in the Kenya 120 2.25 30 and a gradual economic recovery from near collapse. Latin Overall Overall Regional multi-ethnic and religiously diverse nation. War-torn Madagascar also experienced a more peaceful year as Eritrea 122 2.26 31 America Rank Score Rank Somalia remained the lowest-ranked country in the a recovery from the deep political crisis that followed Mauritania 125 2.30 32 Chile 30 1.62 1 region. the overthrow of the president, Marc Ravalomanana, South Africa 127 2.32 33 Uruguay 33 1.63 2 in March 2009 gained momentum. Mauritius, Sub- Cote d' Ivoire 134 2.42 34 Costa Rica 36 1.66 3 included in the GPI for the first time this year, is the Saharan Overall Overall Regional Ethiopia 137 2.50 35 Argentina 44 1.76 4 highest-ranked nation in the region, supplanting Africa Rank Score Rank Botswana, which topped the regional table for the Burundi 138 2.52 36 Panama 61 1.90 5 Mauritius 21 1.49 1 Guyana 69 1.94 6 past four years. Botswana climbed six places to 31st Zimbabwe 140 2.54 37 Botswana 31 1.62 2 Cuba 70 1.95 7 in the 2012 GPI, following a reduction in its score Chad 145 2.67 38 Mozambique 48 1.80 3 for numbers of internal security officers and police Nigeria 146 2.80 39 Paraguay 76 1.97 8 per 100,000 population and an improvement in its Namibia 49 1.80 4 Peru 79 2.00 9 Central African human-rights situation (Political Terror Scale). Ghana 50 1.81 5 Republic 151 2.87 40 Nicaragua 81 2.01 10 Gabon experienced the third-largest rise in Zambia 51 1.83 6 Democratic Brazil 83 2.02 11 peacefulness, with a drop in the Political Terror Scale Sierra Leone 52 1.86 7 Republic of the Bolivia 84 2.02 12 and a reduced likelihood of violent demonstrations, Congo 154 3.07 41 Lesotho 53 1.86 8 Ecuador 85 2.03 13 linked, in part, to the landslide win of the governing Tanzania 55 1.87 9 Sudan 156 3.19 42 Dominican Parti Démocratique Gabonais (PDG) in the December Somalia 158 3.39 43 Burkina Faso 56 1.88 10 Republic 90 2.07 14 2011 legislative elections and the strengthening of Djibouti 56 1.88 10 Average 97 2.20 16 17
  • 10.
    Analysis of Analysis of the results the results The Middle East and North Africa was the only Middle East the currency in late 2008. The Icelandic Defence 2010. Denmark’s military nevertheless remains fairly region to experience a decline in peacefulness, with a and North Overall Overall Regional Agency (IDA), which was launched in 2008 with a sophisticated (certainly compared with Iceland) and downturn largely reflecting upheaval and instability Africa Rank Score Rank budget of US$20 million, has now been disbanded. the country aims to continue to support international associated with the Arab Spring, which was sparked Qatar 12 1.40 1 All of Iceland’s GPI gauges of militarisation are now missions, such as those in Afghanistan and Libya, in Tunisia in December 2010. Huge, sustained public accorded “very low” scores; there is no standing through stronger co-operation with NATO allies. United Arab protests toppled the long-time president, Zine el Emirates 46 1.79 2 army, and military expenditure was just 1.1% of GDP. Most GPI indicators relating to safety and security Abidine Ben Ali, a month later and rippled across the Kuwait 47 1.79 3 The modest budget is mainly channelled to the Coast in society are accorded very low scores. Denmark is entire region and beyond during 2011. Deteriorations Guard, which operates a small number of ships and free from internal conflict and it enjoys good relations Morocco 54 1.87 4 in perceived criminality in society were registered in helicopters. A member of NATO since its inception in with neighbouring countries. Rates of violent crime Oman 59 1.89 5 six of the 16 countries and there were no improvements and homicide are very low, violent demonstrations are Jordan 62 1.91 6 The proportion of citizens who are in in that indicator. Violent demonstrations also became highly unlikely and just 74 people per 100,000 are in Tunisia 72 1.96 7 jail is one of the lowest in the world, more likely in six countries across the region. There jail, one of the lowest proportions in Europe. While were several instances of improvement in this indicator Saudi Arabia 106 2.18 8 dropping to 47 per 100,000 in 2011. the new centre-left coalition government has not had (in Libya, Iraq and Bahrain, for example, albeit from Egypt 111 2.22 9 1949, Iceland participates in international the smoothest of starts since taking power in October elevated levels last year). The popular uprising in Bahrain 118 2.25 10 peacekeeping missions in Afghanistan, Lebanon, 2011, it is stable and not under threat. Syria, a brutal crackdown by the Assad regime and Algeria 121 2.26 11 Palestine and the Balkans, although economic an increasingly violent insurgency, were reflected in difficulties have led to budget cuts. Iran 128 2.32 12 2. New Zealand: 2nd PLACE a steep deterioration in most GPI measures of the Icelandic society is essentially harmonious, with security situation (by far the biggest fall of the 158 Lebanon Yemen 136 143 2.46 2.60 13 14 measures of safety and security including violent 1.239 countries surveyed), while further significant declines crime, internal conflict and the number of homicides Libya 147 2.83 15 all accorded very low scores. The proportion of New Zealand remains at second place in the 2012 in peacefulness were also detected in post-revolution Syria 147 2.83 15 citizens who are in jail is one of the lowest in the GPI. Its overall score improved slightly in response Egypt and Tunisia. Libya, which plummeted from a Israel 150 2.84 17 world, dropping to 47 per 100,000 in 2011. The to a reduction in the size of the jailed population relatively high position (46th in the 2009 GPI) amid Iraq 155 3.19 18 political scene has been stable under the centre-left in 2011, although, at 199 per 100,000, it remains the descent into civil war, experienced a modest slide coalition of the Social Democratic Alliance (SDA) notably higher than most other OECD countries in peacefulness in 2011-12. There were also Average 101 2.25 and the Left-Green Movement (LGM), led since (58 in Japan, 73 in Norway and 111 in France in deteriorations in Kuwait, Morocco, Oman and the April 2009 by the reformist prime minister, Johanna 2011). Offsetting this was a marginal rise in military United Arab Emirates. Sigurdardottir. The government has been boosted expenditure, to a still very modest 1% of GDP. The Qatar is again the nation ranked most at peace in by a steady economic recovery in 2011, the passage 2010 Defence White Paper pledged to maintain and the region (12th position); most indicators of safety THE TEN COUNTRIES of the 2012 budget and a reshuffle in January 2012, enhance existing capabilities and to provide additional and security in society are accorded very low scores MOST AT PEACE which included the removal of the most controversial services, such as maritime air patrols, although there and measures of ongoing conflict and militarisation minister in the previous government, Jon Bjarnason. were no promises of significant increases to the defence are scored considerably lower than for the majority Iceland is classified the most peaceful nation of 158 budget. Most measures of militarisation are scored of its neighbouring countries, although the Emirates’ surveyed in the 2012 GPI, followed by Denmark and very low, although military capability / sophistication military expenditure as a percentage of GDP is the New Zealand. Denmark: 2nd PLACE is adjudged to be moderate, on a par with most OECD highest of the top 20. Algeria experienced the largest year-on-year improvement in peacefulness, benefiting 1.239 countries. The majority of the GPI’s gauges of safety and from warming relations with Libya’s National ICELAND: 1 PLACEst Denmark’s GPI score improved for the second security suggest that New Zealand society is broadly Transitional Council after initial scepticism and signs of reconciliation with Morocco. Several political 1.113 successive year, contributing to a rise to joint second harmonious; violent demonstrations are highly place, alongside New Zealand. This partly reflects a unlikely, while homicides and terrorist acts are very reforms have been announced by the president, Iceland is in first place for the second successive year. fall in military spending (to a relatively modest 1.3% rare. The political scene remained stable, with the Abdelaziz Bouteflika, including authorizing 17 new The slight improvement in Iceland’s score this year of GDP) at a time of government budget constraints. centre-right National Party returned to power and political parties to hold constituent congresses. They reflects a drop in the measure of military capability This continues a trend: the current Danish defence securing a record-high 59 seats in parliament, amid are reflected in a rise in the political stability indicator. and sophistication to the lowest possible level, with agreement reduces the number of the country’s F-16 strong approval for the prime minister, John Key, The country has so far largely avoided mass protest ongoing austerity measures in the wake of the collapse fighter aircraft from 48 to 30 and the process of and confidence in the government’s handling of and social unrest. of the country’s three main commercial banks and procuring new F-35 fighters was put on hold in March the economy, which grew by 1.2% in 2011. New 18 19
  • 11.
    Analysis of Analysis of the results the results Zealand maintained harmonious relations with most Japan: 5th PLACE recent years have led to substantial reductions in the measures of safety and security point to a largely neighbouring countries, notably Australia, links with fleet of armoured vehicles and artillery, although the harmonious society, with a high level of trust in other which are underpinned by the 1983 Closer Economic 1.326 controversial procurement of Eurofighter Typhoon citizens, a very low homicide rate and a very small Relations (CER) agreement. The two governments are Japan slipped to 5th position in the 2012 GPI, as a interceptors went ahead and the Joint-Command Air proportion of the population in jail. negotiating a protocol on a common border, pension result of an increase in the number of heavy weapons Force now has 15 of the jets, which contributes to a Ireland’s historically neutral stance portability and joint investment, all of which would and a slight rise in military spending as a proportion “moderate” score for the country’s military capability has required only a small professional move the countries closer to their goal of forming a of GDP. There was also a rise in the Political Terror and sophistication. single economic market. Offsetting the improvements in two indicators defence force and the country’s Scale for the first time since 2004 from a very low level—the result of concerns raised in Amnesty was a rise in the number of internal security officers measures of militarisation are accorded International’s 2010 annual report. Despite the ban and police in Austria for the second successive very low scores. Canada: 4th PLACE on maintaining war potential that was enshrined in year, according to the most recent UNODC survey. Ireland’s historically neutral stance has required 1.317 Japan’s 1946 constitution, the country’s Self-Defence Nevertheless, the number of police officers per head only a small professional defence force and the Forces (SDF) are sophisticated and capable and in remains one of the lowest in the OECD. There was country’s measures of militarisation are accorded very Canada’s GPI score improved slightly for the second late 2010 the government unveiled plans to boost also a rise in the likelihood of violent demonstrations, low scores. Military expenditure fell to just 1.2% of successive year and it rose to 4th position, although its southern forces over the next decade to counter partly reflecting the protests against internet GDP in 2011, one of the lowest levels among OECD this was also a consequence of Japan’s slide from 3rd China’s military rise. It will also strengthen its missile restrictions (the Anti-Counterfeiting Trade Agreement, countries. The armed forces have been asked to cut in the 2011 GPI. The barometer of the number of defences against the threat from a nuclear-armed ACTA) in several Austrian cities in February 2012. US$147 million from their spending plans from 2011- deaths in external conflict declined, reflecting fewer North Korea. In December 2011 the government Most other measures of safety and security in society 14 as part of a wider package of government cutbacks. fatalities suffered by Canadian troops in Afghanistan announced a relaxation of Japan’s self-imposed ban are accorded very low scores, notably the level of in 2010, compared with the previous year. Canada has on arms exports, saying it will allow the country to violent crime and the homicide rate, which remain played a key role in NATO’s International Security among the lowest of the 158 nations surveyed. Slovenia: 8th PLACE supply military equipment for humanitarian missions. Assistance Force (ISAF), with more than 2,500 troops stationed near Kandahar, which accounts for While the prime minister, Naoto Kan, stepped 1.330 down in August amid sustained criticism of his Ireland: 6th PLACE higher scores for the number of internal and external Slovenia moved up to 8th position in the 2012 GPI handling of the Fukushima nuclear crisis, his conflicts fought and the estimated number of deaths from external conflict (158 since 2002) than the other successor, Yoshihiko Noda of the ruling Democratic 1.328 as a result of improvements to two indicators in its military sphere. Budgetary constraints caused military Party of Japan enjoyed high approval ratings and countries in the top ten of the GPI. The controversial Ireland’s score improved considerably and it re-entered expenditure to fall to just 1.4% of GDP in 2011 and political stability was maintained (accorded the lowest deployment ended in July 2011, although a separate the top ten in the 2012 GPI, after two successive plans to modernise equipment were put on hold, possible score). Japan remained free from civil unrest training mission, involving some 950 troops will be deteriorations linked to the economic and political leading to a drop in the score for military capability / in 2011, while violent crime and homicides are rare based in Kabul until 2014. crises. The political scene stabilised after a new sophistication. The air force lacks any fighter aircraft, and terrorist acts highly unlikely. Stringent laws Offsetting this gain was a rise in the number coalition government, comprising the centre-right with air policing supplied by the Italian air force. prohibit the possession of firearms, all of which feed of internal security officers and police under the Fine Gael and the centre-left Labour Party and led A small contingent of soldiers joined NATO’s ISAF into a high overall position in the GPI. minority conservative administration. There were by Enda Kenny, the prime minister, took power in operation in Afghanistan in 2004 and 87 remained more than 69,000 active police officers in Canada in March 2011. It displayed levels of energy, cohesion in Herat in 2011, which became an increasingly 2010, an increase of almost 2,000 from the previous Austria: 6th PLACE and purposefulness that were conspicuous by their controversial political issue. Other international year equating to 203 per 100,000 population, the absence in the outgoing government. The Irish public highest rate since 1981. Most of Canada’s measures 1.328 responded favourably and has been broadly generous military deployments are restricted to various NATO and UN peacekeeping missions, most notably in of societal safety and security are accorded very low Austria’s overall score improved very slightly from in giving the new government the benefit of the doubt Kosovo. scores. The proportion of the population in jail is last year, but it dropped by one ranking place as a as it struggles to implement austerity measures that   Several measures of safety and security in higher than the Scandinavian nations, at 117 per result of a more substantial gain in Canada’s score. will entail several years of tax rises and spending cuts. Slovenian society receive the lowest possible scores, 100,000 people in 2011, but lower than in New The compilers of the Political Terror Scale report a Signs of life in the economy—it grew by 0.7% including the level of violent crime, the proportion Zealand and much lower then the US. Access to small more benign environment in Austria in 2010 (the most in 2011, the first expansion since 2007—probably of the population in jail and the rate of homicides, arms and light weapons has been restricted since recent year for which data are available) and there was contributed to a reduced number of violent although violent demonstrations are considered the 1995 Firearms Act and they are far less readily a drop in military spending to a mere 0.6% of GDP, demonstrations during 2011, although they are to be more likely than in neighbouring Austria. available than in the US, but more so than in Japan one of the lowest levels in the world. Budget cuts over considered to be more likely in Ireland than in most While Slovenia’s centre-left coalition lost a vote of and several Western European countries. other countries in the top ten of the GPI. Other 20 21
  • 12.
    Analysis of Analysis of the results the results confidence in September 2011, it remained in power of Finland’s population were in jail in 2011; among position. In the general election of October 2011, hundreds of deaths. Following several high-profile as a caretaker government and a new centre-left the top ten nations, only Iceland and Japan are lower. there was no significant change in the balance of kidnappings by al-Shabaab in northern Kenya, party—Positive Slovenia—won elections in December The country remains free of civil unrest and, while power, with the centre-right Swiss People’s Party in October 2011 Kenyan forces launched revenge and the score for political instability remained very the six-party coalition government that was formed in (SVP) retaining most seats. While the euro debt crisis attacks. Several hundred Ethiopian troops returned low. It remains the lowest of the Balkan countries June 2011 represents a broader spectrum of opinion and the strength of the Swiss franc pose threats, the to Somalia in December. The International Maritime by some margin and it is matched only by Slovakia than is usual, it is stable and expected to last out its fundamentals of the economy are strong and violent Bureau reported a growing number of violent pirate in the Central and Eastern Europe region. Despite four-year term. Relations with neighbouring countries demonstrations remained highly unlikely in 2011 and attacks off the coast of Somalia in 2011, with 237 gradual progress on settling their long-running border are harmonious and violent crime is very rare—the early 2012. incidents, compared with 219 in 2010, although the dispute, relations with Croatia remained difficult in score is unchanged from last year—although the number of successful hijackings fell. 2011 and several other issues related to the Yugoslav homicide rate remains higher than in the other Nordic On July 20th 2011 the UN declared famine in succession remain unresolved, including the financing countries. Terrorist acts are rare and are considered to The ten countries Somalia after four years of drought. During 2011 of radioactive-waste disposal at the jointly owned be highly unlikely. least at peace war and famine caused around 286,000 Somalis to nuclear-power plant at Krsko. Slovenia’s tally for flee the country and around 330,000 to be internally relations with neighbouring countries therefore War-torn Somalia is classified the least at peace out of displaced. Figures from the UNHCR and the Internal Switzerland: 10th PLACE 158 countries, followed by Afghanistan. remains higher than that of most countries in the top Displacement Monitoring Centre suggest that around ten of the GPI. 1.349 1.9 million Somalis have been displaced by the Somalia: 158th PLACE ongoing conflicts. This amounts to more than 20% of Finland: 9th PLACE Switzerland moved into the top ten of the GPI for the the population, giving Somalia the worse possible GPI 1.348 first time, primarily as a result of contractions in its 3.392 score. Almost all of Somalia’s measures of societal military sphere. While the country has a tradition of Somalia is rooted at the foot of the GPI for the safety and security are accorded very high scores. Finland’s overall score improved slightly as a result neutrality that dates from the Treaty of Paris in 1815, second successive year—the country’s overall score The exceptions are police numbers per head and the of a drop in military expenditure, to 1.4% of GDP Switzerland maintains a significant defence industry deteriorated as a result of a fall in the gauge of proportion of the population in jail, on account of the in 2011, but it slipped to 9th position as a result of and exports of conventional weapons per head of political stability. This partly reflects the resignation country’s lack of civil institutions. a more substantial improvement in Ireland’s GPI population are the highest in Europe. However, the tally. Like many other European countries, defence volume has declined since restrictions banning sales of the prime minister, Mohamed Abdullahi Mohamed expenditure has come under pressure and Finland to countries involved in armed conflict or which Farmajo, in June 2011 amid further challenges to the Afghanistan: 157th PLACE transition to democratically elected government. The has embarked on a wide-ranging review that may include the closure of bases. Since the end of the “systematically and severely violate human rights” were introduced in 2009. Military expenditure mandate of Somalia’s dysfunctional institutions—the 3.252 cold war, Finland has adopted a policy of strategic was reduced to 1.2% of GDP in 2011, continuing a Transitional Federal Government (TFG) and the Embroiled in conflict and instability for much of the non-alignment and chosen not to apply for NATO trend that began in 2003 when a sweeping reform Federal Transitional Parliament (FTP)—was duly past two decades, Afghanistan remained far from membership, despite the fact that the three former programme, known as Army XXI, was introduced. extended until August 2012. Mr Farmajo’s departure peaceful during in the past year: the country’s GPI This is also reflected in a decline in the GPI gauge sparked demonstrations in the streets of the capital, score deteriorated and only Somalia is ranked lower. Soviet Baltic states joined in 2004. The majority of of the number of heavy weapons per head in Mogadishu; he was widely considered to be one of the The UN estimates that 3,021 civilians were killed Finland’s measures of militarisation are accorded Switzerland last year. The recent procurement of most capable prime ministers that Somalia has had during 2011 (up from 2,790 in 2010), making it the low scores in a broad international comparison, with new Swedish Gripen fighter jets in a US$3.4 billion for years. While the TFG gained a foothold in parts of deadliest period for civilians since 2001. Militants a small number of troops per head of population deal may be undermined by the new government, southern Somalia with the support of African Union carried out suicide attacks, deployed roadside and fairly low volumes of imports and exports of which has demanded savings. Military capability and troops, it still controlled only part of Mogadishu in bombs and conducted large-scale attacks on public conventional weapons. There is a growing emphasis sophistication is scored as “moderate” and, while early 2012. places, amid continued confrontation between the on participation in international defence partnerships, restricted, access to light weapons is easier than in Somalia has not had a nationally functioning NATO-supported Afghan National Army (ANA) which will probably extend to procurement, and 195 Iceland and New Zealand. state government since its descent into civil war in and a Taliban-backed insurgency that has spread soldiers are deployed in Afghanistan as part of the Switzerland’s measures of safety and security 1991 and in 2011 the violent confrontation between well beyond its stronghold in the south and east of NATO-led force. The number of heavy weapons per confirm that society is broadly harmonious, with the TFG and Islamist rebel groups, Hizbul Islam and the country. In June a hospital in Azra district was head is relatively high, on a par with Sweden, but very low levels of violent crime, homicides and al-Shabaab, continued for the sixth successive year. destroyed, killing 27 people and injuring 53. In notably higher than New Zealand, Japan and Ireland. terrorist acts. The compilers of the Political Terror Outbreaks of fierce fighting frequently engulfed parts December at least 58 were killed in twin attacks on a Most measures of safety and security in society Scale consider that Switzerland has become a more of Mogadishu and towns across southern Somalia, Shia shrine in the capital, Kabul, and a Shia mosque are accorded very low scores; only 59 per 100,000 benign environment: its score improved to the lowest including Beledweyne and Bulo Hawo, resulting in in Mazar-i-Sharif. Casualties among the NATO- 22 23
  • 13.
    Analysis of Analysis of the results the results led International Security Assistance Force (ISAF) for much of 2011 owing to an ongoing controversy Sudan’s scores for the Political Terror Scale remain population in 2010-11, down from 15.4% the dropped to 566 in 2011, compared with 711 in 2010 surrounding the September 2010 parliamentary at the highest possible level, unchanged since 2002. previous year, but still one of the highest levels in the and 521 in 2009. election. Perceptions of criminality and the level of violent world. Most indicators of societal safety and security, crime, however, receive more moderate scores than The political scene became more unstable, with such as terrorist acts and levels of violent crime rates, most countries in the lowest reaches of the GPI, the unity government, led by Nouri al-Maliki, the sudan: 156th PLACE are accorded very high GPI scores, although the notably Somalia, Iraq and Afghanistan, which prime minister, weak and divided. In December an Political Terror Scale tally dropped slightly. Violent 3.193 reflects Sudan’s size and the fact that, while parts arrest warrant was issued for vice-president Tareq al- demonstrations became less likely, having been at of the country are in turmoil, other areas, including Hashemi, who is accused of involvement in terrorism Sudan’s GPI tally improved slightly as a result of a an elevated level of risk last year. Offsetting these the capital, Khartoum, are stable. Most GPI tallies and the Al-Iraquiya bloc boycotted parliament and the gradual easing of the refugee crisis in Darfur during improvements were deteriorations in two indicators in in the military sphere receive low scores—military cabinet. Iraq remains a highly militarised country, the 2010; the UNHCR reported that the number of Afghanistan’s military sphere. There was a rise expenditure rose in 2010, but to a relatively modest legacy of Saddam Hussein’s steady build-up of forces refugees and IDPs dropped to 10.5% of Sudan’s 1.5% of GDP. from his time as head of security in the ruling Ba’ath Most indicators of societal safety and population, with a consequent decline in the GPI Party in the 1970s. Small arms and light weapons security, such as terrorist acts and levels indicator from the highest possible level. The UN are very easily obtained. Military expenditure fell of violent crime rates, are accorded very estimates that up to 300,000 people have died and Iraq: 155th PLACE to 3.1% of GDP in 2011, which partly reflects the high GPI scores, although the Political around 2.7 million have been forced to flee their homes from the combined effects of war, famine and 3.192 government’s decision to delay the purchase of Terror Scale tally dropped slightly. Lockheed Martin F-16 fighter jets and divert US$900 disease in Darfur since 2003. Hopes of an end to the Iraq’s GPI score improved in 2011, with a modest in the number of internal security officers and million of allocated funds into the country’s food- Darfur conflict were high in March 2011, when the fall in the intensity of internal conflict and a reduced police; the Afghan National Police is being steadily ration programme. main rebel force, the Justice and Equality Movement likelihood of violent demonstrations, although it strengthened with support from NATO states and (JEM), signed a peace accord with the government, remained among the five lowest-ranked countries. amounted to 126,000 active staff in mid-2011, with but a failure to agree on specifics was accompanied by The US military support for Iraq’s government ended 160,000 expected by 2014. Development of the ANA Democratic Republic renewed violent clashes with smaller rebel groups. in mid-December 2011 when the last contingent of continued, the intention being that it will reach full South Sudan became an independent nation on 47,000 troops withdrew. While the country’s overall of the Congo: 154th PLACE capacity in time for the planned withdrawal of NATO forces at the end of 2014, which was reflected in a rise 9th July 2011, but a violent dispute over the border in the oil-rich Abyei province rumbled on, with dozens security situation can be said to have eased for the second year running, the measure of internal conflict 3.073 in military expenditure as a proportion of GDP. of fatalities and many thousands of people forced to is still at a high level; sectarian tension and violence The Democratic Republic of the Congo’s (DRC) score The GPI measure of the number of displaced leave their homes. Violent conflicts also erupted in remain widespread and the Iraq Body Count recorded deteriorated in 2011 for the second successive year people (including refugees) increased for the second the Sudanese provinces of South Kordofan and Blue 4,087 civilian deaths from violence in 2011, a slight and the country slipped to 154th position. Violent successive year, to over 3 million, which amounts Nile between the government and the Sudan People’s rise from last year. Sunni militant groups launched demonstrations became more likely and levels of to 11.4% of the population, one of the highest Liberation Movement/Army-North, and inter- bomb attacks on governmental institutions and violent crime ratcheted up amid an escalation of proportions in the world. According to the IDP ethnic conflict over livestock and natural resources security forces across the country, notably in Anbar, violent conflict in the east of the country and in the taskforce, 448,000 people were displaced by armed intensified in parts of South Sudan. Most of the GPI Diyala, Salah ad Din and Baghdad. The number of capital, Kinshasa, and other cities ahead of elections. conflict, human-rights abuses and other general gauges of ongoing conflict therefore remained at very homicides per 1,000 people, the level of violent crime, Clashes in North and South Kivu between the Hutu violence at the end of 2011. The number of conflict- high levels. the perceptions of criminality, the likelihood of violent rebels of the Democratic Forces for the Liberation induced IDPs has been rising steadily since 2007, The measure of political stability deteriorated, demonstrations and the potential for terrorist acts all of Rwanda (FDLR), allied with smaller groups increasing by 27% in 2011 and almost doubling since having improved last year in response to the first receive the highest possible scores (unchanged from including the Mayi-Mayi and the Forces Armées de 2008, according to the UNHCR. comprehensive and (partly) contested elections last year). la République Démocratique du Congo (FARDC, the Afghanistan’s political scene became even more in a quarter of a century. The downgrade reflects A growing number of Iraq’s many internally national army), left scores dead and forced thousands unstable in 2011 following a deteriorating security mounting tensions within the ruling National displaced people were able to return home in 2010 to leave their homes. There were also deadly clashes situation and several high-profile assassinations. The Congress Party (NCP), headed by the president, Omar and 2011, which also contributed to the improvement between the FARDC and Ituri militias near the leader of the Kandahar Provincial Council and a al-Bashir, over allowing the south to secede. The loss in Iraq’s GPI score. This partly reflects the return of Ugandan border, causing around 30,000 people to major political power-broker, Ahmed Wali Karzai, of 75% of the country’s oil reserves and 20% of its Iraqis from an increasingly unstable Syria (around flee the town of Gety. The disturbances in Kinshasa was killed on July 12th, and the head of the High population presents severe economic challenges, and one million Iraqis are thought to live there, with were sparked by an attempted coup in February, in Peace Council, Burhanuddin Rabbani, was killed the ensuing austerity is provoking unrest, possibly another 475,000 in Jordan). The UNHCR estimates which 19 were killed. Violence marred the run-up to on September 20th. Parliament was at an impasse inspired by the events of the Arab Spring. that refugees and IDPs amounted to 9.4% of the 24 25
  • 14.
    Analysis of Analysis of the results the results presidential and parliamentary elections in November, related terrorist threat are also key factors, along greatest proportion of the 158 countries surveyed renewed donor engagement. Small arms and light with 25 reportedly killed on the election weekend, and with a low ranking in the Political Terror Scale and and almost three times that of Saudi Arabia, the weapons are easily obtained in the Central African although Joseph Kabila was reinstated as president, a high homicide rate. The secession conflict between next largest at 7.7%. North Korea’s scores for its Republic, but other measures of militarisation are the political scene clearly became more volatile over Islamic militants and Russia’s central and regional military capability and sophistication and stock accorded very low scores—the army comprises just the year. government in Dagestan continued at a highly violent of heavy weapons are also high, remaining at last 2,150 trained soldiers. Ongoing conflicts and instability, high rates level, with shootings, bombings and ambushes against year’s elevated level, following a South Korean of crime and an estimated 2.1 million displaced security forces and local authorities claiming more report suggesting that the country had increased its Israel: 150th place people and refugees are the disastrous consequence than 400 lives, a rise of around 20% compared with investment in tanks and special forces, which number of decades of misrule in DRC, including a civil war 2010. Violent conflict was also recorded in Ingushetia, 200,000. 2.842 between 1998 and 2003 that caused as many as Chechnya and Kabardino-Balkaria. Russia’s score Israel’s score improved for the third successive year, 3 million deaths through fighting or disease and for the GPI indicator of internal conflict remained Central AFRICAN although it remained among the ten lowest-ranked malnutrition. DRC’s relations with neighbouring “moderate” in 2011-12, in spite of events in the North countries are again accorded a moderate score, which Caucasus, reflecting the fact that large areas of the Republic: 151st PLACE nations, at 150th place. The upturn reflects falls in reflects strong links with Rwanda and Zambia. country are free of conflict. 2.872 two of the GPI measures of the country’s military sphere: the volume of imports of major conventional Relations with Angola remained tense, however, The Central African Republic’s (CAR) score weapons and the number of armed service personnel with an ongoing dispute over the two countries’ North Korea: 152ND PLACE deteriorated for the second year running and it per head of population, albeit from some of the maritime border and offshore oil. Most indicators in the military sphere are accorded low scores, although 2.932 dropped to 151st place of 158 nations (last year it highest levels in the world. While Israel’s military is powerful and highly sophisticated and expenditure the rise in military expenditure to 1.4% of GDP may was 144th of 153). There was a rise in the number of North Korea is among the ten lowest-ranked nations refugees and internally displaced people as a result stayed above 6% of GDP in 2010, the budget (and reflect plans for greater military collaboration with in the GPI for the second year running, although its of violence and instability that continues to permeate the government of the right-wing prime minister, China, which has recently signed a multi-billion-US- score improved as a result of a reduced likelihood several parts of the country. This includes clashes Benyamin Netanyahu) came under pressure in 2011 dollar infrastructure-for-minerals deal with DRC. of violent demonstrations and a drop in the level between a rebel group that has not signed up to the following a series of mass protests and industrial of violent crime. This follows a sharp decline in peace process—Convention des Patriotes pour la action over spiralling food, fuel and housing costs. Russia: 153RD PLACE peacefulness in North Korea that was registered by Justice et la Paix (CPJP)—and the national army, The demands for economic reforms, and even 2.938 the 2011 GPI in response to reports of a dramatic escalation in violence and brutality at the hands of the the Forces Armées Centrafricaines (FACA). A peace Netanyahu’s resignation, dramatically shifted the national debate to the economy, eclipsing even the deal was signed by the CPJP and the government in Russia’s score improved slightly in the 2012 GPI as regime. Public executions tripled, with capital offences June 2011, but fighting erupted again in September, usually dominant security issue, which is reflected in a a result of gains in two indicators: a drop in military reportedly including robbery, people-trafficking, with 43 people reportedly killed near the eastern rise in the GPI political instability score. expenditure as a proportion of GDP and a reduction the illicit use of mobile phones and unauthorised town of Bria. The UNHCR estimates that 130,000 While there were fewer deaths recorded from in the jailed population for the fourth successive possession of US dollars. There was speculation CAR refugees have sought refuge in Chad, Cameroon organised internal conflict, the conflict between year. Nevertheless, 534 per 100,000 remains high that the reign of terror was instituted to enforce the and Sudan, while around 176,000 IDPs remains Israeli forces and the Islamist Resistance Movement, by international comparison—only Georgia, Eritrea, succession of Kim Jong-eun, Kim Jong-il’s third son, within the country, living in constant fear of violence (Hamas), (which has controlled Gaza since June 2007) Rwanda and the US incarcerate a higher proportion and there has been no evidence of any deviation from clashes between groups. Attacks by the Lord’s remained violent and other GPI measures of conflict of their population. Military expenditure dropped to from the traditional, hard-line approach since Kim Resistance Army in the far south explain the high retained high scores. Throughout 2011 Hamas and 2.3% of GDP following a sharp rise in the wake of the Jong-eun assumed power after his father’s death in scores that are accorded to most of the CAR’s other militants launched rocket attacks on southern brief war with Georgia in August 2008, when military December. measures of ongoing conflict and societal safety and Israel from Gaza and the Israeli forces retaliated with reform and modernisation became a national priority. Pyongyang’s relations with neighbouring South security. air strikes. Violence escalated in March and April, Russia’s lowly position in the GPI (153rd of 158 Korea remained very tense in 2011 and early 2012 The political scene remained uncertain, following with Israeli forces mounting the heaviest attacks nations) can in large part be attributed to its powerful in the wake of the sinking of a South Korean the disputed re-election of François Bozizé in early since 2009, with around 40 Palestinian casualties. A and sophisticated military sphere and defence naval vessel, the Cheonan, and missile salvos at 2011. While his ruling party, Kwa Na Kwa, secured terrorist attack by affiliates of the Popular Resistance industry. Exports of major conventional weapons, Yeonpyeong, one of five South Korean islands in the an overwhelming majority in the National Assembly Committees on August 18th killed eight Israelis and the number of heavy weapons per head and the size West (Yellow) Sea, close to North Korea, in 2010. (76 of 105 seats), Mr Bozizé’s new cabinet fell short injured dozens. of the police force relative to the population are, for Relations with China and Japan were also strained. of hopes for an inclusive unity government, making Israel’s indicators of societal safety and security example, among the highest of any country. North Korea is a highly militarised state: military a return to political stability unlikely, even with present a mixed picture, as before. On the one hand, Ongoing conflicts in the North Caucasus and the expenditure is estimated at 20% of GDP, by far the the level of violent crime and homicide rate are low 26 27
  • 15.
    Analysis of Analysis of the results the results and violent demonstrations are unlikely to occur. plotting to overthrow the government by accusing its Risers and fallers Top-five national On the other hand, the incidence of terrorist acts is commanders of acting as a “state within a state”. improvements in peacefulness high and relations with neighbouring countries are RELATIONS WITH NEIGHBOURING AFGHANISTAN tense—Israel remains in a formal “state of war” Change Change AND INDIA REMAINED FRAUGHT. Score, in Score, Rank, in rank, Sri Lanka with its northern neighbours, Syria and Lebanon, Mr Gilani came under further pressure in January Country 2012 2011–12 2012 2011–12 103rd * and relations with much of the Arab world and Iran remain highly strained. 2012, when the Supreme Court threatened to dismiss Top 5 him because of his failure to comply with its order to risers Change in score 2011-12: -0.292 reopen corruption cases pending against the president, Change in rank 2011-12: 27 Sri Lanka 2.145 -0.292 103 ↑27 Pakistan: 149th place Asif Ali Zardari. Relations with neighbouring Sri Lanka’s score improved markedly for the second 2.833 Zimbabwe 2.538 -0.186 140 - Afghanistan and India remained fraught and the successive year in the aftermath of the defeat of the Bhutan 1.481 -0.182 19 ↑11 compilers of the Political Terror Scale ratcheted Tamil Tigers and the ending of two decades of civil Pakistan’s GPI score improved modestly in 2011, in up Pakistan’s status to “level 5” for the first time, Guyana 1.937 -0.178 69 ↑21 war in May 2009. The GPI indicator of the number of part because of a further easing of the overall security as “terror has expanded to the whole population”. Philippines 2.415 -0.157 133 2 deaths from organised (internal) conflict fell sharply situation from the violence verging on civil war that Pakistan’s nuclear-armed military is highly capable Top 5 in response to the fact that there were no casualties engulfed much of the country in 2009. According to and sophisticated and defence expenditure rose to FALLERS in 2010, compared with 15,565 in 2009. There were the Institute for Conflict Management, terrorism- 3.2% of GDP in 2011. Small arms and light weapons Syria 2.830 +0.523 147 ↓31 related declines in the homicide rate, the frequency related violence caused 6,142 deaths in Pakistan are very easily obtained, although most of Pakistan’s Egypt 2.220 +0.215 111 ↓40 of terrorist acts and the Political Terror Scale. In in 2011, down from 7,435 last year and 11,585 in other GPI measures of militarisation are accorded Tunisia 1.955 +0.193 72 ↓29 August 2011 the president, Mahinda Rajapaksa, 2009. Fewer suicide-bombing attacks and a reduction relatively low scores, unchanged from last year. Oman 1.887 +0.150 59 ↓20 announced the lifting of the state of emergency in sectarian violence were reflected in lower tallies imposed since 1963 to confront the threat from Tamil for three GPI indicators: terrorist acts, the level of Malawi 1.894 +0.146 60 ↓19 Separatists. The level of internal conflict nevertheless organised internal conflict and estimated deaths from remains “moderate”, reflecting signs of intermittent internal conflict. Nevertheless, they, and most other Sri Lanka’s GPI score experienced the largest year- violence and reports of continued abductions and measures of conflict and societal safety and security on-year improvement (rise in peacefulness) of the disappearances, including two cases in the northern remained at elevated levels. Terrorist-engineered 158 nations surveyed and it climbed 27 places to a city of Jaffna in December 2011. Military expenditure explosions and “target killings” rocked many towns still-low 103rd position. Zimbabwe’s score improved declined in 2011 as a proportion of GDP amid and cities. The government launched two major by the second-largest margin and Bhutan’s the third- pressures to cut the country’s deficit. Nevertheless, offensives against Tehrik-i-Taliban Pakistan (TTP, an largest. a rise in defence spending appears likely in 2012, alliance of around a dozen militant Islamist groups Syria’s score deteriorated to the largest extent from justified by security officials to repay loans on military based in the country) in the Federally Administered the 2011 GPI, reflecting a wave of popular protests, hardware acquired to fight the Tamil Tigers. Tribal Areas (FATA), the most volatile region, which a brutal crackdown by the army and an eruption of reportedly killed more than 200 militants and forced violent conflict that resulted in an estimated 9,000 at least 100,000 to flee their homes. dead by March 2012. Post-revolution Egypt and Zimbabwe Conflict between various militant separatists and the government over the status of Balochistan Tunisia deteriorated by the second and third-largest margins, respectively. 140th continued and ethnic violence escalated in Sindh Change in score 2011-12: -0.186 province; the Human Rights Commission of Pakistan Change in rank 2011-12: 0 estimates that as many as 1,400 people were killed Zimbabwe’s score advanced strongly as a result of in Karachi alone in the first eight months of 2011. improvements to five of its GPI measures, including The political scene remained highly unstable in a drop in the homicide rate (albeit from a very high 2011, with growing tensions between the weak level), and a decline in the number of refugees and coalition government and the army. In December internally displaced people. The advances in several *The 2011 Global Peace Index included only 153 countries, while speculation mounted that a military coup was in the measures of societal safety and security coincided the 2012 GPI includes 158, which affects changes in ranking. offing after the prime minister, Yusuf Raza Gilani, with a gradual improvement in the economy from a made public remarks implying that the army was 28 29
  • 16.
    Analysis of Analysis of the results the results dire state, since a power-sharing government between Guyana headed by the prime minister, Kamal el-Ganzouri. the president, Robert Mugabe, and the opposition was TOP-FIVE national established in February 2009—in particular, inflation 69th deteriorations in peacefulness Clashes between pro-democracy demonstrators and the military police occurred across the country, is now at single-digit levels, while economic growth Change in score 2011-12: -0.178 with scores of casualties. The deteriorating security Syria has been relatively strong, led by the agriculture and Change in rank 2011-12: 21 situation and rising crime rates (there have been mining sectors. State finances nevertheless remain Guyana’s score improved robustly in 2011 and the 147th more frequent reports of robberies, car-jackings and constrained after a decade-long economic crisis to thuggery, which are reflected in declines in several country rose 21 places, to 69th position. The surge 2008. Zimbabwe’s military expenditure contracted GPI indicators) have been attributed to the Mubarak up the GPI ranking is greater than that for Zimbabwe Change in score 2011-12: +0.523 year on year to 2.5% of GDP. While Zimbabwe’s regime’s decision to release prisoners from jail during because there is a much narrower spread of scores Change in rank 2011-12: 31 score improved, there was no improvement in rank the revolution in an attempt to sow fear, but it is also among mid-ranking nations than the lowest-ranked due to the inclusion of five new countries which rank demonstrative of the ineffectiveness of the army and ones. The compilers of the Political Terror Scale Emboldened by dramatic revolutions in Tunisia and higher than 140. police in restoring order. There has been a resurgence suggest that the human-rights environment became Egypt, a small number of protesters gathered in Syria’s in sectarian violence, with rising tensions between more benign and there was a drop in the homicide capital, Damascus, in mid-March 2011 to demand Muslims and the country’s Coptic Christian minority Bhutan rate to a still-high level of 18.4 per 100,000. the release of political prisoners. Around 35 of the and Egypt’s relations with neighbouring countries 19th Military expenditure fell to 1.4% of GDP in 2011; the country’s very low level of investment in its protestors were arrested, which sparked further pro- democracy protests in Deraa, which later spread to have worsened (notably with Israel). All of this fed into a sharp deterioration in Egypt’s overall GPI score Change in score 2011-12: -0.182 military sphere has left the armed forces “weak and other cities. In a brutal crackdown, the Assad regime for the second year running and the country slid 40 Change in rank 2011-12: 11 ill-equipped” according to Jane’s Defence Review, sent tanks into Deraa, Banias, Jisr al-Shughour, places to 111th position. with just 1,100 active troops. This prompted a Homs, Hama, Deir-el-Zour and Lattakia. The regime A substantial improvement in Bhutan’s score saw downward revision of the GPI score for military claims to be targeting “terrorist groups”, but there are it leap 11 places into the top 20 of the GPI for the first time. Most of the GPI measures that registered capability / sophistication to the lowest possible level. reports that security forces and the Shabiha militia, a Tunisia gains related to an easing of the thorny issue of Philippines smuggling group from the Assad family’s Alawi sect, are killing people indiscriminately. This has been 72nd ethnic-Nepali refugees, more than 100,000 of whom were forced from their homes in Bhutan to camps 133rd exacerbated by other violent groups, with Islamists Change in score 2011-12: +0.193 in Eastern Nepal amid violent inter-ethnic conflict and criminal gangs accused. By March 2012 the UN Change in rank 2011-12: 29 in the early 1990s. Their eventual resettlement with Change in score 2011-12: -0.157 estimated that more than 9,000 Syrians had been The revolution in Tunisia that sparked the Arab the assistance of the UNHCR to other countries, Change in rank 2011-12: 2 killed in violence that in places could be described as Spring in December 2010 and early 2011 not including the US (the 50,000th refugee originating The robust rise in the Philippines’ score stems from a descent into civil war. Not surprisingly, the majority surprisingly brought with it a period of turbulence from Bhutan arrived there in August 2011), was improvements to four indicators: the homicide of Syria’s measures of ongoing conflict and societal and uncertainty and there was a decline in the level reflected in the GPI gauge of refugees and IDPs as a rate, the number of deaths from internal conflict, safety and security registered sharp declines in their of peacefulness. Tunisia’s GPI tally deteriorated by proportion of overall population, although it remains the likelihood of violent demonstrations and the scores and the country plunged 31 places to 147th the third-largest margin of the 158 countries surveyed higher than most other countries. Additionally, there incidence of terrorist acts (although this is not directly position in the 2012 GPI. and the country dropped 29 places to a still relatively were no reports of large-scale violent demonstrations comparable with last year’s score, owing to a change high 72nd position. (Prior to the revolution, Tunisia in the year to March 2012 and violent attacks by in the methodology). All were previously at moderate was one of the highest-ranked nations in the Middle ethnic-Nepali refugees, which might have triggered or high levels to reflect the violent conflict between Egypt East and North Africa.) Political instability increased retaliatory protests, appear to have diminished. The the government and the Moro Islamic Liberation 111th considerably, with the first two interim governments political scene has stabilised and Bhutan continues to Front (MILF), which engulfed the southern province proved unpopular as they comprised many former consolidate its position as a parliamentary democracy. of Mindanao in mid-2007. The conflict eased in Change in score 2011-12: +0.215 regime members. The third interim government, The country held its first local-government elections in December 2009 when peace talks were resumed Change in rank 2011-12: 40 which was stripped of most of the former regime June 2011; voter turnout was around 50%. Divisions just weeks after a massacre of 57 people who were Egypt has experienced a turbulent year in the wake of members, was able to prepare for elections in October, between the two houses of parliament persist, but travelling to file election-nomination papers in the revolution that toppled the long-serving president, but support for the unelected body remained fragile. recent parliamentary debate has demonstrated that Mindanao. However, violence rumbled on in Sulu Hosni Mubarak, on February 11th 2011. There has The election of the National Constituent Assembly the two chambers are capable of compromise. province during 2011, characterised by bombings and been criticism and sometimes violent protests about in October 2011 ushered in further instability in attacks by the Islamist Abu Sayyaf Group. the pace of reform under the interim government, the form of clashes between radical Islamist groups 30 31
  • 17.
    Analysis of Analysis of the results the results wanting a system of Sharia law for the constitution and Malawi GPI indicators: between secularists. The number of violent demonstrations increased 60th annual changes considerably between mid-March 2011 and the Change in score 2011-12: +0.146 Taking the average scores for each of the 23 GPI October elections. They subsequently subsided, but Change in rank 2011-12: 19 indicators and comparing them with those from the there were several violent protests in the south and the 153 countries analysed in the 2011 GPI, the Political Malawi’s relatively peaceful state (it was ranked west of the country, triggered by very high levels of Terror Scale, which measures levels of political 39th in the 2011 GPI, the second-highest of the unemployment and poverty. Violent crime also rose violence and terror worldwide in 2010, registered the Sub-Saharan nations surveyed) shattered in 2011. At sharply amid the security vacuum caused when many largest annual improvement. least 18 people were killed when police cracked down police officers thought to be corrupt under the regime There were also improvements to three indicators on protests across urban Malawi on July 20th-21st. were relieved of their posts. There were numerous in the military sphere, including a decline in military The protests, organised by Malawi’s influential civil reports of lootings in offices, cars and properties expenditure as a percentage of GDP in 2011, as society organisations (CSOs), saw thousands take associated with the regime, which appeared to have many countries hit by economic headwinds moved to to the streets to voice their discontent over a host of abated later in the year. reduce budget deficits. Six of the world’s top military issues that have emerged during the second term of the spenders: Brazil, France, Germany, India, the UK and president, Bingu wa Mutharika. These include: acute the US, cut their defence budgets in 2011. Oman fuel and foreign-exchange shortages since September Level of perceived criminality in society was the 59th 2010; worsening electricity shortages; extravagant expenditure by senior government members; indicator exhibiting the greatest deterioration, followed by the gauge of the likelihood of violent Change in score 2011-12: +0.150 intolerance of dissent, which has created a culture of demonstrations. The five indictors showing the Change in rank 2011-12: 20 fear; widespread corruption; the enactment of a law largest deteriorations were all measures of safety and that bans injunctions against the government and a Oman’s slide of 20 places to 59th position in the security in society and appear to reflect the upheavals deterioration in government-donor relations, which 2012 GPI reflects the Arab Spring-inspired protests and turbulence that have shaken the Arab world has jeopardised aid inflows. Violent clashes occurred and disturbances that began in February 2011 since December 2010 and have since rippled out well in several cities: the administrative capital, Lilongwe; and continued for several months. There were beyond that region. the commercial capital, Blantyre; and the northern deteriorations in three GPI indicators of societal cities of Karonga and Mzuzu—clearly indicating that safety and security, from low (benign) levels: the Top-five improvements Change this was not an isolated incident of unrest. Although level of internal conflict, the likelihood of violent an uneasy calm returned, the underlying issues remain Political Terror Scale -0.062 demonstrations and perceptions of criminality. The unresolved. The unrest is reflected in a deterioration Terrorist acts -0.049 number of security officers and police per head of of four GPi indicators: political instability, the population also rose, to a “high” level. Protestors Military expenditure as a percentage of GDP -0.045 likelihood of violent demonstrations, the homicide demanded political and social reforms, as well as an Military capability/sophistication -0.033 rate and political terror. end to corruption and many demonstrations took place Aggregate number of heavy weapons per 100,000 -0.026 around the industrial city of Sohar, home to diverse people industries intended to reduce Oman’s dependence on Top-five deteriorations Change oil. The army was also called in to clear demonstrators from Muscat and Salalah in April and May, but Level of perceived criminality in society +0.067 violence subsided after various economic and political Likelihood of violent demonstrations +0.042 concessions were announced by Sultan Qaboos bin Number of homicides per 100,000 people +0.036 Said al-Said, the most important of which was the Level of organised conflict (internal) +0.033 granting of legislative powers to the Majlis al-Shura Level of violent crime +0.020 (Consultative Council), which was, until then, an advisory body. 32 33
  • 18.
    Methodological notes Methodological notes Weighting the index The overall composite score and index was then Qualitative scoring: formulated by applying a weight of 60% to the the Economist Intelligence When the GPI was launched in 2007 the advisory measure of internal peace and 40% for external peace. panel of independent experts apportioned scores based Unit’s approach The heavier weight applied to internal peace was on the relative importance of each of the indicators agreed by the advisory panel, following robust debate. The Economist Intelligence Unit employs more on a 1-5 scale. Two sub-component weighted indices The decision was based on the innovative notion that than 100 full-time country experts and economists, were then calculated from the GPI group of indicators: a greater level of internal peace is likely to lead to, or supported by 650 in-country contributors. Analysts at least correlate with, lower external conflict. The generally focus on two or three countries and, 1. A measure of how at peace internally a country is; weights have been reviewed by the advisory panel in conjunction with local contributors, develop a 2. A measure of how at peace externally a country is prior to the compilation of each edition of the GPI. deep knowledge of a nation’s political scene, the (its state of peace beyond its borders). performance of its economy and the society in general. Eight of the GPI’s 23 indicators are scored Indicator Weight (%) qualitatively by the Economist Intelligence Unit’s country analysts. Scoring follows a strict process to Internal Peace 60% ensure reliability, consistency and comparability: External Peace 40% 1. Individual country analysts score qualitative Internal Peace Weight (1 to 5) indicators. Level of perceived criminality in society 3 2. Country analysts meet with their respective regional Number of internal security officers and police per 100,000 people 3 teams to collectively assess indicators and to ensure Number of homicides per 100,000 people 4 consistency and comparability within the region. Number of jailed population per 100,000 people 3 3. Indicator scores are checked by the Economist Ease of access to small weapons and light weapons 3 Intelligence Unit’s Custom Research team (which Level of organised conflict (internal) 5 has responsibility for the GPI) to ensure global Likelihood of violent demonstrations 3 comparability. Level of violent crime 4 4. If an indicator score is found to be questionable, the Political instability 4 Custom Research team, and the appropriate Regional Political Terror Scale 4 Director and country analyst discuss and make a Volume of transfers of major conventional weapons, as recipient (imports) 2 judgment on the score. per 100,000 people 5. Scores are assessed by the external advisory panel Terrorist acts 2 before finalising the GPI. Number of deaths from organised conflict (internal) 5 6. If the advisory panel finds an indicator score to be External Peace Weight (1 to 5) questionable, the Custom Research team, and the appropriate Regional Director and country analyst Military expenditure as a percentage of GDP 2 discuss and make a final judgment on the score. Number of armed services personnel per 100,000 people 2 Because of the large scope of the GPI, occasionally data Financial contribution to UN peacekeeping missions 2 for quantitative indicators do not extend to all nations. Aggregate weighted number of heavy weapons per 100,000 people 3 In this case, country analysts are asked to suggest an Volume of transfers of major conventional weapons as supplier (exports) 3 alternative data source or provide an estimate to fill per 100,000 people any gap. This score is checked by the Regional Director Military capability / sophistication 2 to ensure reliability and consistency within the region, Number of displaced people as a percentage of the population 4 and by the Custom Research team to ensure global Relations with neighbouring countries 5 comparability. Again, indicators are assessed by the external advisory panel before finalisation. 34 35
  • 19.
    Highlights First released in 2007, the GPI now contains six years • All five of the biggest risers in peace over the period of historical data. Some of the data sets contained 2009-2012 were emerging from some kind of in the Index have been collected over a longer period conflict. of time and in our analysis we have been able to • All five of the biggest fallers were Arab Spring highlight some trends spanning a period up to 20 countries. years. • The ‘Political Terror Scale’ and the ‘Level of This section of the 2012 Global Peace Index internally organised conflict’ indicators most report highlights some interesting trends in peace. It closely correlate with the GPI suggesting that should be noted however that due to a change in GPI government repression is one of the major driving nds ) methodology in 2009 some of the trends have only usa factors in peace. P, Tho been calculated from 2009 onwards. A deeper trend $40 (PP pita • ‘Military expenditure as a percentage of GDP’ r Ca $35 GD PP e analysis will be conducted by IEP in the future to $30 has increased since the turn of the century with trends understand the changing texture of peace. $25 military expenditure making up 2.51% of total $20 The major findings of the analysis are: $15 global economic activity in 2010. Without the US • The average level of peacefulness in 2012 is $10 in increases in military expenditure from 2001 to approximately the same as it was in 2007. $5 2010, global expenditure would have fallen. However there were changing levels year to year • More nations have decreased their military peacefulness during this period, with peacefulness improving from 2007 to 2009, then declining from 2009 to expenditure as a percentage of GDP (98 in total) 2011 and improving again from 2011 to 2012. than increased it (22 countries) since 2007. • Over the past six years, external peace has • Terrorism has emerged as a significant source of conflict since 2001. There were 2,000 deaths in 1.5 improved whilst internal peace has worsened. 2003, climbing to 10,000 in 2007 at the height of • Sub-Saharan Africa is no longer the least peaceful the Iraq war and reducing to 7,000 in 2010. region in the world. • Countries in the most peaceful quintile rarely move »»It has experienced the largest regional out. Similarly, no country that started in the least improvement in the world in ‘Relations with 201 2 0 Glo peaceful quintile in 2009 was able to move out. neighbouring states’ from 2009 to 2012. This suggests that peace is ‘sticky’ at both ends. »»It performs better than Latin America on bal Pea ‘Perceptions of criminality’. ce I nde »»It records a smaller number of deaths from xS 2.5 internal conflict than both Asia Pacific and the co Middle East and North Africa regions. • The Middle East and North Africa region is now less peaceful, owing to the events of the Arab Spring over the past year and a half. • There is a notable ‘tipping point’ after which relatively small gains in peacefulness seem to be associated with large falls in corruption and large increases in GDP per capita. • There is a substantial gap in peacefulness between democracies and other government types. Flawed democracies perform substantially better than hybrid and authoritarian regimes. 36 37
  • 20.
    Trends in peacefulness from 2009-2012 Trends in peacefulness from 2009-2012 Country Score Change % Change Country Score Change % Change Country Score Change % Change Country Score Change % Change Sri Lanka -0.34 -13.66% Vietnam -0.02 -1.38% Mali 0.05 2.21% Sweden 0.15 11.84% Lebanon -0.26 -9.52% Botswana -0.02 -1.36% Ghana 0.05 2.65% El Salvador 0.15 7.32% Chad -0.21 -7.26% Colombia -0.02 -0.78% Trinidad and Tobago 0.05 2.32% Bosnia and Herzegovina 0.17 9.56% Zimbabwe -0.20 -7.26% Uganda -0.02 -0.88% Zambia 0.05 2.83% Dominican Republic 0.18 9.43% Georgia -0.19 -7.11% Kenya -0.01 -0.64% Slovakia 0.05 3.35% Malawi 0.18 10.70% Israel -0.19 -6.37% Singapore -0.01 -0.79% Lithuania 0.05 3.20% Democratic Republic of the Congo 0.18 6.38% Bhutan -0.19 -11.16% Brazil 0.00 -0.25% Estonia 0.05 3.28% Russia 0.19 6.83% Ecuador -0.18 -8.25% Ireland 0.00 -0.36% Japan 0.05 4.29% Greece 0.20 11.11% Mauritania -0.18 -7.14% Burundi 0.00 -0.19% Morocco 0.06 3.08% Nigeria 0.20 7.64% Guyana -0.16 -7.68% Angola 0.00 0.00% Paraguay 0.06 2.97% Nicaragua 0.20 11.37% Mongolia -0.16 -7.66% Latvia 0.00 0.03% Indonesia 0.06 3.27% Madagascar 0.21 11.10% Haiti -0.15 -6.48% Albania 0.00 0.09% Nepal 0.06 3.19% Gabon 0.21 12.13% Iraq -0.15 -4.46% Qatar 0.00 0.17% Czech Republic 0.07 5.16% North Korea 0.21 7.90% South Africa -0.12 -4.77% Moldova 0.00 0.13% Guatemala 0.07 3.11% Iran 0.22 10.46% Iceland -0.11 -9.20% Canada 0.01 0.46% Uruguay 0.07 4.59% Cyprus 0.22 12.67% Macedonia (FYR) -0.10 -5.11% Slovenia 0.01 0.55% Jordan 0.07 4.04% Rwanda 0.22 11.00% Venezuela -0.10 -4.33% Senegal 0.01 0.49% Honduras 0.07 3.26% Mexico 0.24 10.67% Hungary -0.10 -6.31% Saudi Arabia 0.01 0.50% Tanzania 0.07 4.15% Yemen 0.24 10.08% Croatia -0.09 -5.33% Papua New Guinea 0.02 0.82% Netherlands 0.08 4.91% Equatorial Guinea 0.24 13.22% Argentina -0.09 -4.75% Uzbekistan 0.02 0.77% Austria 0.08 6.10% Tunisia 0.26 15.10% Malaysia -0.08 -4.89% Belgium 0.02 1.25% Cote d’Ivoire 0.08 3.29% Norway 0.26 21.61% Bulgaria -0.08 -4.23% Australia 0.02 1.23% Costa Rica 0.08 5.19% Sudan 0.27 9.27% Poland -0.08 -4.70% Denmark 0.02 1.79% Philippines 0.09 3.78% Bahrain 0.37 19.50% Ukraine -0.06 -2.86% Peru 0.02 1.20% Cuba 0.09 5.09% Oman 0.37 24.16% Republic of the Congo -0.05 -2.45% Myanmar 0.02 0.97% Panama 0.10 5.59% Egypt 0.45 25.19% Thailand -0.05 -2.14% Bangladesh 0.03 1.27% Belarus 0.11 5.01% Syria 0.78 38.10% Taiwan -0.05 -3.01% Finland 0.03 1.97% South Korea 0.11 6.55% Libya 1.12 65.54% Ethiopia -0.05 -1.83% Cambodia 0.03 1.31% Jamaica 0.11 5.28% Turkey -0.05 -1.90% Bolivia 0.03 1.55% Kuwait 0.11 6.67% Switzerland -0.04 -3.13% Mozambique 0.03 1.75% United Arab Emirates 0.12 7.05% Montenegro -0.04 -1.95% Germany 0.03 2.35% Portugal 0.12 9.04% Laos -0.04 -2.28% Azerbaijan 0.03 1.43% India 0.13 5.26% United Kingdom -0.04 -2.28% Romania 0.04 2.29% France 0.13 8.25% Namibia -0.04 -1.98% New Zealand 0.04 3.13% Turkmenistan 0.13 6.23% Afghanistan -0.03 -1.00% Cameroon 0.04 1.96% Kazakhstan 0.13 6.58% Serbia -0.03 -1.58% Italy 0.04 2.54% Somalia 0.13 4.13% Spain -0.03 -1.84% United States Chile 0.14 9.17% of America 0.04 2.14% Pakistan -0.03 -0.93% Central African Republic 0.14 5.08% Algeria 0.04 1.95% Burkina Faso -0.02 -1.27% China 0.14 7.32% 38 39
  • 21.
    twenty year trends Methodology of twenty-year Trends Analysis trends The majority of indicators in the Global Peace Index Since the end of the Cold War there has been a Chart 2.1: Military Expenditure as % of GDP by region, 1991-2010 SOURCE: WORLD BANK, WORLD DEVELOPMENT INDICATORS have remained the same since its inception in 2007. marked decline in global armed conflict, although this Aside from North America, military expenditure as a percentage However, some indicators have changed during this trend has somewhat reversed during the last six years of GDP has declined in every region since 1991. time, and the data collection and aggregation methods with the advent of the Iraq and Afghanistan wars. have been adjusted where possible for the changes in However, the long term trend is evident with other 5 20 these indicators. broader measures of militarisation used in the GPI In 2009 the two indicators related to troops and improving during this period. When viewed over 20 15 peacekeeping deployments were changed into a single years both interstate and intrastate warfare has fallen 10 indicator measuring financial contributions to UN substantially. However, while this trend has continued Middle East peacekeeping missions. The Refugee indicator was with interstate warfare the last six years have seen and North Africa 5 also changed to include internally displaced persons as violence within states increase. 4 Military Expenditure as a % of GDP well as refugees. In order to fully understand trends in peacefulness, 0 1991 2010 In 2010 the heavy weapons indicator was adjusted it is necessary to study much more than just organised to better account for the uneven impact of different conflict. Whilst armed conflict has declined, types of heavy weapons. many other measures of peacefulness have varied In 2012, ‘Potential for terrorist acts’ was changed considerably in the post-cold war period. Terrorism North America from a qualitative assessment of the potential of has emerged as a serious threat in the early 21st 3 future terrorist incidents to a quantitative indicator century, with deaths from terrorism increasing based on the prior impact of terrorism. five fold from 2003 to 2007. Political terror also Where possible these indicators have been taken intensified in some regions whilst receding in others World back and used to calculate new GPI scores for and perceptions of criminality increased, even as previous years, however, this was not possible in all violent crime decreased. occasions. Given that the changed indicators comprise There were also notable movements in some of 2 Central and Eastern Europe a relatively small percentage of the total GPI score, it the factors which are associated with maintaining is still possible to calculate an overall trend score with peaceful societies. The emergence of new democracies Sub-Saharan Africa Asia-Pacific a high degree of accuracy. after the fall of the cold war has slowed to a trickle, Western Europe and has even reversed course in some areas. Nascent Latin America democratic movements in the middle east hang in the balance. Studying the movements in the GPI allows for a 1 1991 2001 2010 much more thorough and nuanced understanding of trends in peacefulness. Whilst data for the GPI as a whole is only available back until 2007, data for some of the indicators is available back to the immediate Chart 2.1 shows military expenditure as a % of GDP years, and has now returned to cold war levels. The aftermath of the end of the cold war. by region from 1991 to 2010. Military expenditure biggest decrease in military expenditure occured in Examining these twenty year trends for some key as a percentage of Gross World Product (GWP) has the Middle East and North Africa, where it dropped datasets helps to define movements which are greater fallen from approximately 3% in 1991 to around from around 15% of GDP in 1991 to less than 5% of than the six years of GPI data. 2.51% in 2010. It was under 2.5% between 1995 and GDP in 2010. As background for the six year GPI tend analysis, 2001, but began to rise again as a result of conflict four long terms trends have been examined below: in Afghanistan and Iraq. Every region in the world military expenditure as a percentage of GDP, battle- bar North America experienced a downward trend in related deaths, fatalities from terrorism, and the military expenditure as a % of GDP over the entire percentage of ‘free’ countries in the world. period. Military expenditure in the US declined sharply between 1991 and 2000, falling from 4.5% to 3%. However, it has dramatically increased in recent 40 41
  • 22.
    twenty twenty year trends year trends Chart 2.2: Battle-related deaths (by area where the Chart 2.3: Terrorism Fatalities, 1991-2010 death occurred), 1991-2010 SOURCE: NATIONAL CONSORTIUM FOR THE STUDY OF TERRORISM AND SOURCE: WORLD BANK, WORLD DEVELOPMENT INDICATORS RESPONSES TO TERRORISM, GLOBAL TERRORISM DATABASE There have been three major spikes in battle related deaths The number of terrorism related deaths has been increasing since since 2010. the turn of the century. 80000 12000 70000 10000 Total Annual Deaths from Terrorism 60000 Total Annual Battle-Related Deaths 8000 50000 40000 6000 30000 4000 20000 World Asia Pacific 2000 10000 Sub-Saharan Africa Middle East and North Africa Central and Eastern Europe 0 0 North America Latin America Western Europe 1991 1995 2000 2005 2010 1991 1995 2000 2005 2010 Chart 2.3 shows the number of fatalities from been consistently downward since 2001. Chart 2.2 highlights that battle related deaths have less than 10,000. Whilst there are still some high terrorism from 1991 to 2010. Although terrorism If the world has become more peaceful during the continued to fall, from well over 100,000 in 1991 intensity conflicts, they are situated in certain regional leapt to the world’s attention after the terrorist attacks last twenty years, then the multidimensional factors of to approximately 50,000 in 2010. This downward hotspots. The majority of the world’s population have of September 11th, 2001, there were actually 10 years peace also should have improved during this period. trend was interrupted by three notable upward spikes. not experienced high intensity conflict in the last during this time period which had a higher number of The first spike was the result of the conflict in the twenty years. fatalities than 2001. Balkans in the mid-90s, the second was caused by Terrorism deaths peaked in 1997 as a result of the Rwandan genocide and associated conflict in conflict related terrorism in numerous countries Africa, and the third is a product of the wars in Iraq around the world. There have also been a high and Afghanistan. Perhaps the most notable trend in number of fatalities in the last five years, the vast conflict related deaths over this period is that the majority of which occurred in Afghanistan, Iraq, combined number of deaths in North America, South Pakistan and India. If terrorist deaths in active and America, Europe, and Sub-Saharan Africa is now post-conflict areas are removed, then the trend has 42 43
  • 23.
    twenty year trends Overall Trend 2007-2012 Chart 2.4: Percentage of countries rated as free, Chart 2.5: GPI AVERAGE SCORE, 2007-2012, UNWEIGHTED AND As seen in chart 2.5, the average country level partially free, and not free in the Freedom House POPULATION WEIGHTED peacefulness in the world has barely changed in the Freedom in the World survey, 1991-2010 If a population weighted system is used, the world has become SOURCE: FREEDOM HOUSE, FREEDOM IN THE WORLD SURVEY less peaceful over the last six years. last six years. However, if a population weighting The percentage of free countries has increased by about 5 method is used then peace has decreased over the last percentage points since 1991. six years. The greater part of this trend is driven by 2.5 changes in India and China, which together account 0.5 2.4 for around 37% of the total global population. Both China and India have become less peaceful over the 2.3 Population Weighted last six years. 2.2 Average GPI Score Free By Region 2.1 2.0 Unweighted As noted in the methodology, results, and findings 0.4 % of Countries that are Free, Partly Free, and Not Free section, 2012 marks the first occasion in the GPI’s % of Coutnries Rated as Free, Partly Free, or Not Free 1.9 history that Sub-Saharan Africa is not the least 1.8 peaceful region in the world, a distinction which 1.7 is now held by the Middle East and North Africa 1.6 region. Although the Middle East region has been 0.3 becoming less peaceful since 2009, the trend became Partly Free 1.5 2007 2012 most noticeable after 2010, owing chiefly to the Arab Spring. At the other end of the spectrum, Western Europe Not Free remains the most peaceful region in the world by 0.2 Chart 2.6: Regional Change in GPI score, 2007-2012 a large margin. Central and Eastern Europe, Latin Sub-Saharan Africa is no longer the world’s least peaceful region. America, and Asia Pacific all have average scores which have remained clustered around 2. 2.4 0.1 Middle East and North Africa 2.2 Sub-Saharan Africa Average Global Peace Index Score Latin America 2.0 Asia-Pacific Central and Eastern Europe 0.0 1.8 1991 2001 2011 North America 1.6 Although data is not available back to 1991 for all percentage of countries rated as ‘free’ has increased Western Europe the drivers, it is available for some socio-economic from under 40% to just over 45% in 2010. The 1.4 factors. Chart 2.4 above shows Freedom House’s percentage of ‘partly free’ and ‘not free’ has declined Freedom Index, which is another measure of human slightly over this period, although the last five years 1.2 progress and development that has over 20 years of have seen a number of countries classified as ‘partly data. The Freedom Index divides the countries of the free’ fall to ‘not free’ status. world into three categories: Free, Partly-Free, and Not 1.0 Free. Since the end of the Cold War and the spread 2007 2012 of democracy in the formerly communist states, the 44 45
  • 24.
    Overall Overall Trend 2007-2012 Trend 2007-2012 SUB-SAHARAN AFRICA Malawi 1.71 1.89 0.18 Table 2.3: Comparison of Sub-Saharan Africa to other Regions on Selected Indicators, 2012 Democratic Republic Sub-Saharan Africa now has the 4th best ‘Relations with Perhaps the most notable regional development is of the Congo 2.89 3.07 0.18 neighbouring states’ of any region. that Sub-Saharan Africa is no longer the world’s least Nigeria 2.60 2.80 0.20 peaceful region as of 2012. Although this is primarily Relations Access to Madagascar 1.91 2.12 0.21 due to the deterioration of peacefulness in the Middle Deaths from Political with Small Arms Gabon 1.76 1.97 0.21 Perception of Internal Terror Neighbouring and Light East and North Africa, there are a number of areas REGION Criminality Conflict Scale States Weapons where Sub-Saharan Africa is becoming more peaceful. Rwanda 2.03 2.25 0.22 Table 2.1 below shows the change in score of Equatorial Guinea 1.80 2.04 0.24 Sub-Saharan Africa 3.53 1.39 3.09 2.45 3.71 all the Sub-Saharan countries from 2009 to 2012. Sudan 2.92 3.19 0.27 Asia Pacific 2.92 1.60 3.00 2.46 2.72 Thirteen countries in Sub-Saharan Africa have Central and Eastern Europe 2.86 1.07 2.19 2.55 3.07 become more peaceful since 2009. Of these, Chad’s Changes in Peacefulness in Latin America 3.67 1.30 2.63 1.85 3.49 peacefulness increased the most, followed by Sub-Saharan Africa, 2009-2012 Middle East and North Africa 3.31 1.72 3.03 3.00 3.06 Zimbabwe, Mauritania, and South Africa. Table 2.2 shows the change in indicator scores North America 2.00 1.00 2.00 1.75 2.50 Table 2.1: Changes in Peacefulness in Sub-Saharan Africa, (five risers, five fallers) in Sub-Saharan Africa from Western Europe 2.33 1.00 1.28 1.17 1.94 2009-2012 2009 to 2012. It should be noted that the ‘Number 13 countries have become more peaceful since 2009. Global Average 3.14 1.33 2.59 2.28 3.11 of homicides’ indicator technically increased the most over the period, changing by 0.903 however Country 2009 2012 Change it has been excluded from table 2.2 as improved Table 2.3 shows the 2012 GPI scores for each state repression will have spill-over effects which Chad 2.88 2.67 -0.21 data collection has resulted in a rapid increase in region on the five indicators where Sub-Saharan positively influence other internal peace indicators. If Zimbabwe 2.74 2.54 -0.20 the numbers. Although this makes comparisons for Africa improved the most from 2009. Regions this is the case, we should expect to see peacefulness Mauritania 2.48 2.30 -0.18 homicides in Sub-Saharan Africa difficult it will with poorer scores than Sub-Saharan Africa are continue to increase in Sub-Saharan Africa in the South Africa 2.44 2.32 -0.12 improve the accuracy of this indicator in the future. highlighted in red. next few years. The improvement on relations with Republic of Although Sub-Saharan Africa still performs below neighbouring states is also significant, as it shows the Congo 2.20 2.15 -0.05 Table 2.2: Top 5 Risers and Fallers by Indicator, 2009-2012 the global average on all five of these indicators, there that gains to peacefulness are occurring across both Access to small arms and light weapons improved the most over are a number of surprising results. ‘Perceptions of internal and external indicators. Improving relations Ethiopia 2.55 2.50 -0.05 this period. Namibia 1.84 1.80 -0.04 criminality’ are now higher in Latin America than with neighbouring states lessens the likelihood of in Sub-Saharan Africa. The ‘Number of deaths from conflict in the Sub-Saharan region. This should in Burkina Faso 1.91 1.88 -0.02 Indicator Score Change internal conflict’ is worse in both Asia Pacific and the turn positively influence a number of other external Botswana 1.64 1.62 -0.02 Access to Small arms and light weapons -0.225 Middle East and North Africa, than in Sub-Saharan peace indicators. Whilst the external relations score in Uganda 2.14 2.12 -0.02 Relations with neighbouring states -0.214 Africa. ‘Relations with neighbouring states’ are now Sub-Saharan Africa is still above the global average, it Kenya 2.27 2.25 -0.01 Political Terror Scale -0.198 better than in Central and Eastern Europe. is higher than three other regions. Burundi 2.53 2.52 -0.005 Deaths from internal conflict -0.121 Chart 2.7 shows the change in ‘Relations with Sub-Saharan Africa has also been improving on a Angola 2.10 2.10 0.000 Perception of criminality -0.087 neighbouring states’ by region from 2009 to 2012. number of the factors associated with peace. The most Senegal 1.98 1.99 0.01 The biggest increase in peacefulness in Sub- notable trend is highlighted in chart 2.8. Both gender Mozambique 1.77 1.80 0.03 Saharan Africa was in relation to ‘Access to small and income inequality has been decreasing since 2009. Cameroon 2.07 2.11 0.04 arms and light weapons’, although Sub-Saharan The axis for gender inequality has been inverted to Number of internally displaced people Africa’s score is still well above any region other than make the trend more easily understandable. Mali 2.09 2.13 0.05 0.269 Latin America. Ghana 1.76 1.81 0.05 UN peacekeeping funding 0.198 There is an improvement in peacefulness Zambia 1.78 1.83 0.05 Violent crime 0.138 pertaining to a decrease in the average Political Terror Tanzania 1.80 1.87 0.07 Likelihood of violent demonstrations 0.125 Scale score. This is perhaps the most interesting result, Cote d’Ivoire 2.34 2.42 0.08 Political instability 0.088 as the Political Terror Scale is the GPI indicator that Somalia 3.26 3.39 0.13 correlates most closely with the GPI itself over the Central African period 2007-2012. It is likely that this decrease in Republic 2.73 2.87 0.14 46 47
  • 25.
    Overall Overall Trend 2007-2012 Trend 2007-2012 Chart 2.7; Change in Relations with Neighbouring states Chart 2.9: Sub-Saharan Africa’s Performance on the by region, 2009-2012 Democracy Index, 2011 Relations between neighbouring states improved the most in Political Culture in Sub-Saharan Africa is almost equal to the Sub-Saharan Africa. global average Sub-Saharan Africa Asia-Pacific Political Democracy Index Central and Eastern Europe Latin America Civil Liberties Middle East and North Africa North America Electoral Process Western Europe 0 -0.3 -0.2 -0.1 0.0 0.1 0.2 0.3 0.4 0.5 MORE PEACEFUL LESS PEACEFUL Functioning of Government Chart 2.8; Change in INCOME AND GENDER INEQUALITY, Political Culture SUB-SAHARAN AFRICA, 2009-2012 states by region, 2009-2012 Both income and gender inequality have decreased in Sub-Saharan Africa in the last four years. Political Participation 0.60 0.50 0 1 2 3 4 5 6 7 8 9 10 0.61 0.49 Sub-Saharan Africa GPI Average 0.62 0.48 Household Income Gini Coefficient 0.63 0.47 Gender Inequality Index Score Gender Inequality Chart 2.9 shows the performance of Sub-Saharan (Left Hand Side) 0.64 Gini 0.46 Africa on the EIU’s Democracy Index and its sub- (Right Hand Side) indices. All of these sub-indices have correlated 0.65 0.45 strongly with the GPI for every year that the 0.66 0.44 Democracy Index has been released (2006, 2008, 2010, and 2011). 0.67 0.43 Although Sub-Saharan Africa still performs worse than the Global Average on every indicator 0.68 0.42 in the Democracy Index, the gap is closing. The 0.69 0.41 greatest differential is related to the electoral process and the functioning of government, whilst political 0.70 0.40 participation and political culture are closest to the 2007 2012 global average. Political Culture is a reflection of the popularity and acceptance of democracy as an The Gini coefficient measures the distribution of of all the GPI countries (.41). ideology. It looks at the proportion of the population income throughout a society. A Gini score of one The Gender Gap Index is the proxy used for gender that feels as if democracy is both viable and desirable. would represent perfect inequality, where one person inequality. It measures female participation across controlled all the income of a nation, whilst a score four domains: economics, education, health, and of zero would represent perfect equality. Whilst it political participation. The average gender inequality has been decreasing over the past six years, the Sub- score in Sub-Saharan Africa is now approaching the Saharan Africa average Gini is still above the average global average (.67). 48 49
  • 26.
    Overall Trend 2007-2012 Internal Peacefulness By GOVERNMENT TYPE Given that all but one of the changes to the methodology of the GPI occurred in external Chart 2.10: Change in GPI score by Government Type, 2007- indicators, it would be possibly misleading to 2012 isolate changes in external peacefulness. However, Full democracies are considerably more peaceful than any other as the indicators comprising internal peace have government type. remained essentially unchanged during this period, a comparison of changes in internal peace by region is 2.4 possible. Authoritarian regime Chart 2.11: Change in Internal Peacefulness by Region North America and Western Europe recorded the biggest positive 2.2 changes in internal peacefulness. Hybrid regime 2.0 Average Global Peace Index Score Flawed democracy Asia-Pacific 1.8 Central and Eastern Europe Latin America 1.6 Middle East and North Africa Full democracy 1.4 North America Sub-Saharan Africa 1.2 Western Europe 1.0 -0.10 -0.05 0.00 0.05 0.10 0.15 0.20 2007 2012 MORE PEACEFUL LESS PEACEFUL The large gap between full democracies and other Chart 2.11 above highlights that Western Europe and 2007, 16 saw their internal peacefulness decreased. governance systems has remained constant throughout North America increased their internal peacefulness The most prominent movement was in Mexico as the history of the GPI. There has, however, been over the period 2007-2012, a somewhat surprising a result of violence associated with the drug war, a slight average increase in peace in the flawed result as they were already starting from relative high but there were also large movements in Panama, democracies in the past three years. It is too early to levels of internal peacefulness. The fall in internal Paraguay, and Chile. suggest that this trend will continue into the future. peacefulness in the Middle East and North Africa During the first year of the GPI, the average score is not particularly surprising, given the turmoil for authoritarian regimes was slightly lower than that associated with the Arab Spring. However, the of hybrid regimes. However, the gap has now reversed movement in Latin America was not prefaced by an with hybrid regimes now being slightly more peaceful obvious continent wide political discontent. Of the 21 on average than authoritarian regimes. Latin American countries included in the GPI since 50 51
  • 27.
    Indicator trends Risers Indicator and Fallers trends Table 2.4 below shows the five biggest risers and Table 2.5 shows the movement on GPI indicators Table 2.5: GPI INDICATORS MOVEMENTS, 2009-2012 The scores on the majority of indicators have worsened in the fallers in the GPI since 2009. This trend has not been from 2009 to 2012. The numbers for the quantitative last four years. taken back to 2007 as variations in the methodology indicators are based on the raw data rather than the and number of indicators distorted the scores for banded GPI scores. Indicators whose methodology individual countries. changed during this period were excluded from Qualitative Indicators 2009 2012 Change consideration. Political Terror Scale 2.69 2.60 -0.08 Table 2.4: TOP FIVE RISERS AND FALLERs, 2009-2012 Of the qualitative indicators, ‘Military capability’ Military capability/sophistication 2.58 2.57 -0.02 All five of the biggest fallers in peacefulness are Arab Spring saw the greatest average improvement in peacefulness, countries. Ease of access to small arms and light weapons 3.08 3.09 0.01 whilst ‘Likelihood of violent demonstrations’ saw the Relations with neighbouring countries 2.27 2.28 0.02 greatest fall in peacefulness. This was in large part due to the events of the Arab Spring. Political instability 2.45 2.50 0.05 Country Change It is not possible to directly compare changes in the Level of organised conflict (internal) 2.32 2.42 0.10 -0.34 raw scores of quantitative indicators. However, there Level of violent crime 2.63 2.76 0.13 Sri Lanka are a number of notable changes. The average number Perceptions of criminality in society 3.00 3.14 0.14 Lebanon -0.26 of homicides per 100,000 has almost doubled, Likelihood of violent demonstrations 2.72 2.94 0.22 Chad -0.21 although it is more than likely that most of this effect Quantitative Indicators Zimbabwe -0.20 is attributable to better and more comprehensive data collection. Whilst the number of armed service Estimated number of deaths from organised conflict (external) 43.23 13.08 -30.15 Georgia -0.19 personnel per 100,000 has decreased, the number Number of armed services personnel per 100,000 people 479.42 463.23 -16.18 Bahrain 0.37 of police officers has risen. Somewhat similarly, Military expenditure as a percentage of GDP 2.60 1.87 -0.73 Oman 0.37 deaths from internal conflict have risen whilst deaths UN Peacekeeping Funding 1.30 1.36 0.05 Egypt 0.45 from external conflict have decreased. In general, Volume of transfers of major conventional weapons as supplier (exports) per 100,000 people 1.71 1.78 0.08 Syria 0.78 external peace has improved whilst internal peace has Number of external and internal conflicts fought 0.78 0.93 0.15 1.12 deteriorated. Libya Number of displaced people as a percentage of the population 0.44 1.20 0.76 Number of homicides per 100,000 people 4.83 10.09 5.26 Number of jailed population per 100,000 people 152.97 160.91 7.94 All five of the biggest risers were countries emerging Number of internal security officers and police 100,000 people 326.29 354.46 28.17 from conflicts: Sri Lanka saw the end of a devastating Number of deaths from organised conflict (internal) 781.90 818.97 37.08 civil war, Lebanon concluded its conflict with Israel, Chad dealt with the fallout from an attempted rebel takeover, Zimbabwe began to recover after its power- sharing agreement was reached, and Georgia’s conflict with Russia came to an end. By contrast, all five of the biggest fallers were caught up in the events of the Arab Spring, with Syria and Libya being impacted the most. The Gaddafi regime was eventually overthrown after NATO forces intervened in 2011, whilst a conflict that verges on civil war still threatens Syria. 52 53
  • 28.
    Indicator Indicator trends trends Although the variance for most indicators did not their level of crime indicator scores. Chart 2.14: Political Instability chart 2.15: Number of deaths from organised conflict (internal) change significantly between 2007 and 2012, there were a few instances where there was interesting Chart 2.13: Likelihood of violent demonstrations 5 Max 55000 variation between and within the minimum, maximum, and median values in the indicators. 5 Max 4 44000 CHart 2.12: Level of violent crime 33000 4 Max 3 5 Max Median 22000 3 Median 2 4 11000 2 Median 1 Min 0 2007 2008 2009 2010 2011 2012 Min 3 Median 2008 2009 2010 2011 2012 1 Min 2007 2008 2009 2010 2011 2012 2 The ‘Political instability’ indicator is a qualitiative The ‘Number of deaths from organised internal indicator compiled by EIU analysts. A score of 1 conflict’ indicator has remained consistently low for 1 Min 2007 2008 2009 2010 2011 2012 The ‘Likelihood of violent demonstrations’ is a means stable, whilst a score of 5 means a country is the majority of the world. During the six-year period, qualitative indicator compiled by the Economist politically unstable. at most only 30 countries had a banded score of 2 or Intelligence Unit (EIU). The indicator contributes 4% Unlike other qualitiative indicators, the political more, i.e. greater than 24 deaths from conflict. It is a The ‘Level of violent crime’ is a qualitative indicator to the overall GPI score. The scoring range is between instability has had its range increase between 2010 quantitative indicator. compiled by the Economist Intelligence Unit (EIU). 1 (very low) to 5 (very high). and 2011. Moreover, the median value has also The extreme fluctuations in the maximum value The indicator contributes 5.33% to the overall GPI The range of scores for likelihood of violent increased 0.5 during the six-year period. Whilst reflect the major conflicts which were occurring score. The scoring range is between 1 (very low) and 5 demonstrations indicator has remained unchanged some regions of the world have seen slight reductions during the relevant time period: Iraq (2008-2009), (very high). with scores spanning all possible values from 1 to 5. in their score (Asia Pacific), Central, Eastern and Sri Lanka (2010-2011) and Libya (2012). Other The range of scores for the level of violent crime All regions saw an increase in their scores with Western Europe saw slight increase in their political major conflicts which resulted in a large number indicator has remained unchanged with scores the Middle East and North Africa seeing the biggest instability score. Similarly, the Middle East and North of casualties occurred in Mexico, Pakistan and spanning all possible values from 1 to 5. change between 2010 and 2011 as a result of the Arab Africa saw a steep increase in 2010 and 2011. Afghanistan. Although the median value has increased 1 Spring protests. Madagascar has the largest change in its score The ‘Number of deaths from organised internal whole point, this is primarily due to the addition Although many countries saw their scores increase going from 1.75 to 4.75 following the Malagasy conflict’ contributes 6.67% to the overall GPI. of new countries to the GPI. These additions to the by 0.5 or 1, the median was pushed up further by the political crisis which saw a wave of protests, riots and In terms of banded scores most countries which GPI are countries which score poorly. For example, inclusion of new countries. As was the case with the lootings. Libya also had a large change in score, going have experienced cessation of internal conflict Guinea, Guinea-Bissau, Guyana, Kyrgyz Republic ‘Level of violent crime’ indicator, these new countries from 2.25 to 5 after the overthrow of former dictator have marginally improved their scores. Iraq, Israel, and Tajikistan have all consistently received a score often received relatively high scores. Muammar Gaddafi. Ethiopia and Sri Lanka have all improved. On the of 4 since their inclusion. Other countries like Nepal, other hand, countries like Mexico, Libya and Pakistan Lesotho, Liberia and Sierra Leone received scores of 3 have seen their peace decline reflecting the precarious or 3.5. Hence, the inclusion of these countries, which situation of these countries. Mexico has gone from a have relatively higher levels of violent crime, has 1 to a 5 in two years whilst Libya has done this in just pushed the median up. one year. Some countries have seen improvements: the United Arab Emirates has seen its score drop from 2 to 1 during the 2007-2012 time period which stands in contrast to the rest of the Middle East and North Africa region which saw the largest increase in scores. Cambodia and Costa Rica also saw improvements in 54 55
  • 29.
    Correlation trends Correlation trends The existence of six years of data has allowed IEP to Chart 2.16 shows the relationship between the TABLE 2.7: CORRELATION BETWEEN socio-economic Both the Corruption Perception Index and per capita factors and the GPI, combined data 2007-2012 analyse which correlates of peace have the most robust Political Terror Scale and the GPI. Most interestingly, GDP have a similar looking relationship with the Corruption, governance, economic opportunity and education relationship with the GPI, and also to assess which whilst good performance on the Political Terror are all closely correlated with peacefulness. Global Peace Index. There appears to be a ‘tipping of the 23 indicators in the GPI has been the best Scale is a good predictor of peacefulness, the same point’ for countries with a score of around 2 on the predictor of GPI performance over the last six years. relationship does not apply in reverse. Every country GPI. This meant that at a score of 2 on the peace Socio-Economic Factors R Table 2.6 below shows the correlation between which scores a 1 on the Political Terror Scale has index, small positive changes in peace had large the GPI indicators. The Political Terror Scale has the a GPI score less than 2. By contrast, there are a Corruption Perceptions Index -0.71 positive impacts on corruption or per capita GDP. strongest overall correlation with the Global Peace number of countries with scores less than 2 which Political culture -0.65 Similarly once past the score of 2 on the GPI small Index, at .8212. The correlation scatterplot below have Political Terror Scale scores greater than 3.5. Functioning of government -0.65 negative changes in corruption or per capita GDP does show that this relationship may have some All the countries with low levels of political terror are Political Democracy Index -0.64 were associated with large decreases in peace. Both predictive power. peaceful, but not all peaceful countries have low levels of these datasets were also exhibited statistically The extent of regional integration 0.62 of political terror. significant relationships with the GPI at the 5% Hostility to foreigners/private property 0.62 level when the change in GPI score over the last five Civil liberties -0.58 TABLE 2.6: CORRELATION BETWEEN GPI INDICATORS AND GPI Chart 2.16: GPI vs Political Terror Scale, Five Years of Data years was regressed against the change in these two OVERALL SCORE, COMBINED DATA 2007-2012 Mean years of schooling -0.55 datasets. All the countries with low levels of political terror are peaceful, Of all the GPI indicators, the Political Terror Scale has the but not all peaceful countries have low levels of political terror. Freedom of the Press Index 0.52 strongest correlation with the index as a whole. Infant mortality per 1,000 live births 0.52 5 GDP per capita -0.51 Indicator R Electoral process -0.51 Political Terror Scale 0.8212 Secondary school enrolment ration (% Net) -0.49 Political Terror Scale (2007-2012) Level of organized internal conflict 0.8210 4 Life expectancy -0.49 Access to small arms 0.7161 Higher education enrolment (% Gross) -0.47 Perception of criminality 0.7134 Political participation -0.47 Relations with neighbouring countries 0.6616 3 Gender inequality -0.47 Likelihood of violent demonstrations 0.6429 Primary school enrolment ratio (% Net) -0.46 Violent crime 0.6179 Adult literacy rate (% of population over 15) -0.44 Terrorist acts 0.6106 2 Willingness to fight 0.38 Political instability 0.5235 Number of visitors as % domestic population -0.33 Deaths from organized conflict (internal) 0.3882 Gini Index 0.33 Internally displaced people as % of the 1 population 0.3626 1 2 3 4 5 15-34 year old males as % of adult population 0.33 Global Peace Index (2007-2012) Women in parliament -0.30 Homicide rate 0.3260 Current education spending -0.30 Number of external and internal conflicts Table 2.7 shows the correlation coefficient for the fought 0.2944 Unemployment % 0.21 various multidimensional factors of peace over the Peacekeeping Funding 0.2846 Net migration (% of population) -0.18 six years of the GPI. Many of these factors have Military expenditure as a % of GDP 0.2504 Exports + imports -0.15 consistently correlated strongly with the GPI, and the Armed forces personnel 0.1889 combined correlation demonstrates the robustness of Foreign direct investment (flow) % of GDP -0.12 Number of deaths from external conflict 0.0813 this relationship. A number of factors have exhibited Nominal GDP (US$ bn) -0.10 Incarceration rate 0.0562 a close and robust relationship with the GPI over Nominal GDP (US$ PPP bn) -0.04 Number of police officers 0.0491 time, most notably corruption perceptions but also Gender ratio of population: men/women 0.00 Military capability -0.0388 functioning of government, freedom of the press, Weapons imports -0.1583 and civil liberties. Notably, when the log of GDP per capita is taken and correlated against the GPI, the strength of the correlation increases from -.51 to -.58. 56 57
  • 30.
    Correlation Correlation trends trends CORRUPTION Chart 2.18: GPI vs Corruption perceptions INDEX, INTERNAL AND EXTERNAL PEACE External Peace does not correlate against the CPI, while Internal Peace correlates strongly. Chart 2.17: GPI vs Corruption perceptions Full democracies are considerably more peaceful than any other 10 10 government type. Corruption Perceptions Index (2007-2012) Corruption Perceptions Index (2007-2012) 8 8 10 6 6 4 4 8 2 2 Corruption Perceptions Index (2007-2012) 0 0 1 2 3 4 5 1.0 1.5 2.0 2.5 3.0 3.5 6 GPI - Internal Peace (2007-2012) GPI - External Peace (2007-2012) Chart 2.18 shows the Corruption Perceptions Chart 2.19: LOG GPI vs LOG Corruption perceptions INDEX Taking the log of the CPI and correlating it against the GPI 4 Index correlated against Internal Peace and Exernal reveals a linear relationship between peace and corruption. Peace respectively. The correlation with external peacefulness is effectively zero, whilst the correlation 1.0 with internal peacefulness is almost identical to the Log Corruption Perceptions Index (2007-2012) correlation with the GPI. This is partially the result 0.8 2 of external peacefulness having a much smaller range than internal peacefulness, (from 1 to 3.1), but this does not completely explain the dramatic difference in 0.6 the correlation strength between internal and external peacefulness. 0.4 Chart 2.19 shows the approximate log relationship 0 between GPI and corruption. When the log of the 1.0 1.5 2.0 2.5 3.0 3.5 4.0 0.2 corruption score is correlated against the GPI, a linear Global Peace Index (2007-2012) relationship emerges. 0.0 Transparency International’s Corruption Perceptions clear, logarithmic relationship between peace and 1.0 1.5 2.0 2.5 3.0 3.5 4.0 Global Peace Index (2007-2012) Index (CPI) attempts to assess the level of public corruption. The one major outlying country which sector corruption in a given country. Because has relatively low levels of corruption but also low corruption is often hidden and hard to assess, various peacefulness is Israel, a country whose GPI score is proxy measures and survey data are used in order dominated by external components related to conflicts to construct the CPI. The CPI looks at measures with neighbours and measures of militarisation. of public sector corruption like embezzlement, kickbacks, bribery, and the effectiveness of anti- corruption efforts. Chart 2.17 shows that there appears to be a 58 59
  • 31.
    Correlation Correlation trends trends GDP PER CAPITA Chart 2.20: GPI vs GDP PER CAPITA (US DOLLARS) Chart 2.21: GPI vs GDP PER CAPITA (US DOLLARS) BY There is a strong correlation between the GPI and GDP per government type, BUBBLE SIZE IS PROPORTIONAL TO capita. POPULATION SIZE. Full democracies are considerably more peaceful than any other government type. 100000 full democracy flawed democracy $55 hybrI d regIme 80000 $50 auThorIT arIa n regIme GDP Per Capita (USD) 2006-2011 $45 60000 $40 GDP Per Capita (PPP, Thousands) $35 $30 40000 $25 $20 20000 $15 $10 0 1.0 1.5 2.0 2.5 3.0 3.5 $5 Global Peace Index (2007-2012) $0 1 1.5 2 2.5 3 3.5 2010 Global Peace Index Score There appears to be a similar relationship between the following bubble charts only use one year’s worth GPI and GDP per capita. Countries with GPI scores of PPP GDP per capita data (from 2010). The most However, there is a large amount of variance less than 2 tend to have large increases in GDP for successful form of government in relation to peace amongst the authoritarian regimes across population, small increases in peacefulness, whilst countries less and GDP per capita income is democracy as can peacefulness, and GDP per capita. A number of the peaceful than this turning point seem to have little be seen in the chart. Both authoritarian and hybrid smaller authoritarian regimes have very high GDP per variance in their GDP per capita figures. The outlying regimes perform most poorly with flawed democracies capita, and a few are both relatively rich and relatively countries on this scatter plot are all resource rich. sitting between the two groups. It is interesting to peaceful. Conversely, a number of larger authoritarian Further exploring the GDP per capita correlation by note that flawed democracies are on the cusp of or regimes have broken past the peace threshold, but inserting governance and population data reveals just over the peace/GDP tipping point, and most remain relatively poor, with GDPs per capita of less some interesting trends. For the sake of clarity, the hybrid regimes sitting below the peace/GDP threshold. than $5000 in PPP terms. 60 61
  • 32.
    Correlation trends Quintile analysis Chart 2.22: GPI vs GDP PER CAPITA BY REGION Whilst the overall trend in peacefulness has shown Table 2.8 highlights the distribution of scores in a Full democracies are considerably more peaceful than any other little deviation in terms of the global average, there heat-map format for each quintile, from 2009 to government type and are generally wealthier. have been a number of changes that have occurred 2012. Four countries moved from the second to at the quintile level. For the purposes of this report, the first quintile over this time period, with Bhutan GPI SCORE GPI SCORE 2.0 2.0 the range of scores from the 2008 GPI was divided having the most pronounced rise. Four countries also full democracy into five equal segments. Chart 2.23 below shows the fell out of the first quintile and into the second, with flawed democracy percentage of GPI countries that were found in each Oman having the biggest fall. This was in large part hybrI d regIme quintile in 2009, and then again in 2012. Even though due to the fall out of the Arab Spring uprising. auThorIT arIa n regIme the average score in 2009 and 2012 was fairly similar, there are now more countries in the middle quintile. TABLE 2.8: peace trends by quintile, 2009-2012 COUNTRY 2009 2010 2011 2012 Iceland 1.23 1.21 1.15 1.11 CHART 2.23: % OF COUNTRIES THAT ARE PEACEFUL BY QUINTILE Denmark 1.22 1.34 1.29 1.24 Although there was no change in overall average peacefulness New Zealand 1.20 1.19 1.28 1.24 from 2009 to 2012, there are now more countries in the middle quintile. Each square represents 1% of total GPI countries. Canada 1.31 1.39 1.35 1.32 $5000 PPP $5000 PPP Japan 1.27 1.25 1.29 1.33 Most Peaceful Quintile Ireland 1.33 1.34 1.37 1.33 Austria 1.25 1.29 1.34 1.33 Slovenia 1.32 1.36 1.36 1.33 Least Peaceful Quintile Finland 1.32 1.35 1.35 1.35 Switzerland 1.39 1.42 1.42 1.35 A Belgium 1.36 1.40 1.41 1.38 2009 Qatar 1.39 1.39 1.40 1.39 Czech Republic 1.33 1.36 1.32 1.40 Sweden 1.27 1.35 1.40 1.42 Germany 1.39 1.40 1.42 1.42 Portugal 1.35 1.37 1.45 1.47 $5000 PPP $5000 PPP Hungary 1.58 1.50 1.50 1.48 GPI SCORE GPI SCORE Norway 1.22 1.32 1.36 1.48 2.0 2.0 Bhutan 1.67 1.68 1.69 1.48 2012 Malaysia 1.56 1.54 1.47 1.48 Mauritius 1.49 Australia 1.48 1.47 1.46 1.49 Singapore 1.53 1.62 1.59 1.52 Poland 1.60 1.62 1.54 1.52 Spain 1.58 1.59 1.64 1.55 Slovakia 1.54 1.54 1.58 1.59 Taiwan 1.65 1.66 1.64 1.60 Netherlands 1.53 1.61 1.63 1.61 The GPI has now had a uniform set of indicators United Kingdom 1.65 1.63 1.63 1.61 since 2009, although there have been some small Chile 1.48 1.62 1.71 1.62 methodological changes since then. 62 63
  • 33.
    Quintile Quintile analysis analysis Botswana 1.64 1.64 1.69 1.62 Albania 1.93 1.93 1.91 1.93 Saudi Arabia 2.17 2.22 2.19 2.18 Both Syria and Libya have experienced tremendous Romania 1.59 1.75 1.74 1.63 Moldova 1.92 1.94 1.89 1.93 Haiti 2.33 2.27 2.29 2.18 conflict and upheaval since the beginning of the Arab Spring, with the Gaddafi regime being overthrown in Uruguay 1.56 1.57 1.52 1.63 Macedonia 2.04 2.05 2.05 1.93 Cambodia 2.18 2.26 2.30 2.21 Libya and an as yet unresolved uprising still gripping Vietnam 1.66 1.69 1.67 1.64 Guyana 2.10 2.09 2.11 1.94 Belarus 2.10 2.24 2.28 2.21 Syria. Cuba 1.86 1.96 1.96 1.95 Uzbekistan 2.20 2.25 2.26 2.22 Whilst only one country (Ecuador) moved from the Ukraine 2.01 2.12 1.99 1.95 Egypt 1.77 1.78 2.02 2.22 third quintile into the second, 12 moved from the 2009 2010 2011 2012 second to the third. Tunisia 1.70 1.68 1.76 1.95 El Salvador 2.07 2.20 2.22 2.22 Cyprus 1.74 2.01 2.01 1.96 Jamaica 2.11 2.14 2.24 2.22 Yemen 2.36 2.56 2.67 2.60 2009 2010 2011 2012 Gambia 1.90 1.91 1.96 Benin 2.23 Colombia 2.65 2.79 2.70 2.62 Croatia 1.74 1.71 1.70 1.65 Chad 2.88 2.96 2.74 2.67 Gabon 1.76 1.98 2.06 1.97 Armenia 2.27 2.26 2.24 Costa Rica 1.58 1.59 1.68 1.66 Nigeria 2.60 2.76 2.74 2.80 Paraguay 1.92 2.00 1.95 1.97 Niger 2.36 2.24 Laos 1.70 1.66 1.69 1.66 Syria 2.05 2.27 2.32 2.83 Greece 1.78 1.89 1.95 1.98 Turkmenistan 2.11 2.29 2.25 2.24 Italy 1.65 1.70 1.77 1.69 Libya 1.71 1.84 2.82 2.83 Senegal 1.98 2.03 2.05 1.99 Bahrain 1.88 1.97 2.40 2.25 Bulgaria 1.77 1.78 1.85 1.70 Pakistan 2.86 3.05 2.91 2.83 Peru 1.97 2.07 2.08 2.00 Rwanda 2.03 2.02 2.19 2.25 France 1.58 1.64 1.70 1.71 Israel 3.04 3.02 2.90 2.84 Nepal 1.94 2.04 2.15 2.00 Kenya 2.27 2.37 2.28 2.25 Estonia 1.66 1.75 1.80 1.72 Central African 2.73 2.79 2.87 2.87 Montenegro 2.05 2.06 2.11 2.01 Algeria 2.21 2.28 2.42 2.26 South Korea 1.63 1.72 1.83 1.73 Republic Nicaragua 1.80 1.92 2.02 2.01 Eritrea 2.23 2.26 Lithuania 1.69 1.71 1.76 1.74 North Korea 2.72 2.86 3.09 2.93 Brazil 2.02 2.05 2.04 2.02 Venezuela 2.38 2.39 2.40 2.28 Argentina 1.85 1.88 1.85 1.76 Russia 2.75 3.01 2.97 2.94 Bolivia 1.99 2.04 2.04 2.02 Guatemala 2.22 2.26 2.40 2.29 Latvia 1.77 1.83 1.79 1.77 Democratic Republic 2.89 2.92 3.02 3.07 Swaziland 1.98 2.00 2.03 Mauritania 2.48 2.39 2.43 2.30 of the Congo United Arab Emirates 1.67 1.74 1.69 1.78 Ecuador 2.21 2.16 2.12 2.03 Thailand 2.35 2.39 2.25 2.30 Iraq 3.34 3.41 3.30 3.19 Kuwait 1.68 1.69 1.67 1.79 Equatorial Guinea 1.80 1.95 2.04 2.04 South Africa 2.44 2.38 2.35 2.32 Sudan 2.92 3.13 3.22 3.19 Mozambique 1.77 1.78 1.81 1.80 United States of 2.01 2.06 2.06 2.06 Iran 2.10 2.20 2.36 2.32 Afghanistan 3.28 3.26 3.21 3.25 Namibia 1.84 1.86 1.85 1.80 America Honduras 2.26 2.39 2.33 2.34 Somalia 3.26 3.40 3.38 3.39 Ghana 1.76 1.78 1.75 1.81 China 1.92 2.03 2.05 2.06 Turkey 2.39 2.42 2.41 2.34 Zambia 1.78 1.81 1.83 1.83 Dominican Republic 1.89 2.04 2.12 2.07 Kyrgyz Republic 2.30 2.36 Not one single country managed to climb out of Sierra Leone 1.83 1.90 1.86 Bangladesh 2.04 2.06 2.07 2.07 Azerbaijan 2.33 2.37 2.38 2.36 the lowest quintile, although both North Korea Lesotho 1.86 Guinea 2.13 2.07 Philippines 2.33 2.57 2.57 2.41 and Pakistan dipped in and out for one year Morocco 1.81 1.87 1.89 1.87 Papua New Guinea 2.06 2.11 2.14 2.08 Cote d’Ivoire 2.34 2.30 2.42 2.42 periods. There were a number of countries that Tanzania 1.80 1.83 1.86 1.87 Trinidad and Tobago 2.04 2.10 2.05 2.08 managed to move from the fourth to the third Mexico 2.21 2.22 2.36 2.44 Djibouti 1.88 Angola 2.10 2.06 2.11 2.10 quintile. Lebanon 2.72 2.64 2.60 2.46 Burkina Faso 1.91 1.85 1.83 1.88 Guinea-Bissau 2.11 Ethiopia 2.55 2.46 2.47 2.50 Mongolia 2.04 2.10 1.88 1.88 Cameroon 2.07 2.21 2.10 2.11 Burundi 2.53 2.58 2.53 2.52 Oman 1.52 1.56 1.74 1.89 Uganda 2.14 2.16 2.16 2.12 Myanmar 2.50 2.58 2.54 2.52 Malawi 1.71 1.83 1.74 1.89 Madagascar 1.91 2.02 2.24 2.12 Zimbabwe 2.74 2.68 2.72 2.54 Panama 1.80 1.88 1.81 1.90 Tajikistan 2.22 2.12 Georgia 2.74 2.97 2.56 2.54 Jordan 1.83 1.95 1.92 1.91 Liberia 2.20 2.16 2.13 India 2.42 2.52 2.57 2.55 Indonesia 1.85 1.95 1.98 1.91 Mali 2.09 2.25 2.19 2.13 Serbia 1.95 2.07 2.07 1.92 Sri Lanka 2.48 2.62 2.41 2.15 The largest movements occurred in the fourth Bosnia and 1.76 1.87 1.89 1.92 Republic of the Congo 2.20 2.19 2.16 2.15 quintiles, with Syria and Libya moving from the Herzegovina second to the fourth quintile in the last four years. Kazakhstan 2.02 2.11 2.14 2.15 64 65
  • 34.
    Executive Summary The Positive Peace Index (PPI) is a measure of the of peace. Similarly, the inverse scenario suggests a fall strength of the attitudes, institutions, and structures in peacefulness may be more likely to occur. This is of 108 nations to determine their capacity to create referred to as a positive peace deficit, where the PPI and maintain a peaceful society. The PPI is based on ranking is substantially lower than the GPI ranking, a statistical framework which groups these attributes highlighting the weakness of the necessary pillars to into eight key categories known as the ‘Pillars of sustain peace in a society. Peace’. These pillars have been identified as describing METHODOLOGY what underpins a peaceful society. This approach Key observations from the research are: stands in contrast to the extensive quantitative conflict literature which is predominately focused on • The top five nations on the PPI are all Nordic RESULTS understanding the causes for the outbreak of war or civil unrest. nations which all score highly in the GPI. • There are only two countries that are not high & FINDINGS The PPI is different from the GPI as it uses the income in the top 30. These are Chile and definition ‘absence of violence or fear of violence’ Lithuania; both upper middle income nations. to measure peace. While understanding the relative • The bottom ten is dominated by seven Sub-Saharan levels and types of violence present in the world is African nations. The other three are from the Asia useful, this on its own will not identify the economic, Pacific region. political, and cultural factors that shape a peaceful society. In contrast to negative peace, positive peace • North America and Western Europe are the most is about the appropriate attitudes, institutions, positively peaceful regions. Sub-Saharan Africa is and structures which when strengthened, lead to a the least positively peaceful region. positive more peaceful society. The imperative of deepening • Singapore is the only hybrid regime in the top 20 understanding how to create peace has been and France is the only flawed democracy in the top highlighted by the recent state-building experiences 20. peace such as in Iraq and Afghanistan. Both of these nations are still rooted at the bottom of the GPI. • The bottom ten nations on the PPI lag most on the equitable distribution of resources and levels of index One of the most notable observations is that education compared to the world average. the same attributes associated with peace are also • The top ten nations perform very well on associated with many other positive social and lower levels of corruption and well-functioning economic outcomes such as high levels of education, government. higher GDP per capita, low levels of corruption and • Case study shows levels of violence in some of the high social cohesion. Seen in this light, the Pillars nations with the biggest PPI deficits are narrowing of Peace provide a foundation for thinking about due to increased political destabilization. Some how to establish the optimal environment for human examples are Syria, Egypt and Madagascar. wellbeing and potential to flourish. Madagascar would have had the highest positive This analysis allows the comparison of the GPI peace deficit in the world in 2007. to the PPI to determine if nations have a positive peace surplus or deficit. This gap is the difference in • Full democracies have the highest average levels of ranking between the two indices and provides a basic peace both on the GPI and the PPI. estimate of a nation’s potential to improve or decline • Flawed democracies have the largest positive in peace. If the ranking is lower on the GPI than the peace surplus in terms of rank, indicating PPI then there is an opportunity for an improvement violence tends to be high in comparison to the in peace as the society has the attitudes, institutions, measured institutions and structures which score and structures that are associated with higher levels comparatively better. 66 67
  • 35.
    Executive Summary introduction Region Specific Highlights: strength of the entire wall is materially impacted. The GPI represents one of the first rigorous attempts These domains are: • Latin America and Sub-Saharan Africa have The framework described in this paper does not to measure the relative levels of the peacefulness • Well-functioning government equally low scores on measures of Well-Functioning aim at isolating causality; rather it describes the of nations. By aggregating and generating a • Sound business environment Government. ‘optimum’ environment for peace to flourish. This comprehensive and reliable dataset which measures means that peace-building efforts should aim at direct violence, the GPI adds to the current stock of • Equitable distribution of resources • Sub-Saharan Africa scores worst on all three enhancing and building these structures as much as harmonized cross-country data. Since 2007 it has • Acceptance of the rights of others indicators of Equitable Distribution of Resources possible while dealing with tactical issues such as informed policymakers, academics, and civil society • Good relations with neighbours • Central and Eastern Europe score worse than the violence containment as they arise. organisations about the objective state of direct Asia Pacific and the Middle East and North Africa • Free flow of information violence in countries covering over 99% of the world’s on Sound Business Environment measures. • High levels of education population. The purpose of this research is to better • The Middle East and North Africa on average understand the cultural, economic, and political • Low levels of corruption scores lowest on Acceptance of the Rights Others conditions associated with peaceful environments. measures. Up until now, the GPI has focused on measuring From this framework, IEP has developed the PPI. • Good Relations with Neighbours is the only what is termed ‘negative peace’, which was described There are a total of 21 indicators used in the PPI, positive peace indicator where North America does by Johan Galtung as the “absence of violence” and each of these indicators have had their weightings not score the highest score. the “absence of the fear of violence”.1 Hence the GPI determined empirically by the strength of the utilises 23 indicators of safety and security in society, correlation or statistical association with the GPI. • The Middle East and North Africa and Sub- militarisation, and ongoing domestic and international The PPI indicators are all publically available datasets Saharan Africa have the poorest scores on Free conflict to determine the multidimensional nature of from large intergovernmental organisations, research Flow of Information. negative peace in 158 countries. 2 This means nations institutes, and civil society organisations. • Sub-Saharan Africa is lagging on mean years of with a high ranking in the GPI are considered more schooling and secondary school enrolment rates. peaceful because they are relatively safer and more Latin America, Middle East and North Africa and secure than countries lower in the rankings. the Asia Pacific all have the similar scores on key In contrast to negative peace, Galtung described peace-related education measures. a second dimension called positive peace. Broadly • Latin America has the second highest levels of understood, positive peace is derived from corruption after Sub-Saharan Africa. preventative solutions which are optimistic and The lower ranked nations in the PPI tend to be lower facilitate a more integrated society. 3 According to income nations with hybrid or authoritarian regimes. Galtung, this results in ‘cooperation for mutual Hybrid regimes are on average slightly less peaceful benefit, and where individuals and society are in than authoritarian regimes although they have similar harmony’.4 From this conceptual basis, IEP defines scores on the PPI. Interestingly, the average positive positive peace as “the set of attitudes, institutions and peace score is similar in four of the regions of the structures which when strengthened, lead to a more world, Central and Eastern Europe, Asia Pacific, Latin peaceful society.” America and the Middle East and North Africa. IEP has empirically derived the key indicators The eight domains in the PPI are consistently and weightings of positive peace via statistical associated with peaceful environments and can analysis of six years of GPI data. The indicators be seen as both interdependent and positively used in the PPI attempt to comprehensively cover the reinforcing of each other. This means the strength multidimensional factors associated with positive of any one ‘pillar’ has the potential to either peace. Over 300 cross-country datasets were compiled positively or negatively influence peace. Due to the and statistically tested against the GPI to determine inter-dependence within the PPI, the weakening or the strength of their association. The key factors strengthening of any one ‘pillar’ will also weaken or identified are referred to as ‘Pillars of Peace’ and make strengthen the presence of the other ‘pillars’. This is up eight separate domains of the PPI. analogous to a brick wall, take out one brick and the 68 69
  • 36.
    why a Methodology positive peace index? In contrast to negative peace, positive peace can and positive approach to peace and state building. The Positive Peace Index is similar to the GPI in that • Good relations with neighbours inform our understanding of the appropriate attitudes, The composite index approach of the PPI it is a composite index attempting to measure an • High levels of education institutions, and structures which when strengthened, was chosen because positive peace is a latent and unobserved multidimensional concept. The PPI is the • Low levels of corruption. lead to a nation’s capacity to harmoniously and multidimensional concept which is represented in first known attempt to build an empirically derived non-violently resolve conflict. The approach in this different social, political and economic forms. index aiming to measure the latent variable of positive paper stands in contrast to the extensive quantitative peace from the definition of “the set of attitudes, conflict literature which is predominately focused on What is peace? institutions and structures which when strengthened, understanding the causes for outbreak of war as a While there are many nuanced definitions of peace, lead to a more peaceful society.” key dependent variable. 5 The output of the PPI can this paper uses two concepts, both of which have a The starting point for developing the PPI was be used for comparative studies which will further rich history in peace studies. These two types of peace to correlate the GPI against over 300 cross-country inform the understanding of the key economic, are commonly referred to as ‘positive’ and ‘negative’ harmonized datasets measuring a variety of economic, political and cultural factors that can improve peace peace as defined by Johan Galtung. Negative peace is governance, social, attitudinal and political factors. and resilience of all societies, not just fragile states. the absence of violence or fear of violence, an intuitive This aggregation of data attempted to cover many By seeking to identify institutions which help a definition that most people will agree with. This known quantitative and qualitative datasets measuring society move away from violence it is hoped a more was used in defining the measures for the GPI which factors at the nation-state level.8 Each dataset which holistic picture of the key factors which drive peace include indicators that measure both the internal was significantly correlated was then organised under can be identified. While a focus on ‘trigger’ factors peacefulness of nations as well their external peace in eight distinct headings or factors , these have been or individual case studies is insightful they cannot relation to other states. previously referred to as the ‘Pillars of Peace’ and reveal global or regional trends or help in identifying In an effort to determine positive peace, the IEP become the eight domains of the PPI. These structures longer term causes of conflict. As the 2009/2010 has used a statistical framework to derive what are were derived by empirical inspection and from the Human Security Report identifies, there is still a the attitudes, institutions and structures that are large body of qualitative and quantitative literature ‘…remarkable lack of consensus in the research associated with peace as measured by the GPI. This highlighting the importance of these factors. Rather findings on the causes of war and peace…also the is the only known quantitative approach to defining than attempting to isolate singular factors associated inability of conflict models to predict the outbreak positive peace and as such occupies a unique position with peace, this approach is focused on identifying the of conflicts.’6 To date, there are only a small number in peace studies. The work provides a foundation broad and complex associations that exist between of robust findings which have widespread consensus for researchers to deepen their understanding of the drivers of violence and a multitude of formal and in the research community. According to Hegre the empirical relationships between peace, social informal cultural, economic, and political, variables. and Sambanis 7 only three key findings have broad development and other development variables. Under each of the eight domains, the data sources agreement on the causes of civil war: The empirical link between negative peace and the most closely correlated with the GPI were then • The lower a country’s average income, the higher factors in the PPI index appear to hold in developing aggregated for each country. This resulted in the PPI the risk of war. and developed contexts. Both negative and positive having the following key features: • War is more likely if a country has already peace can be seen as the producer and product of experienced a war, the more recent the war the forms of trust and cohesion that are a pre-requisite for • 21 indicators under eight domains more likely the risk. well-functioning and prosperous societies. Countries • 108 countries covered higher in positive peace also tend to have many other • The risk of war increases as a country’s size fundamentally positive social and economic outcomes. • Time series covering only 2010 increases. For instance, IEP finds high peace countries have; While some dispute the number of robust findings, it higher per capita incomes, more equitable distribution The key domains of the Positive Peace Index are: is clear there are conflicting empirical conclusions as of resources, better health and education outcomes, to the causes of conflict. In contrast, by measuring improved trust between citizens, greater social • Well-functioning government positive peace it is possible to determine another way cohesion. • Sound business environment to better understand how to reduce violence, but more importantly how to build the resilience within By moving countries away from direct violence and • Equitable distribution of resources societies so they are less likely to fall into conflict. It towards positive peace, this demonstrates that it is • Acceptance of the rights of others is hoped this research can influence debate on how also possible to reap a significant social and economic dividend as a primary by-product of creating peace. • Free flow of information international institutions can facilitate a more holistic 70 71
  • 37.
    Methodology Methodology Indicators Positive % of Indicator weightings statistical correlation to the 2011 GPI score. The Peace Domain Indicator Data Source Weight Total Index stronger the correlation to the GPI, the higher the All indicators are scored between one and five, weighting portioned in the PPI. The lowest weighting Government Effectiveness World Bank, World Governance Indicators 0.73 5.64% with one being the most ‘positively peaceful’ score is given to the Interpersonal Safety and Trust Well- Rule of Law World Bank, World Governance Indicators 0.77 5.94% and five the least ‘positively peaceful’. This means indicator which accounts for 3.9 per cent of the index. Functioning Government Political Culture Economist Intelligence Unit, Political 0.66 5.13% countries which score closer to one are likely to have This is in comparison to the most heavily weighted Democracy Index relatively more institutional capacity and resilience in factor of Intergroup Cohesion which is weighted at Global Competitiveness Report World Economic Forum, Global Competitiveness 0.60 4.63% comparison to nations which score closer to five. 0.80 and accounts for more than twice the portion of Index The weightings are between 0.5 and 0.8 and Interpersonal Safety and Trust at 6.2 per cent of the Sound Business Index of Economic Freedom - Heritage Foundation, Index of Economic Freedom 0.57 4.39% have been derived by the strength of the indicator’s PPI. Environment Business Freedom GDP Per Capita (PPP) World Bank, World Governance Indicators 0.58 4.51% Inequality Adjusted Human United Nations Development Programme (UNDP) 0.53 4.14% Equitable Development Index (IHDI) 9 Distribution Life Expectancy World Bank, World Development Indicators 0.51 3.94% of Resources GLOBAL PEACE INDEX Infant Mortality World Bank, World Development Indicators 0.51 3.94% Measuring absence of violence CIRI Empowerment Index CIRI Human Rights Dataset 0.74 5.76% and absence of fear of violence Acceptance Gender Gap Index World Economic Forum 0.53 4.07% of the Rights of Others Intergroup Cohesion Indices for Social Development, International 0.80 6.19% Institute of Social Studies (ISS) Interpersonal Safety and Trust Indices for Social Development, International 0.50 3.90% Good Relations Institute of Social Studies (ISS) INTERNAL PEACE EXTERNAL PEACE with Neighbours Extent of Regional Integration Economist Intelligence Unit (EIU) 0.64 4.99% A measure of internal The extent to which a state stability and safety projects force externally, or Press Freedom Index Freedom House 0.60 4.65% suffers from external violence Free Flow of World Press Freedom Index Reporters Without Borders 0.56 4.34% Information Internet Usage International Telecommunications Union 0.62 4.82% (ITU) and United Nations ACCEPTANCE OF THE LOW LEVELS OF GOOD RELATIONS WITH WELL FUNCTIONING Mean Years of Schooling UNESCO, Institute of Statistics 0.53 4.13% RIGHTS OF OTHERS CORRUPTION NEIGHBOURS GOVERNMENT High Levels of Intergroup Cohesion, CIRI World Bank Control of Extent of Regional Integration, Political Culture, Rule of Law, Education Secondary School Enrolment Rate World Bank, World Development Indicators 0.48 3.69% Empowerment Index, Gender Corruption, TI Corruption Interpersonal Trust Government Effectiveness Gap Index Perceptions Index Control of Corruption World Bank, World Governance Indicators 0.73 5.69% Low Levels of Corruption Corruptions Perception Index Transparency International 0.71 5.52% FREE FLOW OF HIGH LEVELS OF SOUNDS BUSINESS EQUITABLE SHARING OF INFORMATION EDUCATION ENVIRONMENT RESOURCES FH Press Freedom, RWB Secondary Enrolment, Mean Global Competitiveness, Business IHDI, Infant Mortality, Life Freedom of the Press, Internet Years of Schooling Freedom, GDP per capita Expectancy Usage POSITIVE PEACE INDEX Formal and informal institutions that move a society away from violence and towards peace 72 73
  • 38.
    Methodology Methodology Positive Description: Rule of law captures perceptions of the extent to which agents have confidence in and abide Equitable Infant Mortality Peace Indicators by the rules of society, and in particular the quality Distribution of Resources Definition: Infant mortality rate is the number of infants dying before reaching one year of age, per of contract enforcement, property rights, the police, The Equitable Distribution of Resources in society 1,000 live births in a given year. and the courts, as well as the likelihood of crime and refers not just to income distribution but also to the Source: World Bank, World Development Indicators. violence. evenness of the broader development process, such as Source: The total WGI compile and summarise whether people have access to basic needs like water, Well-functioning information from 30 existing data sources that report healthcare, transportation, education or access to just Government legal processes. Uneven distribution of resources can Sound the views and experiences of citizens, entrepreneurs, Well-Functioning Government is dependent upon and experts in the public, private and NGO sectors generate fundamental inefficiencies within the system Business Environment levels of political participation, political culture, from around the world, on the quality of various as well as lead to alienation of groups and the depletion The Sound Business Environment structure refers to the separation of powers, the quality of democracy aspects of governance. The rule of law sub-indicator of human capital. the strength of economic conditions as well as the and public service delivery. It is dependent upon uses approximately 76 data points from these sources. formal institutions that support the operation of the Inequality Adjusted Human a multitude of formal and informal institutional private sector. Strong private sector conditions are Development Index (IHDI) - United variables, such as: Political Culture - essential for employment and economic growth and Nations Development Programme (UNDP) Economist Intelligence Unit (EIU) • The quality and quantity of public services also ensure that there is a viable tax base upon which Description: The EIU’s Democracy Index is based on governments can fund other critical services which the • The quality of the civil service and the degree of its Definition: The HDI covers three basic dimensions; five categories: electoral process and pluralism; civil private sector cannot. independence from political pressures health, education and income. It is possible in the liberties; the functioning of government; political • The quality of policy formulation and standard HDI for two countries to achieve the same participation; and political culture. IEP has used Global Competitiveness implementation score while very different results when measured by the sub-index Political Culture in the PPI, as the Report - World Economic Forum the equitability of the distribution of the resources. • The credibility of a government’s commitment to other metrics in the Well-Functioning Government In contrast to the HDI, the IHDI takes into account Definition: The Global Competitiveness Report its policies. PPI indicator cover the measurement of the formal not only the average achievements of a country on attempts to provide a holistic overview of factors institutions of governance. Political Culture uses that are critical to driving productivity and Government Effectiveness health, education and income, but also how those (sub-index) – World Bank, survey data from World Values Survey and other competitiveness. It is made up of over 110 variables, achievements are distributed among its citizens. World Governance Indicators (WGI) sources to determine the informal attitudes towards of which two thirds come from the Executive This means it measures inequality in the key human Definition: Government effectiveness captures democracy. Opinion Survey, and one third comes from publicly development variables. Note, several countries in the perceptions of the quality of public services, the Source: Composite index based on dichotomous and available sources. The variables are organised into PPI do not have a IHDI score. IEP has supplanted quality of the civil service and the degree of its three-point scoring10 qualitative scoring system by twelve pillars, with each pillar representing an missing values with the standard HDI score as these independence from political pressures, the quality country experts. area considered as an important determinant of tend to be close to IHDI scores. Those countries are: of policy formulation and implementation, and the Afghanistan, Algeria, Bahrain, Botswana, Equatorial competitiveness.11 credibility of the government’s commitment to such Guinea, Iran, Kuwait, Japan, Libya, Malaysia, Source: Data is based on executive opinion surveys policies. Myanmar, New Zealand, Qatar, Papua New Guinea (survey data) and publically available data from Source: The full WGI data set compiles and and Saudi Arabia. various intergovernmental organisations. summarises information from 30 existing data Source: UNDP sources. The data aims to report the views and experiences of citizens, entrepreneurs, and experts Life expectancy in the public, private and NGO sectors from around Definition: Life expectancy at birth indicates the the world, on the quality of various aspects of number of years a newborn infant would live if governance. The government effectiveness sub- prevailing patterns of mortality at the time of its birth indicator uses approximately 41 data points from a were to stay the same throughout its life. mix of the above sources. Source: World Bank, World Development Indicators. Rule of Law (sub index) – World Bank, World Governance Indicators 74 75
  • 39.
    Methodology Methodology Index of Economic ranges from 0, no government respect for these seven Intergroup Cohesion - Indices for Social Extent of Regional Integration - Freedom - Business Freedom rights, to 14, full government respect for these seven Development, International Institute of Economist Intelligence Unit (EIU) sub-indicator, Heritage Foundation rights. Social Studies (ISS) Definition: Extent of Regional Economic Integration. Definition: This indicator is derived from the Source: Constructed from the CIRI Human Rights Definition: Intergroup cohesion refers to relations of Source/Methodology: Qualitative Assessment on the Heritage Foundation’s Index of Economic Freedom. Dataset which takes its primary source of information cooperation and respect between identity groups in a level of membership of trade alliances by EIU country Business Freedom is a sub indicator which measures about human rights practices from the annual United society. This is a composite index that measures ethnic analysts on a one to five score. an individual’s ability to start, operate, and close a States Department of State’s Country Reports on and sectarian tensions, and discrimination. 5. Not a member of any regional trade grouping. business. Human Rights Practices. Coders for CIRI use this Source: There are 43, mostly survey based, data 4. Formally may be a member of regional trade Source: The Index relies on the following sources source for all variables. Coders also use a second sources from Afrobarometer, Asian Barometer, grouping, but in practice intra-bloc trade remains in determining business freedom scores, in order source, Amnesty International’s Annual Report. Both International Crime and Victim Survey, significantly restricted and any preferential access to of priority: World Bank, Doing Business 2012; reports can be found online for recent years. If there Latinobarometer, World Development Indicators, major regional trade areas is limited. Economist Intelligence Unit, Country Report and are discrepancies between the two sources, coders World Values Survey. Also includes data from Interpol Country Commerce, 2008–2011; U.S. Department 3. The country is formally in a free trade area, are instructed to treat the Amnesty International and the WHO.14 of Commerce, Country Commercial Guide, 2008– but there are a large number of sectoral and other evaluation as authoritative. 2011; and official government publications of each restrictions. Or the country enjoys a very high level of Good Relations preferential access to a major regional trade area. country.12 Gender Gap Index - World Economic Forum with Neighbours 2. The country is part of a free trade area, and there GDP per Capita (PPP) - World Definition: The Gender Gap Index is designed to This domain refers to both the relations between are few sectoral restrictions. Or the country enjoys a Bank, World Development Indicators measure gender-based gaps in access to resources communities within a nation and to the relationships very high level of preferential access to major regional Definition: GDP per capita based on purchasing and opportunities in individual countries rather between neighbouring states. This is based on trade area (i.e. NAFTA). power parity (PPP). PPP GDP is gross domestic than the actual levels of the available resources the interdependent nature of the relationships 1. The country belongs to an economic union. product converted to international dollars using and opportunities in those countries. The Index is investigated, as countries with positive external There is freedom of movement for goods, capital purchasing power parity rates. constructed to rank countries on their gender gaps not relations are more peaceful and also tend to be fand people (i.e. the E.U.). Source: World Bank, World Development Indicators on overall development level. politically stable. This acknowledges the apparent Source: The Global Gender Gap Index examines close relationship between interpersonal and interstate the gap between men and women in four categories: violence. Free flow of Acceptance of economic participation and opportunity, educational information attainment, health and survival and political Interpersonal Safety and the Rights of Others Trust - Indices for Social empowerment. The data are from a variety of Free Flow of Information captures how easily citizens Acceptance of the Rights of Others is a category Development, International publically available sources such as the ILO, can gain access to information, whether the media is designed to include both the formal institutions Institute of Social Studies (ISS) UNESCO, WHO and World Economic Forum’s free and independent, as well as the extent to which that ensure basic rights and freedoms as well as the Definition: The focus of this composite index is on Executive Opinion Survey.13 citizens are informed and engaged in the political informal social and cultural norms that relate to perceptions and incidences of crime and personal process. In this sense, free flow of information is the behaviours of citizens. These factors relate to transgressions. According to the Indices for Social an attempt to account for the degree of access to tolerance between the different ethnic, linguistic, Development “interpersonal norms of trust and information as well as the independence of that religious, and socio‑economic groups within a security exist to the extent that individuals in a society information from vested political and economic country. feel they can rely on those whom they have not met interests. before.”15 CIRI Empowerment Index - CIRI Human Rights Dataset Source: There are 43, mostly survey based, data sources from Afrobarometer, Asian Barometer, Definition: Cingranelli-Richards (CIRI) International Crime and Victim Survey, Empowerment Index is an additive index constructed Latinobarometer, World Development Indicators, from the Foreign Movement, Domestic Movement, World Values Survey. Also includes data from Interpol Freedom of Speech, Freedom of Assembly & and the WHO.15 Association, Workers’ Rights, Electoral Self- Determination, and Freedom of Religion indicators. It 76 77
  • 40.
    Methodology Methodology Press Freedom High levels Low levels Index - Freedom House of education of corruption Definition: The Freedom of the Press Index is an annual survey of media independence in 197 countries Effective educational institutions play an important Two indices focusing on corruption, Transparency and territories. The Index assesses the degree of print, structural role in the most peaceful countries. A International’s Corruption Perceptions Index (CPI) broadcast, and internet freedom in every country in broad education base creates a larger pool of human and the World Bank’s World Governance Indicators the world, analysing the events of each calendar year.16 capital which improves economic productivity, enables Control of Corruption measure were chosen as the Source: 23 methodology questions divided into three political participation and increases social capital. pre-eminent global measures of corruption. subcategories; the legal environment, the political The PPI indicators in this domain capture basic outcomes in education. Control of Corruption - World environment, and the economic environment.17 Bank, World Governance Indicators World Press Freedom Index - Reporters Mean Years of Schooling - UNESCO Definition: A sub-index of the World Governance Without Borders (RWB) Institute for Statistics Indicators. Captures perceptions of the extent to Definition: The Reporters Without Borders Index Definition: Average number of years of education which public power is exercised for private gain, measures the state of press freedom in the world. It received by people ages 25 and older, converted from including both petty and grand forms of corruption, reflects the degree of freedom of journalists and news education attainment levels using official durations of as well as “capture” of the state by elites and private organisations and the efforts made by the authorities each level. interests. to respect and ensure respect for this freedom. Sources: UNESCO Institute for Statistics data on Source: Based on 31 sources of expert and survey Source: The data informing the RWB report is based education attainment. data. 20 on a questionnaire sent to partner organisations of Secondary School Corruptions Perception Index - RWB and its 130 correspondents around the world, as Enrolment (% net) - World Transparency International well as to journalists, researchers, jurists and human Bank, World Development Indicators Definition: The CPI ranks countries according to rights activists.18 Definition: Net enrolment ratio is the ratio of children their perceived levels of public-sector corruption. Internet Usage - of official school age based on the International Source: The data sources for the Transparency International Telecommunications Standard Classification of Education 1997 who International CPI vary each year but draw upon Union (ITU) and United Nations are enrolled in school to the population of the different assessments and business opinion surveys Definition: Internet users are people with access to the corresponding official school age. carried out by independent institutions. The surveys worldwide network. Internet Users data is recorded Source: World Bank, World Development Indicators. and assessments used to compile the index include per 100 of population. questions relating to the bribery of public officials, Source: Data is from the ITU, World kickbacks in public procurement, embezzlement of Telecommunication/ICT Development Report and public funds, and questions that probe the strength database. Over 500 in-country and survey data and effectiveness of public-sector anti-corruption sources are used.19 Data is updated annually. efforts. 78 79
  • 41.
    results most positive peace least positive peace no data Rank Country Score Rank Country Score 1 Sweden 1.170 22 Slovenia 1.839 43 Botswana 2.561 63 Saudi Arabia 2.924 84 Bolivia 3.208 105 Pakistan 3.808 2 Norway 1.174 23 Czech Republic 1.913 44 Jamaica 2.585 64 Guyana 2.939 85 Honduras 3.210 106 Nigeria 3.845 2 Finland 1.240 24 Portugal 1.931 45 Trinidad and 65 Mongolia 2.942 85 Guatemala 3.223 107 Cote d’Ivoire 3.881 4 25 Tobago 2.589 66 87 108 Denmark 1.267 Cyprus 2.003 Thailand 2.982 India 3.297 Zimbabwe 4.016 5 26 46 Bahrain 2.592 66 88 Iceland 1.328 South Korea 2.009 Jordan 2.997 Senegal 3.338 6 27 47 Malaysia 2.595 68 89 Netherlands 1.381 Chile 2.058 Moldova 2.998 Venezuela 3.346 6 28 48 Argentina 2.630 69 90 Switzerland 1.382 Hungary 2.088 Ukraine 3.001 Malawi 3.374 8 29 49 Macedonia 2.677 70 91 Canada 1.383 Lithuania 2.139 Kazakhstan 3.019 Tanzania 3.385 9 30 50 Albania 2.684 71 92 New Zealand 1.412 Slovakia 2.141 Ghana 3.021 Zambia 3.395 10 31 51 South Africa 2.698 72 93 Ireland 1.472 Italy 2.157 Armenia 3.027 Syria 3.400 11 32 52 Panama 2.700 73 94 Germany 1.491 Qatar 2.181 Nicaragua 3.102 Madagascar 3.400 12 33 53 Namibia 2.783 74 95 Australia 1.507 Poland 2.185 Morocco 3.104 Iran 3.427 13 34 54 Brazil 2.784 75 95 Belgium 1.520 Latvia 2.187 Azerbaijan 3.108 Kenya 3.459 14 35 55 Mexico 2.785 76 97 United Kingdom 1.521 Uruguay 2.200 Egypt 3.112 Mozambique 3.485 15 36 56 Georgia 2.828 77 98 Austria 1.522 Greece 2.216 Ecuador 3.114 Mali 3.495 16 37 56 Peru 2.829 78 99 United States of United Arab China 3.114 Bangladesh 3.526 America 1.545 Emirates 2.242 58 El Salvador 2.858 79 99 Philippines 3.117 Cambodia 3.528 17 Japan 1.634 38 Costa Rica 2.296 59 Dominican 80 101 Paraguay 3.118 Uganda 3.542 18 39 Republic 2.885 France 1.707 Israel 2.353 81 102 Russia 3.128 Burkina Faso 3.589 19 40 60 Colombia 2.889 Singapore 1.747 Croatia 2.421 81 103 Sri Lanka 3.147 Cameroon 3.760 20 41 61 Turkey 2.910 Spain 1.829 Bulgaria 2.516 83 104 Indonesia 3.150 Ethiopia 3.761 21 42 62 Tunisia 2.915 Estonia 1.838 Kuwait 2.547 80 81
  • 42.
    results results table 3.2: bottom Ten Positive Peace Countries CHART 3.1: positive Peace Averages by Region Due to the small difference in scores between some The bottom ten positive peace countries are a mix of low and nations the results are best understood in groups of 4.0 LESS POSITIVE PEACE lower middle income countries and authoritarian and hybrid ten, as in the top ten, 11 to 20 and so on. government regimes. Key observations from the results are: 3.5 PPI PPI 2011 GPI GPI • The top five nations are all Nordic nations which Rank Country Score Score Rank all score highly in the GPI. 3.0 99 Bangladesh 3.526 2.070 70 • There are only two countries that are not high 2.5 100 Cambodia 3.528 2.301 86 income in the top 30, Chile and Lithuania. Both are 101 Uganda 3.542 2.159 77 upper middle income nations. 2.0 102 Burkina Faso 3.589 1.832 45 • The bottom ten nations are dominated by seven 103 Cameroon 3.760 2.104 72 1.5 MORE POSITIVE PEACE Sub-Saharan African nations. The remaining three are from the Asia Pacific region. 104 Ethiopia 3.761 2.468 99 105 Pakistan 3.808 2.905 107 1.0 • North America and Western Europe are the most positively peaceful regions on average. 106 Nigeria 3.845 2.743 105 0.5 107 Cote d'Ivoire 3.881 2.417 98 • Sub-Saharan Africa is the least positively peaceful region on average. 108 Zimbabwe 4.016 2.722 104 0.0 North Western Central and Asia Pacific Latin Middle East and Sub-Saharan • Positive peace is close to equal in Central and America Europe Eastern Europe America North Africa Africa Eastern Europe, Asia Pacific, Latin America and the Middle East and North Africa. • Singapore is the only hybrid regime in the top 20. • France is the only flawed democracy in the top 20. chart 3.2: the world average for each pillar of peace in the ppi Bottom Ten Average The bottom ten nations lag most on the equitable distribution of resources and levels of education compared to the world average, while World Average the top ten nations are well ahead of the world average on levels of Top Ten Average corruption and well-functioning government. TABLE 3.1: Top Ten Positive Peace Countries All of the top positive peace nations are in the high LESS POSITIVE PEACE 5.0 income category and are full democracies. 4.5 PPI PPI 2011 GPI GPI 4.0 Rank Country Score Score Rank 3.5 1 Sweden 1.170 1.401 13 2 Norway 1.174 1.356 9 3.0 3 Finland 1.240 1.352 7 2.5 4 Denmark 1.267 1.289 4 2.0 MORE POSITIVE PEACE 5 Iceland 1.328 1.148 1 1.5 6 Netherlands 1.381 1.628 25 7 Switzerland 1.382 1.421 16 1.0 8 Canada 1.383 1.355 8 0.5 9 New Zealand 1.412 1.279 2 0.0 10 Ireland 1.472 1.370 11 Well Sound Equitable Acceptance Good Free High Low Functioning Business Distribution of the Rights Relations Flow of Levels of Levels of Government Environment of Resources of Others with Neighbours Information Education Corruption (2010) (2010) (2010) (2010) (2010) (2010) (2010) (2010) 82 83
  • 43.
    results results table 3.3: pillarS of peace scores by country Good Country scores on the PPI on each pillar of peace. A darker blue Well- Sound Equitable Acceptance Relations High Low represents a score in a lower quintile. Functioning Business Distribution of the Rights with Free Flow of Levels of Levels of Country Government Environment of Resources of Others Neighbours Information Education Corruption Good by Rank (2010) (2010) (2010) (2010) (2010) (2010) (2010) (2010) Well- Sound Equitable Acceptance Relations High Low Functioning Business Distribution of the Rights with Free Flow of Levels of Levels of Latvia 2.32 3.15 1.74 2.03 1.75 1.54 1.44 3.25 Country Government Environment of Resources of Others Neighbours Information Education Corruption Uruguay 2.06 3.31 1.71 1.88 2.87 1.77 2.00 2.23 by Rank (2010) (2010) (2010) (2010) (2010) (2010) (2010) (2010) Greece 2.19 2.73 1.31 2.44 1.65 2.09 1.38 3.50 Sweden 1.06 1.60 1.17 1.26 1.29 1.00 1.18 1.13 United Arab 2.46 1.83 1.38 3.13 2.00 2.41 1.70 2.39 Norway 1.15 1.47 1.10 1.26 1.17 1.00 1.01 1.42 Emirates Finland 1.00 1.69 1.26 1.30 1.28 1.00 1.41 1.21 Costa Rica 2.30 3.35 1.71 2.06 2.33 1.84 1.83 2.82 Denmark 1.02 1.59 1.29 1.65 1.23 1.04 1.41 1.02 Israel 1.85 2.58 1.27 3.64 3.27 1.74 1.35 2.62 Iceland 1.25 1.93 1.18 1.18 1.77 1.00 1.39 1.35 Honduras 3.42 3.65 2.29 2.67 2.85 3.54 2.84 4.25 Netherlands 1.28 1.79 1.21 1.82 1.43 1.06 1.26 1.27 Guatemala 3.47 3.75 2.49 2.84 2.87 3.08 3.41 3.88 Switzerland 1.12 1.67 1.17 1.70 1.70 1.05 1.50 1.28 India 2.87 3.89 2.92 3.40 3.07 3.03 3.30 3.80 Canada 1.17 1.61 1.23 1.56 1.82 1.23 1.20 1.35 Senegal 3.01 3.73 3.39 2.85 2.73 3.24 4.10 3.97 New Zealand 1.22 2.00 1.09 1.55 2.53 1.07 1.03 1.01 Venezuela 3.72 3.83 1.99 2.99 3.55 3.30 2.51 4.55 Ireland 1.42 1.85 1.26 1.45 1.61 1.34 1.18 1.67 Malawi 2.93 4.22 3.72 2.41 3.28 3.22 3.98 3.82 Germany 1.39 1.76 1.25 1.97 1.43 1.15 1.08 1.69 Tanzania 3.06 4.12 3.43 2.80 2.98 3.08 3.88 4.01 Australia 1.20 1.80 1.11 1.78 2.61 1.27 1.11 1.36 Zambia 3.04 3.82 4.01 2.77 3.27 3.34 3.17 3.97 Belgium 1.55 1.84 1.28 1.63 1.29 1.11 1.36 2.04 Syria 3.08 3.74 2.05 3.68 2.61 4.29 2.89 4.30 United 1.37 1.76 1.32 1.72 1.53 1.21 1.58 1.85 Madagascar 3.21 3.78 2.96 2.84 3.55 3.53 3.78 3.81 Kingdom Iran 3.69 3.22 1.84 3.83 3.46 3.97 2.31 4.36 Austria 1.29 2.07 1.28 1.77 1.38 1.26 1.50 1.68 Kenya 3.24 3.78 3.46 3.24 3.47 3.13 2.87 4.41 United States 1.46 1.38 1.35 1.77 2.01 1.23 1.17 2.08 Mozambique 3.04 4.09 4.31 2.25 3.30 3.11 4.64 4.02 of America Mali 3.15 4.26 4.51 3.00 2.51 2.63 4.29 4.08 Japan 1.65 1.91 1.04 1.88 2.31 1.22 1.21 1.95 Bangladesh 3.45 3.91 2.75 3.35 3.05 3.56 3.62 4.34 France 1.55 2.00 1.24 2.15 1.56 1.54 1.39 2.10 Cambodia 3.43 4.23 2.96 2.84 3.18 3.63 3.48 4.54 Singapore 1.27 1.18 1.13 2.65 2.30 2.54 1.66 1.13 Uganda 2.97 3.96 3.71 3.34 3.08 3.17 3.95 4.26 Spain 1.82 2.49 1.25 1.80 1.54 1.66 1.40 2.48 Burkina Faso 3.29 4.05 4.35 2.70 3.82 2.97 4.71 3.75 Estonia 1.77 2.67 1.57 2.08 1.68 1.20 1.13 2.39 Cameroon 3.42 4.27 4.03 3.44 3.47 3.69 3.44 4.35 Slovenia 1.99 2.44 1.34 1.77 1.35 1.65 1.70 2.35 Ethiopia 3.11 3.87 3.70 3.64 3.53 3.99 4.35 4.14 Czech 1.78 2.74 1.38 2.02 1.50 1.45 1.17 3.07 Pakistan 3.42 3.67 3.13 4.48 3.78 3.65 3.80 4.38 Republic Nigeria 3.88 3.94 4.16 4.05 3.14 3.19 3.84 4.31 Portugal 1.79 2.65 1.47 1.84 1.56 1.78 1.80 2.53 Cote d’ Ivoire 3.48 4.21 3.90 3.96 3.40 3.57 4.22 4.46 Cyprus 1.96 2.46 1.43 2.21 1.93 1.96 1.52 2.36 Zimbabwe 3.88 4.75 4.06 3.66 3.83 3.77 3.22 4.60 South Korea 1.83 2.07 1.37 2.40 2.32 1.47 1.83 2.89 Chile 1.91 2.98 1.61 1.92 2.43 1.85 1.72 2.17 World 2.59 3.07 2.11 2.57 2.52 2.50 2.19 3.28 Average Hungary 2.11 2.91 1.60 2.30 1.58 1.59 1.23 3.01 Lithuania 2.22 2.84 1.71 2.21 1.82 1.53 1.33 3.18 Slovakia 2.40 2.90 1.53 2.32 1.61 1.44 1.36 3.22 Italy 2.20 2.60 1.29 2.22 1.72 2.05 1.51 3.41 Qatar 2.17 1.71 1.36 3.30 1.75 2.56 2.25 1.95 Poland 2.55 3.10 1.58 2.04 1.71 1.68 1.48 3.04 84 85
  • 44.
    results Positive Peace Gap Table 3.3 shows the Positive Peace Index scores Regional Integration are both very low. The positive peace gap is the difference between a be fragile due to weaker than expected institutional for each pillar of peace or domain of the PPI. This • Conversely South Africa and Georgia are examples nation’s GPI score and PPI score. 22 The closer a nation capacity. shows the relative strengths and weaknesses of each of two middle ranked countries (51 and 56 is to the red line in figure 3.3, the closer the alignment Conceptually, the nations in the lower third country’s positive peace. As would be expected, respectively) which score in the top quintile for between the PPI and GPI scores. (bottom right of figure one) have a relatively high the top ten and bottom ten countries tend to score High Levels of Education. These are outlying The divergence from the line is referred to as the level of violence but a comparatively high level either consistently well or badly on each of the eight scores in otherwise struggling positive peace ‘Peace Gap’. A surplus means that the institutions, of institutional capacity to deal with shocks and factors. However, in the middle of the PPI some more environments. South Africa scores notably poorly structures and attitudes of the country can support a potential to become a more peaceful society. Three interesting facts emerge where some states score in the on the Equitable Distribution of Resources. higher level of peace than is being experienced, while notable examples are Bahrain, Israel, and the United top quintile for some factors and in the bottom for the inverse, a deficit, signifies that the country may States which have the largest positive peace surpluses. • Saudi Arabia has a diverse positive peace profile, others. scoring relatively well on Sound Business Environment and Equitable Distribution of Some notable facts to be drawn from this include: Resources but very poorly on Acceptance of the CHART3.3: Positive Peace Gap - the GPI score compared to the PPI score. • New Zealand is the only country in the top ten Rights of Others and Free Flow of Information. with a score below the world average for one pillar of peace. This is in the Good Relations with 120 Neighbours, in which there is a clear imbalance. Positive Peace Deficit • Australia also notably lags on the Good Relations with Neighbors score, due to a poor score on the extent of regional integration and interpersonal 100 safety and trust measure. • Out the top 20 nations Singapore is the only country which scores relatively poorly on three domains of the PPI. Compared to other nations in 80 the top 20 it is lagging on the Acceptance of the POSITIVE PEACE INDEX RANK Rights of Others, Good Relations with Neighbours, and the Free Flow of Information. • The Czech Republic is comparatively lagging on the 60 Levels of Corruption. • Qatar has a large imbalance in its positive peace BAHRAIN score, scoring well below the world average on the Acceptance of the Rights of Others. It scores poorly 40 ISRAEL on all three factors of the CIRI Empowerment measure, the Gender Gap Index and levels of Intergroup Cohesion as measured by the ISS. The United Arab Emirates also has a similar score on 20 the same factor. USA Positive Peace surplus • Israel scores well in all factors except for the Acceptance of the Rights of Others and Good Relations with Neighbours domains. 0 • Jamaica has one of the most extreme imbalances in 0 20 40 60 80 100 120 its positive peace profile. A middle ranked nation 2011 GLOBAL PEACE INDEX RANK (44) on the PPI, its score on Good Relations with Neighbours is close to the bottom of the PPI. Interpersonal Safety and Trust and the Extent of 86 87
  • 45.
    Positive Positive Peace Gap Peace Gap “The top ten positive peace deficit countries are mostly in Sub-Saharan Africa...These nations are relatively peaceful but lack the institutions to adequately deal with external shocks.” CHART 3.4: Positive Peace RANK CORRELATION TO INTERNAL GPI SCORE. TABLE 3.4: Top 10 Positive Peace Deficit Countries The positive peace score is highly correlated with the internal peace score (0.84). Positive Peace Deficit Country GPI Rank PPI Rank Region Income Group Government Type 4.5 -57 Burkina Faso 45 102 Sub-Saharan Africa Low income Authoritarian regime -55 Malawi 35 90 Sub-Saharan Africa Low income Hybrid regime -55 Mozambique 42 97 Sub-Saharan Africa Low income Hybrid regime 4.0 -46 Zambia 46 92 Sub-Saharan Africa Low income Hybrid regime -41 Tanzania 50 91 Sub-Saharan Africa Low income Hybrid regime -35 Ghana 36 71 Sub-Saharan Africa Low income Flawed democracy 3.5 -31 Cameroon 72 103 Sub-Saharan Africa Lower middle income Authoritarian regime -29 Bangladesh 70 99 Asia Pacific Low income Hybrid regime POSITIVE PEACE INDEX SCORE -28 Malaysia 19 47 Asia Pacific Upper middle income Flawed democracy 3.0 -25 Indonesia 58 83 Asia Pacific Lower middle income Flawed democracy “The positive peace surplus countries are more diverse both geographically and in terms of their 2.5 type of government. Many of the countries are in high income or upper middle income groups. These countries have greater institutional capacity to 2.0 deal with external shocks and reduce their level of violence.” table 3.5: Top 10 Positive Peace Surplus Countries 1.5 Positive Peace Surplus Country GPI Rank PPI Rank Region Income Group Government Type 67 Israel 106 39 Middle East and North High income Flawed democracy 1.0 Africa 1.0 1.5 2.0 2.5 3.0 3.5 4.0 4.5 United States North America High income Full democracy INTERNAL PEACE 2011 53 of America 69 16 47 Bahrain 93 46 Middle East and North High income Authoritarian regime As shown in table 3.4, the top ten positive peace Africa higher positive peace they are unlikely to see declines deficit countries are mostly in Sub-Saharan Africa in violence, while also remaining vulnerable to 44 Georgia 100 56 Central and Eastern Lower middle income Hybrid regime Europe with three Asia Pacific countries, Bangladesh, external shock or violence. Indonesia, and Malaysia making up the ten. This 43 Colombia 103 60 Latin America Upper middle income Flawed democracy The stand-out example of the relationship between highlights a common trend in these nations where negative and positive peace is Tunisia which was the 38 Jamaica 82 44 Latin America Upper middle income Flawed democracy they are relatively peaceful but theoretically lack the eleventh-ranked positive peace deficit country on 2010 38 South Africa 89 51 Sub-Saharan Africa Upper middle income Flawed democracy institutions to adequately deal with external shocks or data. It has since seen a significant increase in violence 36 Mexico 91 55 Latin America Upper middle income Flawed democracy move closer to peace. This suggests that while these with the outbreak of the Arab Spring in late 2010. In 36 Turkey 97 61 Central and Eastern Upper middle income Hybrid regime countries have relatively moderate levels of violence, the 2012 GPI, Tunisia’s outright GPI rank has fallen Europe they comparatively lack positive peace. Without to 72nd. 35 Cyprus 60 25 Western Europe High income Flawed democracy 88 89
  • 46.
    Positive Peace deficit CASE STUDY Positive Peace deficit CASE STUDY Three countries which have fallen significantly on The closer these two lines, the closer the positive Chart 3.6. Egypt Positive Peace Scores compared to the Global Average the GPI in recent years are Egypt, Madagascar, and peace gap will be. It is assumed the 2010 positive Egypt lags in Acceptance of the Rights of Others, Levels of Syria, which have all seen serious increases in the level peace data is fairly representative of the previous years Corruption and Free Flow of Information compared to the global of violence over the four years since 2008. As can be as these institutions are thought to change slowly over average. egypt seen in chart 3.5, the six year trend in the GPI score time. global average is plotted against the 2010 Positive Peace Index score This shows that the levels of violence are ‘catching 3.25 adjusted and held constant for the six year period. up’ with the lower levels of positive peace. In 2008 This allows one to compare the level of violence or these countries were amongst the highest positive 2.75 negative peace to the level of positive peace. peace deficits countries in the world. This would What is clear is the solid lines, indicating negative indicate that the set of attitudes, structures, and 2.25 peace, have been converging or overlapping with the institutions that are in place are not adequate to dotted lines which show the level of positive peace. maintain the current level of peace. 1.75 3.0 CHART 3.5. Three Positive Peace deficit countries to 3.0 Syria Positive Peace Average 1.25 2.7 have fallen dramatically in the GPI 2.7 Syria 2.5 Madagascar would have had the highest positive peace deficit 2.5 in the world in 2007. Madagascar Positive Peace Average 0.75 2.3 2.3 Well Sound Equitable Acceptance Good Free High Low Madagascar 2.1 2.1 Functioning Business Distribution of the Rights Relations with Flow of Levels of Levels of Egypt Positive Peace Average Government Environment of Resources of Others Neighbours Information Education Corruption 1.9 1.9 (2010) (2010) (2010) (2010) (2010) (2010) (2010) (2010) Egypt 1.7 1.7 1.5 1.5 3.0 2007 2008 2009 2010 2011 2012 3.0 Syria Positive Peace Average chart 3.7 Madagascar Positive Peace Scores compared to 2.7 2.7 Syria the Global Average 2.5 2.5 Madagascar lags in all of the positive peace indicators, but Madagascar Positive Peace Average Flow of Information and Relations mostly in Education, Free 2.3 2.3 with Neighbours. 3.25 Madagascar Madagascar 2.1 2.1 global average Egypt Positive Peace Average 2.75 1.9 1.9 Egypt 1.7 1.7 2.25 1.5 1.5 2007 2008 2009 2010 2011 2012 1.75 1.25 0.75 Well Sound Equitable Acceptance Good Free High Low Functioning Business Distribution of of the Rights Relations with Flow of Levels of Levels of Government Environment Resources of Others Neighbours Information Education Corruption (2010) (2010) (2010) (2010) (2010) (2010) (2010) (2010) 90 91
  • 47.
    Positive Peace deficit CASESTUDY Positive Peace by region Figure 3.8: Syria Positive Peace Scores compared to the CHART 3.9. PPI compared to GPI by region. Global Average The positive peace gap widens for countries outside Syria lags in Levels of Corruption, Free Flow of Information of the top 40 of the GPI and PPI and Acceptance of the Rights of Others. syria 120 western europe global average 3.25 asia pacific central and 100 2.75 eastern europe latin america POSITIVE PEACE INDEX RANK 2.25 80 middle east and north africa sub-saharan africa 1.75 60 north america 1.25 40 0.75 Well Sound Equitable Acceptance Good Free Flow of High Low Levels of Functioning Business Distribution of the Rights Relations with Information Levels of Corruption Government Environment of Resources of Others Neighbours (2010) Education (2010) 20 (2010) (2010) (2010) (2010) (2010) (2010) 0 0 20 40 60 80 100 120 GLOBAL PEACE INDEX RANK CHART 3.10: Total Positive Peace Gap by Region The majority of the world’s positive peace deficit is in Sub-Saharan Africa. Asia pacific Central and Eastern Europe Latin America Middle East and North Africa North America Sub-Saharan Africa Western Europe -500 -400 -300 -200 -100 0 100 200 Chart 3.10 shows the majority of the world’s positive peace deficit on average is the Asia Pacific region peace deficit is in Sub-Saharan Africa, indicating which has large positive peace deficit countries in institutional capacity to move countries further away Bangladesh, Indonesia, and Malaysia. from conflict and vulnerability to conflict remains lowest there. The only other region with a positive 92 93
  • 48.
    Positive Peace Positive Peace by region by region western Central and europe Eastern Europe table 3.7: Central and Eastern Europe PPI rankings table 3.6. Western Europe PPI rankings Country Regional Rank 2011 GPI Rank PPI Rank PPI Score Income Group Government Type Country Regional Rank 2011 GPI Rank PPI Rank PPI Score Income Group Government Type Sweden 1 13 1 1.170 High Income Full democracy Estonia 1 41 21 1.838 High income Flawed democracy Norway 2 9 2 1.174 High Income Full democracy Slovenia 2 10 22 1.839 High income Flawed democracy Finland 3 7 3 1.240 High Income Full democracy Czech Republic 3 5 23 1.913 High income Full democracy Denmark 4 4 4 1.267 High Income Full democracy Hungary 4 20 28 2.088 High income Flawed democracy Iceland 5 1 5 1.328 High Income Full democracy Lithuania 5 37 29 2.139 Upper middle income Flawed democracy Netherlands 6 25 6 1.381 High Income Full democracy Slovakia 6 23 30 2.141 High income Flawed democracy Switzerland 7 16 7 1.382 High Income Full democracy Poland 7 22 33 2.185 High income Flawed democracy Ireland 8 11 10 1.472 High Income Full democracy Latvia 8 40 34 2.187 High income Flawed democracy Germany 9 15 11 1.491 High Income Full democracy Croatia 9 33 40 2.421 High income Flawed democracy Belgium 10 14 13 1.520 High Income Full democracy Bulgaria 10 47 41 2.516 Upper middle income Flawed democracy United Kingdom 11 26 14 1.521 High Income Full democracy Macedonia 11 66 49 2.677 Upper middle income Flawed democracy Austria 12 6 15 1.522 High Income Full democracy Albania 12 54 50 2.684 Upper middle income Hybrid regime France 13 32 18 1.707 High Income Flawed democracy Georgia 13 100 56 2.828 Lower middle income Hybrid regime Spain 14 27 20 1.829 High Income Full democracy Turkey 14 97 61 2.910 Upper middle income Hybrid regime Portugal 15 17 24 1.931 High Income Full democracy Mongolia 15 51 65 2.942 Upper middle income Flawed democracy Cyprus 16 60 25 2.003 High Income Flawed democracy Moldova 16 53 68 2.998 Lower middle income Flawed democracy Italy 17 39 31 2.157 High Income Flawed democracy Ukraine 17 59 69 3.001 Lower middle income Flawed democracy Greece 18 56 36 2.216 High Income Flawed democracy Kazakhstan 18 76 70 3.019 Upper middle income Authoritarian regime Armenia 19 84 72 3.027 Lower middle income Hybrid regime Azerbaijan 20 92 75 3.108 Upper middle income Authoritarian regime Russia 21 108 81 3.128 Upper middle income Hybrid regime 94 95
  • 49.
    Positive Peace Positive Peace by region by region asia latin pacific america Table 3.8: Asia Pacific PPI rankings Table 3.9. LATIN AMERICA PPI rankings Country Regional Rank 2011 GPI Rank PPI Rank PPI Score Income Group Government Type Country Regional Rank 2011 GPI Rank PPI Rank PPI Score Income Group Government Type New Zealand 1 2 9 1.412 High income Full democracy Chile 1 34 27 2.058 Upper middle income Flawed democracy Australia 2 18 12 1.507 High income Full democracy Uruguay 2 21 35 2.200 Upper middle income Full democracy Japan 3 3 17 1.634 High income Full democracy Costa Rica 3 29 38 2.296 Upper middle income Full democracy Singapore 4 24 19 1.747 High income Hybrid regime Jamaica 4 82 44 2.585 Upper middle income Flawed democracy South Korea 5 44 26 2.009 High income Full democracy Trinidad and 5 67 45 2.589 High Income Flawed democracy Tobago Kuwait 6 28 42 2.547 Low income Authoritarian regime Argentina 6 49 48 2.630 Upper middle income Flawed democracy Malaysia 7 19 47 2.595 Upper middle income Flawed democracy Panama 7 43 52 2.700 Upper middle income Flawed democracy Thailand 8 83 66 2.982 Lower middle income Flawed democracy Brazil 8 63 54 2.784 Upper middle income Flawed democracy China 9 68 78 3.114 Lower middle income Authoritarian regime Mexico 9 91 55 2.785 Upper middle income Flawed democracy Philippines 10 102 79 3.117 Lower middle income Flawed democracy Peru 10 71 57 2.829 Upper middle income Flawed democracy Sri Lanka 11 96 82 3.147 Lower middle income Flawed democracy El Salvador 11 80 58 2.858 Lower middle income Flawed democracy Indonesia 12 58 83 3.150 Lower middle income Flawed democracy Dominican 12 75 59 2.885 Upper middle income Flawed democracy India 13 101 87 3.297 Lower middle income Flawed democracy Republic Bangladesh 14 70 99 3.526 Low income Hybrid regime Colombia 13 103 60 2.889 Upper middle income Flawed democracy Cambodia 15 86 100 3.528 Low income Hybrid regime Guyana 14 73 64 2.939 Low income Hybrid regime Pakistan 16 107 105 3.808 Lower middle income Hybrid regime Ecuador 15 74 77 3.114 Lower middle income Hybrid regime Paraguay 16 57 80 3.118 Lower middle income Flawed democracy Bolivia 17 64 84 3.208 Lower middle income Hybrid regime Honduras 18 88 85 3.210 Lower middle income Hybrid regime Guatemala 19 95 86 3.223 Lower middle income Flawed democracy Venezuela 20 94 89 3.346 Upper middle income Hybrid regime 96 97
  • 50.
    Positive Peace Positive Peace by region by region middle east north america and north africa Table 3.10: Middle East and North Africa PPI rankings Table 3.11: North America PPI rankings Country Regional Rank 2011 GPI Rank PPI Rank PPI Score Income Group Government Type Country Regional Rank 2011 GPI Rank PPI Rank PPI Score Income Group Government Type Qatar 1 12 32 2.181 High Income Authoritarian regime Canada 1 8 8 1.383 High income Full democracy United Arab 2 30 37 2.242 High Income Authoritarian regime United States Emirates of America 2 69 16 1.545 High income Full democracy Israel 3 106 39 2.353 High Income Flawed democracy Bahrain 4 93 46 2.592 High Income Authoritarian regime Tunisia 5 38 62 2.915 Lower middle income Authoritarian regime Saudi Arabia 6 79 63 2.924 High Income Authoritarian regime Jordan 7 55 67 2.997 Lower middle income Authoritarian regime Morocco 8 52 74 3.104 Lower middle income Authoritarian regime Egypt 9 62 76 3.112 Lower middle income Authoritarian regime Syria 10 87 93 3.400 Lower middle income Authoritarian regime Iran 11 90 95 3.427 Upper middle income Authoritarian regime 98 99
  • 51.
    Positive Peace by region Positive Peace by Income Group Sub-Saharan Low Income countries have a high chart 3.12: PPI BY INCOME GROUP Africa positive peace deficit on average, but 4.0 LESS PEACEFUL average there is little difference between upper ppi middle and high income countries 3.5 suggesting positive peace is only 3.0 associated with income at a certain threshold. 2.5 • There is a graduated relationship between positive peace and income. High income countries tend to 2.0 be the most peaceful and low incomes countries tend to be the least peaceful. 1.5 • The smallest gap is between the high income group MORE PEACEFUL 1.0 and upper middle income group. • There is a large positive peace deficit for low 0.5 Table 3.12: Sub-Saharan Africa PPI rankings income countries and a small net positive peace deficit for lower middle income countries. 0.0 Low Lower Upper High Income Middle Middle income Country Regional Rank 2011 GPI Rank PPI Rank PPI Score Income Group Government Type Income Income Botswana 1 31 43 2.561 Upper middle income Flawed democracy CHART 3.11: GPI BY INCOME GROUP chart 3.13: Income Group Peace Gap by Rank South Africa 2 89 51 2.698 Upper middle income Flawed democracy Namibia 3 48 53 2.783 Upper middle income Flawed democracy 2.5 average positive peace 400 gpi gap by rank POSITIVE PEACE SURPLUS Ghana 4 36 71 3.021 Low income Flawed democracy Nicaragua 5 61 73 3.102 Low income Authoritarian regime 300 Senegal 6 65 88 3.338 Low income Hybrid regime 2.0 200 Malawi 7 35 90 3.374 Low income Hybrid regime Tanzania 8 50 91 3.385 Low income Hybrid regime 100 Zambia 9 46 92 3.395 Low income Hybrid regime 1.5 0 Madagascar 10 81 94 3.400 Low income Authoritarian regime Kenya 11 85 96 3.459 Low income Hybrid regime -100 1.0 Mozambique 12 42 97 3.485 Low income Hybrid regime POSITICE PEACE DEFLICT -200 Mali 13 78 98 3.495 Low income Authoritarian regime Uganda 14 77 101 3.542 Low income Hybrid regime -300 0.5 Burkina Faso 15 45 102 3.589 Low income Authoritarian regime -400 Cameroon 16 72 103 3.760 Lower middle income Authoritarian regime Ethiopia 17 99 104 3.761 Low income Authoritarian regime -500 0.0 Low Lower Upper High Nigeria 18 105 106 3.845 Lower middle income Authoritarian regime Low Lower Upper High Income Middle Middle income Income Middle Middle income Cote d'Ivoire 19 98 107 3.881 Lower middle income Authoritarian regime Income Income Income Income Zimbabwe 20 104 108 4.016 Low income Authoritarian regime 100 101
  • 52.
    Positive Peace by Government Type Positive Peace by Government Type CHART 3.14: GPI VS. PPI by government type • Full democracies on average clearly have the best chart 3.16: PPI Average by government type It is clear full democracies have the highest levels of peace on both the average PPI and GPI scores. They also have the GPI and PPI and the lowest average peace gap. smallest average positive peace deficit. 3.5 PPI AVERAGE 120 • Hybrid regimes are on average slightly less peaceful 3.0 on the GPI than authoritarian regimes. They have the same average PPI score and close to the same 2.5 average positive peace deficit. 100 Flawed Democracy • Flawed democracies notably have the largest 2.0 Authoritarian regime positive peace surplus which is noted above. Hybrid Regime 1.5 Full Democracy 80 1.0 POSITIVE PEACE INDEX RANK 0.5 chart 3.15: GPI Average by government type 0.0 60 Authoritarian Hybrid Flawed Full 2.5 2011 gpi Regimes regime democracy democracy average 2.0 40 chart 3.17: Peace gap by government type 400 POSITIVE PEACE SURPLUS peace gap 1.5 300 20 200 1.0 100 0 0 20 40 60 80 100 120 0.5 GPI PEACE INDEX RANK 0 POSITICE PEACE DEFLICT -100 0.0 Authoritarian and hybrid regimes Authoritarian Hybrid Flawed Full regime regime democracy democracy on average have the same levels of -200 positive peace deficits whereas flawed democracies on average have a positive -300 Authoritarian Hybrid Flawed Full peace surplus. This suggests comparative regime regime democracy democracy to other governance types, there could be a potential for flawed democracies to increase in peace and conversely, downside risks for authoritarian and hybrid regimes. 102 103
  • 53.
    Positive Peace by Indicator Domain Positive Peace by Indicator Domain chart 3.21: Acceptance of the Rights of Others Score chart 3.18. Well-Functioning Government score by region by region Latin America and Sub-Saharan Africa are the poorest performers on The Middle East and North Africa has the poorest performance on Well-Functioning Government. Acceptance of the Rights of Others measures. Asia Pacific Asia Pacific Central and Eastern Europe Central and Eastern Europe Latin America Latin America Middle East and North Africa Middle East and North Africa North America North America Sub-Saharan Africa Sub-Saharan Africa Western Europe Western Europe 0.0 0.5 1.0 1.5 2.0 2.5 0.0 0.5 1.0 1.5 2.0 2.5 3.0 MORE POSITIVE PEACE LESS POSITIVE PEACE MORE POSITIVE PEACE LESS POSITIVE PEACE chart 3.19. Equitable Distribution of Resources chart 3.22: Good Relations with Neighbours score score by region by region Sub-Saharan Africa is the worst performer on the three indicators Good Relations with Neighbours is the only positive peace of Equitable Distribution of Resources. indicator where North America is not the highest performer. Asia Pacific Asia Pacific Central and Eastern Europe Central and Eastern Europe Latin America Latin America Middle East and North Africa Middle East and North Africa North America North America Sub-Saharan Africa Sub-Saharan Africa Western Europe Western Europe 0.0 0.2 0.4 0.6 0.8 1.0 1.2 1.4 1.6 1.8 0.0 0.2 0.4 0.6 0.8 1.0 1.2 1.4 1.6 1.8 2.0 MORE POSITIVE PEACE LESS POSITIVE PEACE MORE POSITIVE PEACE LESS POSITIVE PEACE chart 3.20 Sound Business Environment score by region chart 3.23: Free Flow of Information score by region Central and Eastern Europe score more poorly than the Asia The Middle East and North Africa and Sub-Saharan Africa have Pacific and the Middle East and North Africa on Sound Business equally poor scores on Free Flow of Information. Environment measures. Asia Pacific Asia Pacific Central and Eastern Europe Central and Eastern Europe Latin America Latin America Middle East and North Africa Middle East and North Africa North America North America Sub-Saharan Africa Sub-Saharan Africa Western Europe Western Europe 0.0 0.5 1.0 1.5 2.0 2.5 0.0 0.5 1.0 1.5 2.0 2.5 MORE POSITIVE PEACE LESS POSITIVE PEACE MORE POSITIVE PEACE LESS POSITIVE PEACE 104 105
  • 54.
    Positive Peace by IndicatorDomain Trends in Individual Positive Peace Indicators chart 3.24: High Levels of Education score by region Several data points in the PPI have a time series going Sub-Saharan Africa is lagging on mean years of schooling and back several years, allowing one to visualise broad secondary school enrolment rates. Latin America, Middle East and North Africa and the Asia Pacific all have similar scores. global and regional trends. The entire PPI cannot be taken back consistently as some data points, such as Asia Pacific the United Nation’s IHDI only go back as far as 2010 Central and Eastern Europe and is limited by number of countries covered. Latin America Middle East and North Africa Global Trend Decreasing Cohesion chart 3.26: Acceptance of the Rights of Others – ISS’s North America Biggest Faller Western Europe Intergroup Cohesion 1990 - 2010 Sub-Saharan Africa The data suggests intergroup cohesion as measured by the ISS Note Data collected for each period Western Europe has fallen since 2000. varies. 0.0 0.2 0.4 0.6 0.8 1.0 1.2 1.4 1.6 1.8 2.0 0.9 MORE POSITIVE PEACE LESS POSITIVE PEACE Western Europe western europe 0.8 asia pacific 0.7 Sub-Saharan Africa central and chart 3.25: Low Levels of Corruption score by region Latin America has the second highest levels of corruption after 0.6 North America eastern europe 0.5 latin america Sub-Saharan Africa. Middle East and Nort middle east 0.4 and north africa Asia Pacific 0.3 Latin America sub-saharan Central and Eastern Europe Latin America 0.2 Central and Eastern E africa 0.1 north america Middle East and North Africa Asia-Pacific 0.0 North America 1990 1995 2000 2005 2010 Sub-Saharan Africa Western Europe chart 3.27: Free Flow of Information – International 0.0 0.5 1.0 1.5 2.0 2.5 3.0 Global Trend Decreasing Press Freedom Press Freedom Index MORE POSITIVE PEACE LESS POSITIVE PEACE Biggest Riser N/A Press Freedom has been decreasing globally since 2008. The biggest loss in press freedom over the period is in Sub-Saharan Biggest Faller Sub-Saharan Africa Africa. 70 western europe PRESS FREEDOM asia pacific 60 central and 50 eastern europe LESS latin america 40 middle east 30 and north africa PRESS FREEDOM sub-saharan 20 africa north america 10 MORE 0 2002 2003 2004 2005 2006 2007 2008 2009 2010 106 107
  • 55.
    Trends in Individual Positive PeaceIndicators Conclusion Global Trend Slight increase in corruption Figure 3.28: Low Levels of Corruption – WGI - Control of Biggest Riser Central & Eastern Europe (falling In contrast to the Global Peace Index which measures peace gap, with a surplus indicating a high level Corruption (1996 – 2009) corruption) negative peace, this study is the first attempt by of institutional capacity to support lower levels Corruption in Central and Eastern Europe has been steadily Biggest Faller Asia-Pacific (increasing corruption) the Institute for Economics and Peace to build a of violence as measured by the GPI. Countries falling while it has increased in the Asia Pacific since 1996. Note Does not consider standard errors Positive Peace Index from six years of GPI data for with a peace deficit have a comparatively greater over 108 countries. Defining positive peace as “the vulnerability to external shocks and a higher risk 1.2 CORRUPTION western europe set of attitudes, institutions and structures which of an increased level of violence. On average, the 1.0 asia pacific when strengthened, lead to a more peaceful society” majority of the world’s positive peace deficit is in Sub- 0.8 it is possible to empirically derive key indicators and Saharan Africa with the peace gap greatest for low LESS 0.6 central and eastern europe weightings of positive peace via analysis of six years of income countries. 0.4 latin america GPI data. The outcome is the first known attempt to Countries such as Egypt, Madagascar and Syria 0.2 0.0 middle east build a statistically derived comprehensive composite are clear examples of countries with peace deficits index of positive peace. in 2008 which subsequently experienced large CORRUPTION and north africa -0.2 -0.4 sub-saharan The results of the PPI enable to conceptualise a increases in violence over the next four years. Their africa nation’s multidimensional institutional capacity and respective falls on the GPI ranking leads to the GPI MORE -0.6 north america -0.8 resilience to deal with external shocks and avoid and PPI scores converging, showing levels of violence 1996 1998 2000 2002 2003 2004 2005 2006 2007 2008 2009 conflict. Perhaps unsurprisingly, the nations at the ‘catching up’ with levels of positive peace. In 2008, top of the PPI tend to be high on the GPI, in the high these countries would have had amongst the highest Chart 3.29: High Levels of Education – Mean years of income category, and full democracies as defined positive peace deficits in the world, indicating the schooling (1980 – 2010) Global Trend Increasing mean years of schooling by the EIU Democracy Index. On average, North set of attitudes, structures, and institutions in place Since 1980, the Middle East and North Africa has seen the largest rises in mean years of schooling. Biggest Riser Middle East & North Africa America and Western Europe are the most positively compared to other countries were not adequately peaceful regions, with Sub-Saharan Africa clearly well aligned to facilitate a peaceful resolution of conflict. western europe behind on positive peace. Interestingly, the average Ultimately, the analysis presented here is a first 14 positive peace score is close to equal in Central and attempt at quantifying positive peace. It is hoped to be MORE MEAN asia pacific SCHOOLING Eastern Europe, the Asia Pacific, Latin America and further complemented by qualitative country-specific YEARS OF 12 central and eastern europe the Middle East and North Africa. This suggests these research. 10 latin america diverse regions on average face similar challenges in middle east terms building resilience and institutional capacity. 8 and north africa The lower ranked nations in the PPI tend to be 6 sub-saharan lower income nations with hybrid or authoritarian africa regimes. Despite the fact that hybrid regimes are FEWER MEAN 4 SCHOOLING north america on average slightly less peaceful than authoritarian YEARS OF 2 regimes on the GPI, they tend to have the same 0 average PPI score. Evidently, the countries facing 1980 1985 1990 1995 2000 2001 2002 2003 2004 2005 2006 2007 2008 2009 2010 governance or economic constraints will have ongoing challenges in boosting their levels of positive peace. Additionally, with the available trend data showing purported declines in intergroup cohesion, slight increases in corruption and declines in press freedom, there may be future challenges to boosting positive peace. This analysis has enabled a comparison between a nation’s positive peace score and GPI score, which measures negative peace. The difference between the GPI and PPI rank has been referred to as the 108 109
  • 56.
    Annex A Annex A Number of internal security officers and police per 100,000 people Number of homicides per 100,000 people Number of jailed population per 100,000 people GPI INDICATOR SOURCES, DEFINITIONS AND SCORING CRITERIA Weight (1 to 5) 3 Weight (1 to 5) 4 Weight (1 to 5) 3 Type Quantitative Type Quantitative Type Quantitative Main source 12th UNODC Survey Main source 12th UNODC Survey Main source International Centre for The information below details the sources, definitions and scoring criteria of the 23 indicators that form the Global Year 2004-09, depending upon Year 2004-10, depending upon Prison Studies, World Prison Peace Index. All scores for each indicator are “banded”, data availability data availability Population List (9th edition) either on a scale of 1-5 (for qualitative indicators) or 1-9 Year 2002-11, depending upon Alternate source Alternate source (for quantitative data). However, those in the latter group data availability have then been converted to a 1-5 scale for comparability Economist Intelligence Unit. Where data is not provided, Economist Intelligence Unit. Where data is not provided, the when compiling the final index. Where there are gaps the Economist Intelligence Unit’s analysts have filled them EIU’s analysts have filled them based on likely scores from Definition in data, the Economist Intelligence Unit’s analysts have based on likely scores from the set bands of the actual data. the set bands of the actual data. Figures are from the International Centre for Prison estimated scores. The latest available data are always used. Studies, and are compiled from a variety of sources. In Definition Definition almost all cases the original source is the national prison This indicator comes from the United Nations Survey Intentional homicide refers to death deliberately inflicted administration of the country concerned, or else the INTERNAL PEACE: 60% of Crime Trends and Operations of Criminal Justice on a person by another person, including infanticide. The Ministry responsible for the prison administration. Prison Systems (UN-CTS), and refers to the civil police force. figures refer to the total number of penal code offences population rates per 100,000 of the national population are Police Personnel means personnel in public agencies whose or their equivalent, but excluding minor road traffic and based on estimates of the national population. principal functions are the prevention, detection and other petty offences, brought to the attention of the police LEVEL OF PERCEIVED investigation of crime and the apprehension of alleged or other law enforcement agencies and recorded by one of In order to compare prison population rates, and CRIMINALITY in society offenders. It is distinct from national guards or local militia. those agencies. to estimate the number of persons held in prison in the Weight (1 to 5) 3 countries for which information is not available, median Type Qualitative rates have been used by the International Center for Prison Scoring criteria Scoring criteria Studies to minimise the effect of countries with rates that Main source Economist Intelligence Unit 1 2 3 4 5 1 2 3 4 5 are untypically high or low. Indeed, comparability can be 0 - 199.8 199.9 - 399.9 - 599.9 - > 799.9 0 - 1.99 2 - 5.99 6 - 9.99 10 - 19.99 > 20 Year 2011-12 compromised by different practice in different countries, 399.8 599.8 799.8 for example with regard to pre-trial detainees and juveniles, Additional notes Additional notes but also psychiatrically ill offenders and offenders being Definition This year’s GPI smoothes data for Burkina Faso, Cambodia, For Jordan, data for “paramilitary under the command detained for treatment for alcoholism and drug addiction. Assessment of the level of perceived criminality in society, Cameroon, Cote d’Ivoire, Ethiopia, Ghana, Guinea, Kenya, of the Ministry of Interior” provided by the IISS Military People held in custody are usually omitted from national ranked from 1-5 (very low to very high) by the Economist Sierra Leone, and Uganda. This was due to new and more Balance 2011 was used to estimate the total number of totals if they are not under the authority of the prison Intelligence Unit’s Country Analysis team. Country analysts reliable data becoming available. Smoothing the data over internal security and police officers. administration. are asked to assess this indicator on an annual basis, for the a period of two to three years means that these countries’ period March to March. scores for this indicator do not move substantially in just Scoring criteria one year, which could lead to false assumptions being made Scoring criteria about an improvement or deterioration in score. 1 1.5 2 2.5 3 1=Very low: the majority of other citizens can be trusted. 0 - 109.74 109.75 - 199.5 289.25 - 379.0 - Very low levels of domestic security. 199.4 -289.24 378.9 468.74 2= Low: an overall positive climate of trust with other 3.5 4 4.5 5 citizens. 468.75 - 558.5 - 648.25 - > 738 3=Moderate: reasonable degree of trust in other citizens. 558.4 648.24 737.9 4= High: high levels of distrust in other citizens. High levels Additional notes of domestic security. The data provided by World Prison Briefs are not annual 5= Very high: very high levels of distrust in other citizens - averages but indicate the number of jailed population per people are extremely cautious in their dealings with others. 100,000 inhabitants in a particular month during the year. Large number of gated communities, high prevalence of The year and month may differ from country to country. security guards. 1 2 3 4 5 Very Low Moderate High Very High Low Additional notes The weighting for this indicator has decreased this year from 4 to 3. 110 111
  • 57.
    Annex A Annex A Ease of access to small Level of organised Likelihood of Level of arms and light weapons conflict (internal) violent demonstrations violent crime Weight (1 to 5) 3 Weight (1 to 5) 5 Weight (1 to 5) 3 Weight (1 to 5) 4 Type Qualitative Type Qualitative Type Qualitative Type Qualitative Main source Economist Intelligence Unit Main source Economist Intelligence Unit Main source Economist Intelligence Unit Main source Economist Intelligence Unit Year 2011-12 Year 2011-12 Year 2011-12 Year 2011-12 Definition Definition Definition Assessment of the accessibility of small arms and light Definition Assessment of the intensity of conflicts within the country, Assessment of the likelihood of violent demonstration weapons (SALW), ranked from 1-5 (very limited access Assessment of the likelihood of violent crime ranked from ranked from 1-5 (no conflict to severe crisis) by the ranked from 1-5 (very low to very high) by the Economist to very easy access) by the Economist Intelligence Unit’s 1 to 5 (very low to very high) by the Economist Intelligence Economist Intelligence Unit’s Country Analysis team. Intelligence Unit’s Country Analysis team, based on the Country Analysis team. Unit’s Country Analysis team based on the question Country analysts are asked to assess this indicator on an question “Are violent demonstrations or violent civil/labour Country analysts are asked to assess this indicator on an “Is violent crime likely to pose a significant problem for annual basis, for the period March to March. unrest likely to pose a threat to property or the conduct of annual basis, for the period March to March. government and/or business over the next two years?”. business over the next two years?”. Scoring criteria Country analysts assess this question on a quarterly Country analysts assess this question on a quarterly Scoring criteria 1 = No conflict basis. The score provided for March 2011 - March 2012 is basis. The score provided for March 2011 - March 2012 is 1 = Very limited access: the country has developed policy the average of the scores given for each quarter. 2 = Latent conflict: positional differences over definable the average of the scores given for each quarter. instruments and best practices, such as firearm licences, values of national importance. strengthening of export controls, codes of conduct, firearms or ammunition marking. 3 = Manifest conflict: explicit threats of violence. Scoring criteria Scoring criteria Imposition of economic sanctions by other countries. 1 2 3 4 5 2 = Limited access: the regulation implies that it is difficult, 1 2 3 4 5 time-consuming and costly to obtain firearms. Domestic 4 = Crisis: a tense situation across most of the country. At Strongly No Somewhat Yes Strongly Strongly No Somewhat Yes Strongly least one group uses violent force in sporadic incidents. no of a yes firearms regulation also reduces the ease with which legal no of a yes 5 = Severe crisis: civil war - violent force is used with a problem arms are diverted to illicit markets. problem certain continuity in an organized and systematic way 3 = Moderate access: there are regulations and commitment throughout the country. to ensure controls on civilian possession of firearms, although inadequate controls are not sufficient to stem the 1 2 3 4 5 flow of illegal weapons. No Latent Manifest Crisis Severe 4 = Easy access: there are basic regulations, but they are not conflict conflict conflict crisis effectively enforced. Obtaining firearms is straightforward. 5 = Very easy access: there is no regulation of civilian possession, ownership, storage, carriage and use of firearms 1 2 3 4 5 Very Limited Moderate Easy Very easy limited access access access access access 112 113
  • 58.
    Annex A Annex A Political Political Political Terror Scale (CONT.) Volume of transfers of major conventional instability Terror Scale weapons, as recipient (Imports) per 100,000 people 1 2 3 Weight (1 to 5) 4 Weight (1 to 5) 4 Secure rule of law Limited amount of Extensive political Type Qualitative imprisonment for imprisonment Weight (1 to 5) 2 Type Qualitative nonviolent political Main source Economist Intelligence Unit Type Quantitative Main source Gibney, M., Cornett, L., & activity Year 2011-12 Wood, R., Political Terror Scale Main source SIPRI Arms Transfers Database; 1976-2011. Data retrieved from Year 4 5 2006-10 http://www.politicalterrorscale.org Definition Civil and political rights Terror has expanded to the Assessment of political instability ranked from 0 to 100 Year 2010 violations have expanded to whole population Definition (very low to very high instability) by the Economist large numbers of the population Measures the total volume of major conventional weapons Intelligence Unit’s Country Analysis team, based on the Definition imported by a country between 2006 and 2010, divided by question “Are political institutions sufficiently stable to The Political Terror Scale measures levels of political the average population in this time period at the 100,000 support the needs of businesses and investors?”. This violence and terror that a country experiences in a people level (population data supplied by the Economist Additional notes indicator aggregates 5 other questions on social unrest, particular year based on a 5-level “terror scale”. The data Intelligence Unit). orderly transfers, opposition stance, excessive executive Renamed Political Terror Scale from ‘Level of disrespect of used in compiling this index comes from two different The SIPRI Arms Transfers Database covers all authority, and an international tension sub-index (each of human rights (Political Terror Scale)’. sources: the yearly country reports of Amnesty International international sales and gifts of major conventional weapons which is ranked from 0 to 20). and the U.S. State Department Country Reports on Human and the technology necessary for the production of them. Country analysts assess this question on a quarterly Rights Practices. The average of the two scores is taken for The transfer equipment or technology is from one country, basis. The score provided for March 2011 - March 2012 is our assessment. rebel force or international organisation to another the average of the scores given for each quarter. country, rebel force or international organisation. Major Scoring criteria conventional weapons include: aircraft, armoured vehicles, 1 = Countries under a secure rule of law, people are not artillery, radar systems, missiles, ships, engines. Scoring criteria imprisoned for their view, and torture is rare or exceptional. 1 2 3 4 5 Political murders are extremely rare. Scoring criteria 0 - 20 20.5 - 40 40.5 - 60 60.5 - 80 80.5 - 100 2 = There is a limited amount of imprisonment for 1 1.5 2 2.5 3 nonviolent political activity. However, few persons are affected, torture and beatings are exceptional. Political 0 - 7.596 7.597 - 15.193 - 22.789 - 30.385 - 15.192 22.788 30.384 37.980 murder is rare. 3 = There is extensive political imprisonment, or a recent 3.5 4 4.5 5 history of such imprisonment. Execution or other political 37.981 - 45.577 - 53.173 - > 60.769 murders and brutality may be common. Unlimited 45.576 53.172 60.768 detention, with or without a trial, for political views is accepted. 4 = Civil and political rights violations have expanded to large numbers of the population. Murders, disappearances, and torture are a common part of life. In spite of its generality, on this level terror affects those who interest themselves in politics or ideas. 5 = Terror has expanded to the whole population. The leaders of these societies place no limits on the means or thoroughness with which they pursue personal or ideological goals. 114 115
  • 59.
    Annex A Annex A TerrorisT acts Number of deaths from external PEACE : 40% Number of armed services organised conflict (internal) personnel per 100,000 people Weight (1 to 5) 2 Weight (1 to 5) 5 Military expenditure Weight (1 to 5) 2 Type Quantitative as a percentage of GDP Type Qualitative Type Quantitative Main source National Consortium for the Study of Terrorism and Responses Main source International Institute for Main source The International Institute for to Terrorism (START). Strategic Studies Armed Conflict Weight (1 to 5) 2 Strategic Studies, The Military Global Terrorism Database Database (IISS ACD) Type Quantitative Balance 2012 (2011), Institute for Economics Year 2010-11 Main source The International Institute for Year 2010-11 and Peace Strategic Studies, The Military Year 2012 Alternate source Balance 2012 Alternate source EIU. When no data was provided by the IISS ACD, then EIU Year 2010-11 When no data was provided, two alternative sources were Definition analysts have scored the figures available for 2010 and 2011 used: FIRST database - SIPRI BICC, and the Military This indicator is a weighted average score relying on according to the set bands of the actual data. Balance 2011. Alternative data are from 2009-10. World Alternate source different types of attacks. Terrorism incidents are defined Bank population data used if unavailable from the EIU. Definition When no data was provided, several alternative sources as “intentional acts of violence or threat of violence by a This indicator uses the UCDP’s definition of conflict. were used: National Public Expenditure Accounts, SIPRI Definition non-state actor”. For all incidents listed, at least two of the UCDP defines conflict as: “a contested incompatibility information, and the Military Balance 2011. Alternative following three criteria must be present: Active armed services personnel comprise all servicemen that concerns government and/or territory where the use data are from 2007 to 2010, depending upon data 1. The act must be aimed at attaining a political, economic, and women on full-time duty in the army, navy, air force of armed force between two parties, of which at least one availability. religious, or social goal. and joint forces (including conscripts and long-term is the government of a state, results in at least 25 battle- assignments from the reserves). Population data provided by 2. There must be evidence of an intention to coerce, Definition related deaths in a year”. It excludes fatalities that took the EIU. intimidate, or convey some other message to a larger Cash outlays of central or federal government to meet the place during UN-mandated peacekeeping missions during audience (or audiences) than the immediate victims. costs of national armed forces—including strategic, land, 2010-11. 3. The action must be outside the context of legitimate naval, air, command, administration and support forces SCORING CRITERIA Statistics are compiled from the most recent edition as well as paramilitary forces, customs forces and border warfare activities. 1 1.5 2 2.5 3 of the IISS ACD, which has the following definition of guards if these are trained and equipped as a military force. armed conflict-related fatalities: ‘Fatality statistics relate to Published EIU data on nominal GDP (or the World Bank 0 - 660.94 660.95 - 1,311.91 - 1,962.86 - 2,613.82 - Scoring criteria military and civilian lives lost as a direct result of an armed when unavailable) was used to arrive at the value of military 1,311.90 1,962.85 2,613.81 3,264.76 conflict’. expenditure as a percentage of GDP. 1 1.5 2 2.5 3 3.5 4 4.5 5 The figures relate to the country which is the main 0 - 3.369 3.370 - 11.362 - 38.301 - 129.110 - 3,264.77 3,915.73 - 4,566.68 - >5,217.64 area of conflict. For some conflicts no reliable statistics 11.361 38.300 129.109 435.210 SCORING CRITERIA - 3,915.72 4,566.67 5,217.63 are available. Estimates of war fatalities vary according to 3.5 4 4.5 5 source, sometimes by a wide margin. In compiling data on A sliding scale from 1 through 5 with bandings set at the 0.1 Additional notes fatalities, the IISS has used its best estimates and takes full level of detail is used for this indicator. 435.211 - 1,467.034 - 4,945.158 - 16,669.411 Israel’s reservist force is used to calculate Israel’s number of 1,467.033 4,945.157 16,669.410 responsibility for these figures. Some overall fatality figures armed services personnel. have been revised in light of new information. Changes 1 2 3 4 5 in fatality figures may therefore occur as a result of such 0 - 3.11 3.12-6.39 6.4-9.67 9.68- >12.97 Additional notes revisions as well as because of increased fatalities. Fatality 12.96 As recommended by the expert panel, this indicator which figures for terrorism may include deaths inflicted by the Additional notes uses the Global Terrorism Database has replaced the government forces in counter-terrorism operations. This year’s scoring system for this indicator has changed to qualitative indicator ‘Potential for Terrorist Acts’. become more precise. Instead of using bandings at the 0.5 The weighting of this indicator has increased from 1 to 2 . Scoring criteria level, bandings at the 0.1 level are now used. 1 2 3 4 5    Iceland has no armed force. Budget is mainly for Coast 0 - 24.8 24.9 - 999.9 - 4,999.9 - > 9,999.9 Guards. 999.8 4,999.8 9,999.8    For GDP data on Afghanistan and Montenegro, the latest figures provided by the World Bank (2010) have been used. 116 117
  • 60.
    Annex A Annex A Financial contribution Aggregate weighted number Volume of transfers of Military capability/ to UN peacekeeping missons of heavy weapons per 100,000 people major conventional weapons as sophistication supplier (exports) per 100,000 people Weight (1 to 5) 2 Weight (1 to 5) 3 Weight (1 to 5) 2 Weight (1 to 5) 3 Type Quantitative Type Quantitative Type Qualitative Type Quantitative Main source Institute for Economics and Main source Institute of Economics and Main source Economist Intelligence Unit Peace; United Nations Committee Peace; SIPRI; United Nations Main source SIPRI Arms Transfers Year 2011-12 on Contributions Database; Year 2010 Year 2008-10 Year 2006-10 Definition Definition Assessment of the grade of sophistication and the extent of Definition This indicator is based on a categorised system for rating Definition military research and development (R&D), ranked from 1-5 Calculates the percentage of countries’ “outstanding the destructive capability of heavy weapons. There are Measures the total volume of major conventional weapons (very low to very high) by the Economist Intelligence Unit’s payments versus their annual assessment to the budget of five categories of weapons, each of which receive a certain exported by a country between 2006 and 2010 divided by Country Analysis team. the current peacekeeping missions” over an average of three number of weighted points. The total is then divided by the average population during this time period (population Country analysts are asked to assess this indicator on an years. This ratio is derived from United Nations Committee the population at the 100,000 level. The five weapons data supplied by the EIU). annual basis, for the period March to March. on Contributions Status reports. categories are weighted as follows: each armoured vehicle The SIPRI Arms Transfers Database covers all and artillery piece = 1 point; each tank = 5 points; each international sales and gifts of major conventional weapons Scoring criteria combat aircraft and combat helicopter = 20 points; each and the technology necessary for the production of them. 1 = Very low: no investment in military R&D. Principal SCORING CRITERIA warship = 100 points; and each aircraft carrier and nuclear The transfer equipment or technology is from one country, equipment is very old or obsolete. 1 1.5 2 2.5 3 submarine = 1000 points. rebel force or international organisation to another 2 = Low: minimal investment in military R&D. High 0 - 1.71 1.72 - 3.43 3.44 - 5.16 - 6.88 - Holdings are those of government forces and do not country, rebel force or international organisation. Major percentage of old and unsophisticated equipment. 5.15 6.87 8.59 include holdings of armed opposition groups. Heavy conventional weapons include: aircraft, armoured vehicles, 3 = Moderate: the country invests a small part of its military weapons numbers were determined using a combination artillery, radar systems, missiles, ships and engines. 3.5 4 4.5 5 expenditure in R&D. Principal equipment is a mixture of of: the International Institute for Strategic Studies, The 1 1.5 2 2.5 3 new and old and moderately sophisticated. 8.60 - 10.32 - 12.04 - >13.76 Military Balance and the United Nations Register of 10.31 12.03 13.75 Conventional Arms. Population data is supplied by the EIU. 0 - 2.972 2.973 - 5.945 - 8.918 - 11.891 - 4 = High: substantial investments in military R&D and in 5.944 8.917 11.890 14.863 maintenance. Principal equipment is relatively modern and Additional notes 1 1.5 2 2.5 3 sophisticated and is well maintained. All United Nations Member States share the costs of 3.5 4 4.5 5 0 - 23.62 23.63 - 47.26 - 70.89 - 118.16 - 5 = Very high: huge investment in military R&D and United Nations peacekeeping operations. The General 47.25 70.88 118.15 141.78 14.864 - 17.836 - 20.809 - > 23.782 armament production projects. Principal equipment is new Assembly apportions these expenses based on a special 17.835 20.808 23.781 and highly sophisticated. scale of assessments applicable to peacekeeping. This scale 3.5 4 4.5 5 takes into account the relative economic wealth of member 141.79 - 165.42 - 189.06 - >212.69 1 2 3 4 5 states, with the permanent members of the Security Council 165.41 189.05 212.68 Very low Low Moderate High Very high required to pay a larger share because of their special responsibility for the maintenance of international peace and security. 118 119
  • 61.
    Annex A Annex A Number of refugees and displaced RELATIONS WITH NEIGHBOURING COUNTRIES NUMBER OF EXTERNAL AND INTERNAL Estimated number of deaths from people as a percentage of the population CONFLICTS FOUGHT organised conflict (external) Weight (1 to 5) 5 Weight (1 to 5) 4 Weight (1 to 5) 5 Weight (1 to 5) 5 Type Qualitative Type Quantitative Type Quantitative Type Quantitative Main source Economist Intelligence Unit Main source UNHCR Statistical Yearbook Main source UCDP/PRIO Armed Conflict Main source UCDP/PRIO Armed Conflict Year 2011-12 2010; The Internal Displacement Dataset v.4-2011 Dataset v.4-2011 Monitoring Centre Definition Year 2004-09 Year 2010-11 Year 2010 Assessment of the intensity of contentiousness of neighbours, ranked from 1-5 (peaceful to very aggressive) by Alternate source Alternate source Definition the Economist Intelligence Unit’s Country Analysis team. Economist Intelligence Unit. Where there are data gaps, the When no data was provided, several alternative sources have Refugee population by country or territory of origin, plus Country analysts are asked to assess this indicator on EIU’s analysts have filled them based on likely scores from been used: International Institute for Strategic Studies (IISS) the number of a country’s internally displaced people (IDPs) an annual basis, for the period March to March. the set bands of the actual data. Armed Conflict Database; the Iraq Coalition Casualty as a percentage of the country’s total population. Definition Count, and the Economist Intelligence Unit. This indicator measures conflicts, as defined by UCDP, Scoring criteria Definition Scoring criteria which began in 2004 and were extant in 2004-09, irrespective of whether or not they ended during that period. This indicator uses the UCDP’s definition of conflict 1 1.5 2 2.5 3 1 = Peaceful: none of the neighbours has attacked the (see above). It excludes fatalities that took place during country since 1950. UCDP defines conflict as: “a contested incompatibility 0 - 1.50 1.51 - 3.03 - 4.55 - 6.07 - that concerns government and/or territory where the use of UN-mandated peacekeeping missions during 2010-11. 3.02 4.54 6.06 7.58 2 = Low: the relationship with neighbours is generally good, armed force between two parties, of which at least one is Calculating each country’s external conflict-related deaths but aggressiveness is manifest in politicians’ speeches or in during 2010-11 involved consulting several sources. the government of a state, results in at least 25 battle-related 3.5 4 4.5 5 protectionist measures deaths in a year”. 7.59 - 9.11 - 10.63 - >12.15 3 = Moderate: there are serious tensions and consequent Scoring criteria 9.10 10.62 12.14 economic and diplomatic restrictions from other countries Scoring criteria 1 2 3 4 5 4 = Aggressive: open conflicts with violence and protests 1 1.5 2 2.5 3 0 - 24.8 24.9 - 999.9 - 4,999.9 - > 9,999.9 999.8 4,999.8 9,999.8 5 = Very aggressive: frequent invasions by neighbouring 0 - 0.5874 0.5875 - 1.075 - 1.5625 - 2.05 - countries. 1.074 1.5624 2.04 2.5374 Additional notes 3.5 4 4.5 5 For countries involved in the conflict in Afghanistan as part 1 2 3 4 5 of the NATO-led International Security Assistance Force Peaceful Low Moderate Aggressive Very 2.5375 - 3.025 - 3.5125 - >4 (which UCDP describe as “providing secondary warring aggressive 3.024 3.5124 3.99 support to the government of Afghanistan in the intra-state Additional notes conflict with the Taleban that began in 2003”), statistics of This year’s GPI has not updated the figures for this fatalities provided by icasualties.org were used. This was indicator from the previous year, due to methodological also the source for the number of fatalities recorded among issues surrounding the new data. US and UK troops serving in the conflict in Iraq. For fatalities relating to the conflict between Armenia and Azerbaijan over Nagonro Karabakh, and relating to the conflict between India and Pakistan over Kashmir, the Armed Conflict Database compiled by the International Institute of Strategic Studies, adcd.iss.org is used. 120 121
  • 62.
    Annex B Annex B SOCIO-ECONOMICFACTORS DEMOCRACY AND Definition Definition INTERNATIONAL TRANSPARENCY Qualitative assessment of voter participation/turn-out for Percentage of the total number of representatives in the OPENNESS national elections, citizens’ engagement with politics. Ranked lower house. from 1 to 10 (very low to very high) by the Economist Additional notes Intelligence Unit’s Country Analysis team. Democracy Index Figures are based on information provided by national Exports + Imports as a % of GDP Main source Economist Intelligence Unit, parliaments by December 31st 2011 (except for the Main source Economist Intelligence Unit Political culture Democracy Index 2011 Democratic Republic of Congo for which no data was Main source Economist Intelligence Unit, Year 2011 available for December at the time of collection; so October Year 2011 Democracy Index 2011 2011 31st data was used). Definition Definition Year 2011 Measure of merchandise goods exports free on board and Qualitative assessment of the state of democracy in a Gender inequality merchandise goods imports free on board. Definition country. Ranked from 1 to 10 (very low to very high) Main source World Economic Forum, by the Economist Intelligence Unit’s Country Analysis Qualitative assessment of the degree of societal consensus Additional notes Global Gender Gap Report 2011 team. The overall Democracy index is based on five and cohesion to underpin a stable, functioning democracy; 2010 data used for Mongolia and North Korea. as well as the level of separation of church and state. Ranked Year 2011 categories: electoral process and pluralism; civil liberties; the functioning of government; political participation; and from 1 to 10 (very low to very high) by the Economist Foreign Direct Investment (flow) as Definition political culture. Intelligence Unit’s Country Analysis team. a % of GDP A composite index that assesses countries on how well they Main source Economist Intelligence Unit Civil liberties are dividing their resources and opportunities among their Electoral process male and female populations, regardless of the overall levels Year 2011 Main source Economist Intelligence Unit, Main source Economist Intelligence Unit, of these resources and opportunities. Democracy Index 2011 Democracy Index 2011 Definition Additional notes Net flows of direct investment capital by non-residents into Year 2011 Year 2011 2007 data used for Belarus and Uzbekistan. the country, as a percentage of GDP. Definition Definition Qualitative assessment of the prevalence of civil liberties. Is Freedom of the press Additional notes Qualitative assessment of whether elections are competitive there a free electronic media? Is there a free print media? Is 2010 data used for Central African Republic, Djibouti, and in that electors are free to vote and are offered a range of Main source Reporters Without Borders, there freedom of expression and protest? Are citizens free to North Korea. choices. Ranked from 1 to 10 (very low to very high) by the World Press Freedom Index Economist Intelligence Unit’s Country Analysis team. form professional organisations and trade unions? Ranked 2011-12 from 1 to 10 (very low to very high). Number of visitors as a % Year 2011 of domestic population Functioning of government Corruption perceptions Definition Main source UNWTO Yearbook of Tourism Statistics, Compendium of Main source Economist Intelligence Unit, The index measures the state of press freedom in the world, Main source Transparency International, Tourism Statistics and data files; Democracy Index 2011 reflecting the degree of freedom journalists and news Corruption Perceptions Index Economist Intelligence Unit organisations enjoy in each country, and the efforts made by Year 2011 2011 the state to respect and ensure respect for this freedom. Year 2009-10, depending upon data Year 2011 availability Definition Additional notes Qualitative assessment of whether freely elected Definition A different scoring system has been used for the Press Definition representatives determine government policy and whether The Index draws on multiple expert opinion surveys that poll Freedom Index this year. Reporters without Borders states Number of visitors as a percentage of the domestic there is an effective system of checks and balances on the perceptions of public sector corruption, scoring countries that “In order to have a bigger spread in the scores and population (population data supplied by the Economist exercise of government authority. Ranked from 1 to 10 on a scale from 0 to 10, with 0 indicating high levels of increase the differentiation between countries, this year’s Intelligence Unit). Arrivals data correspond to international (very low to very high) by the Economist Intelligence Unit’s perceived corruption and 10 indicating low levels of perceived questionnaire had more answers assigning negative points. visitors to the economic territory of the country. International Country Analysis team. corruption. That is why countries at the top of the index have negative inbound tourists (overnight visitors) are the number of scores this year. Although the point system has produced a tourists who travel to a country other than that in which Political participation Women in parliament broader distribution of scores than in 2010, each country’s they usually reside, and outside their usual environment, for Main source Economist Intelligence Unit, Main source Inter-parliamentary Union evolution over the years can still be plotted by comparing its a period not exceeding 12 months and whose main purpose Democracy Index 2011 position in the index rather than its score.” in visiting is other than an activity remunerated from within Year 2011 the country visited. When data on number of tourists are not available, the number of visitors, which includes tourists, 122 123
  • 63.
    Annex B Annex B same-day visitors, cruise passengers, and crew members, is Extent of Primary school Adult literacy rate shown instead. regional integration enrolment ratio Main source UNESCO, Institute for Main source Economist Intelligence Unit Main source World Bank, World Statistics Net migration as a % Development Indicators (WDI) of total population Year 2011 Year 2005-09, depending upon Year 2001-10, depending upon data data availability Main source World Bank, World Development Definition availability Indicators (WDI) Qualitative assessment of the level of membership of Definition trade alliances, as NAFTA, ASEAN, etc. Ranked from 1 Definition Year 2010 Refers to the % of population over the age of 15. Data to 5 (very high integration to very low) by the Economist The net enrolment ratio is the ratio of the number of are based on national literacy estimates from censuses or Definition Intelligence Unit’s Country Analysis team.Country analysts children of official school age (as defined by the national surveys. Measure of merchandise goods exports free on board and assess this indicator on an annual basis. education system) who are enrolled in school to the population of the corresponding official school age. Additional notes merchandise goods imports free on board. Additional notes The UNDP’s Human Development Report is used as an Additional notes Scoring criteria: Secondary school alternate source when no data available from UNESCO. 2010 data used for Mongolia and North Korea. 1 = Very high: the country belongs to an economic union. enrolment ratio There is freedom of movement for goods, people and capital Main source World Bank - World CULTURE (eg the European Union). DEMOGRAPHICS Development Indicators (WDI) 2 = High: the country is a part of a free trade area (eg Year 2001-10, depending upon data NAFTA), and there are few sectoral restrictions. Or the availability Hostility to foreigners/ country enjoys a very high level of preferential access to a 15-34 year-old males as a private property major regional trade area. % of adult population Definition Main source Economist Intelligence Unit 3 = Moderate: the country is formally part of a free trade The net enrolment ratio is the ratio of the number of Main source U.S. Census Bureau, International area, but there are a large number of sectoral and other children of official school age (as defined by the national Year 2011 Database (IDB restrictions (eg Mercosur or ASEAN). Or the country education system) who are enrolled in school to the Year 2011 enjoys considerable preferential access to a major regional Definition population of the corresponding official school age. trade area. Qualitative assessment of the extent to which Definition demonstrations/civil unrest or parties in armed conflict 4 = Low: formally may be a member of a trade regional Higher education Male population 15-34 year olds as a proportion of the have specifically shown hostility to foreigners or private grouping, but in practice, intra-bloc trade remains enrolment adult population. ownership. Ranked from 1 to 5 (virtually no hostility to significantly restricted and any preferential access to major Main source World Bank, World very high) by the Economist Intelligence Unit’s Country regional trade areas is limited. Development Indicators (WDI) Analysis team. 5 = Very low: not member of any regional trade grouping. Year 2002-10, depending upon data   Country analysts assess this question on a quarterly Gender ratio of population: availability basis. The score provided is the average of the scores given women/men EDUCATION for each quarter. Main source UN Statistics Division Definition The gross enrolment ratio is the ratio of total enrolment, Additional notes Year 2011 regardless of age, to the population of the age group that Scoring criteria: Current education Definition officially corresponds to the level of education shown. 1 = Virtually no hostility to foreigners and/or private spending as a % of GDP Male population divided by the female population. ownership. Main source UNESCO, Institute for Mean years 2 = Low hostility to foreigners and/or private ownership. Statistics of schooling 3 = Moderate hostility to foreigners and/or private Additional notes Year 2001-11, depending upon data Main source UNESCO, Institute for ownership. 2010 data used for Taiwan. availability Statistics 4 = High hostility to foreigners and/or private ownership. Year 2001-11, depending upon data 5 = Very high hostility to foreigners and/or private REGIONAL & INTERNATIONAL Definition ownership. FRAMEWORK/CONDITIONS availability Total public spending on education as % of GDP. Definition School life expectancy (years), primary to tertiary. 124 125
  • 64.
    Annex B Annex B References Willingness to fight Nominal GDP Unemployment (%) (2011). Human Security Report 2009/2010, The Main source Economist Intelligence Unit (US$ bn) Main source Economist Intelligence Unit Causes of Peace and the Shrinking Costs of War A. Main source Economist Intelligence Unit Mack. New York Simon Frazer University, Canada. Year 2011 Year 2011 Year 2011 (2011). World Development Report 2011 Conflict, Definition Security, and Development Washington D.C World Definition Definition Recorded official unemployment as a percentage of total Bank Qualitative assessment of the willingness of citizens to fight Nominal gross domestic product US$ market prices. labour force. The ILO defines the unemployed as members in wars. Ranked from 1 to 5 (very low to very high) by the of the economically active population who are without work (April 2011). Violence in the City, Washington D.C., Additional notes Economist Intelligence Unit’s Country Analysis team. but available for and seeking work, including people who The World Bank    Country analysts assess this indicator on an annual 2010 data used for Montenegro. 2009 data used for have lost their jobs and those who have voluntary left work. basis. Afghanistan, North Korea and Somalia. Collier, P. (2007). The Bottom Billion, New York Additional notes Oxford University Press. Additional notes GDP per capita When no data was available, the ILO was used as an 1 = Very low: no compulsory military service or conscription. alternate source (2000-11, year depending upon data Cortright, D. (2008). Peace, A History of Movements Main source Economist Intelligence Unit A small standing army. Mass demonstrations against any availability). and Ideas, New York Cambridge University Press. Year 2011 government attempt to engage in warfare abroad. Gangopadhyay, P. (2009). Peace Science: Theory and 2 = Low: no compulsory military service. Conscription Definition Life expectancy Cases. United Kingdom Emerald Group Publishing exists, but generally unpopular. Some protests and Main source World Bank, World Nominal gross domestic product (US$) per capita. demonstrations against any attempt to wage war abroad. Development Indicators (WDI) Gangopadhyay, P. (2011). Economics of Rivalry, 3 = Moderate: compulsory military service for up to one Additional notes Year 2009 Conflict and Cooperation Singapore, World Scientific year. Conscription exists but only moderately supported. 2010 data used for Montenegro. 2009 data used for Relatively few supporting civilian forces. Afghanistan, North Korea and Somalia. Karstedt, S. and M. Eisner (2009). “Is a General Definition 4 = High: compulsory military service for 1- 2 years and Theory of Violence Possible?” International Journal of Life expectancy at birth is the number of years a newborn conscription generally accepted but not popular. Most Gini coefficient infant would live if prevailing patterns of mortality at the Conflict and Violence 3(1): pp4-8. military in standing forces. Main source UNDP, Human Development time of its birth were to stay the same throughout its life. Loader, I. and N. Walker (2007). Civilizing Security 5 = Very high: compulsory military service for more Report 2011 New York Cambridge University Press. than two years and conscription historically entrenched. Year 2000-10, depending upon data Infant mortality rate Large territorial army. Unwillingness to stage anti-war availability Main source World Bank, World Hegre and Sambanis, “Sensitivity Analysis of demonstrations against government. Development Indicators (WDI) Empirical Results on Civil War Onset,” Journal of Definition Year 2010 Conflict Resolution 50, no. 3 (August 2006): 508-535 MATERIAL The Gini index measures the extent to which the distribution of income among individuals or households The Cingranelli-Richards (CIRI) Human Rights WELL-BEING Definition within an economy deviates from a perfectly equal Dataset, David L. Cingranelli and David L. Richard, Infant mortality rate is the number of infants dying before distribution. 2010, Dataset Version: 2011.12.09 URL: http://www. reaching one year of age, per 1,000 live births in a given year. humanrightsdata.org Nominal GDP Additional notes (US$PPP bn) When data was missing, the World Bank was used as an Main source Economist Intelligence Unit alternate source, as well as estimates from the Economist Intelligence Unit’s country analysts. Year 2011 Definition Nominal gross domestic product at 2005 US$ purchasing power parities. 2010 data used for Montenegro. Analysis team. Additional notes Nominal gross domestic product at 2005 US$ purchasing power parities. 2010 data used for Montenegro. 2009 data used for Afghanistan, North Korea and Somalia. 126 127
  • 65.
    endnotes 1 Thedefinition of violence is adapted from the World 11 World Economic Forum’s Global Competitiveness Health Organization: ‘the intentional use of physical Report is available here: http://www3.weforum.org/docs/ force or power, threatened or actual, against oneself, WEF_GCR_Report_2011-12.pdf methodology section on another person, or against a group or community, that pp 48 for further detail. either results in or has a high likelihood of resulting 12 Heritage Foundation Index of Economic Freedom, in injury, death, psychological harm, destruction of business freedom sub indicator methodology can be found property, maldevelopment, or deprivation’. here: http://www.heritage.org/index/business-freedom 2 Refer to Annex A for a full list of GPI indicators. 13 World Economic Forum, Global Gender Gap Report 3 Galtung, J. (1985). Twenty-Five Years of Peace 2011. URL: http://www3.weforum.org/docs/WEF_ Research: Ten Challenges and Some Responses. Journal GenderGap_Report_2011.pdf of Peace Research, 22 (2), 141-158. 14 Indices of Social Development, URL: http://www. 4 Ibid. IndSocDev.org/ 5 Human Security Report 2009-2010, The Causes of 15 Indices of Social Development, URL: http://www. Peace and the Shrinking Costs of War, Human Security IndSocDev.org/ Report Project, Oxford University Press pp36 Freedom House, Freedom of the Press Index: http:// 16 6 Ibid. pp35 www.freedomhouse.org/sites/default/files/2012%20 Methodology.pdf 7 Hegre and Sambanis, “Sensitivity Analysis of Empirical Results on Civil War Onset,” Journal of 17 Ibid. Conflict Resolution 50, no. 3 (August 2006): 508-535 18 Reporters Without Borders, World Press 8 Significance (or significance threshold) is the Freedom 2012 Index. URL: http://en.rsf.org/IMG/ qualitative level at which IEP considers that a CLASSEMENT_2012/C_GENERAL_ANG.pdf relationship between two variables is meaningful. Methodology available here: http://www.rsf.org/IMG/ Statistical significance (significance level) indicates pdf/note_methodo_en.pdf something that passes the appropriate statistical test 19 For the full list of sources informing the World (for correlation, the t-test which distinguishes the Communication/ICT Indicators database refer to the correlation from zero). All correlations presented, United Nations URL: http://mdgs.un.org/unsd/mdg/ other than societal attitudes, have a determined level SeriesDetail.aspx?srid=605 of significance > 0.5 or < - 0.5. The threshold for a meaningful correlation from global surveys was 20 Control of Corruption, World Bank, World Governance considered more appropriate at > 0.4 or < -0.4. Indicators URL: http://info.worldbank.org/governance/ wgi/pdf/cc.pdf 9 Some data points for the Inequality Adjusted Human Development Index are missing, so the standard HDI 21 Transparency International Corruptions Perceptions measure has been supplemented for countries missing Index URL: http://www.transparency.org/content/ the IHDI. Those countries are: Afghanistan, Malaysia, download/64426/1030807 Japan, Botswana, Papua New Guinea, New Zealand, 22 Note this is only the GPI rank calculated for the 108 Libya, Iran, Bahrain, Qatar, Myanmar, Kuwait, positive peace countries. Actual full GPI ranks are likely Equatorial Guinea, Algeria and Saudi Arabia. to differ. 10 A dichotomous 1-0 scoring system (1 for a yes and 23 The PPI scores have been brought on average closer to 0 for a no answer), a three point system allows for 0.5 the GPI score by subtracting the difference between the scores. global GPI average and the global PPI average. 128 129
  • 66.
    PO Box 42,St. Leonards, Sydney NSW 1590, Australia email: info@economicsandpeace.org web: www.economicsandpeace.org ©Institute for Economics and Peace 2012 130