Downloaded 13 times


![392015 Willis Benefits Benchmarking Survey
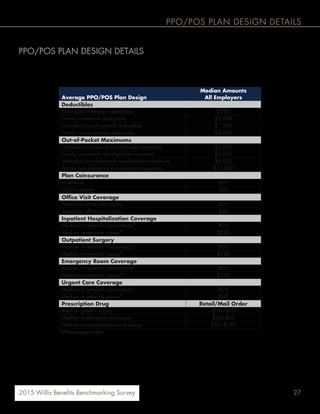
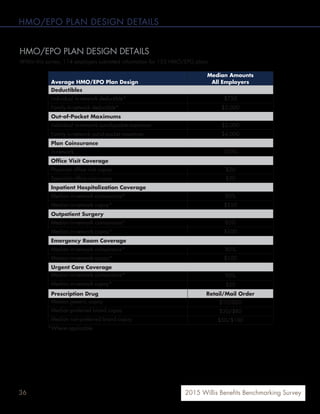
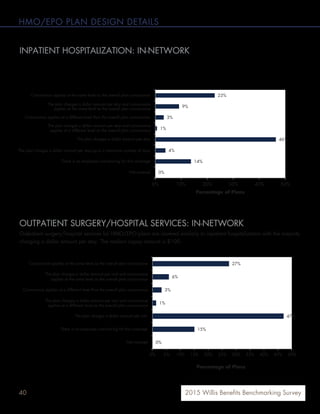
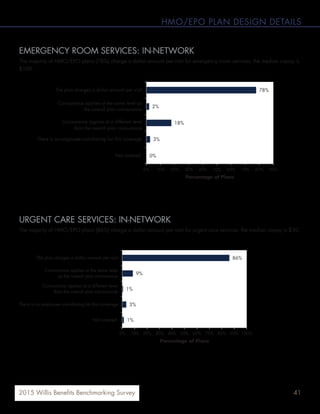
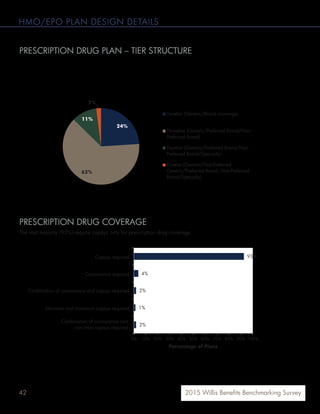
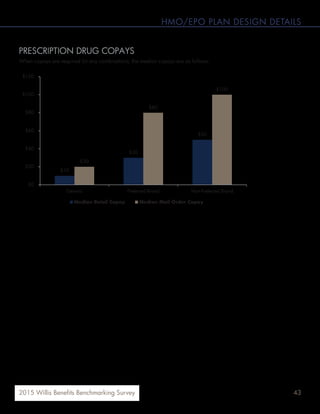
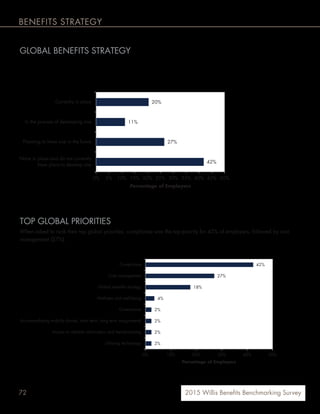
HMO/EPO PLAN DESIGN DETAILS
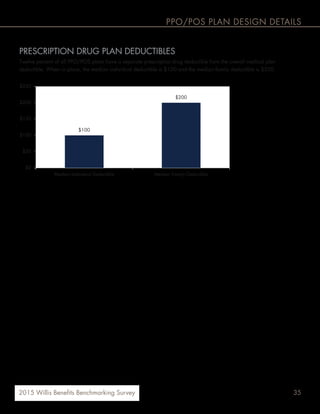
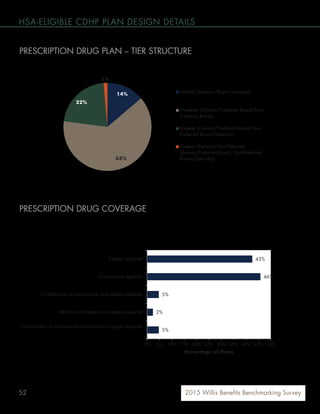
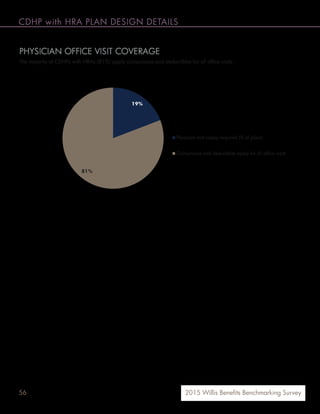
PHYSICIAN OFFICE VISIT COVERAGE
OFFICE VISIT COPAY
Across all employers, the median physician office visit copay is $20, and the median specialist visit is $30. The West
region has the lowest copays for both physician and specialist office visits.
95%
3%2%
Physician visit copay required (% of plans)
Coinsurance and deductibles apply for all
office visits
Office visits are covered by the plan (there
is no employee cost-sharing for this
coverage)
$20
$25
$20 $20
$40
$35
$25
$20
$0
$5
$10
$15
$20
$25
$30
$35
$40
$45
$50
Northeast Region South Region Midwest Region West Region
Median Office Visit Copay Median Specialist Visit Copay
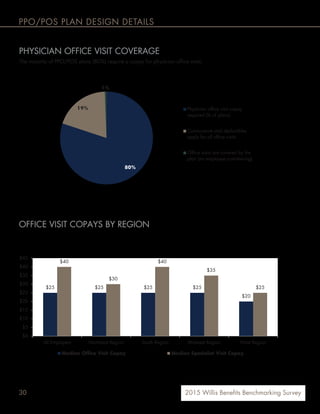
PHYSICIAN OFFICE VISIT COVERAGE
OFFICE VISIT COPAYS BY REGION
Across all employers, the median physician office visit copay is $20, and the median specialist visit is $30. The West
region has the lowest copays for both physician and specialist office visits.
[VALUE]
3%2%
Physician Visit Copay Required (% of plans)
Coinsurance and deductibles apply for all
office visits
Office visits are covered by the plan (there is
no employee cost-sharing for this coverage)
$20 $20
$25
$20 20
$30
$40
$35
$25
$20
$0
$5
$10
$15
$20
$25
$30
$35
$40
$45
$50
All Employers Northeast Region South Region Midwest Region West Region
Median Office Visit Copay Median Specialist Visit Copay
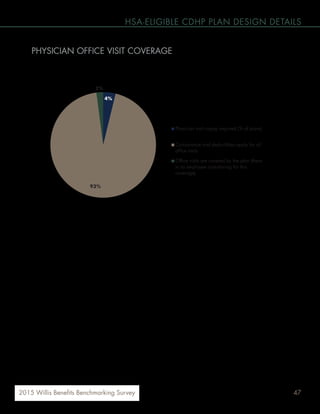
The majority of HMO/EPO plans (95%) require a copay for physician office visits.](https://image.slidesharecdn.com/2015willisbenefitsbenchmarkingsurveyreport-160104150854/85/2015-Willis-Benefits-Benchmarking-Survey-Report-39-320.jpg)
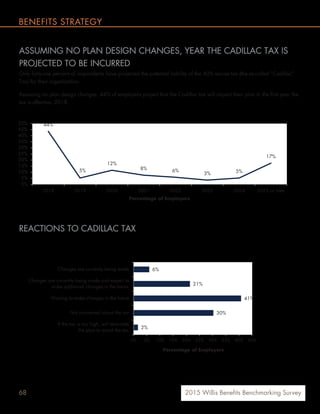


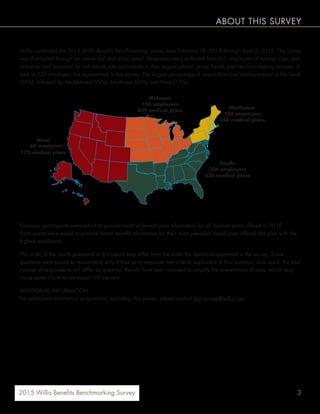
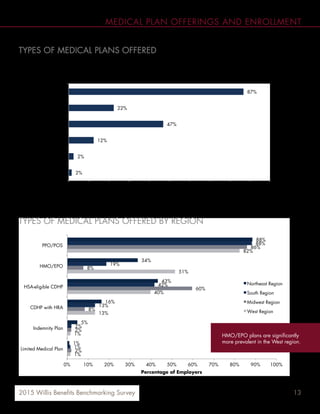
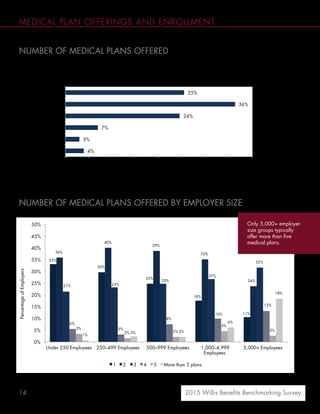
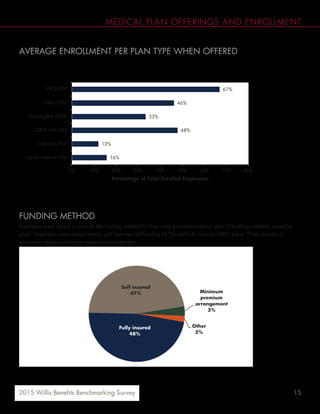
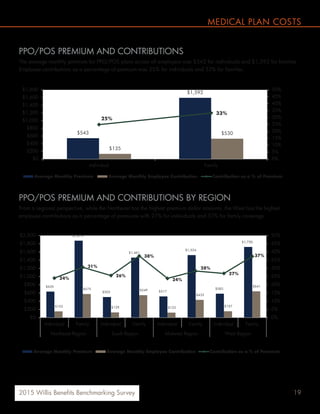
The document is a survey report from Willis that summarizes the results of their 2015 Benefits Benchmarking Survey. Some key findings include: - PPO/POS plans are offered by 87% of employers and are the most prevalent plan type. HSA-eligible CDHPs are the second most offered at 47%. - On average, employers offer 3 or fewer medical plan options. The majority (85%) of employers offer 3 plans or fewer. - Regionally, HMO/EPO plans are significantly more prevalent in the West, offered by 51% of employers in that region compared to 13-42% elsewhere.


![Health Care Reform Developments Week of June 1, 2015[1]](https://cdn.slidesharecdn.com/ss_thumbnails/healthcarereformdevelopmentsweekofjune120151-150603152831-lva1-app6892-thumbnail.jpg?width=640&height=640&fit=bounds)
![Health Care Reform Developments Week of May 25, 2015[1]](https://cdn.slidesharecdn.com/ss_thumbnails/healthcarereformdevelopmentsweekofmay2520151-150528180013-lva1-app6892-thumbnail.jpg?width=640&height=640&fit=bounds)


![Health Care Reform Developments Week of March 30, 2015[1]](https://cdn.slidesharecdn.com/ss_thumbnails/healthcarereformdevelopmentsweekofmarch3020151-150401090821-conversion-gate01-thumbnail.jpg?width=640&height=640&fit=bounds)
![Health Care Reform Developments Week of March 23, 2015[1]](https://cdn.slidesharecdn.com/ss_thumbnails/healthcarereformdevelopmentsweekofmarch2320151-150325123711-conversion-gate01-thumbnail.jpg?width=640&height=640&fit=bounds)
![Health Care Reform Developments Week of March 9, 2015[1]](https://cdn.slidesharecdn.com/ss_thumbnails/healthcarereformdevelopmentsweekofmarch920151-150310145718-conversion-gate01-thumbnail.jpg?width=640&height=640&fit=bounds)

![Health Care Reform Developments Week of March 2, 2015[1]](https://cdn.slidesharecdn.com/ss_thumbnails/healthcarereformdevelopmentsweekofmarch220151-150305100115-conversion-gate01-thumbnail.jpg?width=640&height=640&fit=bounds)
![Health Care Reform Developments Week of February 16, 2015[1]](https://cdn.slidesharecdn.com/ss_thumbnails/healthcarereformdevelopmentsweekoffebruary1620151-150217145942-conversion-gate02-thumbnail.jpg?width=640&height=640&fit=bounds)
![Health Care Reform Developments Week of February 9, 2015[1]](https://cdn.slidesharecdn.com/ss_thumbnails/healthcarereformdevelopmentsweekoffebruary920151-150212122119-conversion-gate02-thumbnail.jpg?width=640&height=640&fit=bounds)


