4. 3
8.9%
9.7%
9.5%
7.6% 7.5%
7.3%
5.7%
6.5%
7.8%
7.8%
9.5% 9.4%
9.7%
8.3%
7.8% 8.4%
6.7% 7.6%
7.5%
8.0%
9.8%
9.7%
10.2%
8.7% 8.0%
6.7%
6.1%
6.3% 6.2%
6.8%
7.0%
7.7%
4.0%
3.6% 4.5%
3.0%
3.1%
1.9%
3.9%
3.5%
7.9%
7.4%
7.9%
6.4%
5.0%
5.5%
5.5%
10.7%
8.6%
11.3%
2.9%
3.8%
-0.3%
1.6%
3.2%
2.1%
1.5% 1.6%
0.1%
-1%
0%
1%
2%
3%
4%
5%
6%
7%
8%
9%
10%
11%
12%
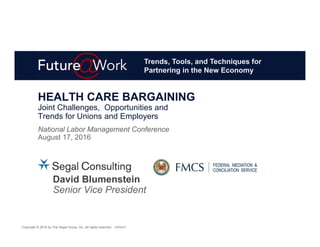
2007 2008 2009 2010 2011 2012 2013 2014 2015 2016
PPO (without Rx) POS (without Rx) HMO (without Rx) MA HMO Rx CPI-U2 3
Ten-Year Summary of Selected Health Benefit Plan Cost Trends
(2007 – 2014 Actual and 2015 – 2016 Projected1) Compared to CPI-U
Source: 2016 Segal Health Plan Cost Trend Survey
1 All trends are illustrated for actives and retirees under age 65, except for MA HMOs.
2 Prescription drug trend data for 2007 only reflects retail. For 2008 – 2016, prescription drug retail and mail order delivery channels are combined.
3 Consumer Price Index for All Urban Consumers, on a seasonally adjusted basis. Source: Bureau of Labor Statistics. Percentages for 2007 – 2014
represent yearly changes based on yearly averages. Percentage for 2015 represents monthly change from June 2015 to July 2015.
5. 4
Projected Medical and Prescription Drug Trends for
Actives and Retirees Under Age 65: 2015 and 2016
Source: 2016 Segal Health Plan Cost Trend Survey
1 HDHPs with an employee-directed, tax-advantaged health account—a health savings account (HSA) or a health reimbursement account (HRA)—
are referred to as account-based health plans and are designed to encourage consumer engagement, resulting in more efficient use of health
care services.
2 Open-access PPO/POS plans are those that do not require a primary care physician (PCP) gatekeeper referral for specialty services.
3 Prescription drug carve-out data was captured for retail and mail-order delivery channels combined.
10.4%
7.9% 7.8% 7.5%
6.2%
8.6%
9.9%
8.0% 7.8% 8.0%
6.8%
11.3%
FFS/Indemnity
Plans
HDHPs Open-Access
PPOs/POS Plans
PPO/POS Plan
(with PCP
Gatekeepers)
HMOs Prescription Drug
(Rx) Carve-Out
2015 2016
1
32
6. 5
6.1%
7.5%9.8%
7.1%
National
projected trend
rates for PPOs
and POS plans
are 7.9%.
The survey found regional variation among projected trend rates for PPO
and POS plans combined: [note that regional results are subject to greater
variations due to limited sample size]
The lowest trend rates are expected in the Midwest (6.1%)
The highest trend rates are expected for the West (9.8%),
for the second year in a row.
Regional Variations
12. 11
Excise Tax
Exchanges
Out-of-Pocket Maximums
Mental health parity
Wellness plan new rules
EEOC/ADA
EEOC/GINA
ACA Impact
13. 12
Quality Focused System Incentives
Patient Centered Medical Homes
Accountable Care Organizations
Provider Network Arrangements
Narrow Networks to drive deeper discounts
Tiered Networks—structured to steer members to high quality low cost
Specialized Networks—direct contracting for diagnostic networks
Alternative Provider Payment Models
Reference based pricing
Global budgeting
Shared risk payment models, incentivizing quality outcomes
Additional Tools for Value Based Care Initiatives
Pricing transparency tools
Evidence based guidelines, prior authorization, medical necessity
Onsite care coordinators
Volume to Value
14. 13
Benefit choice
Defined contribution approaches
Private exchanges
Account-based benefits (HRAs, HSAs, HDHPs)
Spousal and dependent eligibility
Premium Surcharges or buy-up options
Exclusion for Spouses (with or without other coverage offerings)
Dependent eligibility audits
Wrap plan
Data-driven plan design
Identify health risks
Inefficient access of care
Tiered member cost sharing
Plan Design
15. 14
Consolidation of large medical insurers
Direct contracting with hospital system
and local provider groups
Telemedicine
Virtual visits
Access for remote populations
On-site clinic kiosk
Follow-up communication done via email/live chat
Connected medical devices
On-site clinics
Improved convenience
Ability to manage costs and quality
Industry identification
Medical
16. 15
Utilization and clinical management programs
Specialty drugs
Step therapy
Compound management
Networks
Pharmacy network exclusions
Specialty pharmacy networks
Formulary management
Drug Exclusions
Excluded at Launch
Plan Design
Replacing dollar copays with coinsurance
4th tier for high-cost medications
Pharmacy
Mandatory generic
Supply limits
Opioid abuse/pain management
17. 16
Cost shifting can be short-term, need to address underlying
behavioral risk factors
In 2012, $493 billion of the $2.6 trillion spent on medical care in the US was
avoidable due to factors related to patient behaviors1
Comprehensive wellness programs, especially tied to
incentives/disincentives, can help influence risky behaviors
Build a culture of wellness and sense of community—“we are all in this together”
Provide the tools for members to make the right lifestyle choices
Wellness coordinator onsite to build/tailor wellness program
Leverage social media to promote and share success stories
Disease management
Care coordination between multiple vendors (medical, Rx, MHSA, etc.)
Encourages treatment compliance
Can be designed with incentive structure to encourage engagement
Case Management for highly complex patients
Individual Health Management
1 PricewaterhouseCoopers:Health Research Institute 2012 study, “The Price of Excess, Identifying Waste in Healthcare Spending”
18. 17
Plan Design/Eligibility
Medicare Advantage plans
Moving from RDS to EGWP for prescription drugs
Grandfather current retirees, provide new hires
with less generous plan design
Cost Effective Base Plan with Buy-up options
Cap Plan/ER costs—defined dollar plan
Tighten Eligibility, e.g., increase minimum
age/service, or spousal restrictions
Exchanges
Private exchanges for Medicare retirees
Public exchanges for pre-Medicare retirees
Funding
Revise Contribution Schedule, e.g., service based contributions
Active EE contribution (pre-funding)
Compliance
New OPEB Reporting Standards GASB 74 and 75
Retirees
20. 19
Closest “Metal” Value
0.3%
4.9%
53.1%
30.2%
11.5%
Bronze Metal Value (60%)
Silver Metal Value (70%)
Gold Metal Value (80%)
Platinum Metal Value (90%)
Not known
PERCENTAGE OF RESPONSES
Source: Segal Consulting, 2015 Study of Multiemployer Plans—Current Affordable Care Act Issues
26. 25
In 2018, 40% excise tax on health plan costs above threshold
$10,200 (self-only)/$27,500 (other than self-only)
Adjusted to $11,850 (self-only)/$30,950 (other than self-only) for
high-risk professions and certain pre-Medicare retirees
Multiemployer plans use “other than self only” threshold
Excise Tax Basics
The Excise Tax has been postponed
until January 1, 2020.
27. 26
Health Flexible Spending Arrangements (FSA)
Employer and employee salary reduction contributions included
Health Savings Accounts (HSA)
Employer and employee salary reduction contributions
included (proposed)
After-tax employee contributions excluded
Health Reimbursement Arrangements (HRA)
HRA applicable premium included
Treasury/IRS considering various
methods to determine the cost of
coverage under an HRA, including
how to deal with large balances that
carry forward
Individual Account Plans Included in Cost
“Wrap Plan” not included in cost.
28. 27
On-site medical clinics are generally subject to the excise tax
Treasury Proposal: On-site medical clinics that offer only de
minimis medical care would be excluded, e.g., first aid for injuries
and illnesses
What is de minimis?
Immunizations
Injections of antigens provided
by employees
Providing pain relievers, aspirin, etc.
Treatment of injuries caused by accidents
at work beyond first aid
Other?
On-Site Medical Clinics Included in Cost
29. 28
Coverage under a separate policy, certificate, or contract of
insurance which provides benefits substantially all of which are for
treatment of the mouth (including any organ or structure within
the mouth) or for treatment of the eye are excluded
Treasury Proposal: Exclude all limited scope dental and vision
benefits that qualify as excepted benefits (including self-insured)
Self-insured dental/vision coverage must
be able to be declined (i.e., opt-out) by the participant
or be administered under a contract separate
from claims administration for any other benefits
under the plan
Dental/Vision Generally Not Included
30. 29
Retiree-only plans are subject to the tax
Some retirees get the higher threshold ($30,950)—those who age
55 or older and not eligible for Medicare
The ACA statute states that costs for pre- and post-65 retirees may
be combined:
Lower costs for Medicare retirees will offset higher costs for pre-Medicare retirees
Issues for Treasury/IRS to address:
Whether/when retiree costs can be combined with actives
How statutory rule on combining pre- and post-65 retirees interacts with “benefit
package” proposal in Notice 2015-16
Once Treasury/IRS set the rules about what combinations of groups
are permitted, each plan will need to determine optimal approach
Retirees and the Excise Tax
31. 30
The plan sponsor (the Board of Trustees) must combine the cost of
the different benefits, calculate the amount of the excess benefit,
and determine the pro rata share of the excess attributable to each
type of benefit
Then, the plan sponsor must report
the taxable excess benefit attributed
to each “coverage provider” to
both the provider and the IRS
Plan Responsibility & Who Pays
32. 31
Parameter More Favorable Less Favorable
Benefit
Packages
Combine
all together
Combine some
together
Calculate for each
benefit package
Coverage
Tiers
Composite
Two Tiers (self-only
& all other tiers)
Multiple Tiers
(more than 2)
Dental/Vision All “Excepted Benefits”
excluded
Only separately insured
dental/vision excluded
Retiree
Coverage
Combine
all
Combine
Actives and
Pre-Medicare
Combine
Medicare and
Pre-Medicare
Separate
all
Calculation Parameters
Green Reflects Notice/Law
33. 32
Percent of Active Employee
Plans With ACA Excise Tax—All Plans
31%
4% 2%
5%
3% 2% 2%
6% 6%
9%
31%
35%
37%
42%
45%
48%
50%
56%
61%
70%
0%
10%
20%
30%
40%
50%
60%
70%
2018 2019 2020 2021 2022 2023 2024 2025 2026 2027
Percent of Plans Projected to Hit Tax for the First Time (subset of total)
Total Percent of Plans Projected to Pay Tax Each Year
SEGAL’S ACA EXCISE TAX FORECASTER
All Methods
34. 33
7%
2% 2%
7% 7% 8%
15%9%
12%
19%
26% 26% 26% 26%
33%
49%
0%
10%
20%
30%
40%
50%
60%
70%
2018 2019 2020 2021 2022 2023 2024 2025 2026 2027
Percent of Plans Projected to Hit Tax for the First Time (subset of total)
Total Percent of Plans Projected to Pay Tax Each Year
Percent of Active Employee
Plans With ACA Excise Tax—Multiemployer
SEGAL’S ACA EXCISE TAX FORECASTER
Tiered
35. 34
Percent of Active Employee
Plans With ACA Excise Tax—Multiemployer
3% 4% 4% 4%3% 3% 3% 3% 3%
7%
11%
15%
0%
10%
20%
30%
40%
50%
60%
70%
2018 2019 2020 2021 2022 2023 2024 2025 2026 2027
Percent of Plans Projected to Hit Tax for the First Time (subset of total)
Total Percent of Plans Projected to Pay Tax Each Year
SEGAL’S ACA EXCISE TAX FORECASTER
Composite
37. 36
How can a multiemployer plan provide benefits that allow an
individual to go into an Exchange and receive subsidized coverage,
and do not result in the employer receiving a penalty?
1.Excepted Benefits
2.Health Savings Accounts (HSA)
3.Wrap Benefits
Three Methods to Access Federal Subsidies
38. 37
Between 100% and 400% of Federal Poverty Level
Income Eligibility for Federally
Subsidized Coverage in 2017
Persons
in Family 100% FPL 133% FPL 250% FPL 400% FPL
1 $11,880 $15,800 $29,700 $47,520
2 $16,020 $21,307 $40,050 $64,080
3 $20,160 $26,813 $50,400 $80,640
4 $24,300 $32,319 $60,750 $97,200
5 $28,440 $37,825 $71,100 $113,760
6 $32,580 $43,331 $81,450 $130,320
7 $36,730 $48,851 $91,825 $146,920
8 $40,890 $54,348 $102,225 $163,560
2016 Federal Poverty Level guidelines for the 48 contiguous states
39. 38
Limited-scope dental benefits, limited-scope vision
benefits, and/or limited-scope long-term care benefits
Dental/vision coverage can be offered
Participant can still get federal subsidy on the exchange, and
not subject to excise tax, if conditions met
For plan years beginning on or after 1/1/15, limited-scope
means the benefit must be either:
Separately insured, or
If self-insured, participants may decline coverage (including through an
opt-out process), or the dental/vision claims are administered under a
contract separate from any other benefits.
Additional requirements apply to long-term care insurance.
Dental and Vision Excepted Benefits
40. 39
Coverage only for accident (including accidental death and
dismemberment)
Disability income coverage
Coverage for on-site medical clinics (but subject to excise tax)
Proposed wrap would be an excepted benefit
Other insurance:
Liability insurance, including general liability insurance and automobile liability
insurance
Credit-only insurance (for example, mortgage insurance)
Automobile medical payment insurance
Workers’ compensation or similar coverage
Coverage issued as a supplement to liability insurance
A final rule amending the 2004 HIPAA regulations was published on October 1,
2014 http://www.gpo.gov/fdsys/pkg/FR-2014-10-01/pdf/2014-23323.pdf
Other Excepted Benefits
41. 40
Requires individual to choose a High Deductible Health Plan (HDHP)
with a minimum deductible in 2017 of $1,300 individual/$2,600 family
HDHP Out-of-Pocket Maximum:
$6,550 individual
$13,100 family
Maximum annual contribution to HSA account for 2017:
Individual: $3,400
Family: $6,750
Amounts indexed annually
Anyone can contribute
Catch-up contributions for 55 and older:
Individuals age 55 or over can contribute an additional $1,000 to their
HSAs
No contributions after Medicare begins
Health Savings Accounts
42. 41
Final rule from Treasury/Labor/HHS published on March 18, 2015
Pilot program with sunset
The coverage must first be offered
between January 1, 2016 and
December 31, 2018, and would
end on the later of:
– Three years after first offered, or
– The end of the applicable CBA
New Limited Wraparound Coverage
44. 43
More than 8 in 10 individuals (nearly 8.1M, or 85%) who enrolled in a
2016 plan through the Marketplaces in the HealthCare.gov states
qualify for a subsidy, with an average value of $290 per person
per month
38 states use the HealthCare.gov platform as of March 11, 2016
The average subsidy covers about 73% of the gross premium
The average net premium after subsidy is $106 per month
Enrollment with Subsidies
https://aspe.hhs.gov/sites/default/files/pdf/187866/Finalenrollment2016.pdf
45. 44
A recent study by The Commonwealth Fund found these average
deductibles in 2016:
Average 2016 Deductibles
http://www.commonwealthfund.org/publications/issue-
briefs/2016/may/cost-sharing-increases
$5,724
$3,100
$1,257 $484
Bronze Silver Gold Platinum
46. 45
Key Similarities/Differences Between
the Types of Wraparound Coverage
Non-Full-Time Employees/
Any Plan
Full-Time Employees/
Multi-State Wrap
Contingent on Employer (or contributing
employer) offering coverage to its full-time
employees (including non-bargained)
Same
Can be offered to spouses, part-time and
seasonal employees, and pre-Medicare
retirees
Same
Must provide meaningful benefits Same
Greater of $2,550 (indexed) or 15% of
primary plan cost
Same
Not available to full-time employees Available to full-time employees
Could wrap around any type of individual
insurance, obtained inside or outside
Marketplace, or a Basic Health Plan
Can only wrap around a Multi-State
Plan, which are not yet available in all
states
Employer penalty not triggered by
employees/retirees obtaining subsidized
Marketplace coverage
Employer penalty could be triggered if a
full-time employee obtains subsidized
Marketplace coverage
Cannot have a Health FSA Same
47. 46
Both types of wraparound coverage must meet two key
requirements:
Coverage Rules
Wrap Plan must provide meaningful benefits beyond
coverage of cost sharing under the individual market plan
Coverage must be limited in amount
1
2
48. 47
Possible examples:
Covering a certain number of primary care visits and/or specialist visits
Covering all primary care at 100%
Providing an out-of-network benefit
Covering prescription drugs that are not on the formulary of the individual
insurance plan
Covering primary care visits at a particular clinic (on-site or retail)
What are Meaningful Benefits?
Key Points
Wrap plan could reimburse cost sharing incurred
under the individual insurance plan, but cannot
merely provide such a benefit
Cannot be an account-based plan, such as
an health reimbursement arrangement (HRA)
49. 48
Final rule sets the maximum amount at either:
The maximum allowed salary reduction for a health Flexible Spending
Arrangement (FSA),
– $2,550 for 2016 (indexed thereafter), or
Fifteen percent (15%) of the cost
of coverage under the “primary
plan”
Amount determined in the same
manner as COBRA premiums
What is a Limited Amount?
50. 49
The wraparound coverage must be reviewed and approved by OPM
The employer must meet certain requirements:
Offer coverage during 2013 or 2014 sufficient to protect the employer from
the 4980H(a) penalty (if the employer penalty had been in effect in 2014)
Offer affordable, minimum value coverage during 2013 or 2014 to a
“substantial portion” of its full-time employees
Meet a maintenance-of-contributions requirement for the duration of the
pilot program:
– Contributions would meet this requirement if they are at least 80% of
contributions made in 2013 or 2014 for full-time workers
Multi-State Plan Wraparound Coverage
53. 52
PERCENTAGE OF PHYSICIANS IN SOLO PRACTICE
Solo Practitioners
SIZE OF PRACTICE IN 2014
62%
25%
17%
0%
20%
40%
60%
80%
2008 2012 2014
28.4%
21.6%
0%
20%
40%
50+ 11–49
Source: 2014 Survey of America’s Physicians: Practice Patterns and Perspective, The Physician’s Foundation, 2014.
54. 53
Independent Practice
PERCENTAGE OF PHYSICIANS
THAT DESCRIBE THEMSELVES AS
INDEPENDENT PRACTICE OWNERS
PERCENTAGE OF PHYSICIANS
GRADE OF THE ACA
62%
49%
35%
0%
20%
40%
60%
80%
2008 2012 2014
Source: 2014 Survey of America’s Physicians: Practice Patterns and Perspective, The Physician’s Foundation, 2014.
4%
22%29%
A or B C D or F
55. 54
Move from not-for-profit to profit
Move from hospitals to health systems—both vertical and horizontal
Hospitals and Health Systems
2007 – 2012: Mergers and Acquisitions
Deals: 432 and Hospitals: 832
Claim Example
Benefits
Quality Improvement due to Size
Quality of Care
Investments
Cost Savings (Coordination is improved)
Surgeon specializing in hand surgery has better
outcomes.
Spreading financial burden allows for investment in
electronic medical records.
For a complex procedure, one case manager can work
with patient through entire process.
Harms
Higher Prices (Market power)
Less Innovation (Less competition)
Payers cannot afford to exclude one system from a
product, and thus hospitals can demand higher prices.
No investment in uniform protocols for postsurgical care
because no alternative for consumer. Slow to adapt to
new surgical technology.
Source: Cutler and Morton, “Hospital, Market Share, and Consolidation,” JAMA 310(18): 1964 – 1970, 2013.
56. 55
2005: Lumenos
2005: WellChoice (NY BCBS)
2009: DeCare Dental
2011: Care More
2012: Amerigroup
Source: U.S. Securities and Exchange Commission, EDGAR
Search. Current as of 9/17/15.
1996: US Healthcare
1998: NYLCare HealthPlans
1999: Prudential Healthcare
1994: Ramsey-HMO
1998: Health Partners of Arizona
2002: Americhoice
2004: Touchpoint Health Plan
2004: Oxford Health Plans
2005: Pacificare
2007: Sierra Health Services
2009: Health Net, Inc.
2012: XL Health Corporation
1997: BlueCross Blue Shield Conn. (BCBS)
1999: BCBS NH
1999: BCBS CO
1999: BCBS NV
2000: BCBS ME
2002: Trigon Healthcare of VA (BCBS plan in VA)
2015: Simply Healthcare Holdings, Inc.
2003: Wellpoint, Inc.
1996: MA Mutual Life Insurance Co.
1997: John Hancock Mutual Life Insurance Co.
2000: Rush Prudential Health Plans
2001: Cerulean Companies (BCBS GA)
2002: Right Choice Managed Care
2003: Cobalt Corp. (BCBS Wisc.)
2004: HealthLink
2015 Announced
Mergers:
Aetna & Humana
Anthem & Cigna
The Travelers Insurance Company
Metropolitan Life Insurance Company
1995: The MetraHealth Companies
Insurance Company Consolidation
Previously, WellPoint Health Network
58. 57
NOTES:
1. Anthem announced agreement to acquire Cigna on 7/24/2015 pending regulatory approval.
2. Aetna announced agreement to acquire Humana on 7/3/2015 pending regulatory approval.
3. UHC announced agreement to acquire Catamaran on 3/30/2015 pending regulatory approval.
** Cigna currently has long-term PBM sourcing agreement with Catamaran.
** Owned by BCBS Al, FL, IL, KS, MN, MT, NE, NM, ND, NC, OK, TX, WY.
Major Health Insurers
Pharmacy Benefit Manager Alignment
Anthem
(Cigna)1*
Aetna
(Humana)2
United
Healthcare
BCBS Plans
FL, IL, TX+**
Express Scripts CVS Health
Optum Rx
(Catamaran)3*
Prime
Therapeutics
National Regional
Long-Term
Agreement
Long-Term
Agreement
Wholly
Owned
Wholly
Owned
Non-Profit
•
•
59. 58
Current PBM Marketplace continued
“Big Three”
Express Scripts
CVS Caremark
OptumRx (UHC)
Mid-Sized PBMs
MedImpact
Humana*
Navitus
Smaller PBMs Very Small PBMs
EnvisionRx
US Script
WellDyne
THE PBM MARKETPLACE
BeneCard
PerformRx
Sav-Rx
Prime Therapeutics
MagellanRx
40+ other niche
PBMs
* Humana currently has in-house PBM—recently announced agreement to be purchased by Aetna.