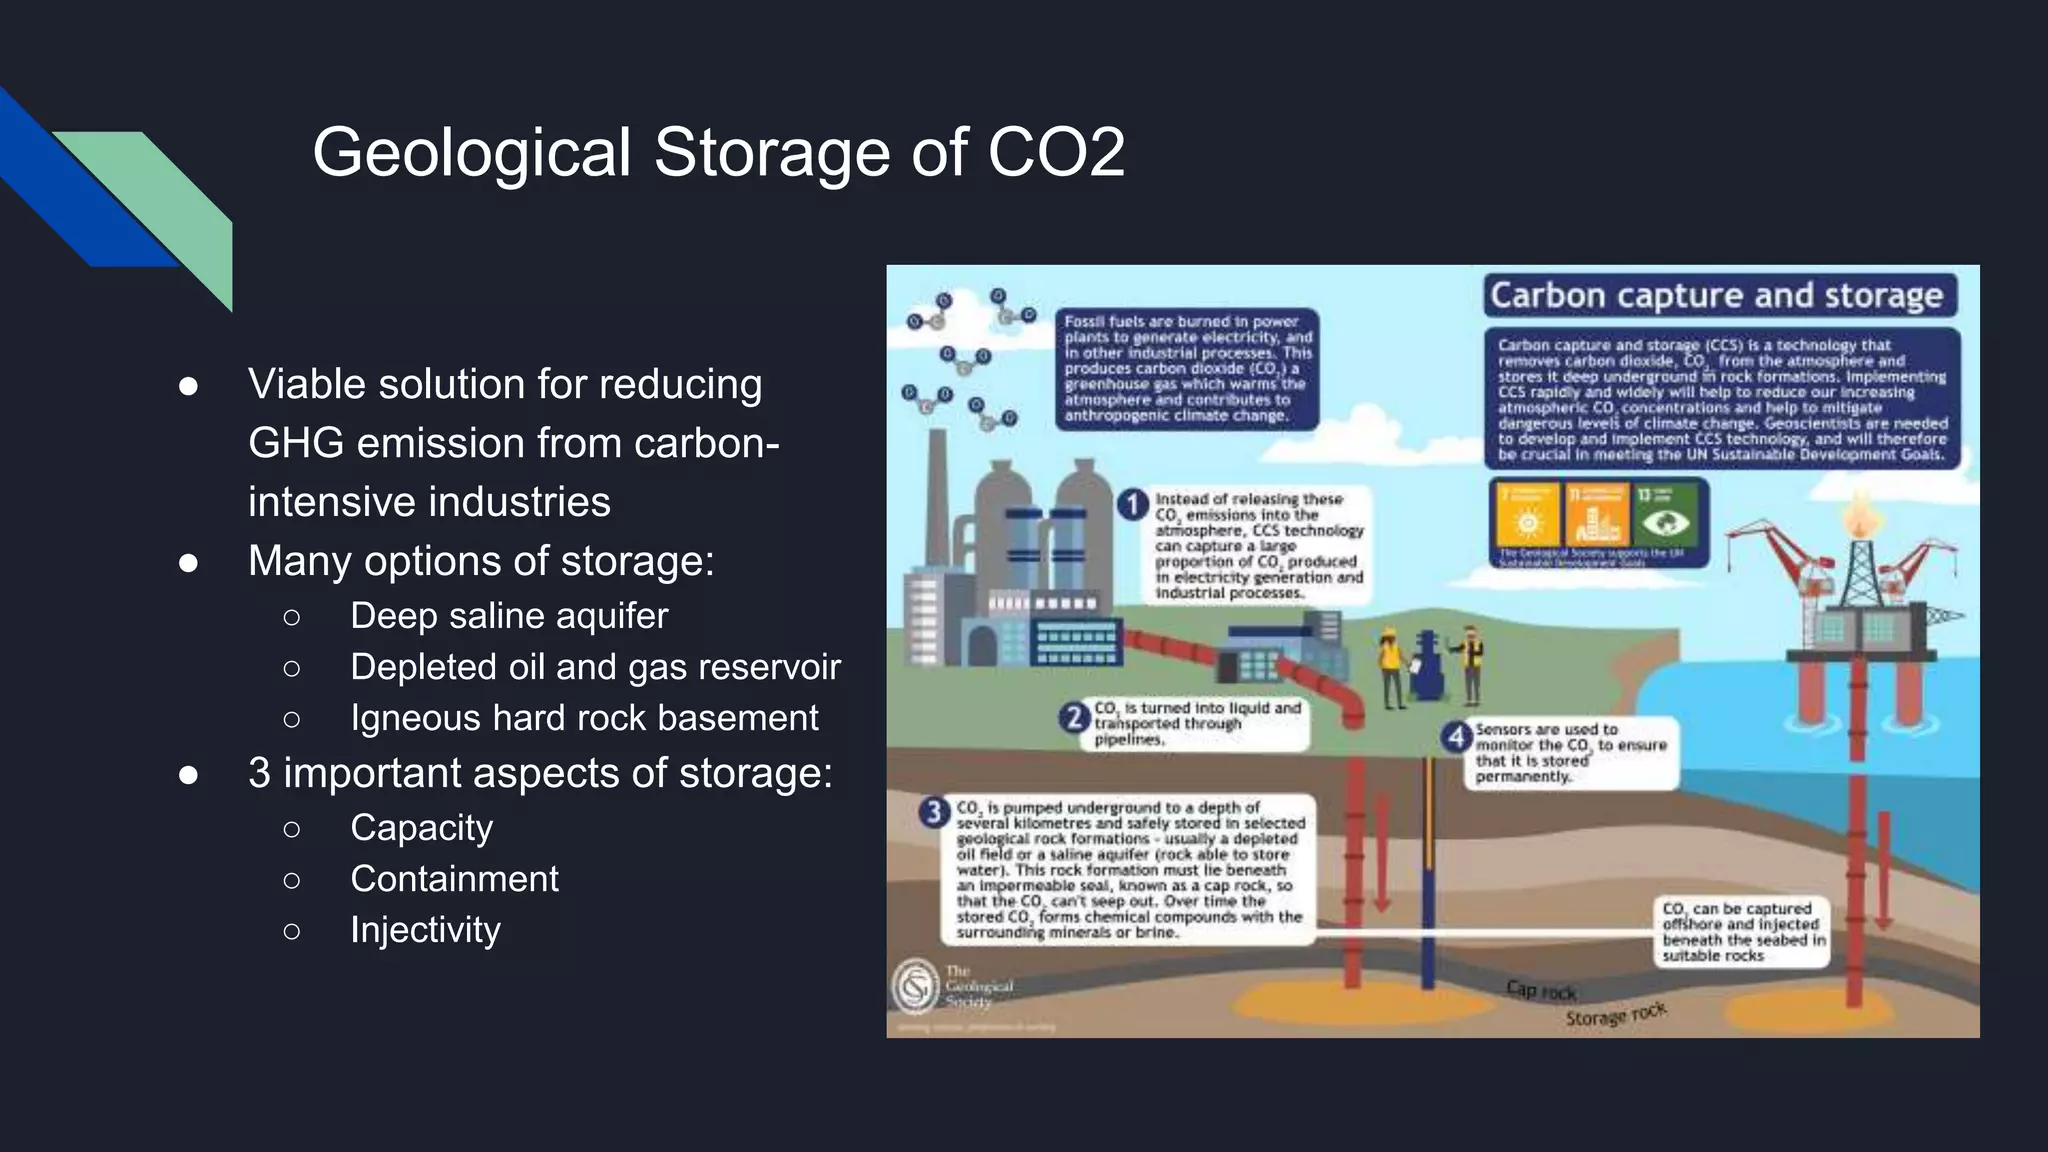
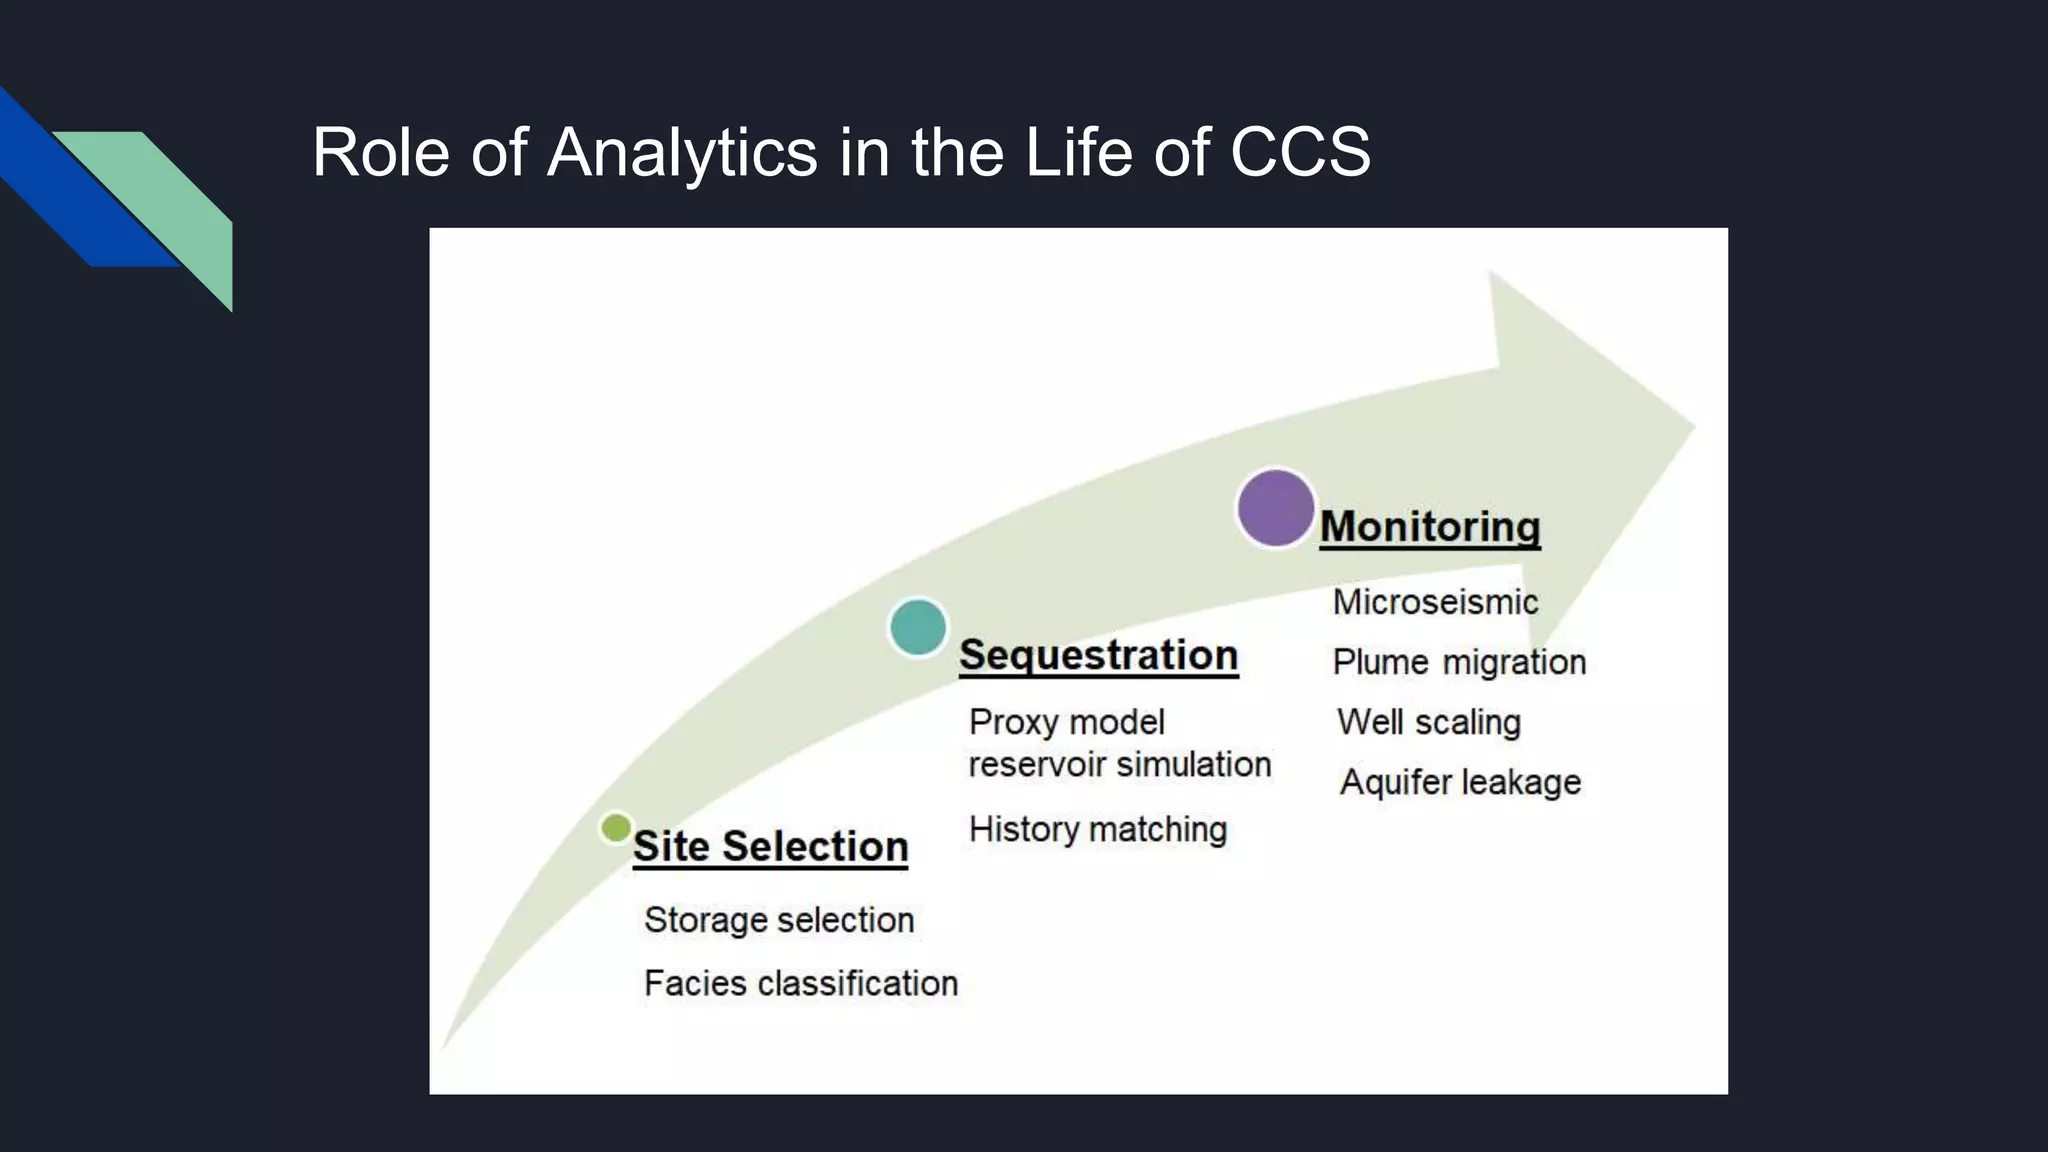
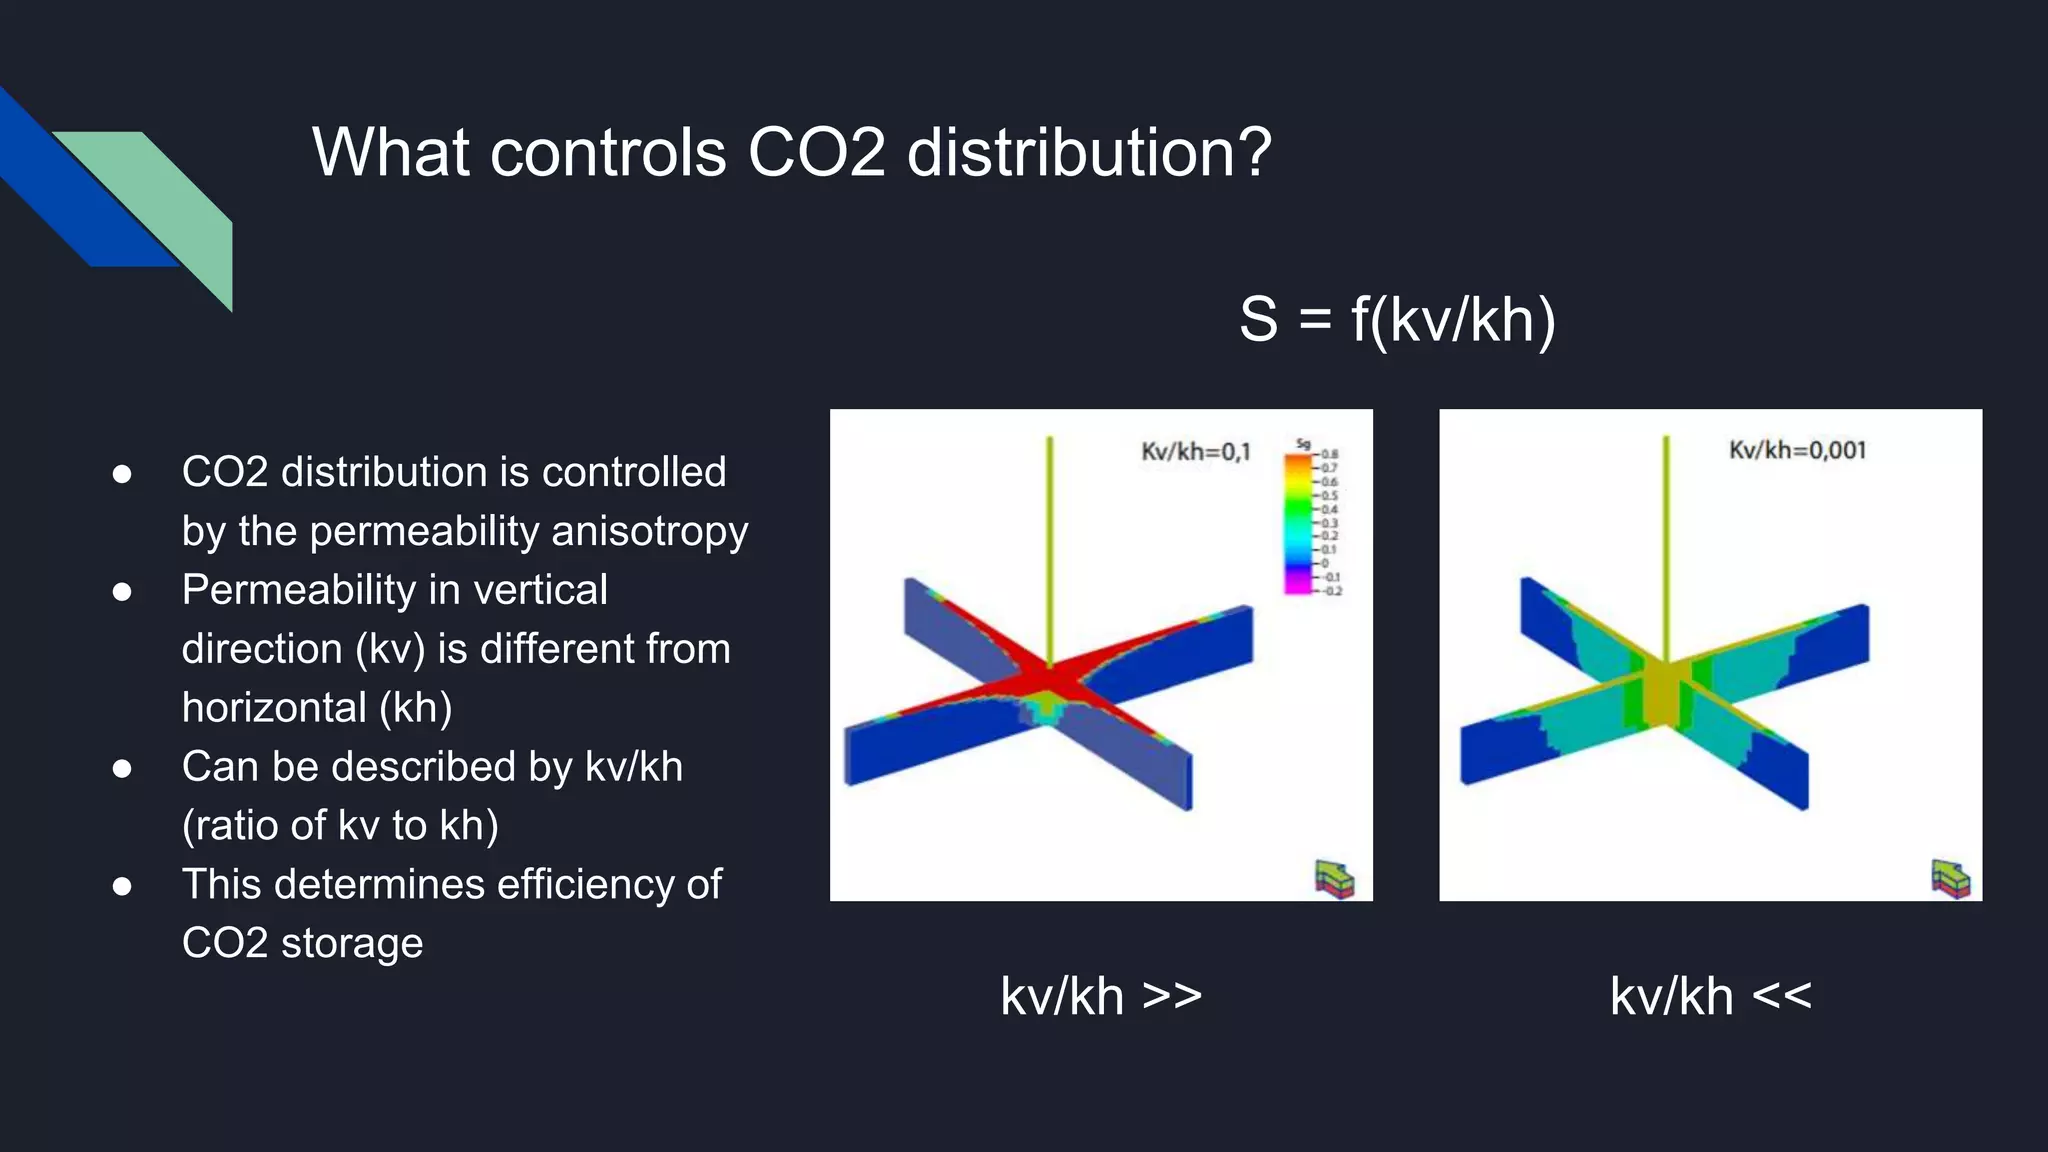
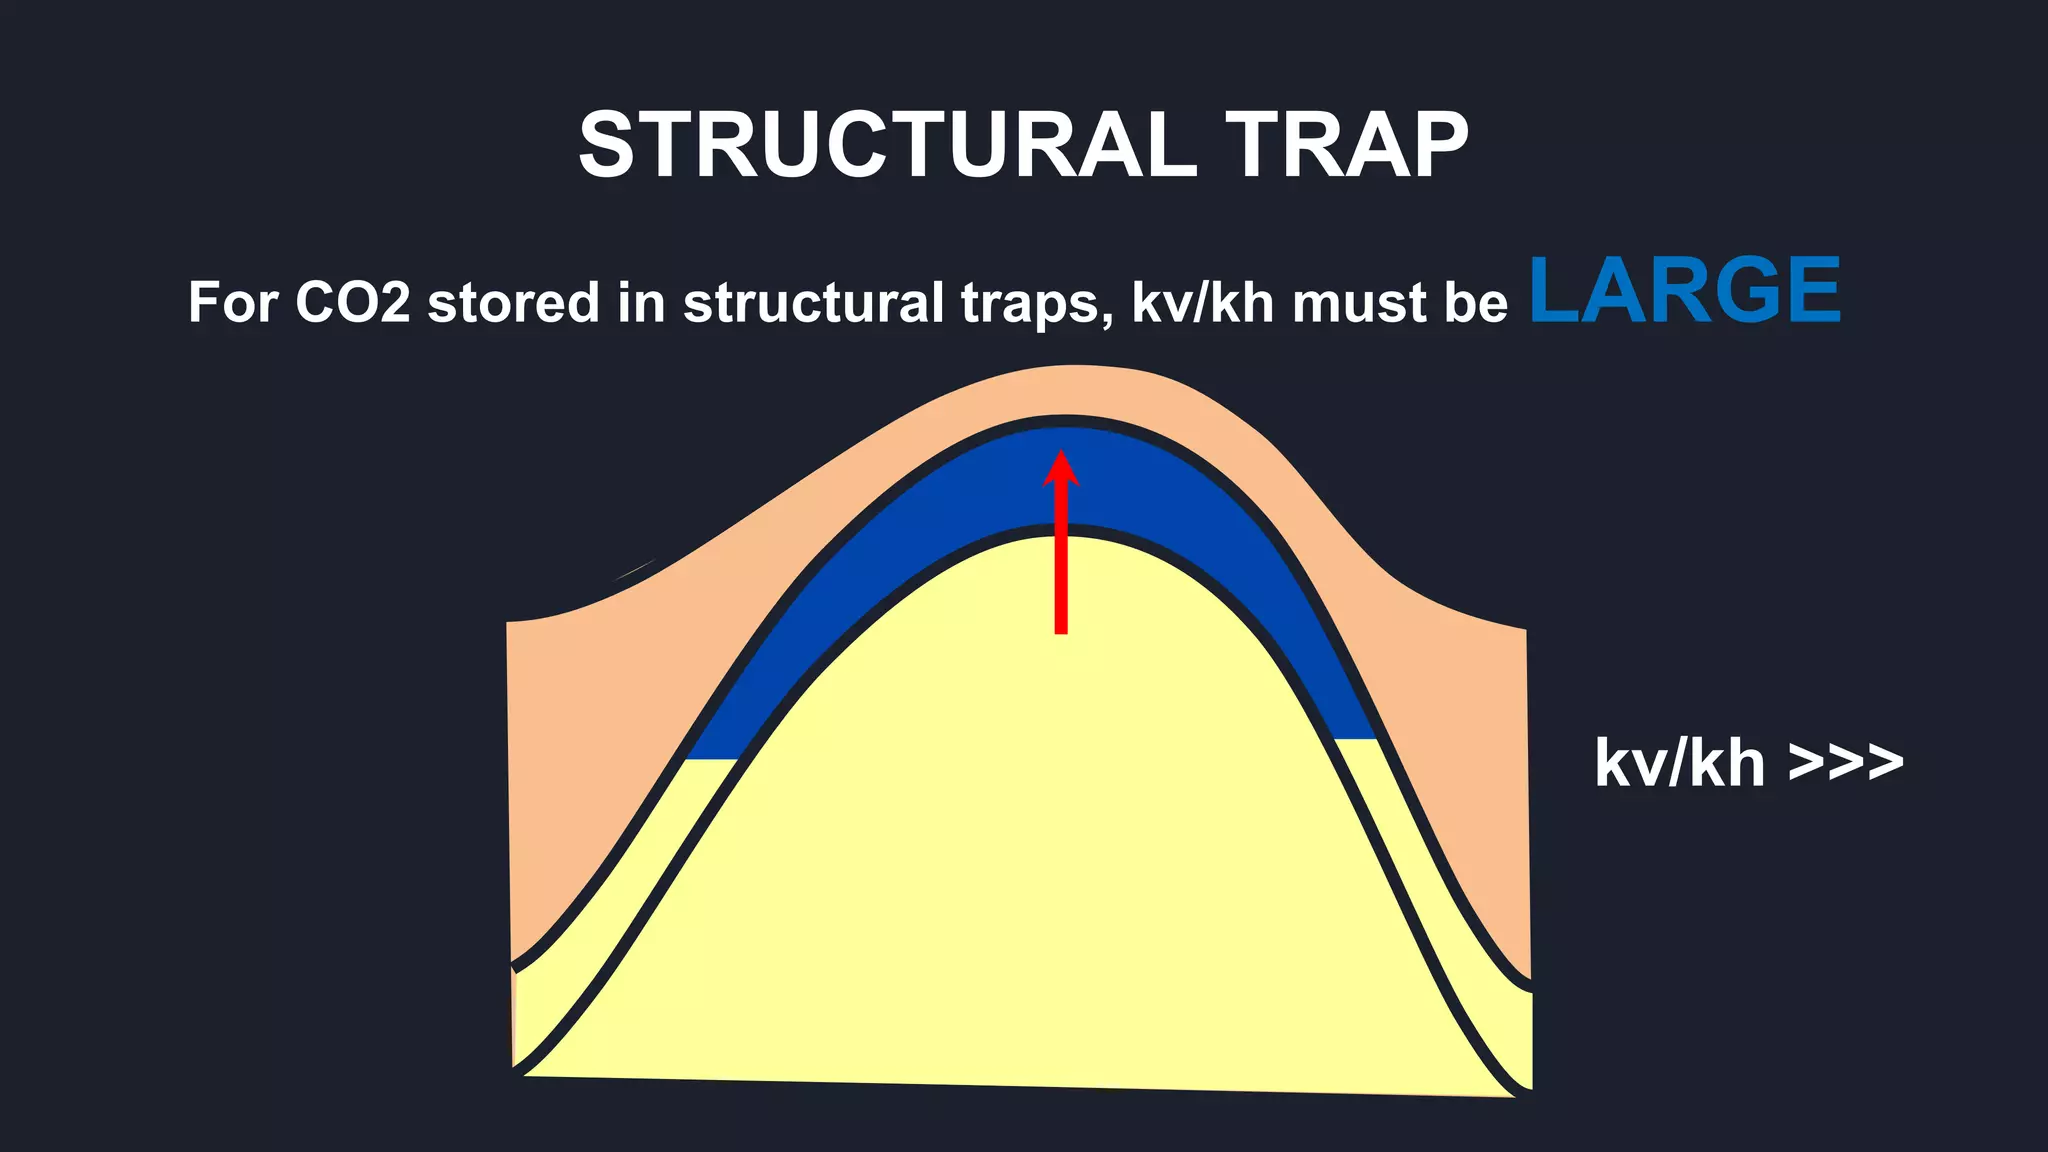
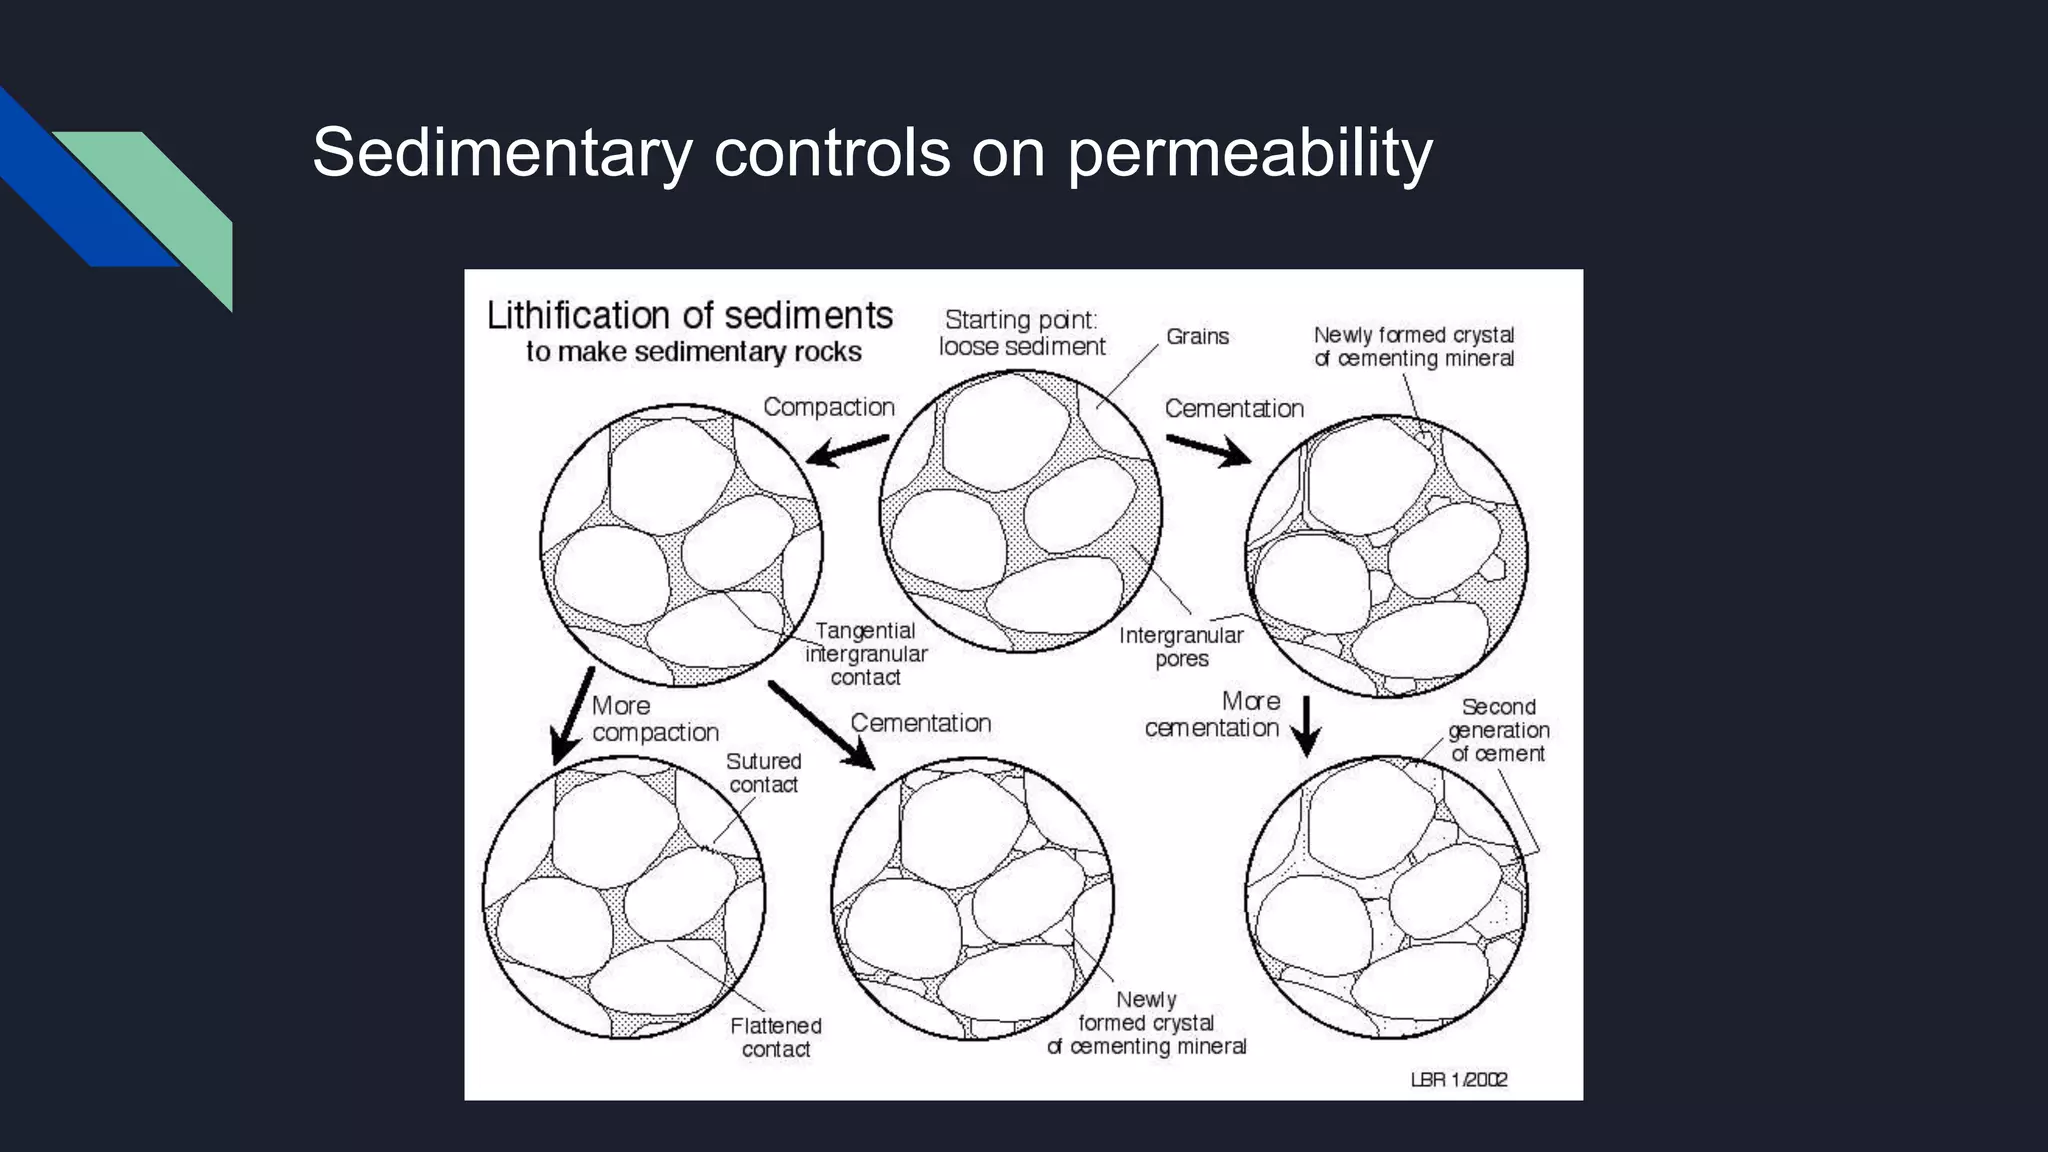
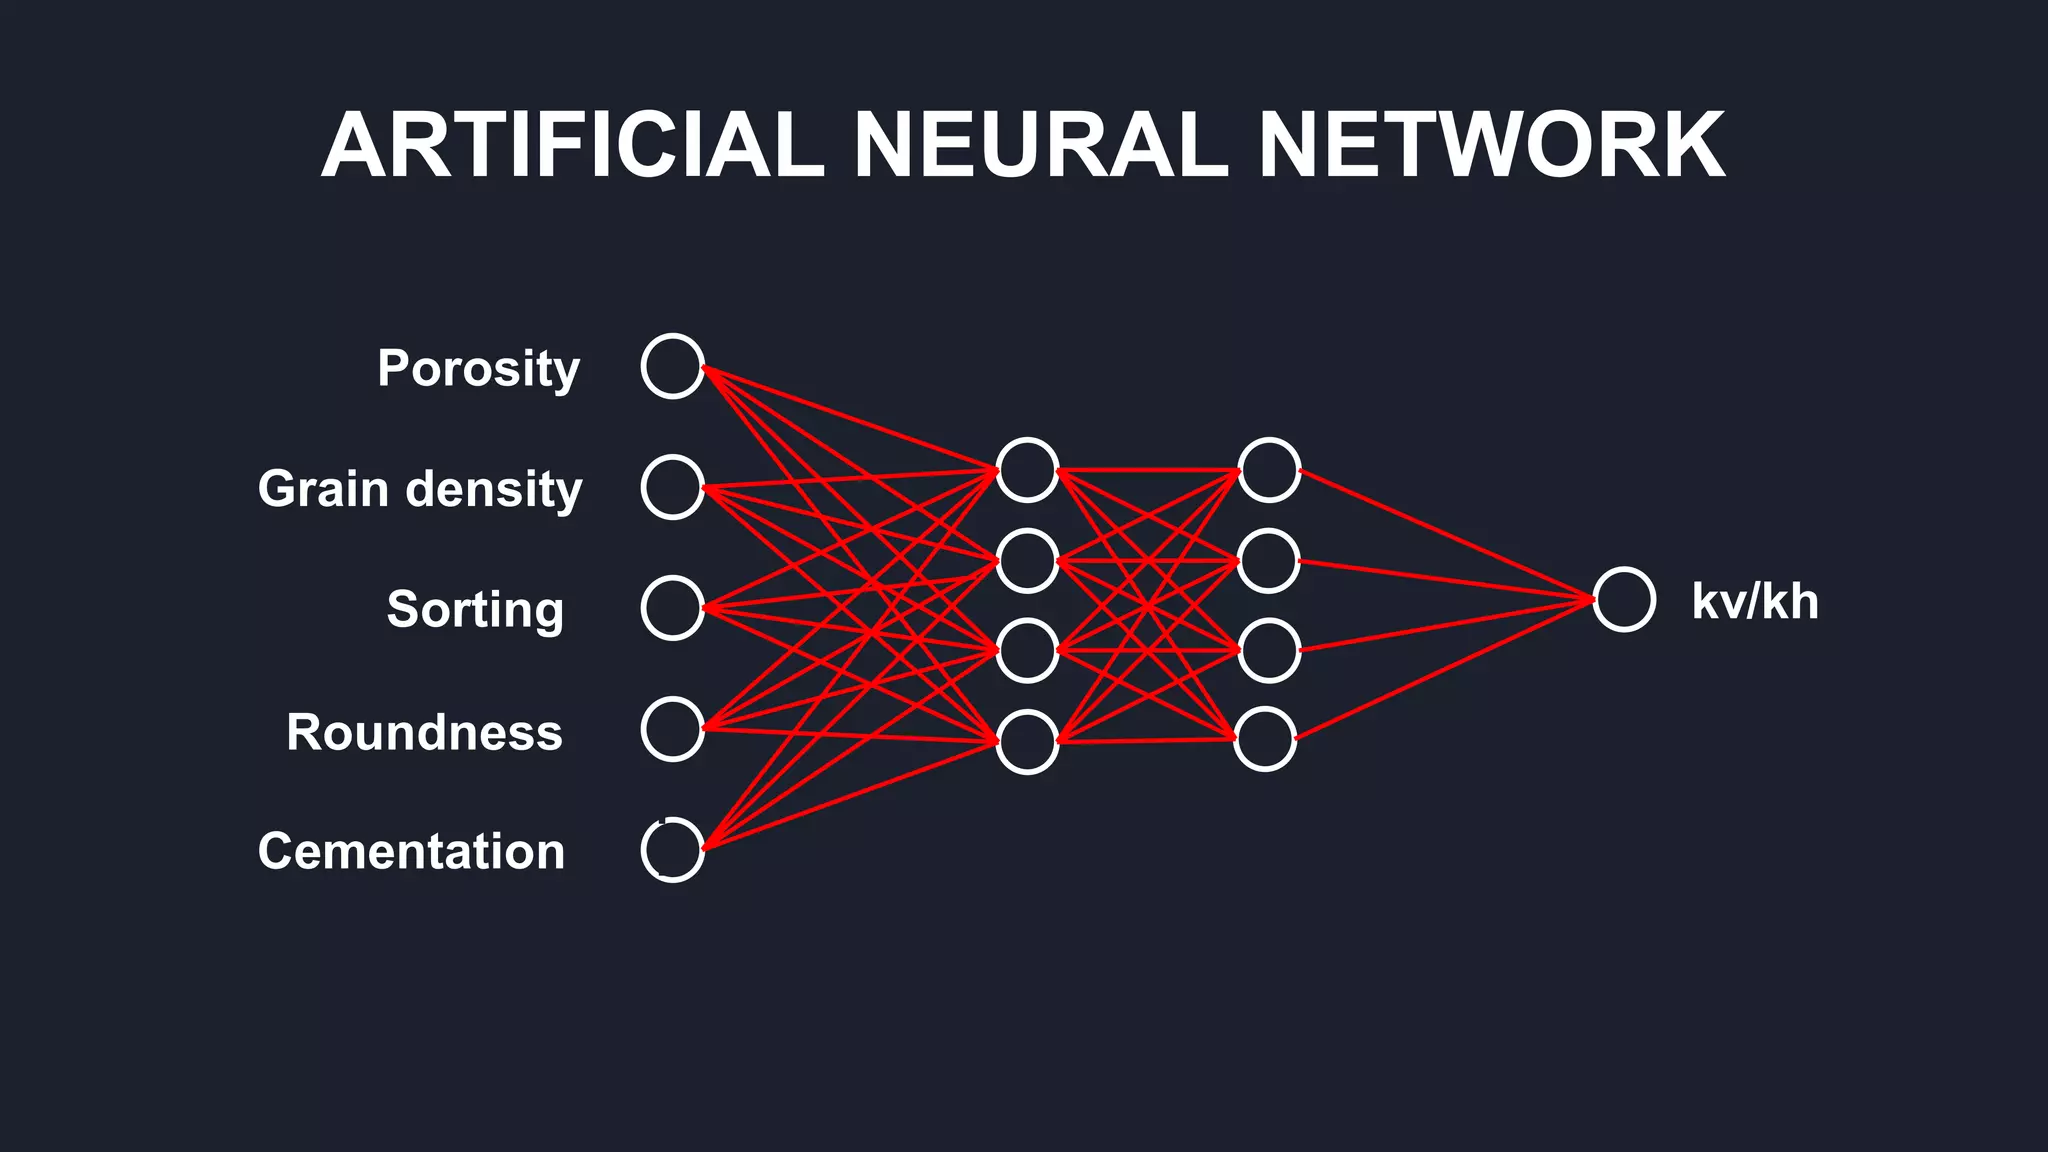
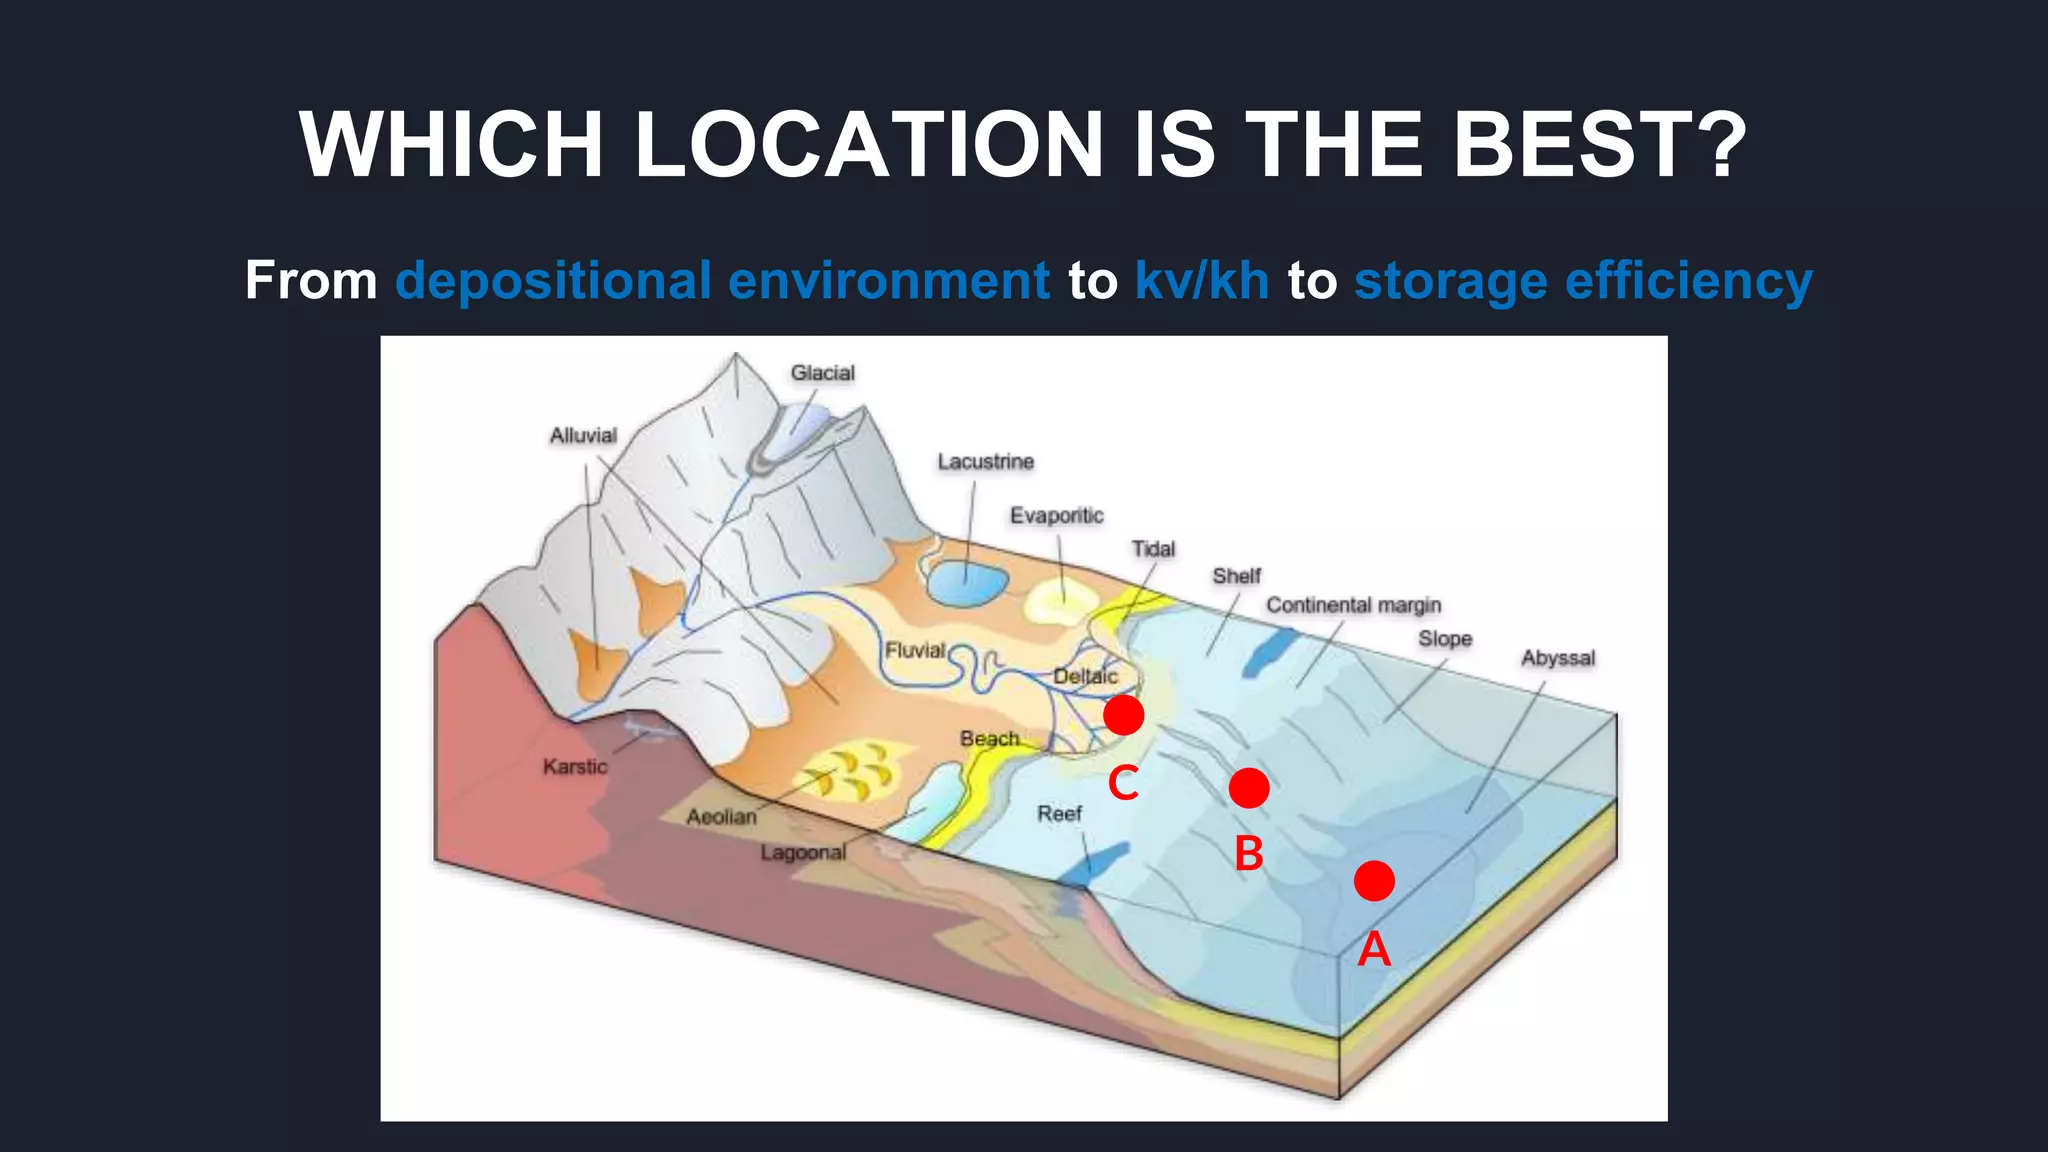
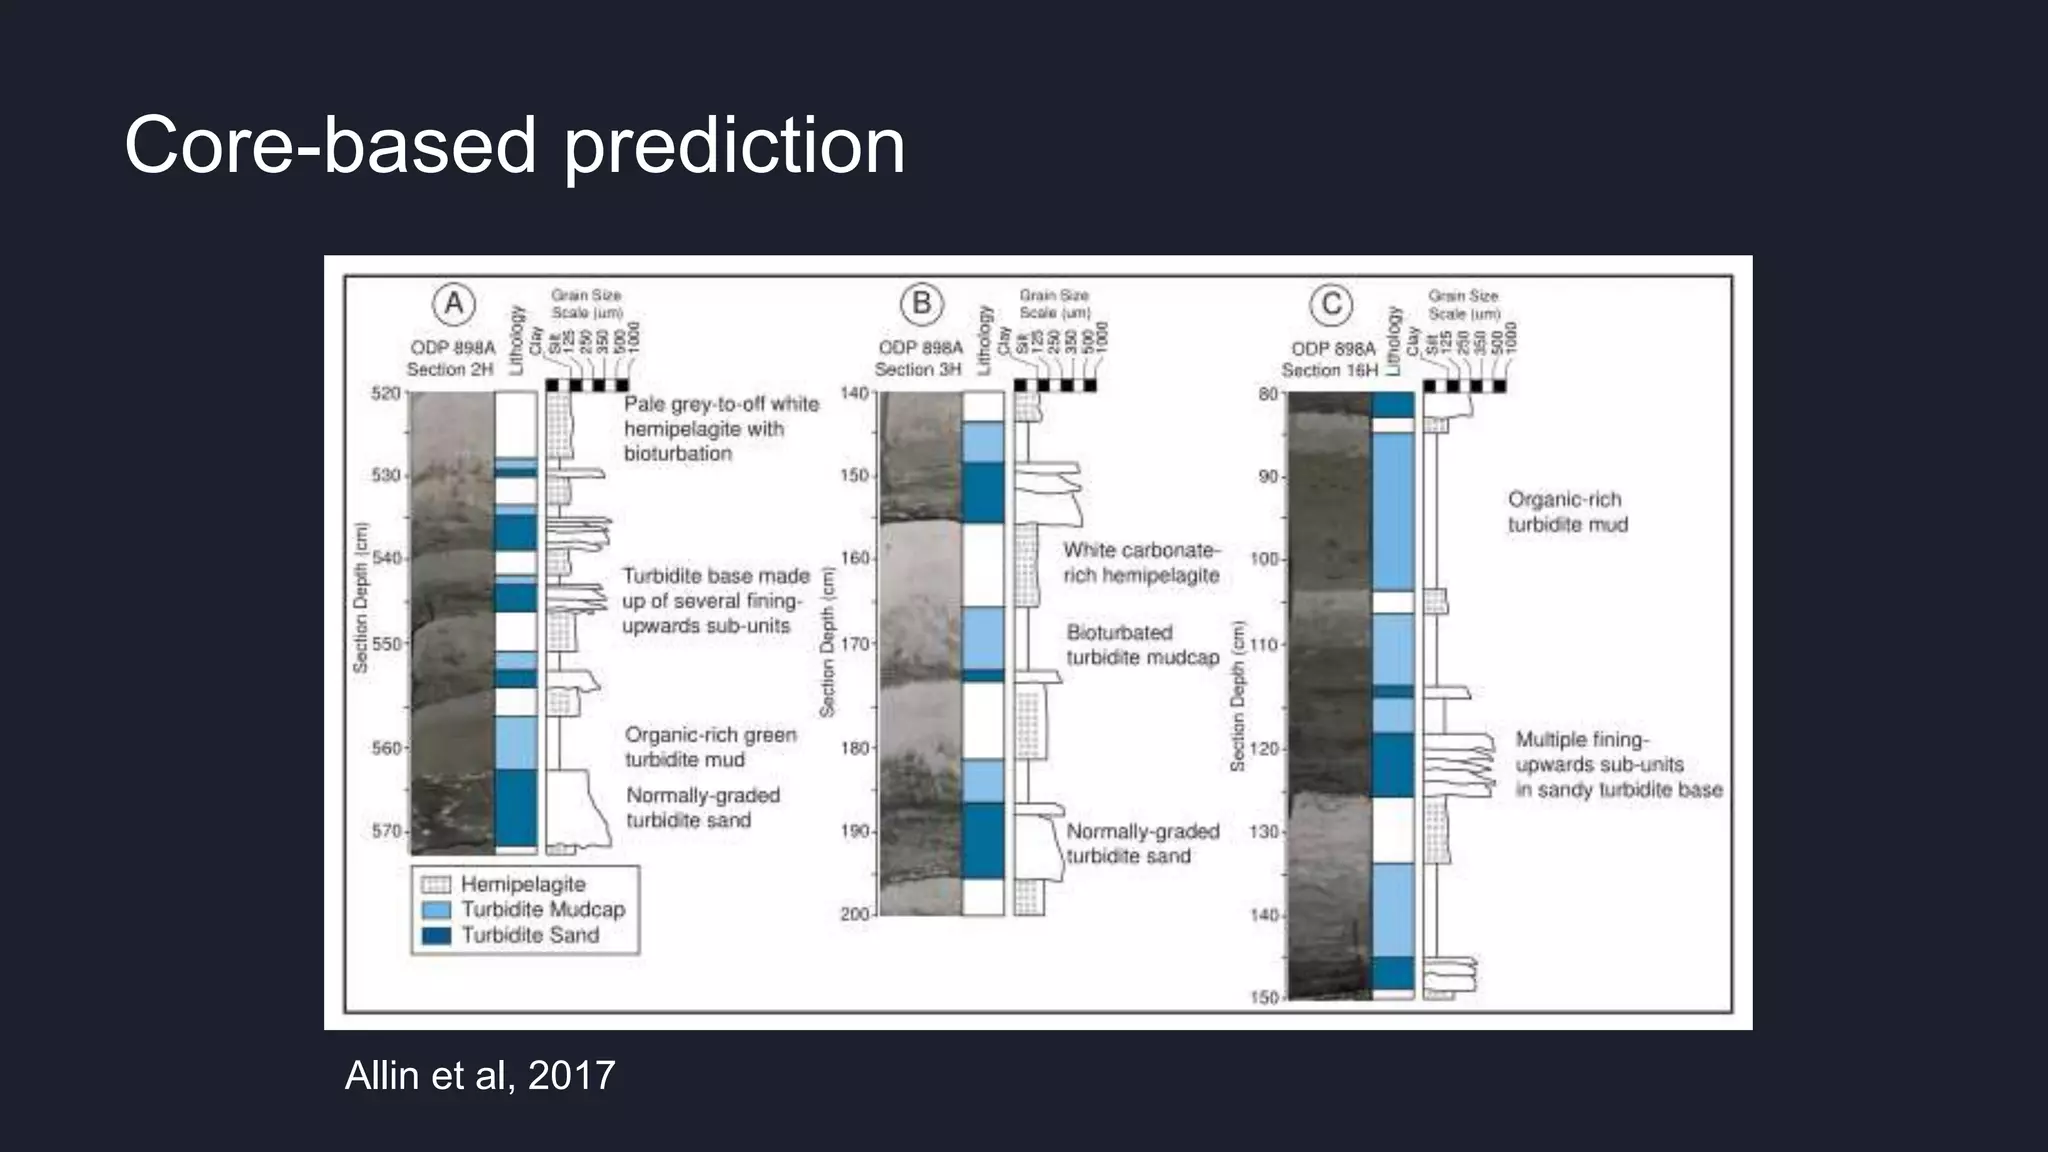
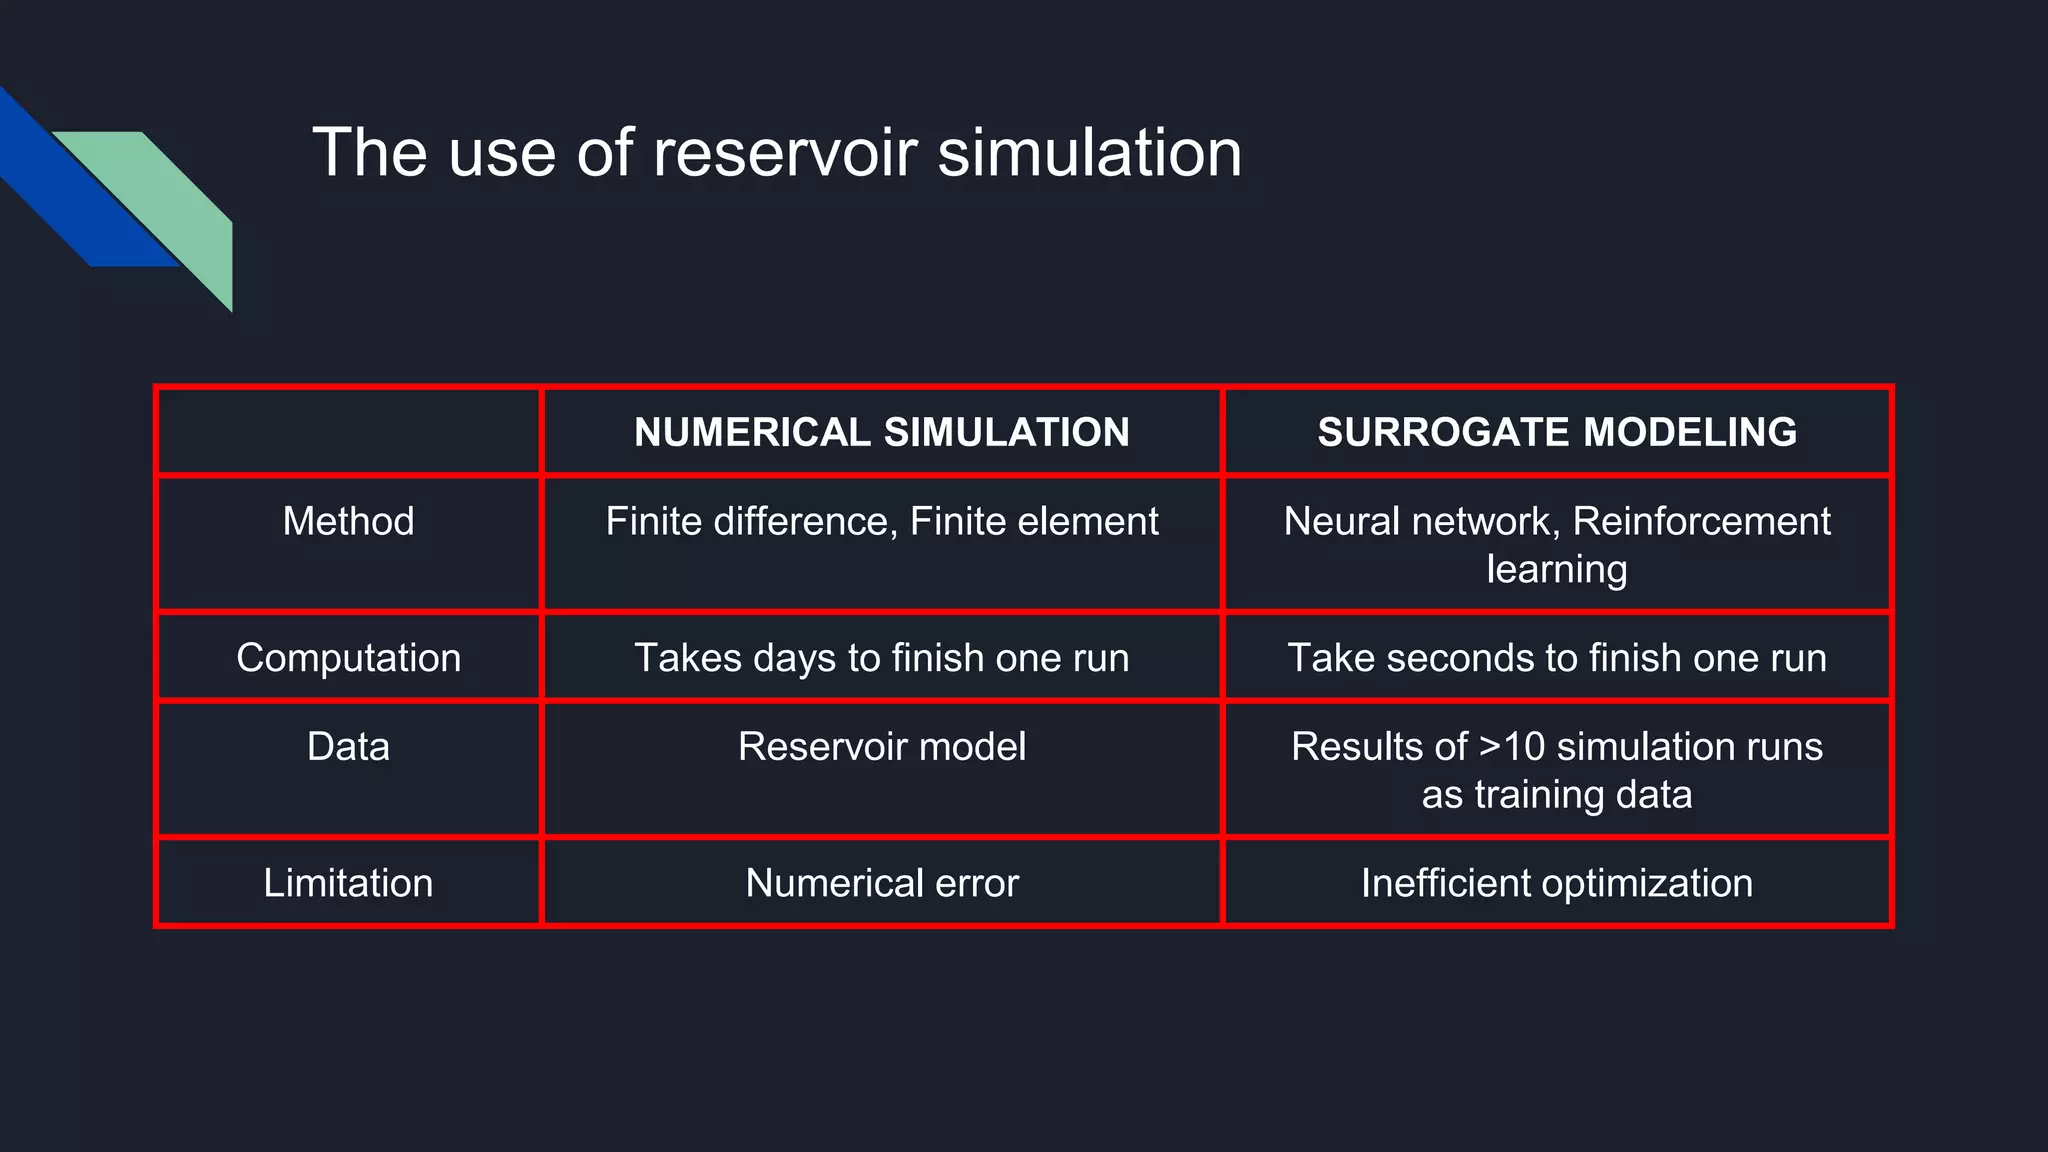
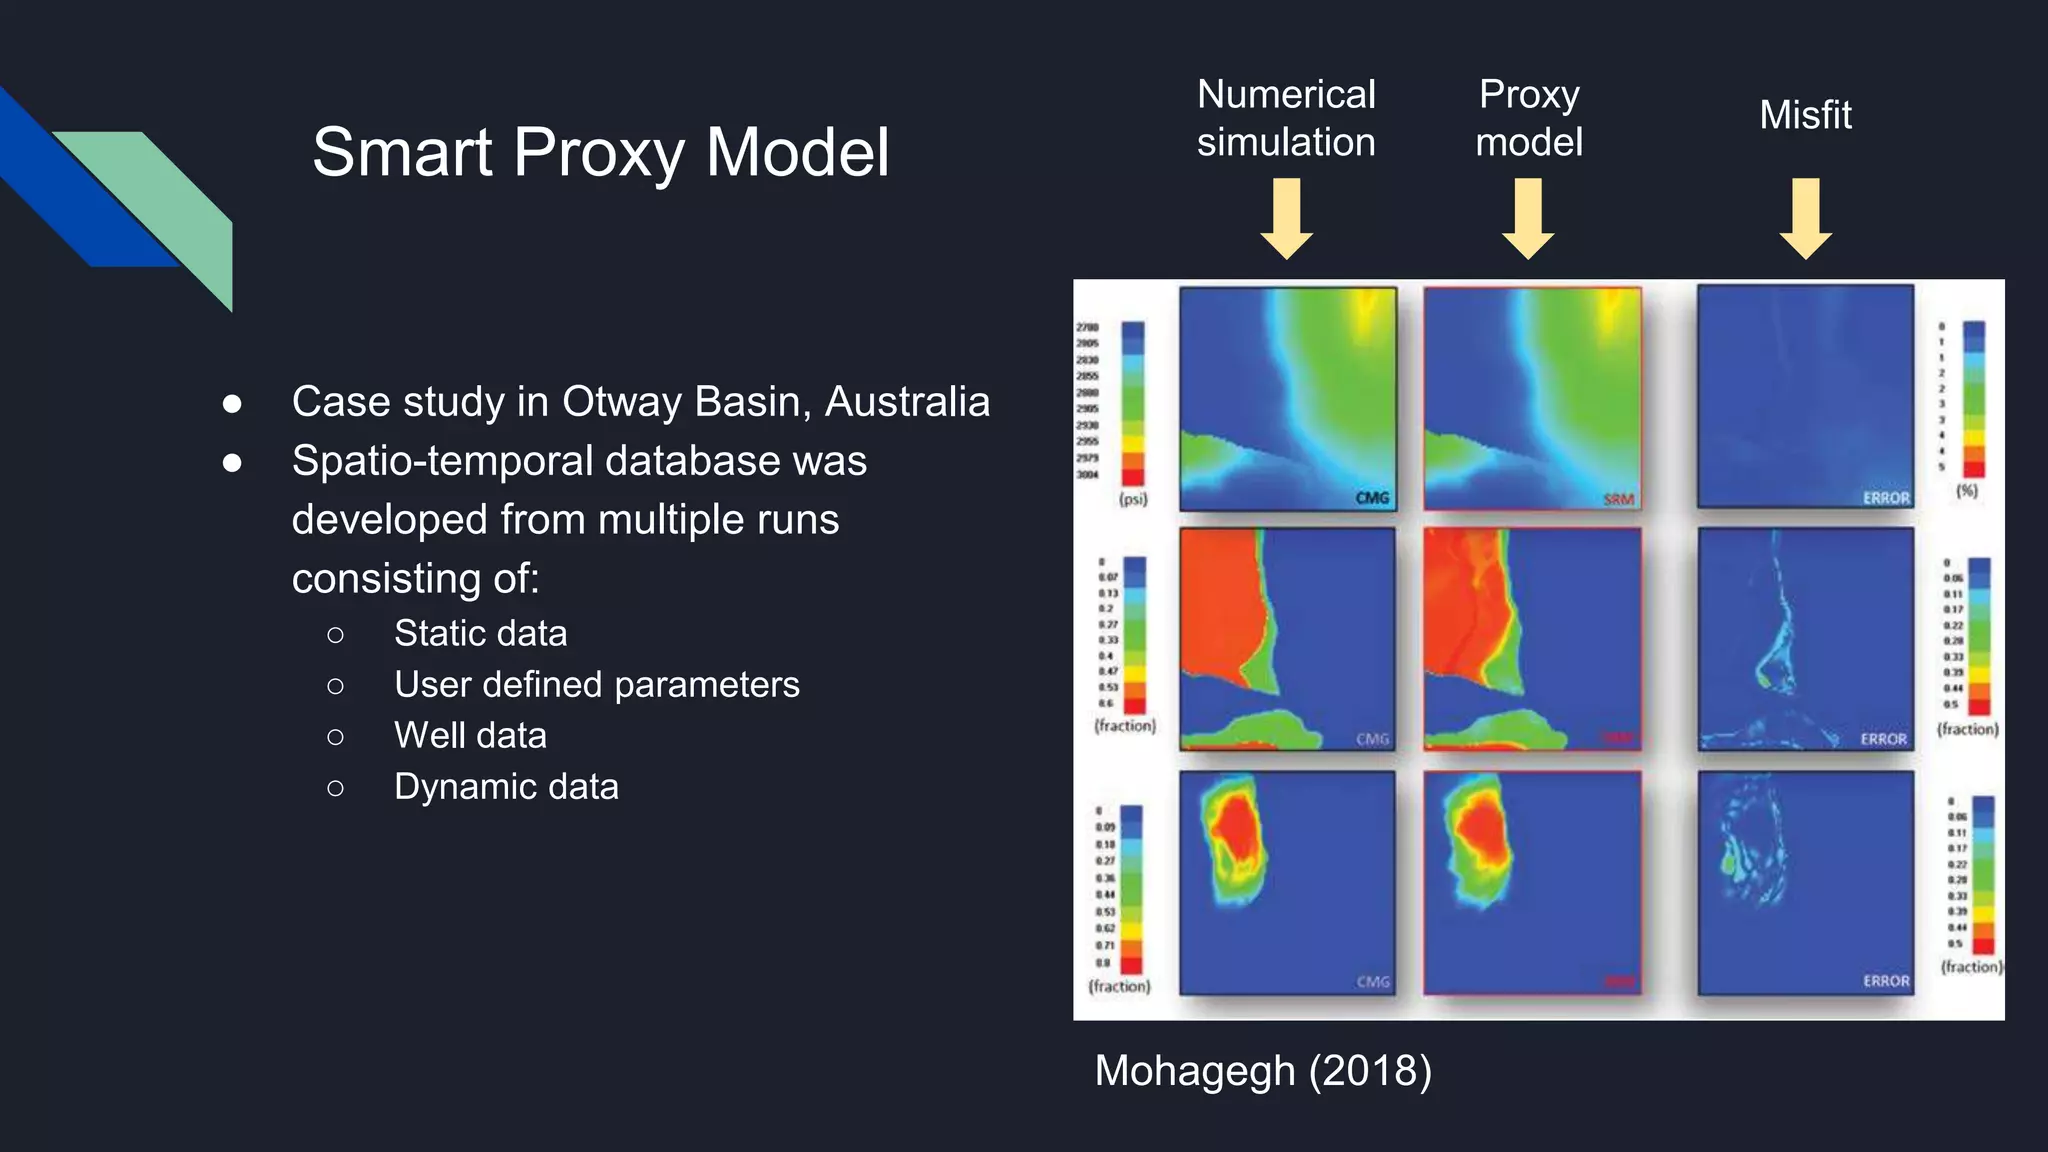
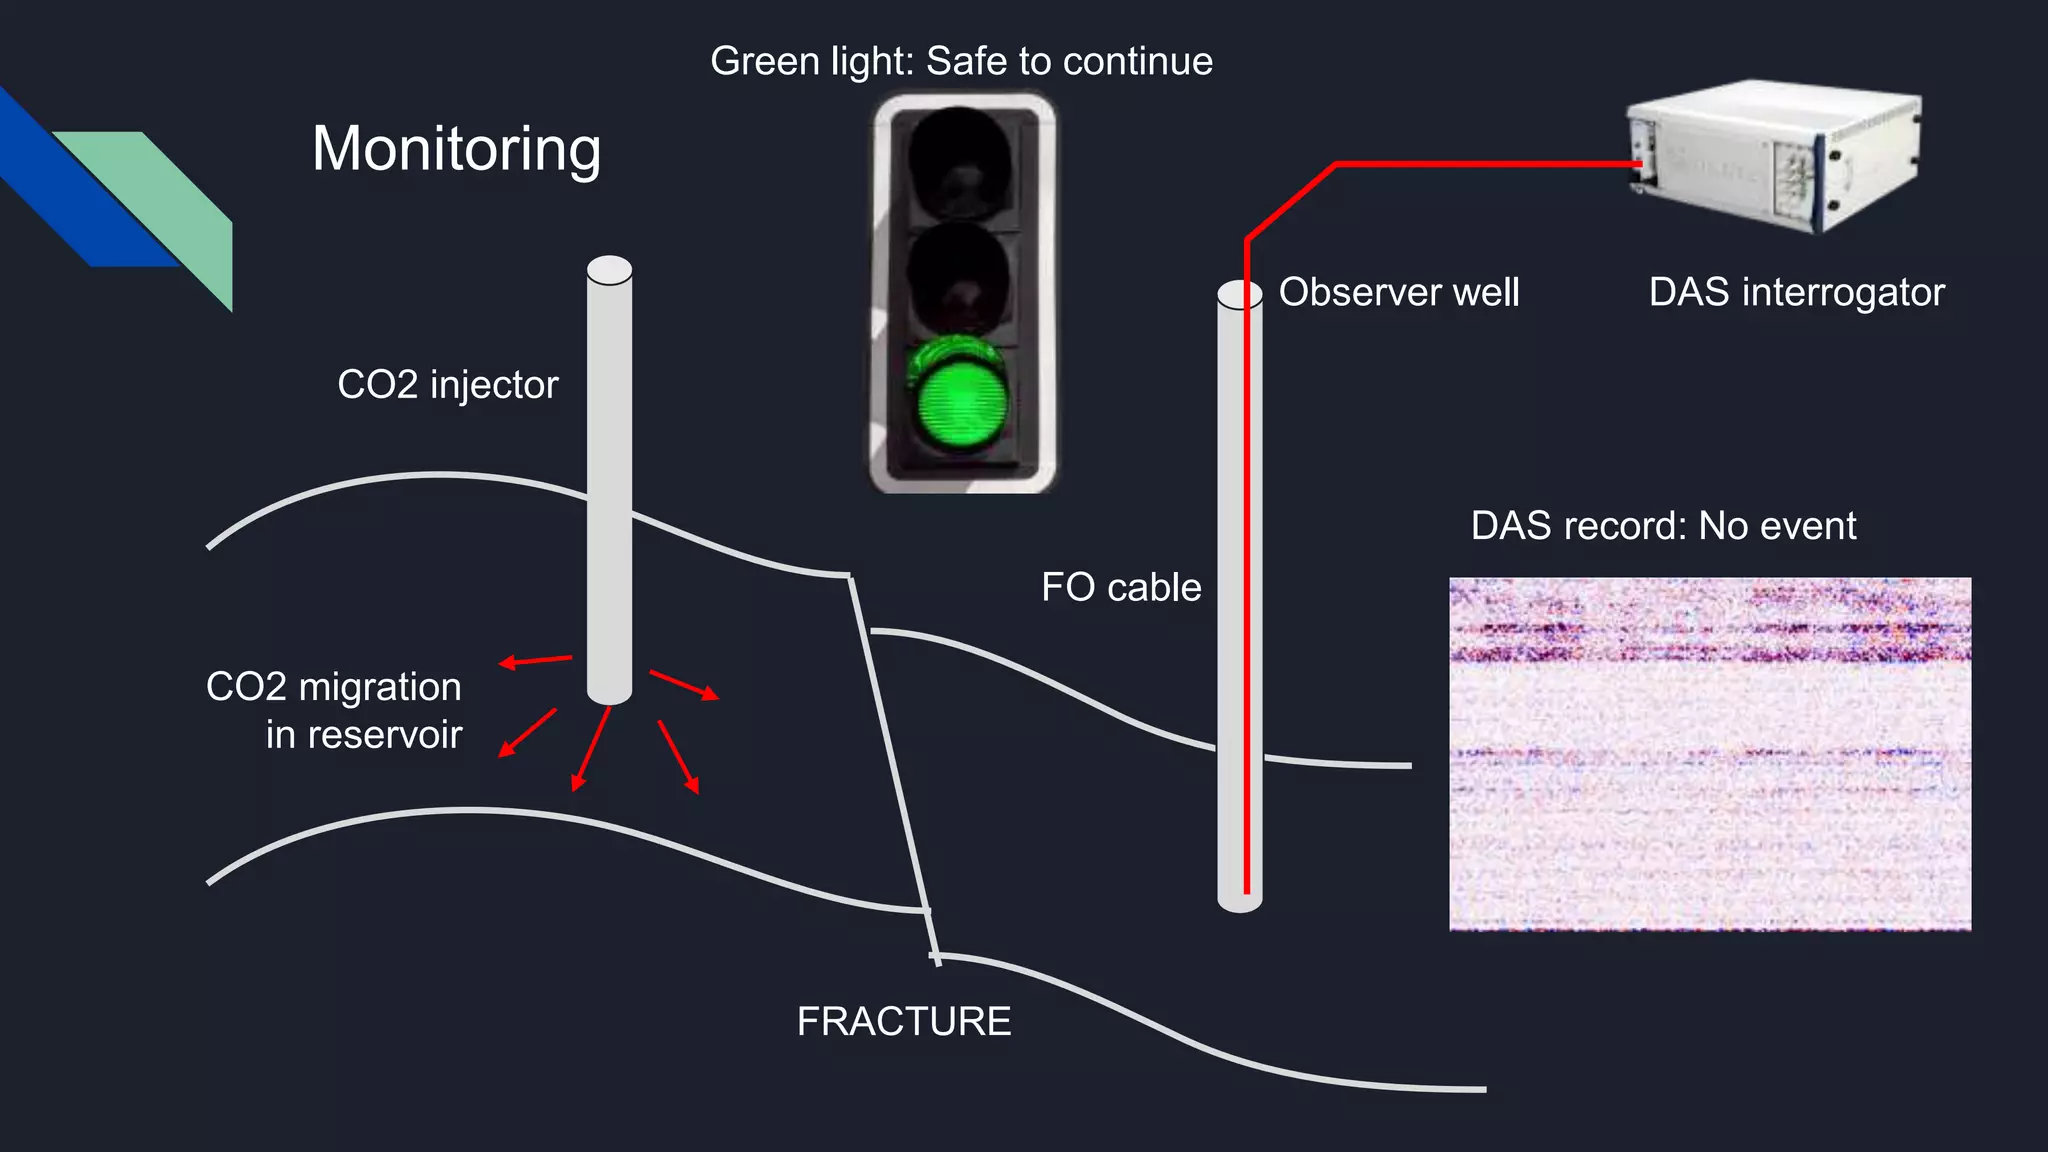
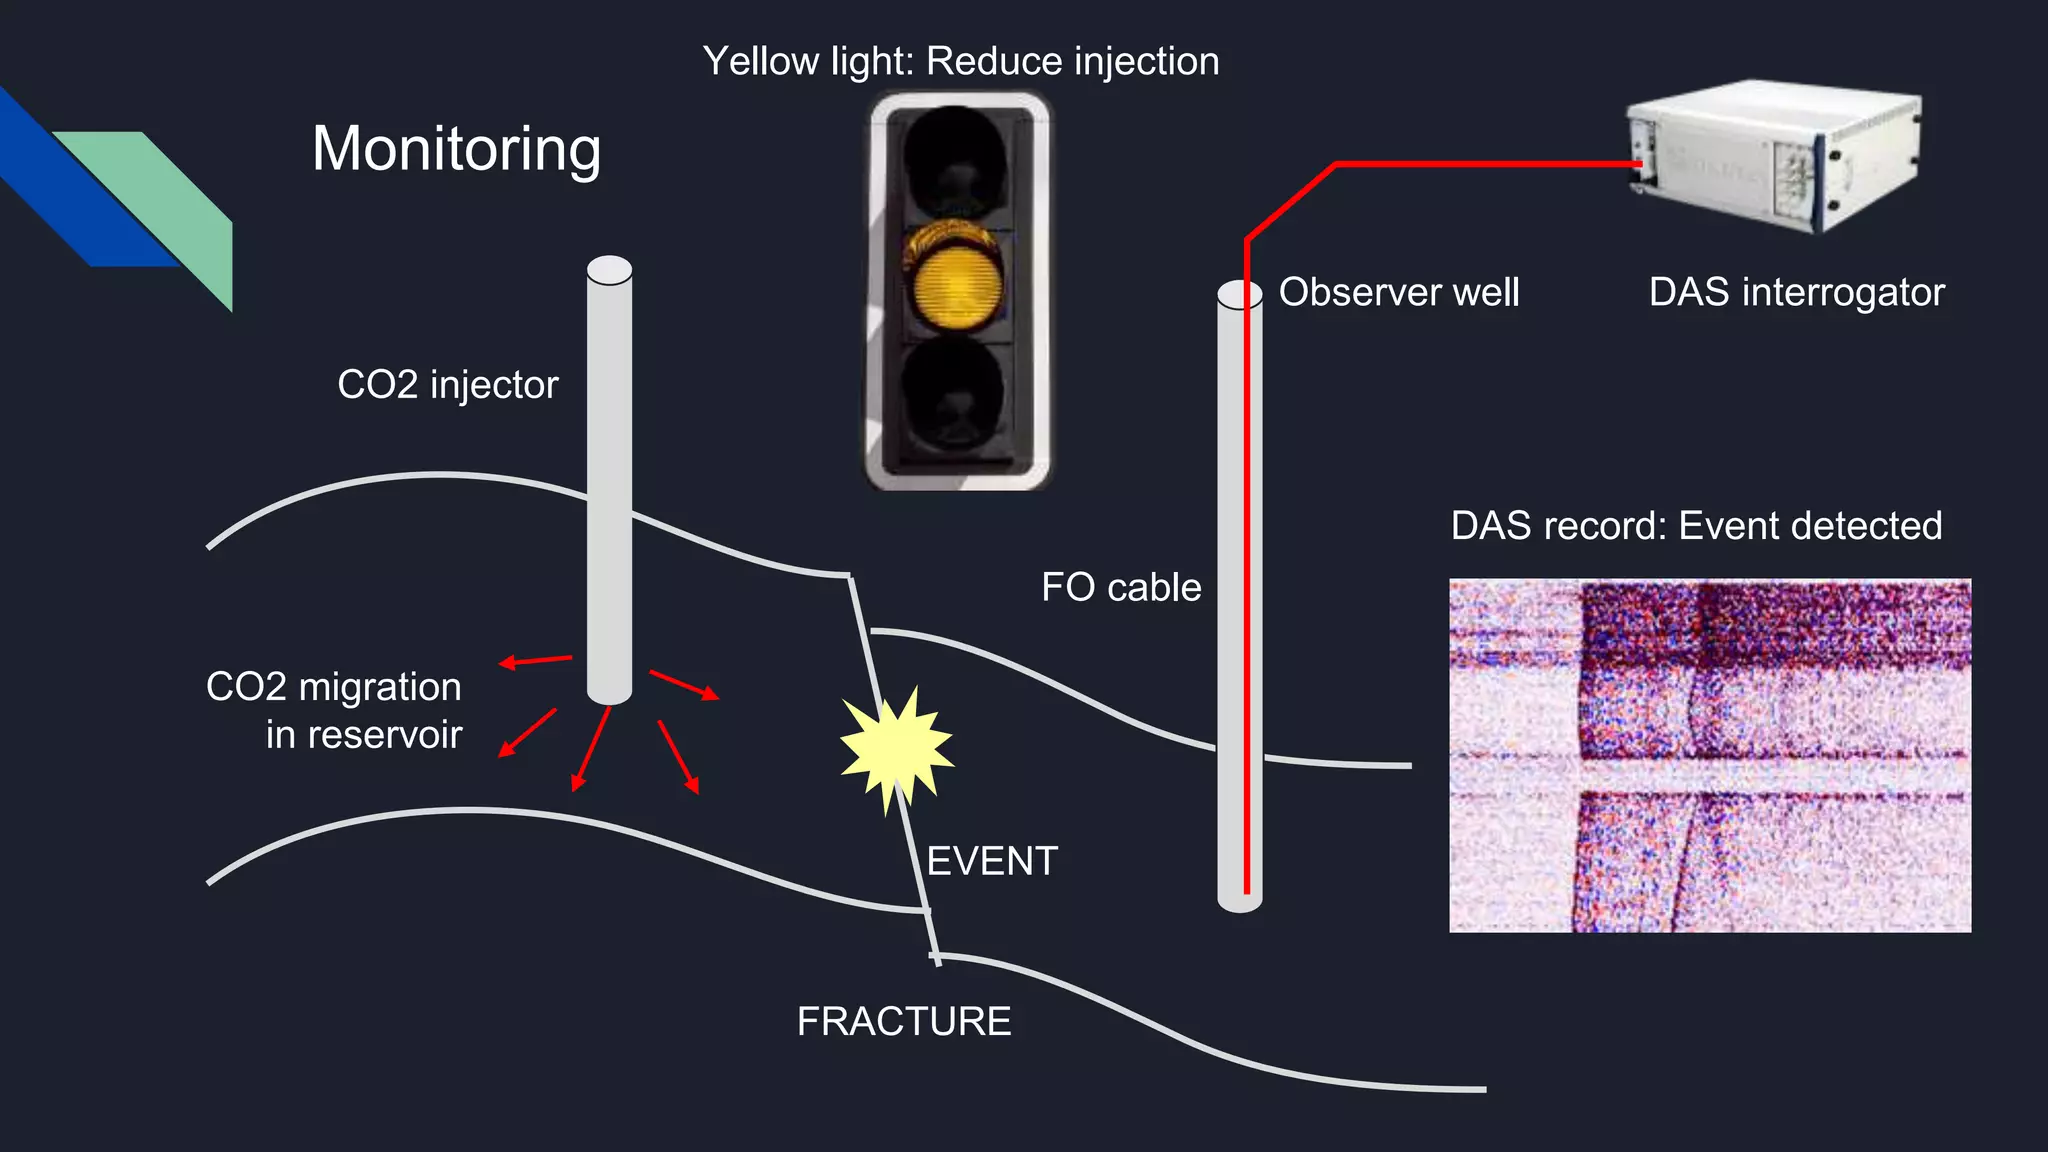
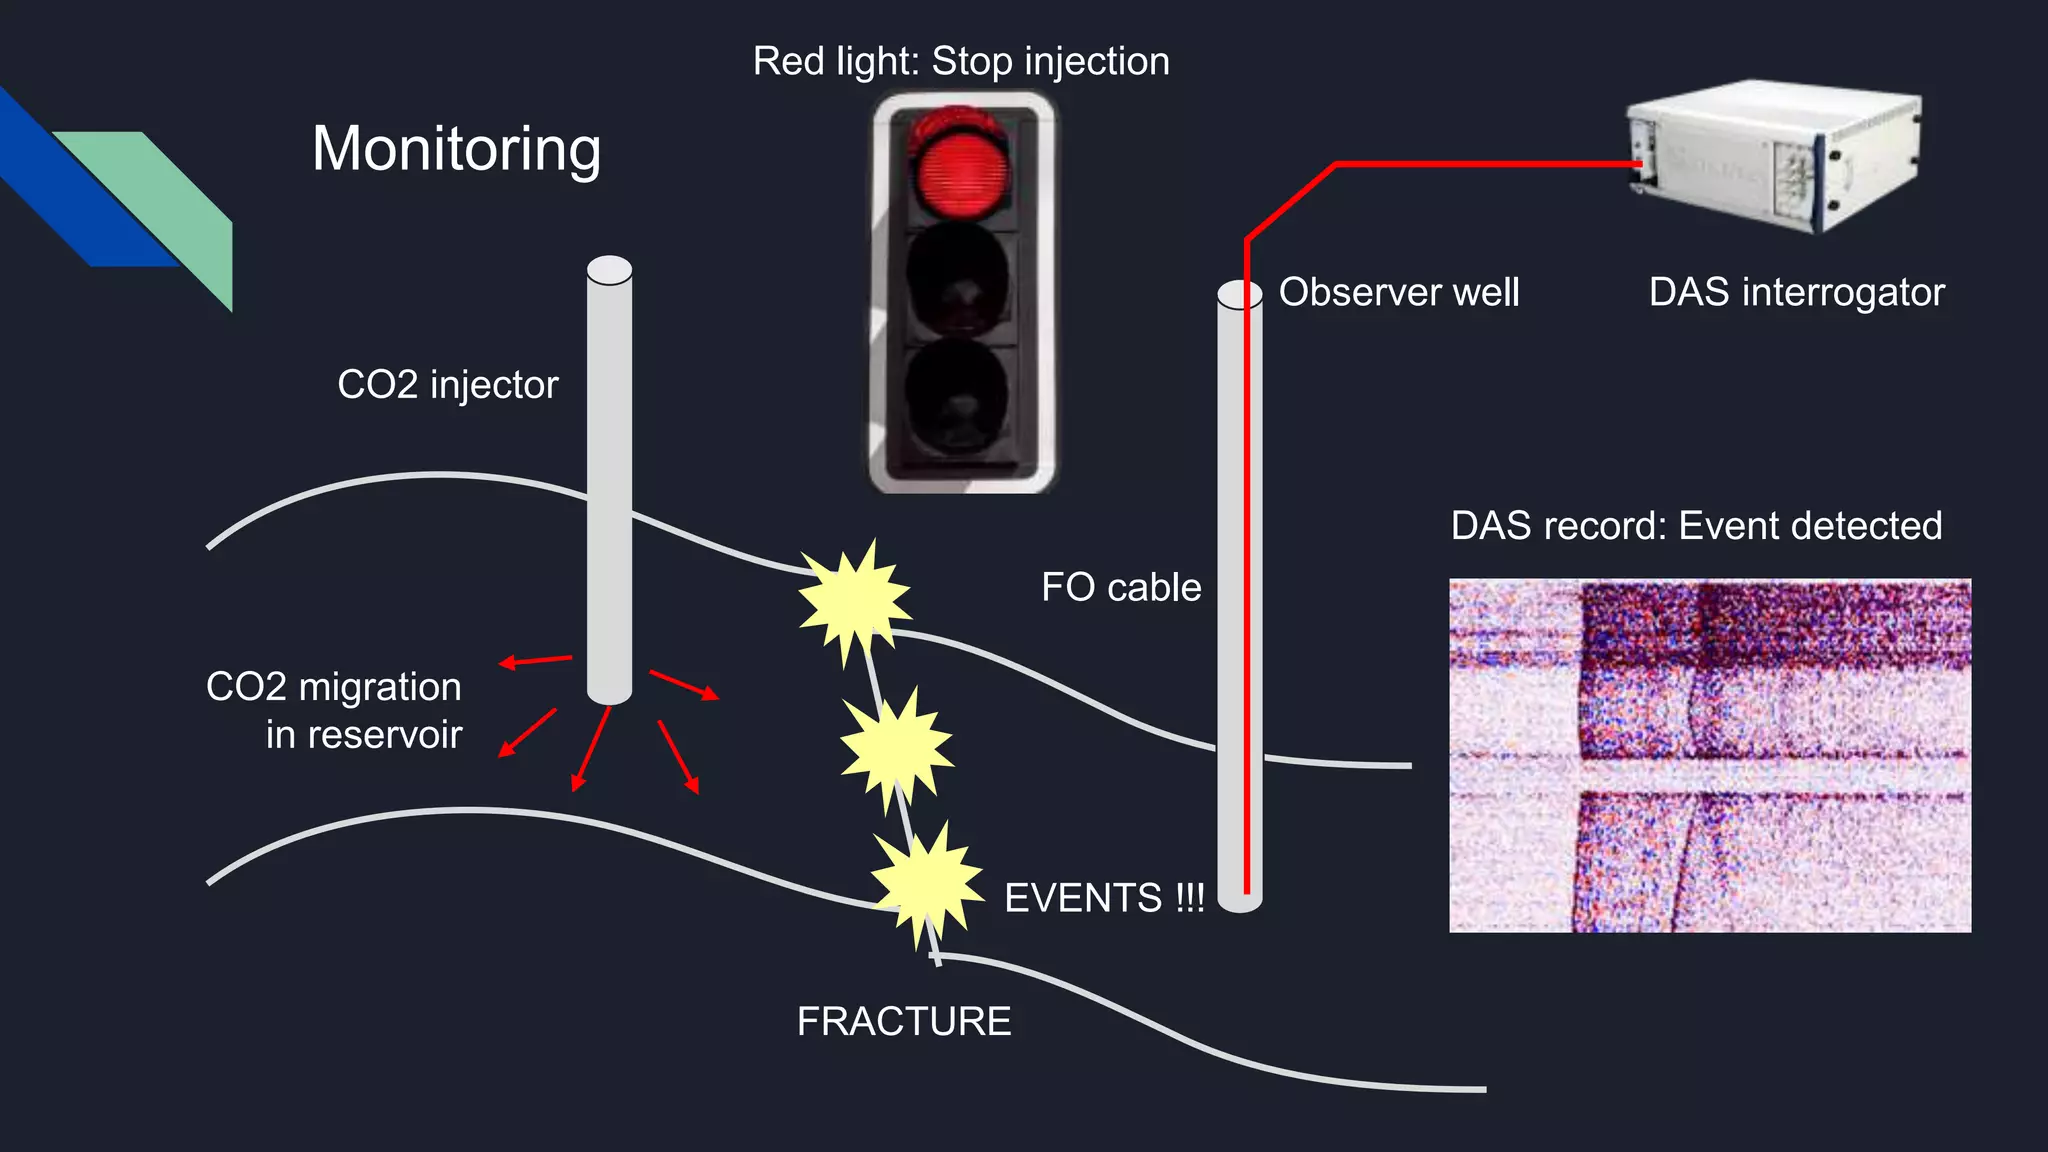
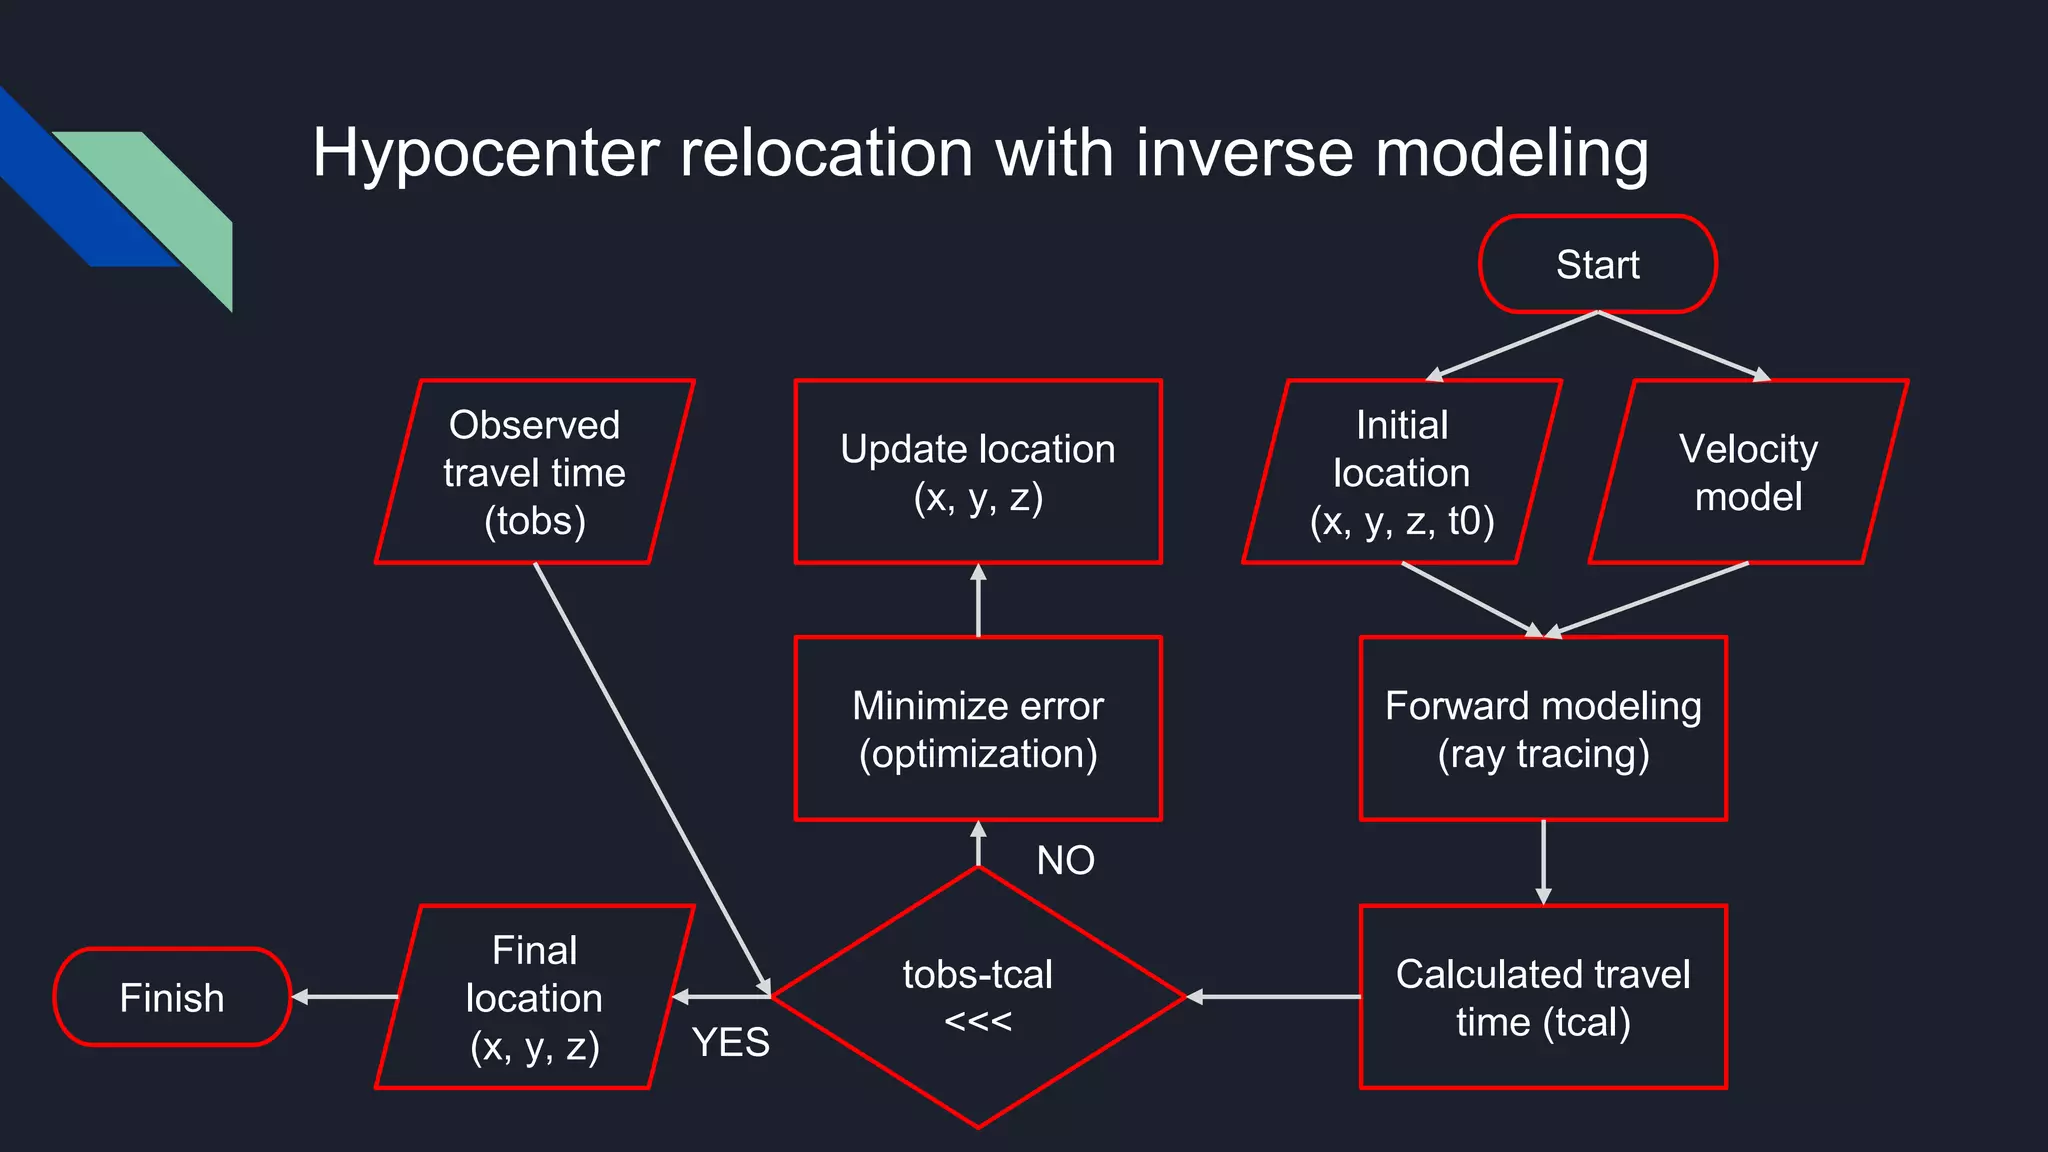
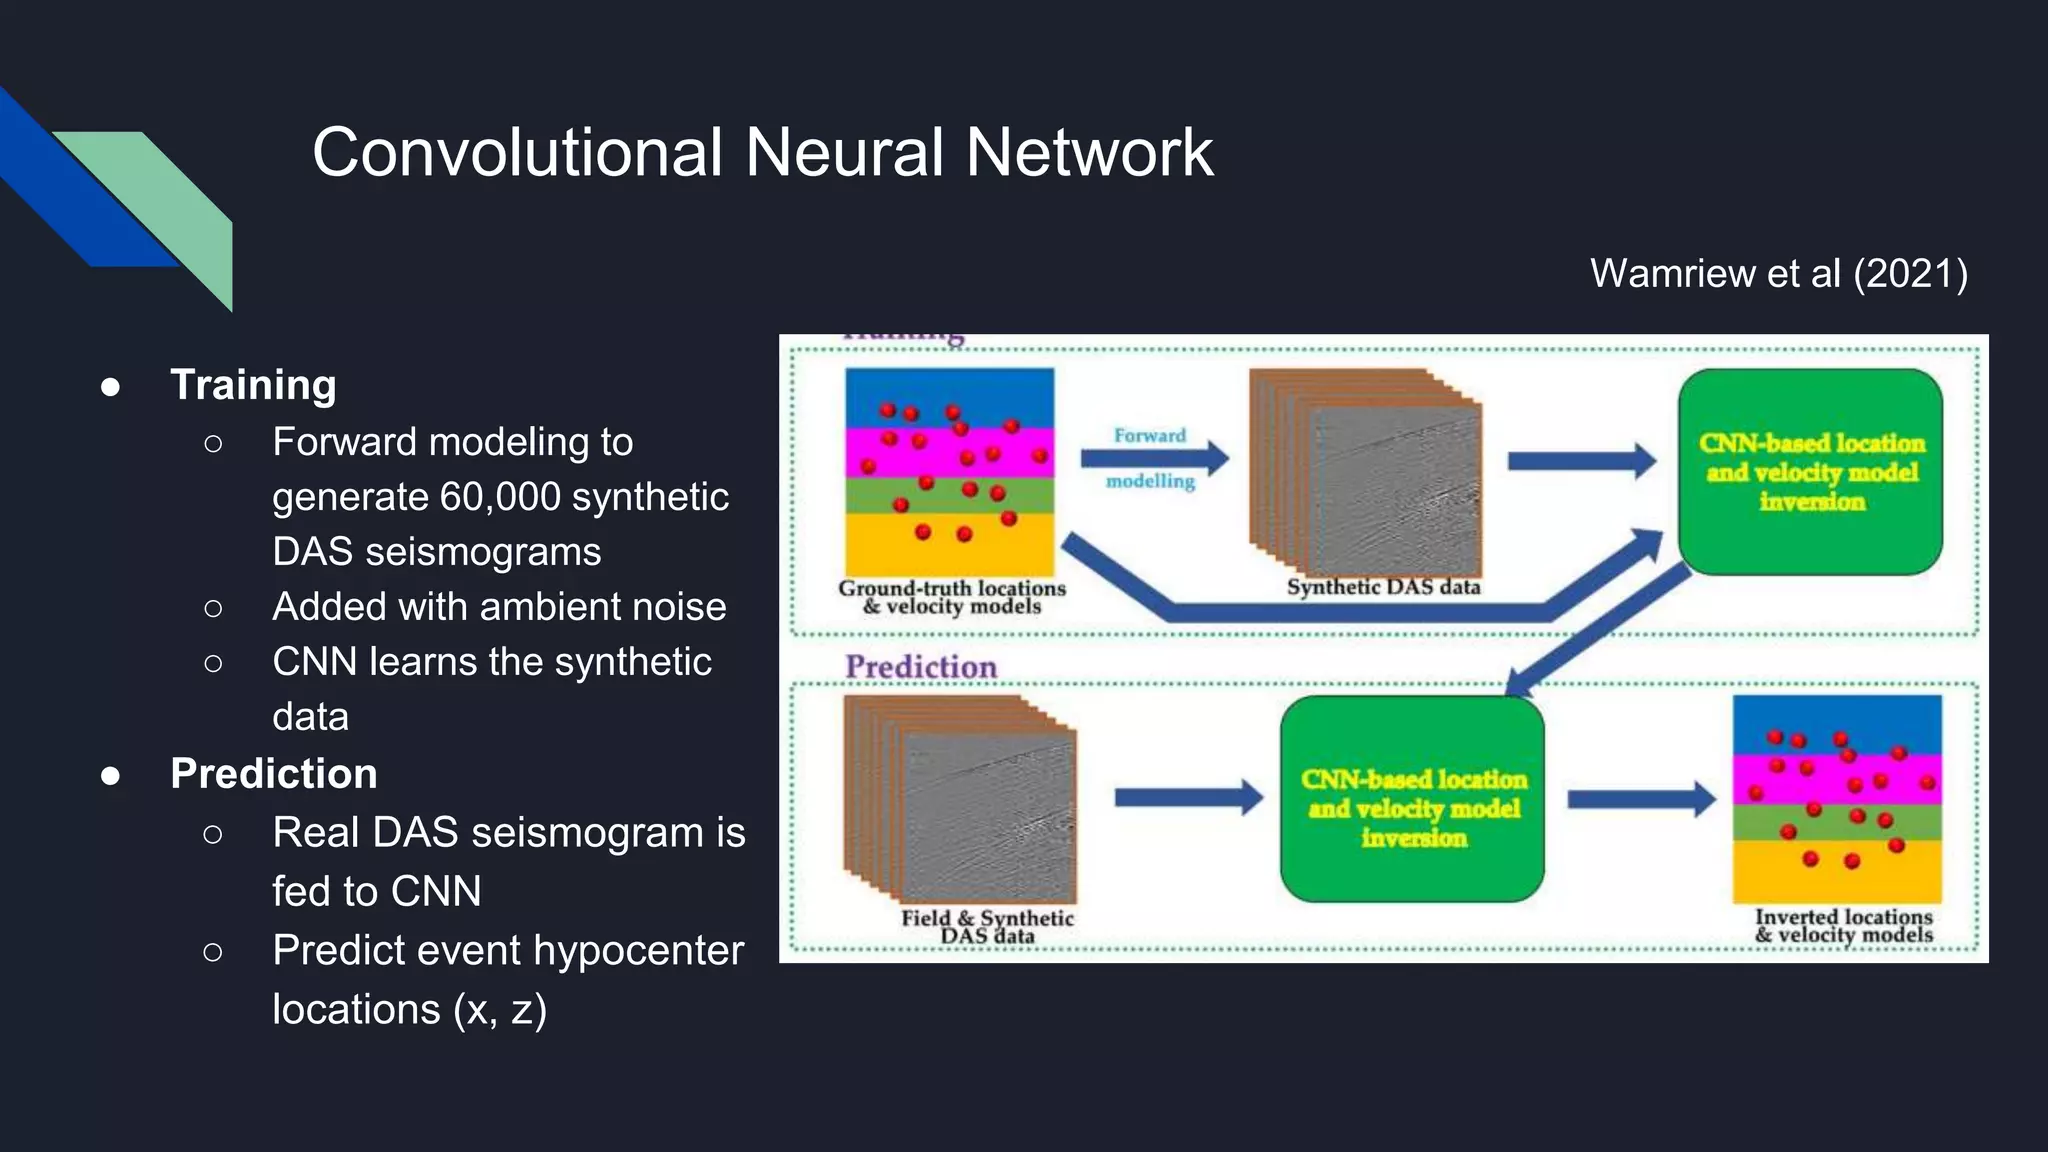
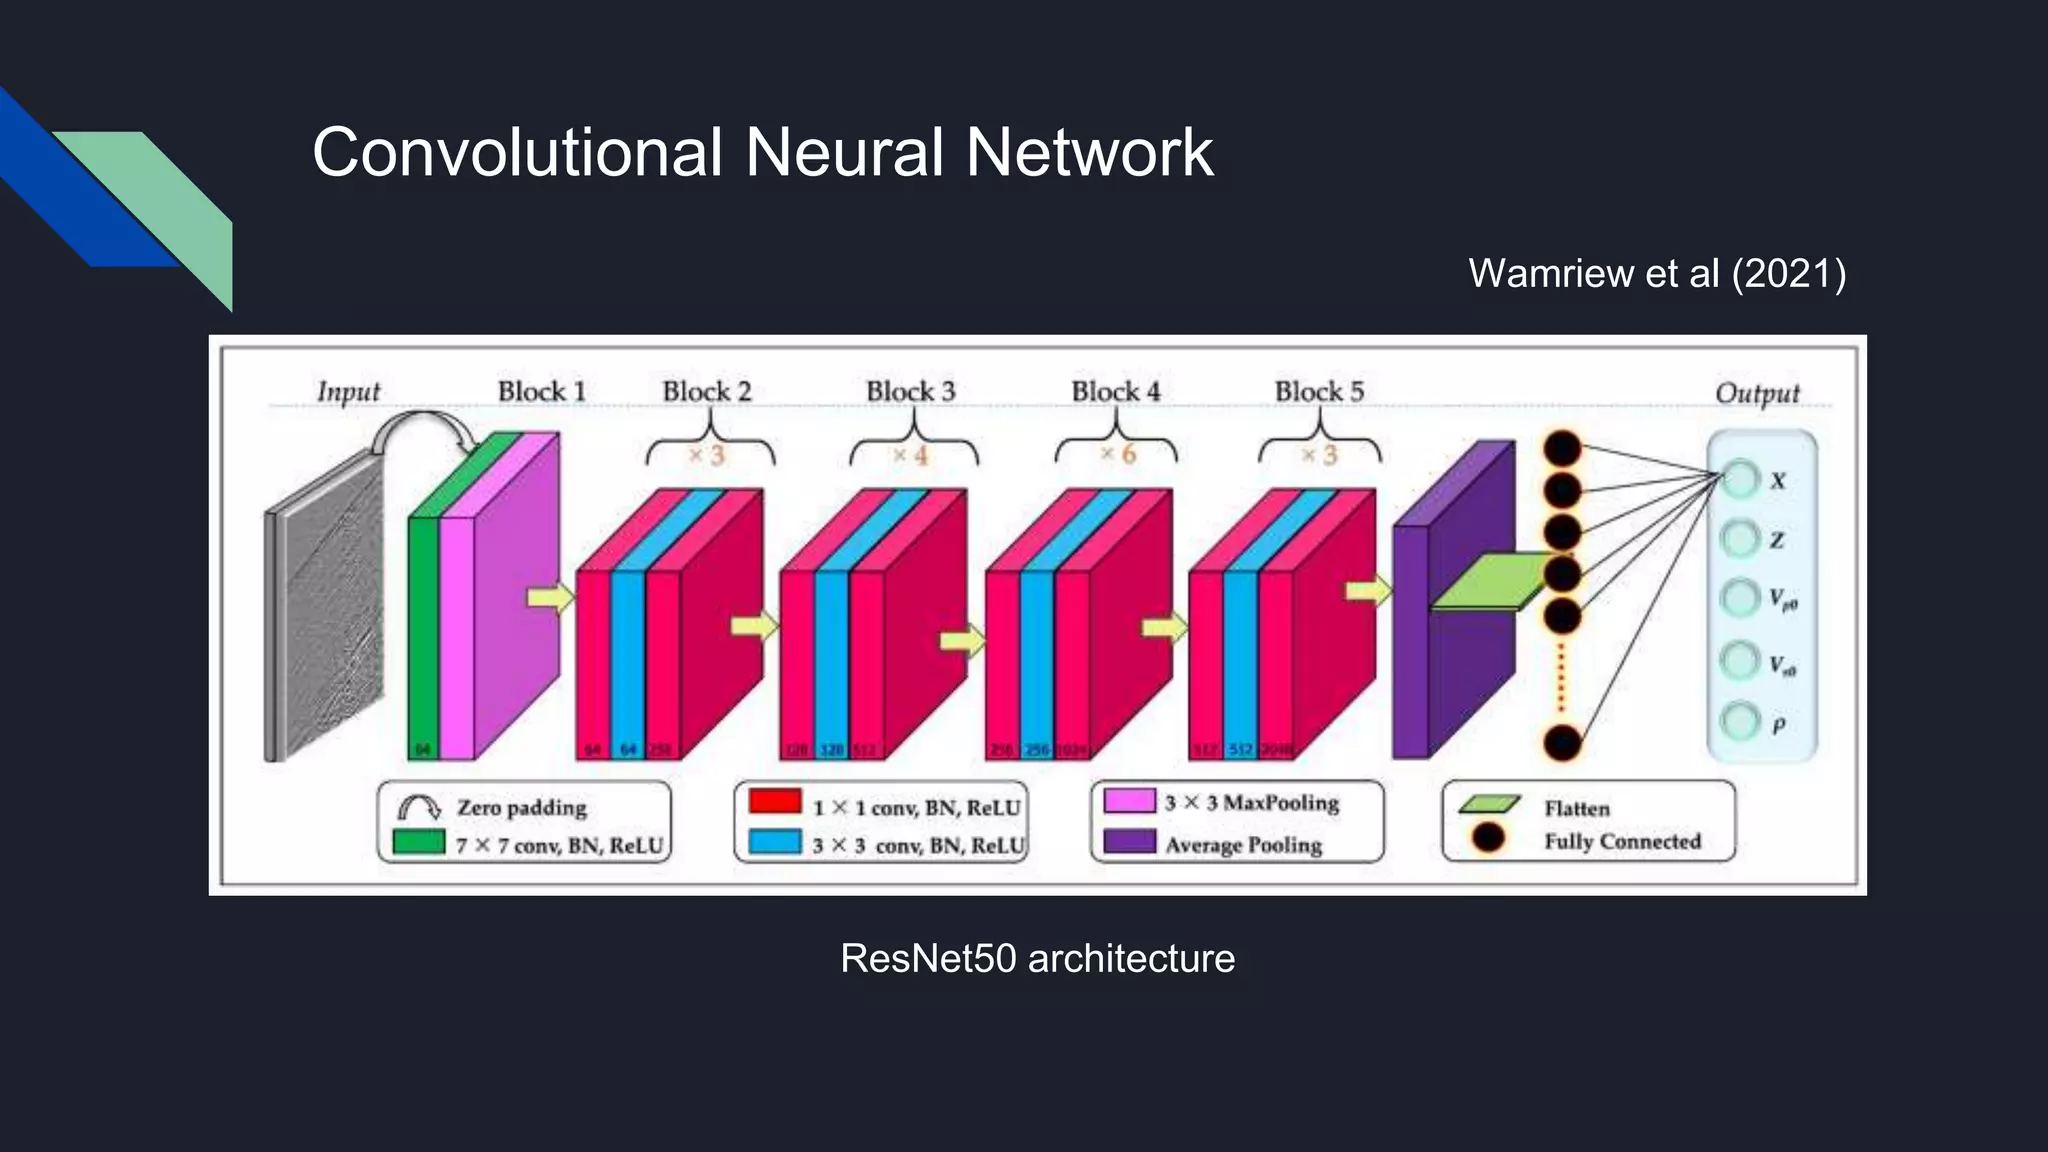
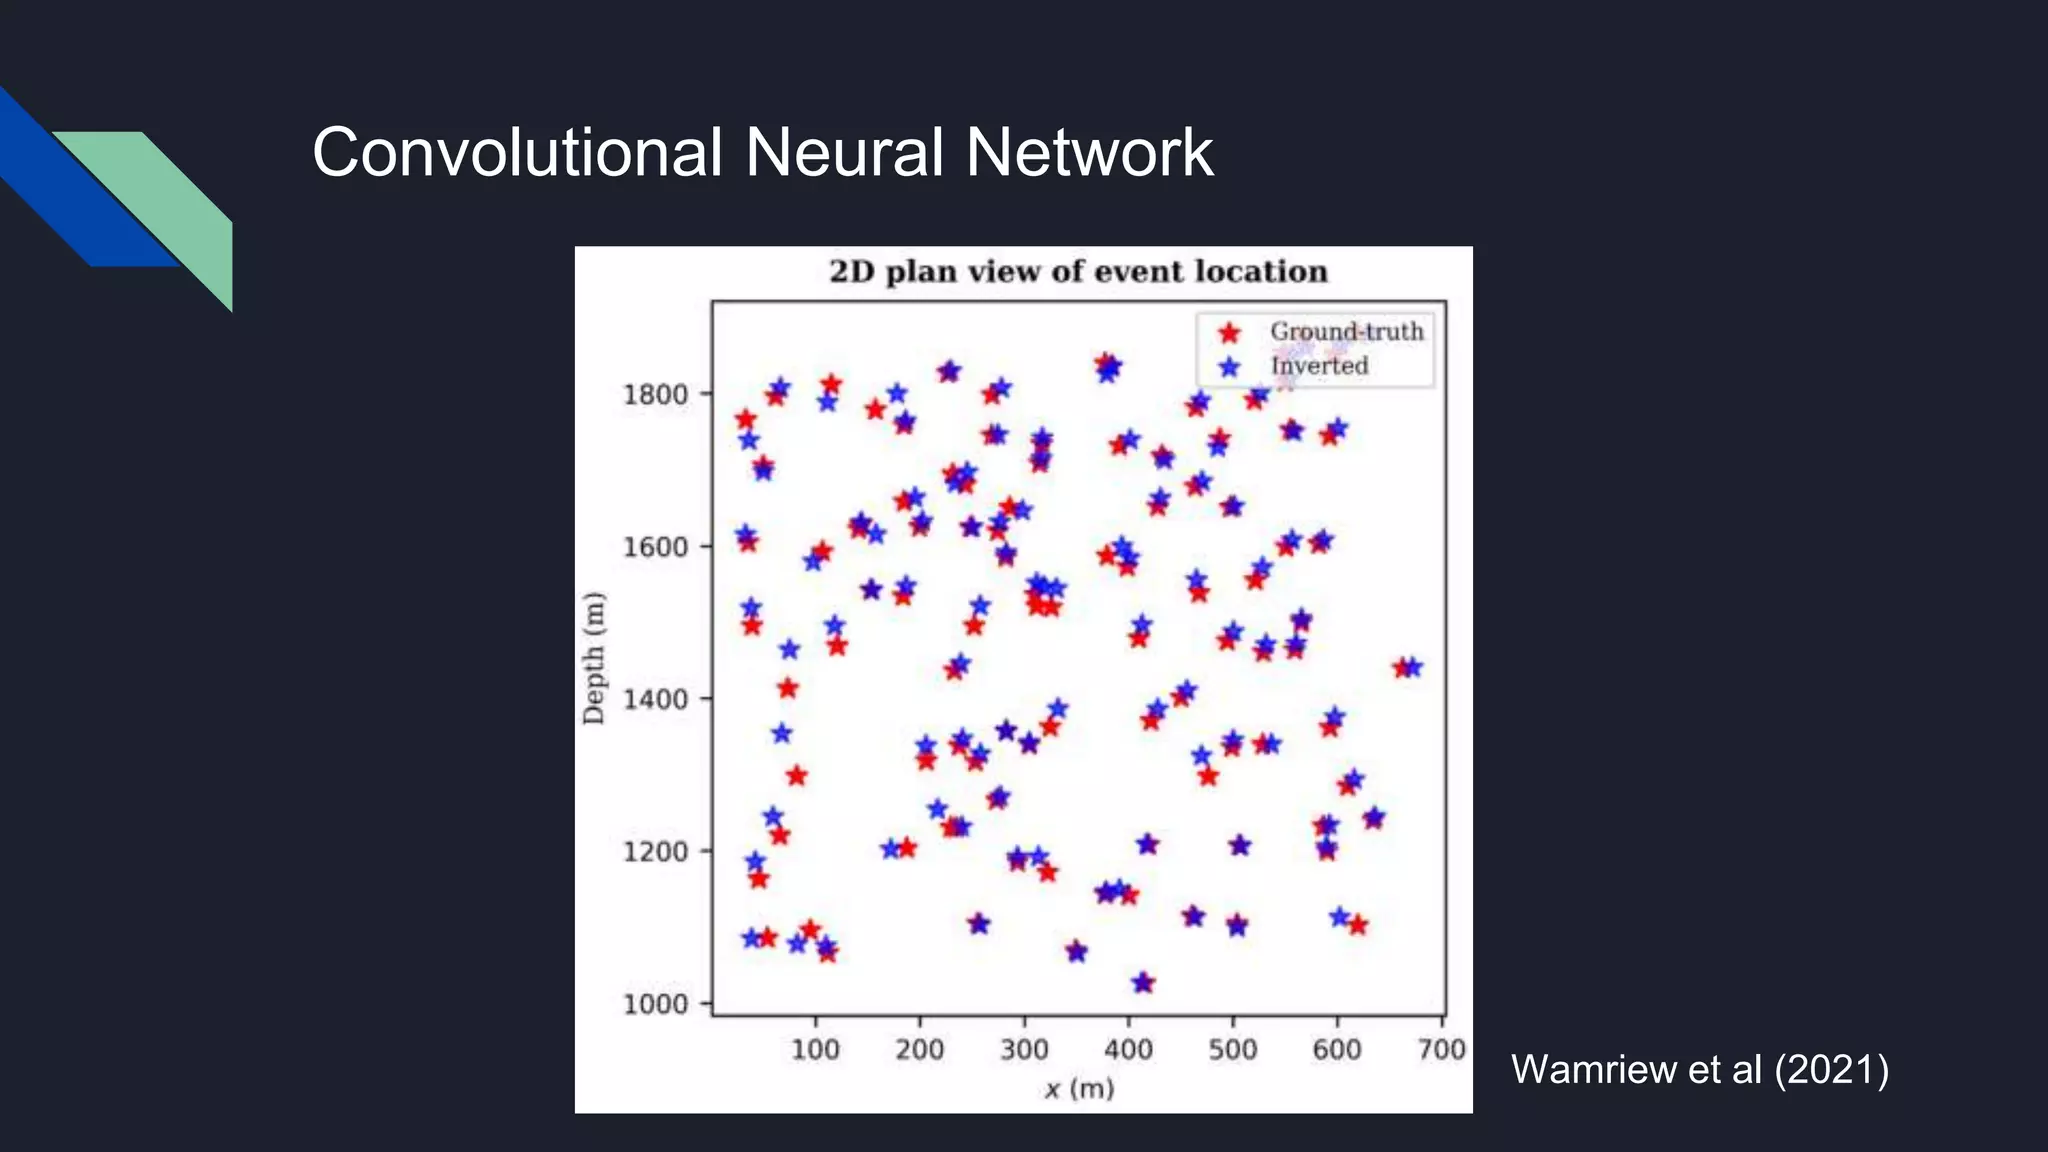
DATA-DRIVEN ANALYTICS
IN CARBON CAPTURE AND
STORAGE
Yohanes Nuwara
KFUPM, 10 November 2021
1
Outline
● Geological storage of CO2
● Role of data analytics in the life of CCS
● Data analytics during site selection
● Data analytics during sequestration
● Data analytics during monitoring
Geological Storage of CO2
● Viable solution for reducing
GHG emission from carbon-
intensive industries
● Many options of storage:
○ Deep saline aquifer
○ Depleted oil and gas reservoir
○ Igneous hard rock basement
● 3 important aspects of storage:
○ Capacity
○ Containment
○ Injectivity
Examples of existing CCS facilities
Sleipner CCS, North Sea
Quest CCS, Canada CarbFix CCS, Iceland
Role of Analytics in the Life of CCS
Data analytics in site
selection phase
What controls CO2 distribution?
● CO2 distribution is controlled
by the permeability anisotropy
● Permeability in vertical
direction (kv) is different from
horizontal (kh)
● Can be described by kv/kh
(ratio of kv to kh)
● This determines efficiency of
CO2 storage
S = f(kv/kh)
kv/kh >> kv/kh <<
Knowing vertical-to-horizontal
permeability ratio (kv/kh) is
important to determine storage
efficiency and finally to rank storage
options
kv/kh >>>
STRUCTURAL TRAP
For CO2 stored in structural traps, kv/kh must be LARGE
kv/kh <<<
STRATIGRAPHIC TRAP
For CO2 stored in stratigraphic traps, kv/kh must be SMALL
kv/kh <<<
Unfortunately, there is none exact
formula that determines kv/kh from
geological data. Instead, we can use
data-driven approach to “PREDICT”
kv/kh
North Sea Fields
● Published by GeoProvider AS
● 1,240 documented well data
● Each records consists of:
○ Core porosity
○ Core permeability (kv and kh)
○ Core saturations
○ Sedimentary descriptions
(roundness, sorting, structure,
cementation)
Courtesy MapStand
Sedimentary controls on permeability
Very Well Sorted Well Sorted Moderately Sorted
Poorly Sorted Very Poorly Sorted
Sedimentary controls on permeability
Grain density
Sorting
Roundness
Cementation
Porosity
kv/kh
ARTIFICIAL NEURAL NETWORK
WHICH LOCATION IS THE BEST?
From depositional environment to kv/kh to storage efficiency
A
B
C
Core-based prediction
Allin et al, 2017
Data analytics in
sequestration phase
The use of reservoir simulation
NUMERICAL SIMULATION SURROGATE MODELING
Method Finite difference, Finite element Neural network, Reinforcement
learning
Computation Takes days to finish one run Take seconds to finish one run
Data Reservoir model Results of >10 simulation runs
as training data
Limitation Numerical error Inefficient optimization
Smart Proxy Model
● Case study in Otway Basin, Australia
● Spatio-temporal database was
developed from multiple runs
consisting of:
○ Static data
○ User defined parameters
○ Well data
○ Dynamic data
Mohagegh (2018)
Numerical
simulation
Proxy
model
Misfit
Data analytics in monitoring
phase
Monitoring
DAS interrogator
FO cable
Observer well
CO2 injector
CO2 migration
in reservoir
FRACTURE
DAS record: No event
Green light: Safe to continue
Monitoring
DAS interrogator
FO cable
Observer well
CO2 injector
CO2 migration
in reservoir
FRACTURE
DAS record: Event detected
Yellow light: Reduce injection
EVENT
Monitoring
DAS interrogator
FO cable
Observer well
CO2 injector
CO2 migration
in reservoir
FRACTURE
Red light: Stop injection
EVENTS !!!
DAS record: Event detected
Hypocenter relocation with inverse modeling
Initial
location
(x, y, z, t0)
Velocity
model
Forward modeling
(ray tracing)
Calculated travel
time (tcal)
tobs-tcal
<<<
Minimize error
(optimization)
Update location
(x, y, z)
Observed
travel time
(tobs)
Final
location
(x, y, z)
Start
Finish
NO
YES
Convolutional Neural Network
Wamriew et al (2021)
● Training
○ Forward modeling to
generate 60,000 synthetic
DAS seismograms
○ Added with ambient noise
○ CNN learns the synthetic
data
● Prediction
○ Real DAS seismogram is
fed to CNN
○ Predict event hypocenter
locations (x, z)
Convolutional Neural Network
Wamriew et al (2021)
ResNet50 architecture
Convolutional Neural Network
Wamriew et al (2021)
Conclusion
● In site selection phase, Artificial Neural Network (ANN) helps predicting
kv-kh ratio from porosity and core sedimentary data
● In sequestration phase, Smart Proxy Model helps predicting CO2
saturation distribution that can cut lengthy simulation processes
● In monitoring phase, Convolutional Neural Network (CNN) could help
identifying microseismic events and predicting hypocenter recorded in
DAS cables
Thank you

Data Analytics in Carbon Capture and Storage

  • 1.
    DATA-DRIVEN ANALYTICS IN CARBONCAPTURE AND STORAGE Yohanes Nuwara KFUPM, 10 November 2021 1
  • 2.
    Outline ● Geological storageof CO2 ● Role of data analytics in the life of CCS ● Data analytics during site selection ● Data analytics during sequestration ● Data analytics during monitoring
  • 3.
    Geological Storage ofCO2 ● Viable solution for reducing GHG emission from carbon- intensive industries ● Many options of storage: ○ Deep saline aquifer ○ Depleted oil and gas reservoir ○ Igneous hard rock basement ● 3 important aspects of storage: ○ Capacity ○ Containment ○ Injectivity
  • 4.
    Examples of existingCCS facilities Sleipner CCS, North Sea Quest CCS, Canada CarbFix CCS, Iceland
  • 5.
    Role of Analyticsin the Life of CCS
  • 6.
    Data analytics insite selection phase
  • 7.
    What controls CO2distribution? ● CO2 distribution is controlled by the permeability anisotropy ● Permeability in vertical direction (kv) is different from horizontal (kh) ● Can be described by kv/kh (ratio of kv to kh) ● This determines efficiency of CO2 storage S = f(kv/kh) kv/kh >> kv/kh <<
  • 8.
    Knowing vertical-to-horizontal permeability ratio(kv/kh) is important to determine storage efficiency and finally to rank storage options
  • 9.
    kv/kh >>> STRUCTURAL TRAP ForCO2 stored in structural traps, kv/kh must be LARGE
  • 10.
    kv/kh <<< STRATIGRAPHIC TRAP ForCO2 stored in stratigraphic traps, kv/kh must be SMALL kv/kh <<<
  • 11.
    Unfortunately, there isnone exact formula that determines kv/kh from geological data. Instead, we can use data-driven approach to “PREDICT” kv/kh
  • 12.
    North Sea Fields ●Published by GeoProvider AS ● 1,240 documented well data ● Each records consists of: ○ Core porosity ○ Core permeability (kv and kh) ○ Core saturations ○ Sedimentary descriptions (roundness, sorting, structure, cementation) Courtesy MapStand
  • 13.
    Sedimentary controls onpermeability Very Well Sorted Well Sorted Moderately Sorted Poorly Sorted Very Poorly Sorted
  • 14.
  • 15.
  • 16.
    WHICH LOCATION ISTHE BEST? From depositional environment to kv/kh to storage efficiency A B C
  • 17.
  • 18.
  • 19.
    The use ofreservoir simulation NUMERICAL SIMULATION SURROGATE MODELING Method Finite difference, Finite element Neural network, Reinforcement learning Computation Takes days to finish one run Take seconds to finish one run Data Reservoir model Results of >10 simulation runs as training data Limitation Numerical error Inefficient optimization
  • 20.
    Smart Proxy Model ●Case study in Otway Basin, Australia ● Spatio-temporal database was developed from multiple runs consisting of: ○ Static data ○ User defined parameters ○ Well data ○ Dynamic data Mohagegh (2018) Numerical simulation Proxy model Misfit
  • 21.
    Data analytics inmonitoring phase
  • 22.
    Monitoring DAS interrogator FO cable Observerwell CO2 injector CO2 migration in reservoir FRACTURE DAS record: No event Green light: Safe to continue
  • 23.
    Monitoring DAS interrogator FO cable Observerwell CO2 injector CO2 migration in reservoir FRACTURE DAS record: Event detected Yellow light: Reduce injection EVENT
  • 24.
    Monitoring DAS interrogator FO cable Observerwell CO2 injector CO2 migration in reservoir FRACTURE Red light: Stop injection EVENTS !!! DAS record: Event detected
  • 25.
    Hypocenter relocation withinverse modeling Initial location (x, y, z, t0) Velocity model Forward modeling (ray tracing) Calculated travel time (tcal) tobs-tcal <<< Minimize error (optimization) Update location (x, y, z) Observed travel time (tobs) Final location (x, y, z) Start Finish NO YES
  • 26.
    Convolutional Neural Network Wamriewet al (2021) ● Training ○ Forward modeling to generate 60,000 synthetic DAS seismograms ○ Added with ambient noise ○ CNN learns the synthetic data ● Prediction ○ Real DAS seismogram is fed to CNN ○ Predict event hypocenter locations (x, z)
  • 27.
    Convolutional Neural Network Wamriewet al (2021) ResNet50 architecture
  • 28.
  • 29.
    Conclusion ● In siteselection phase, Artificial Neural Network (ANN) helps predicting kv-kh ratio from porosity and core sedimentary data ● In sequestration phase, Smart Proxy Model helps predicting CO2 saturation distribution that can cut lengthy simulation processes ● In monitoring phase, Convolutional Neural Network (CNN) could help identifying microseismic events and predicting hypocenter recorded in DAS cables
  • 30.