Download to read offline
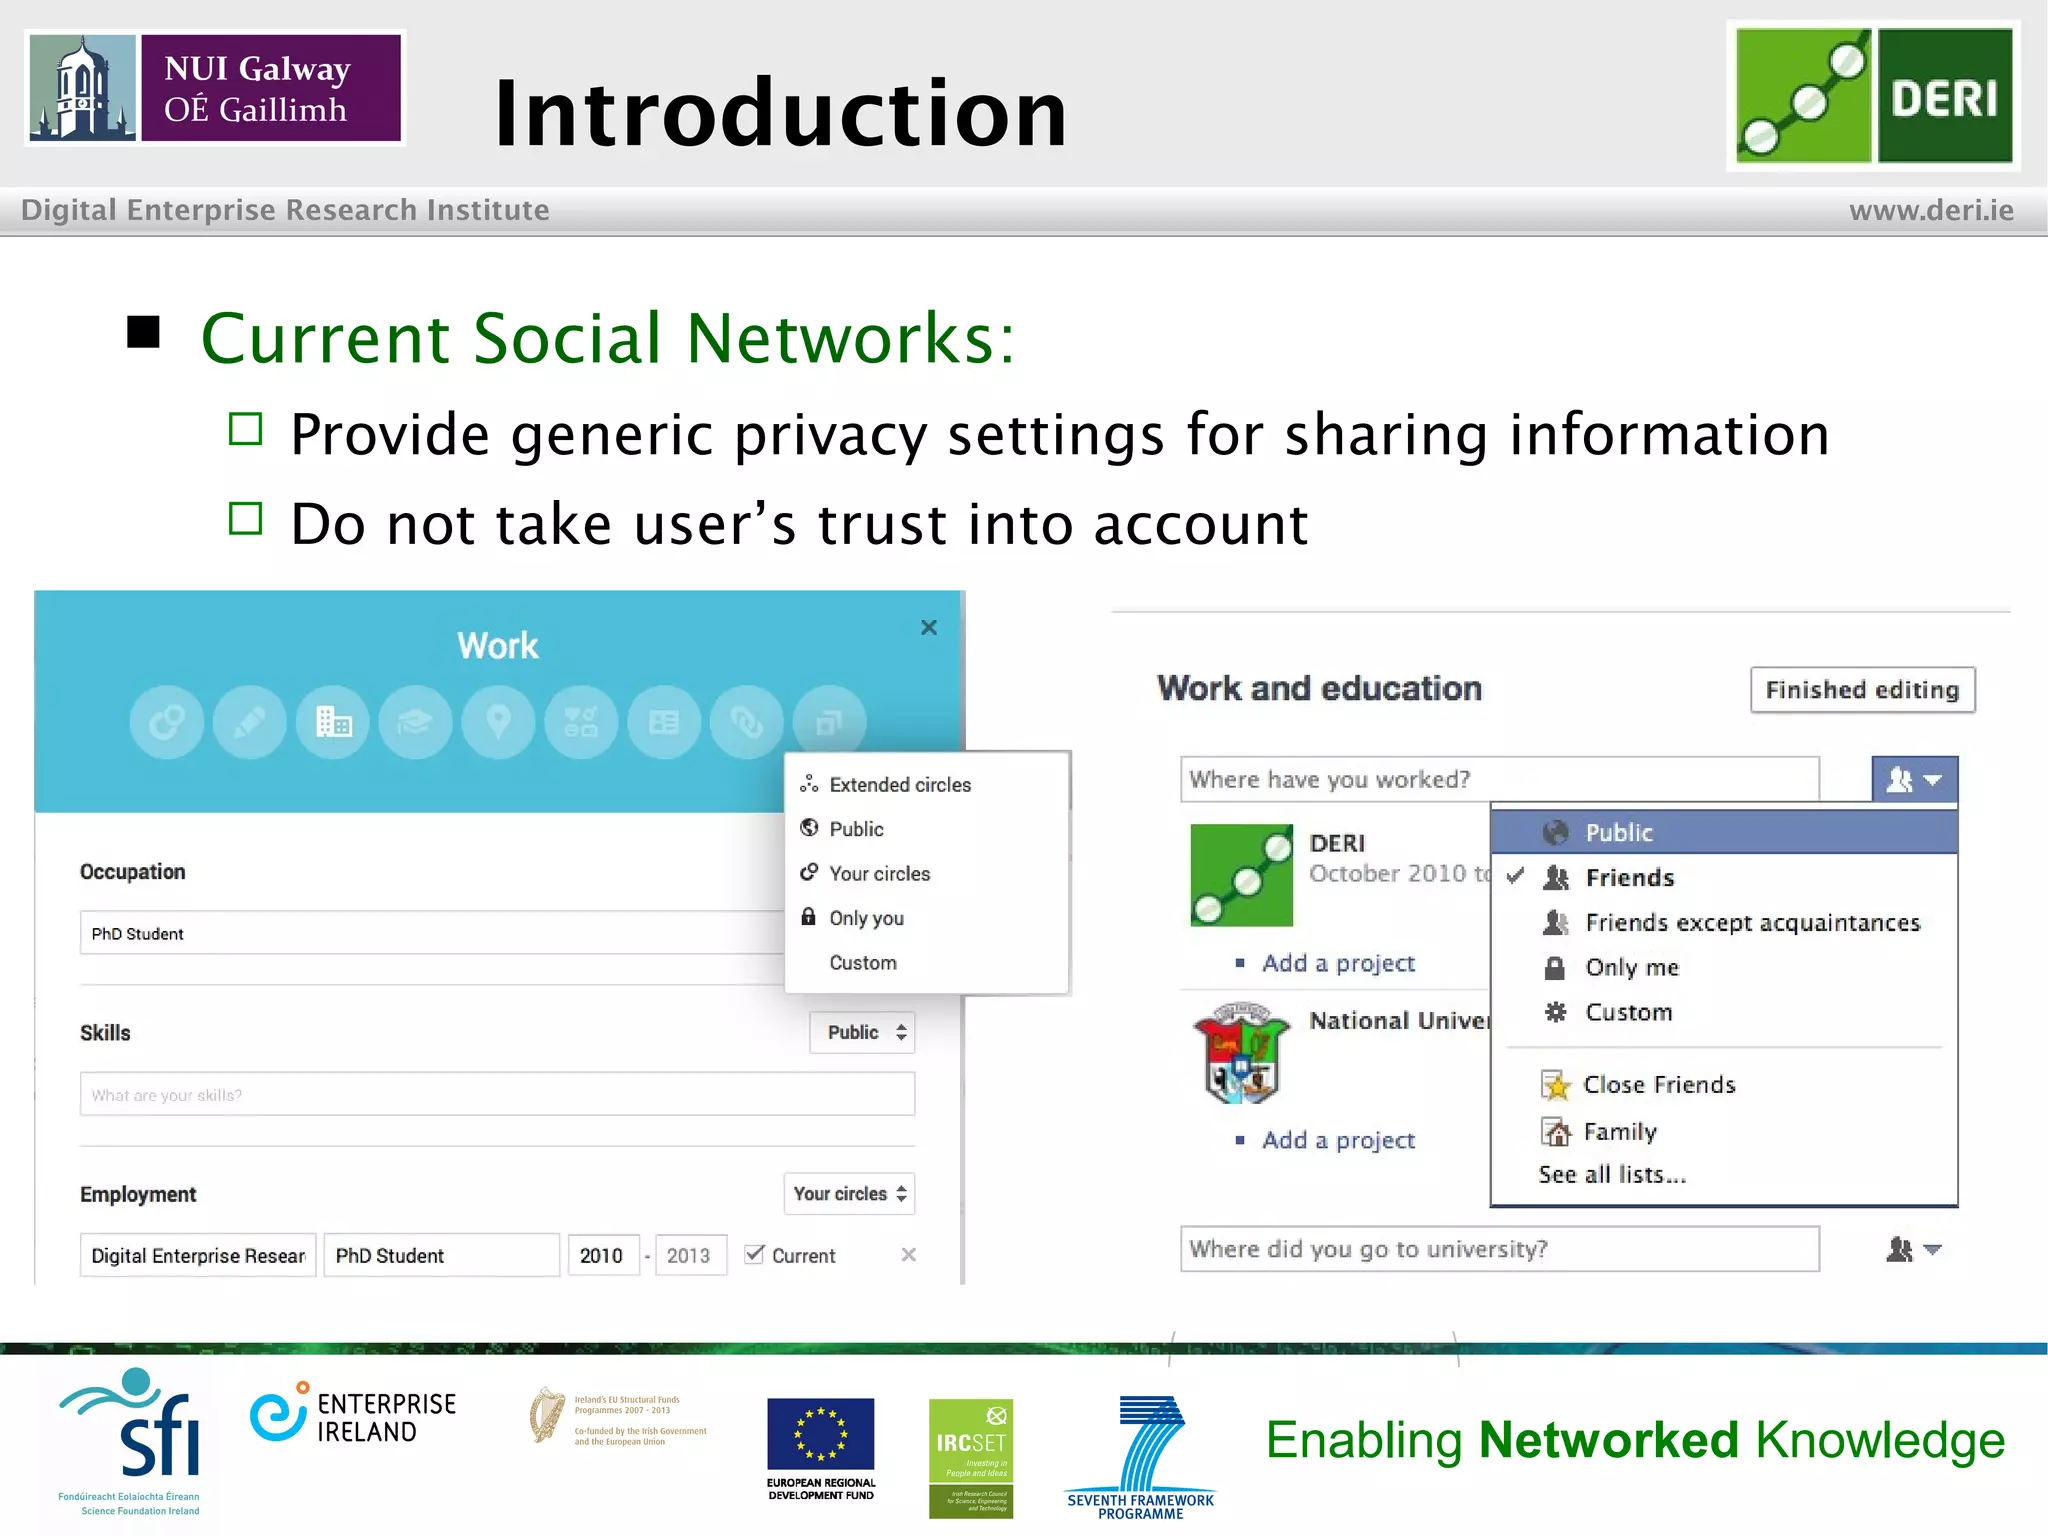
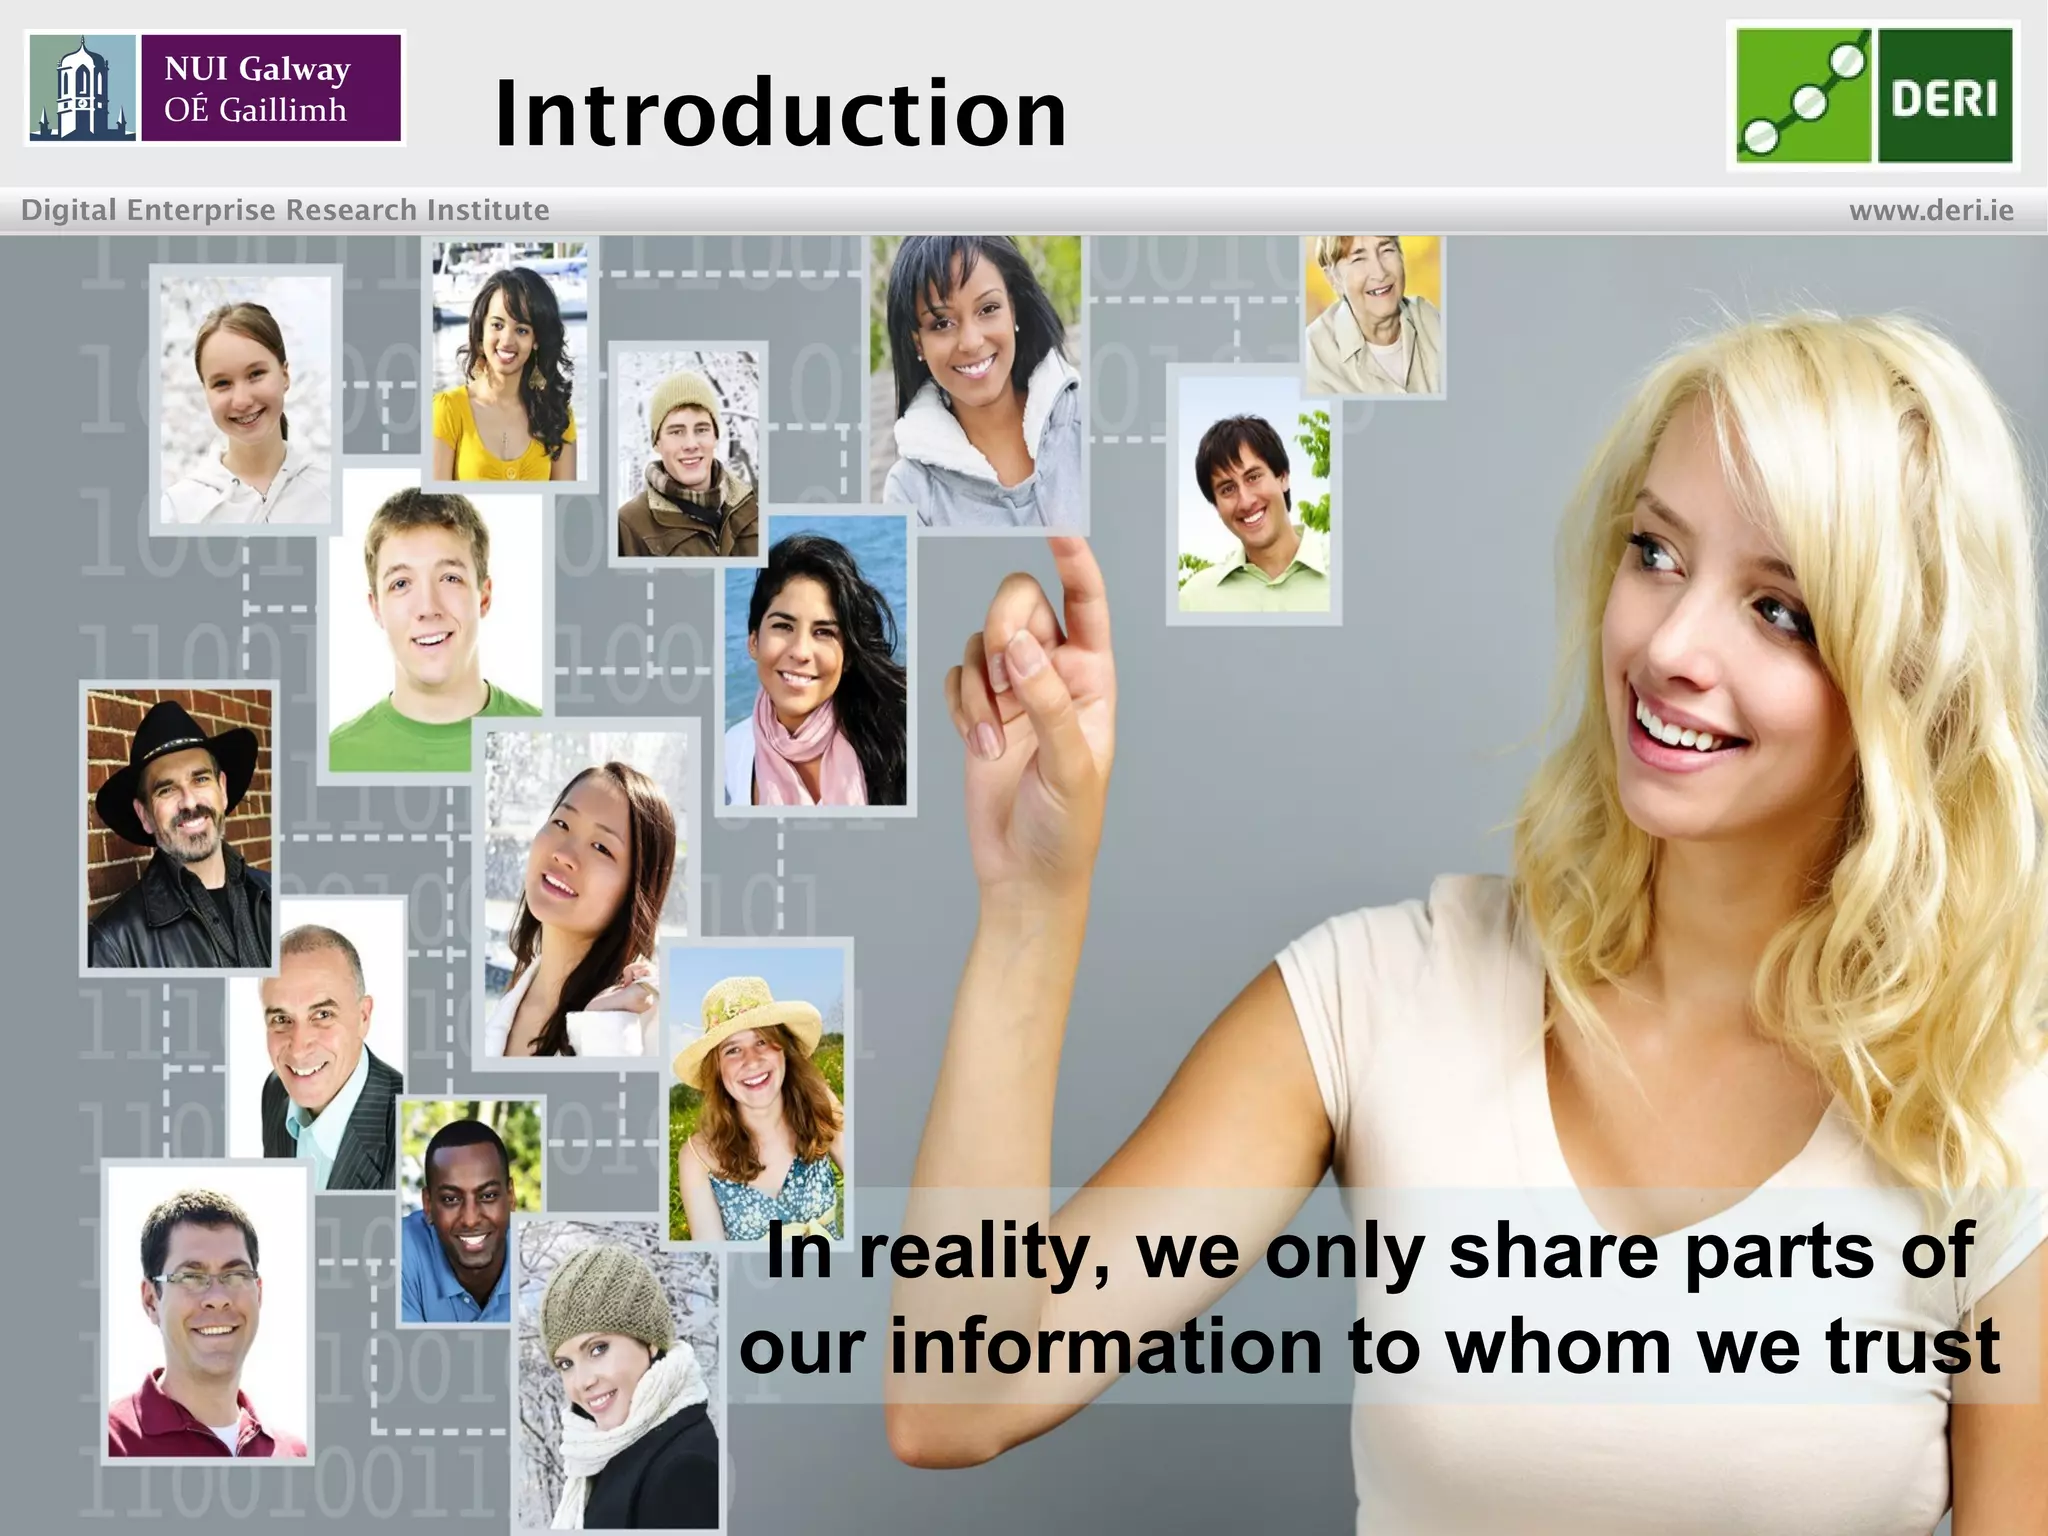
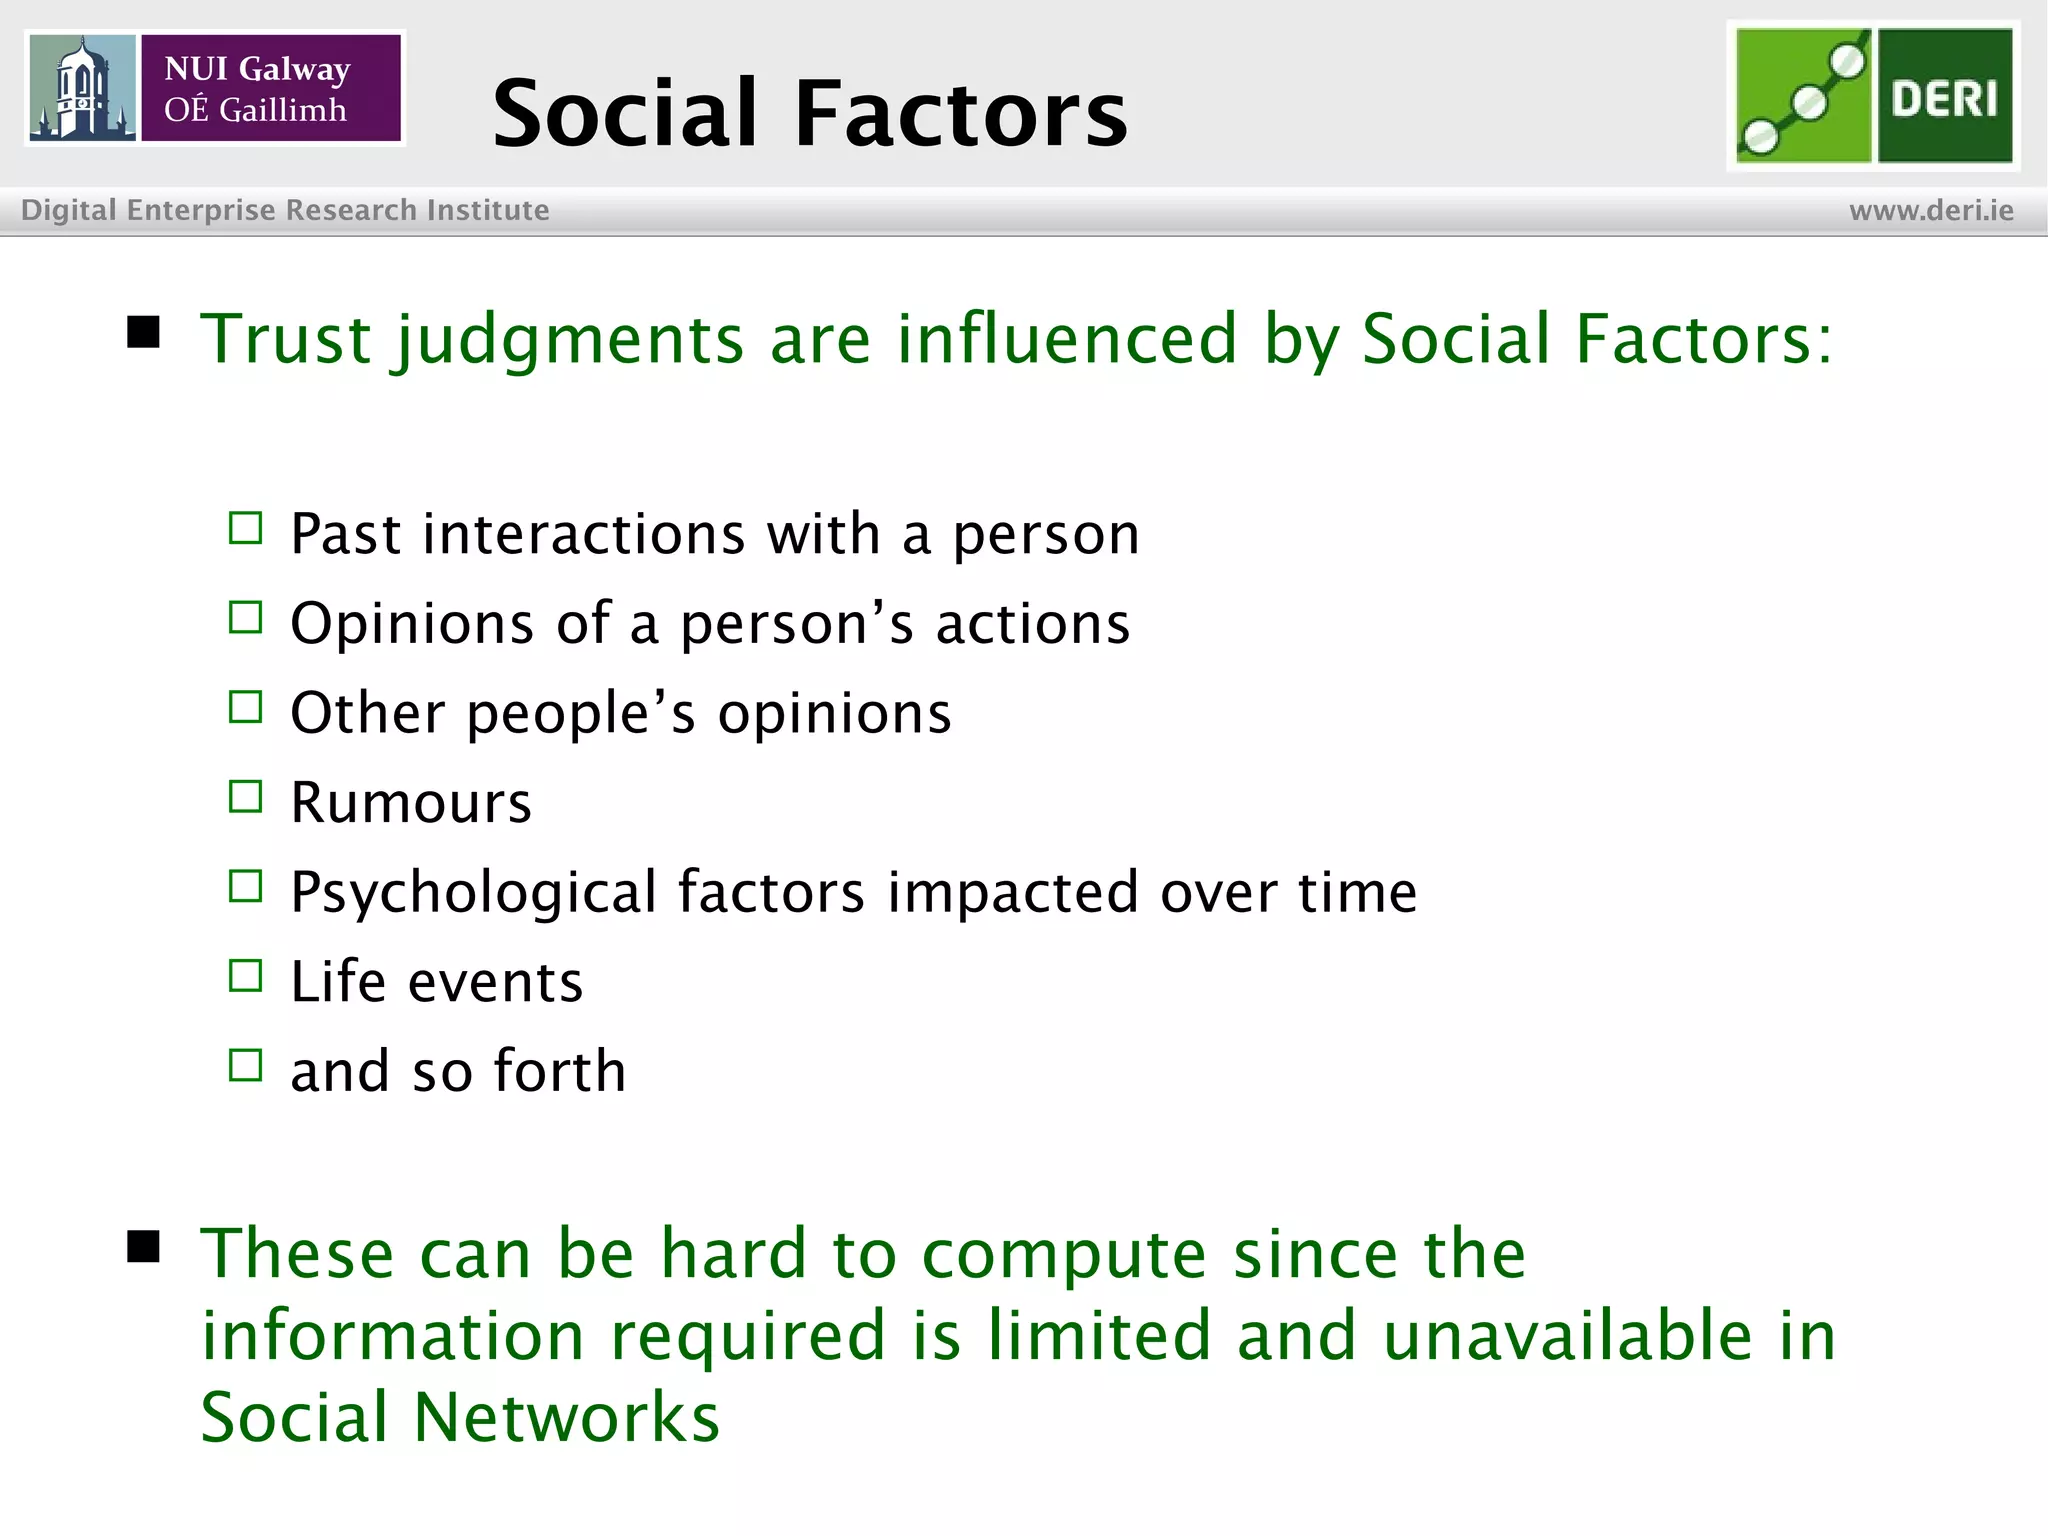
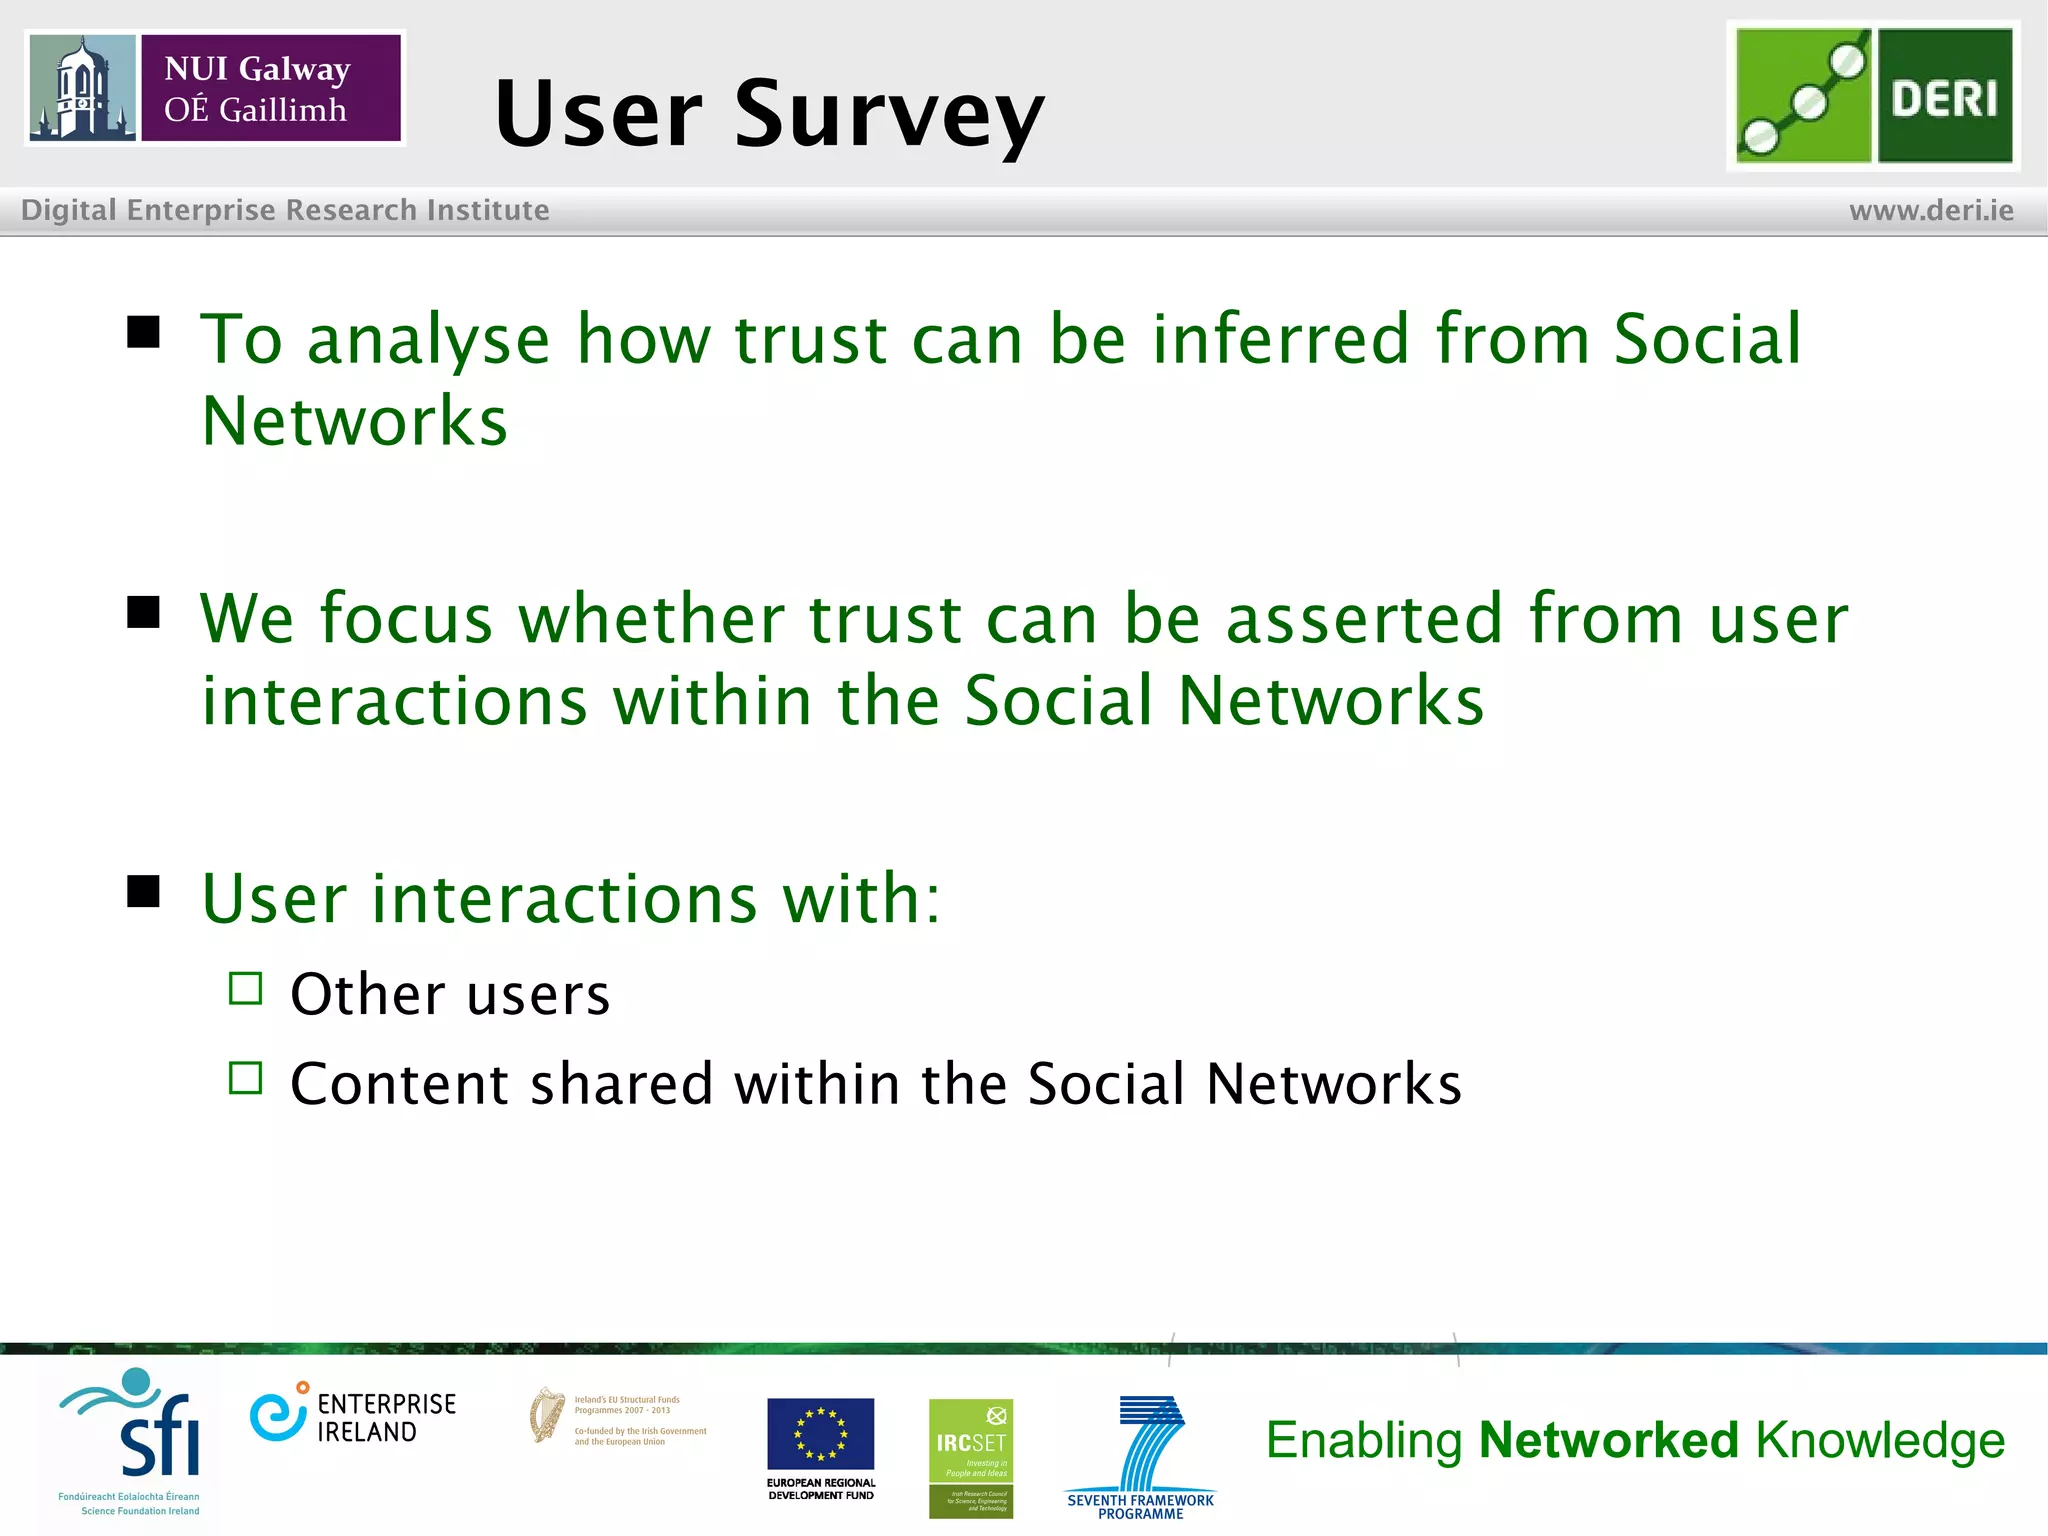
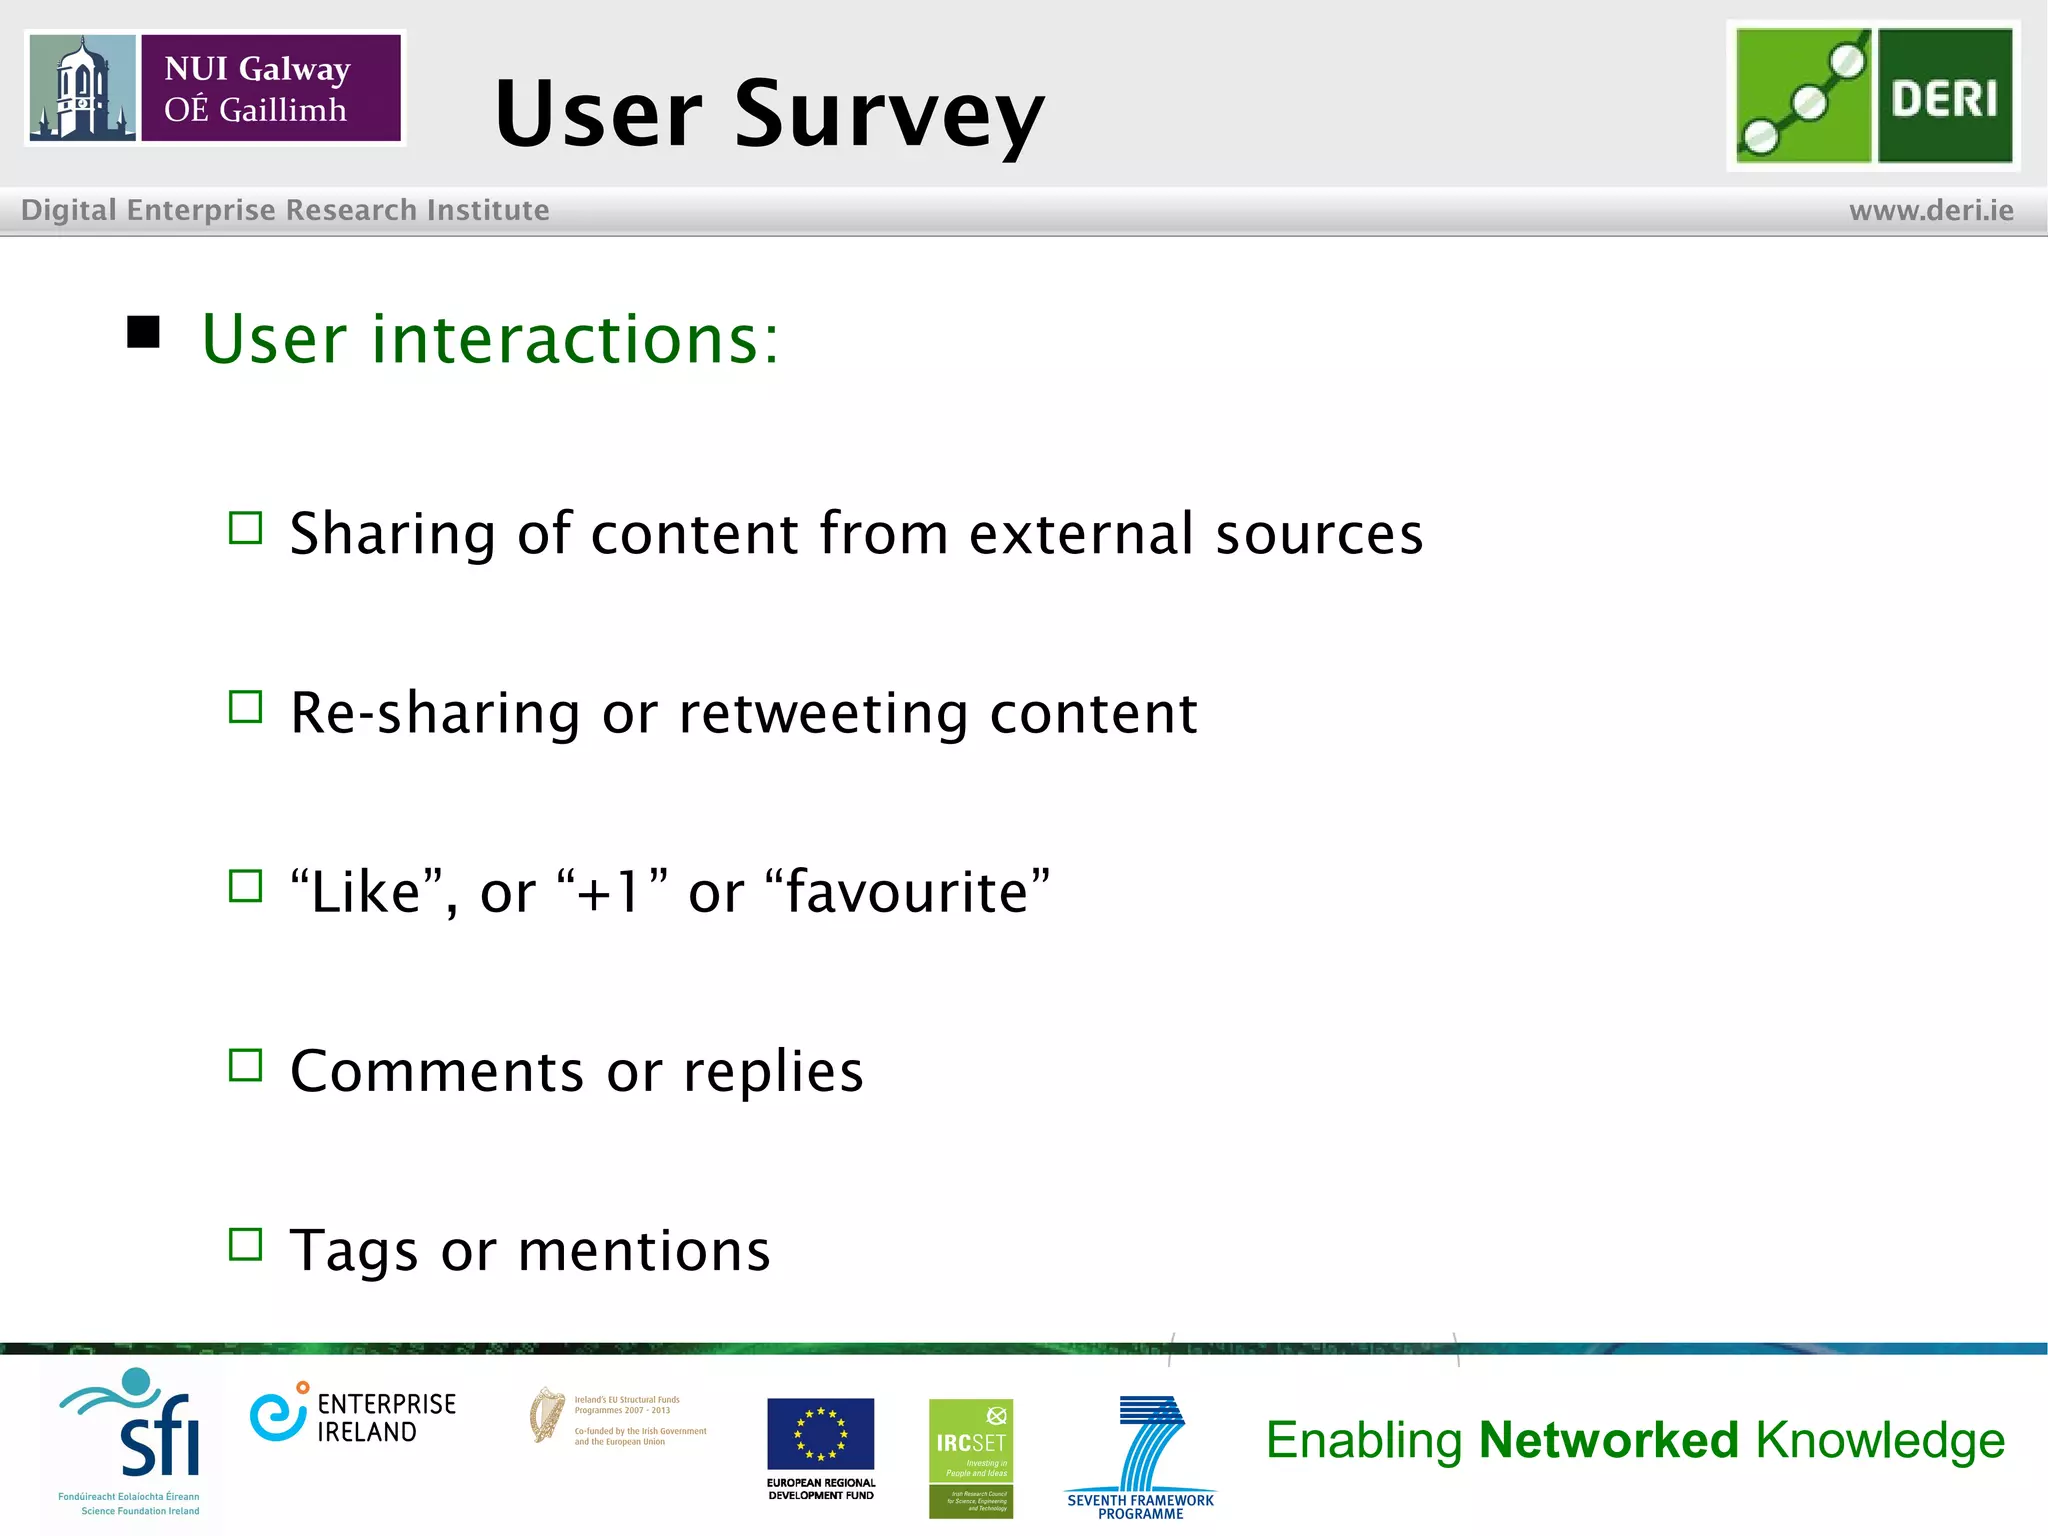
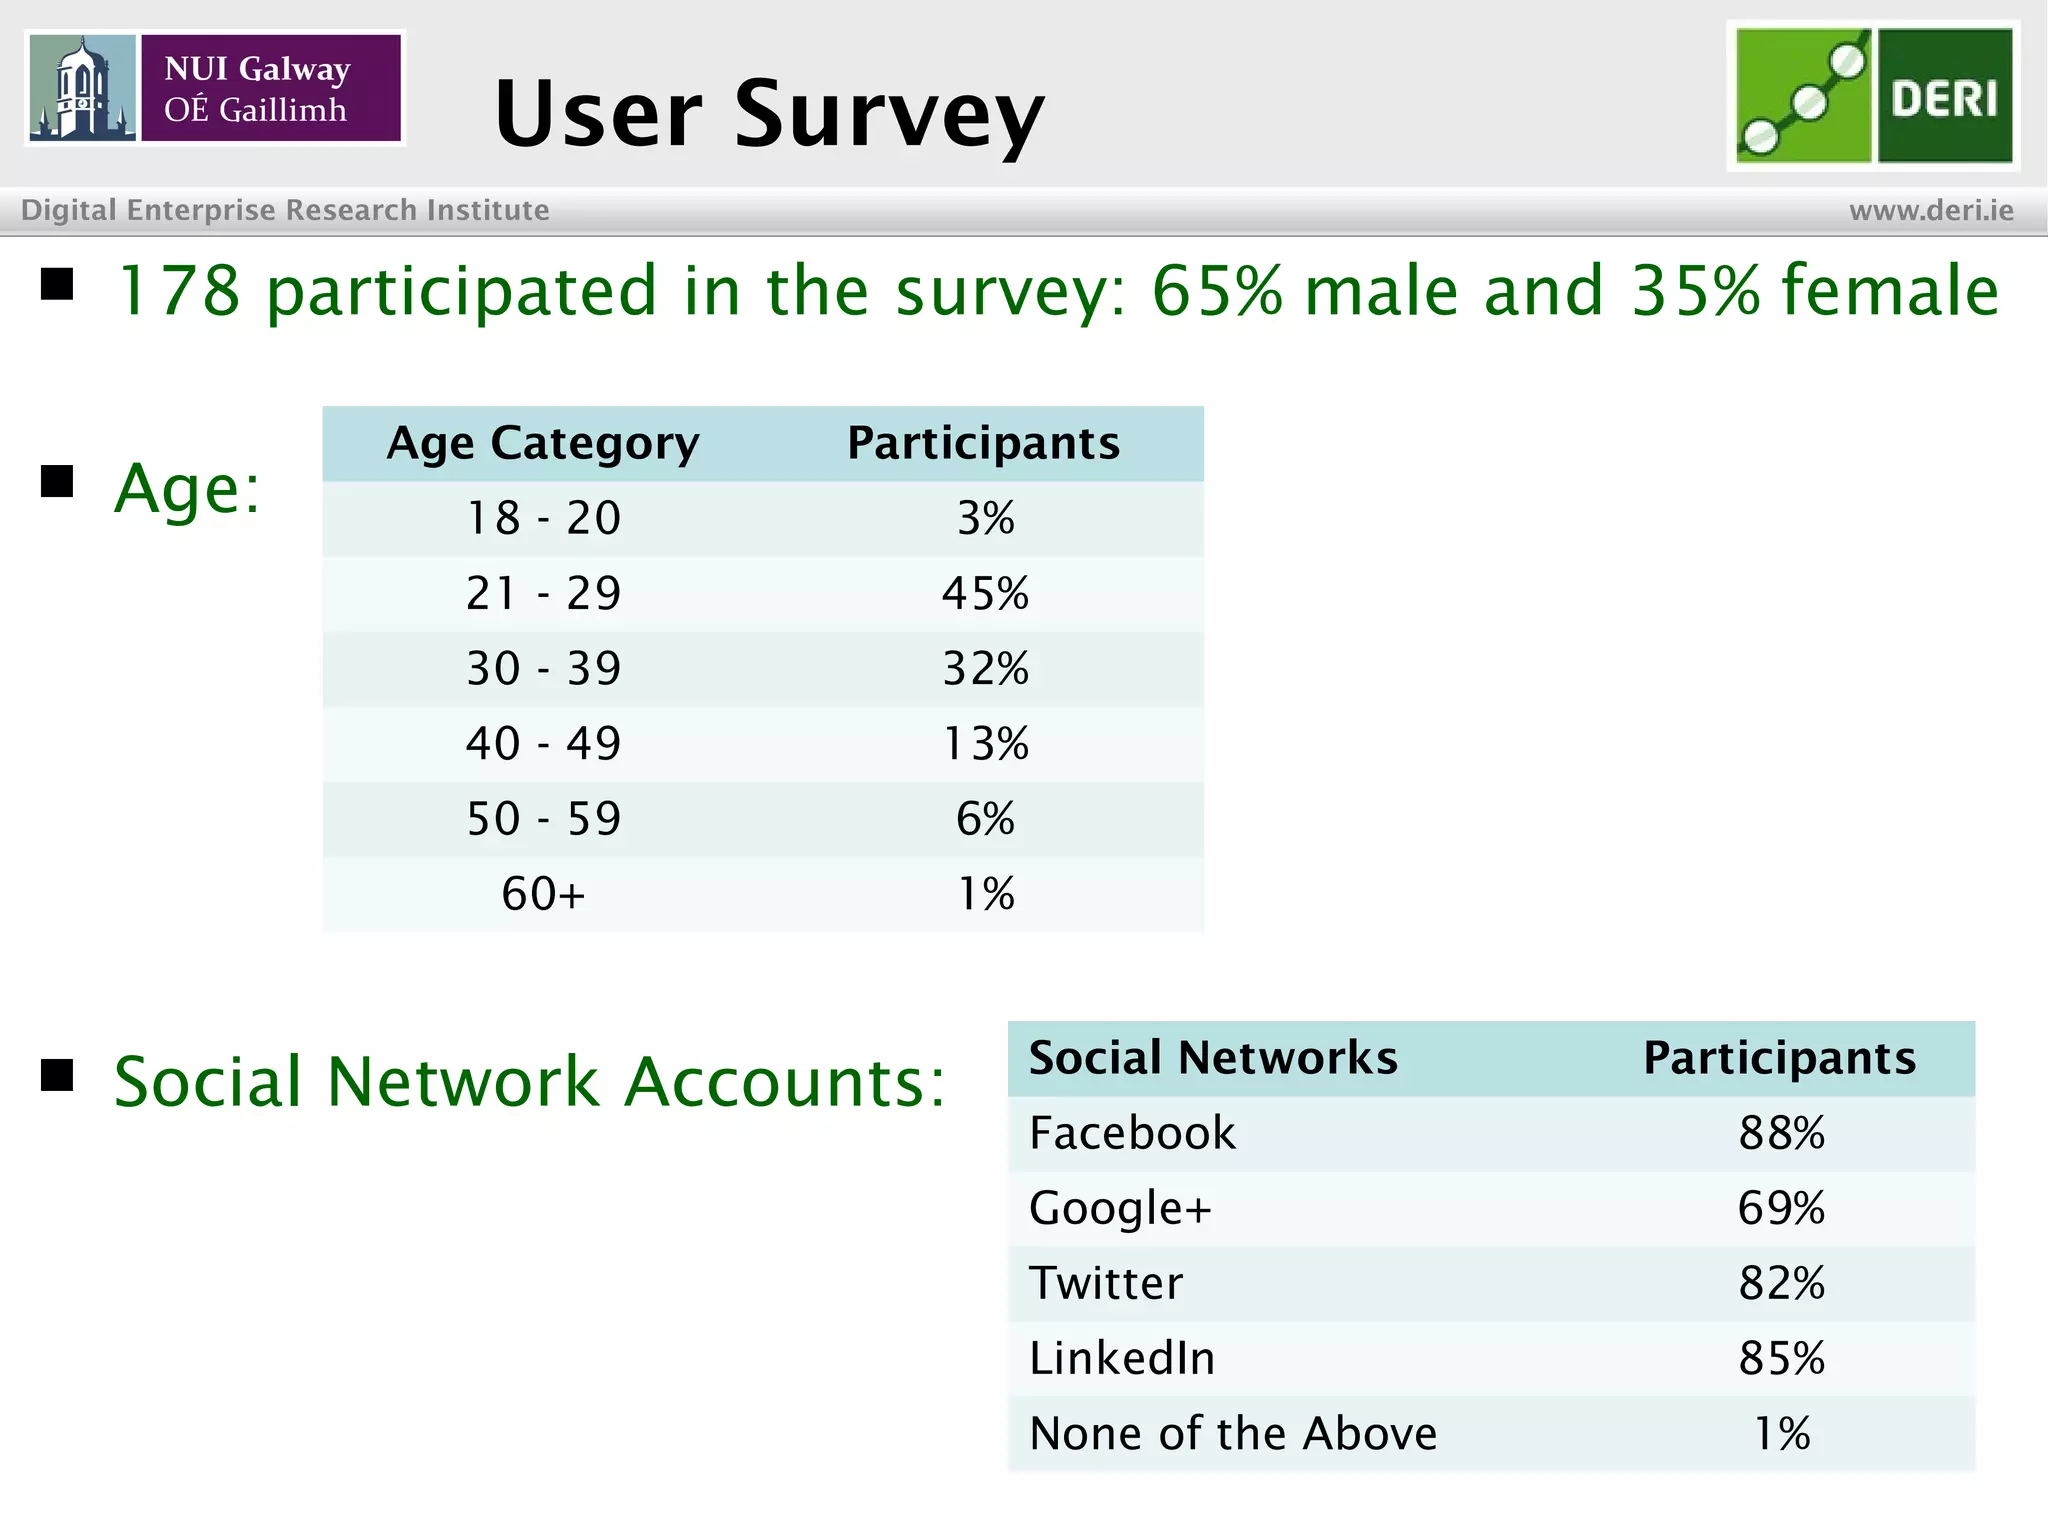
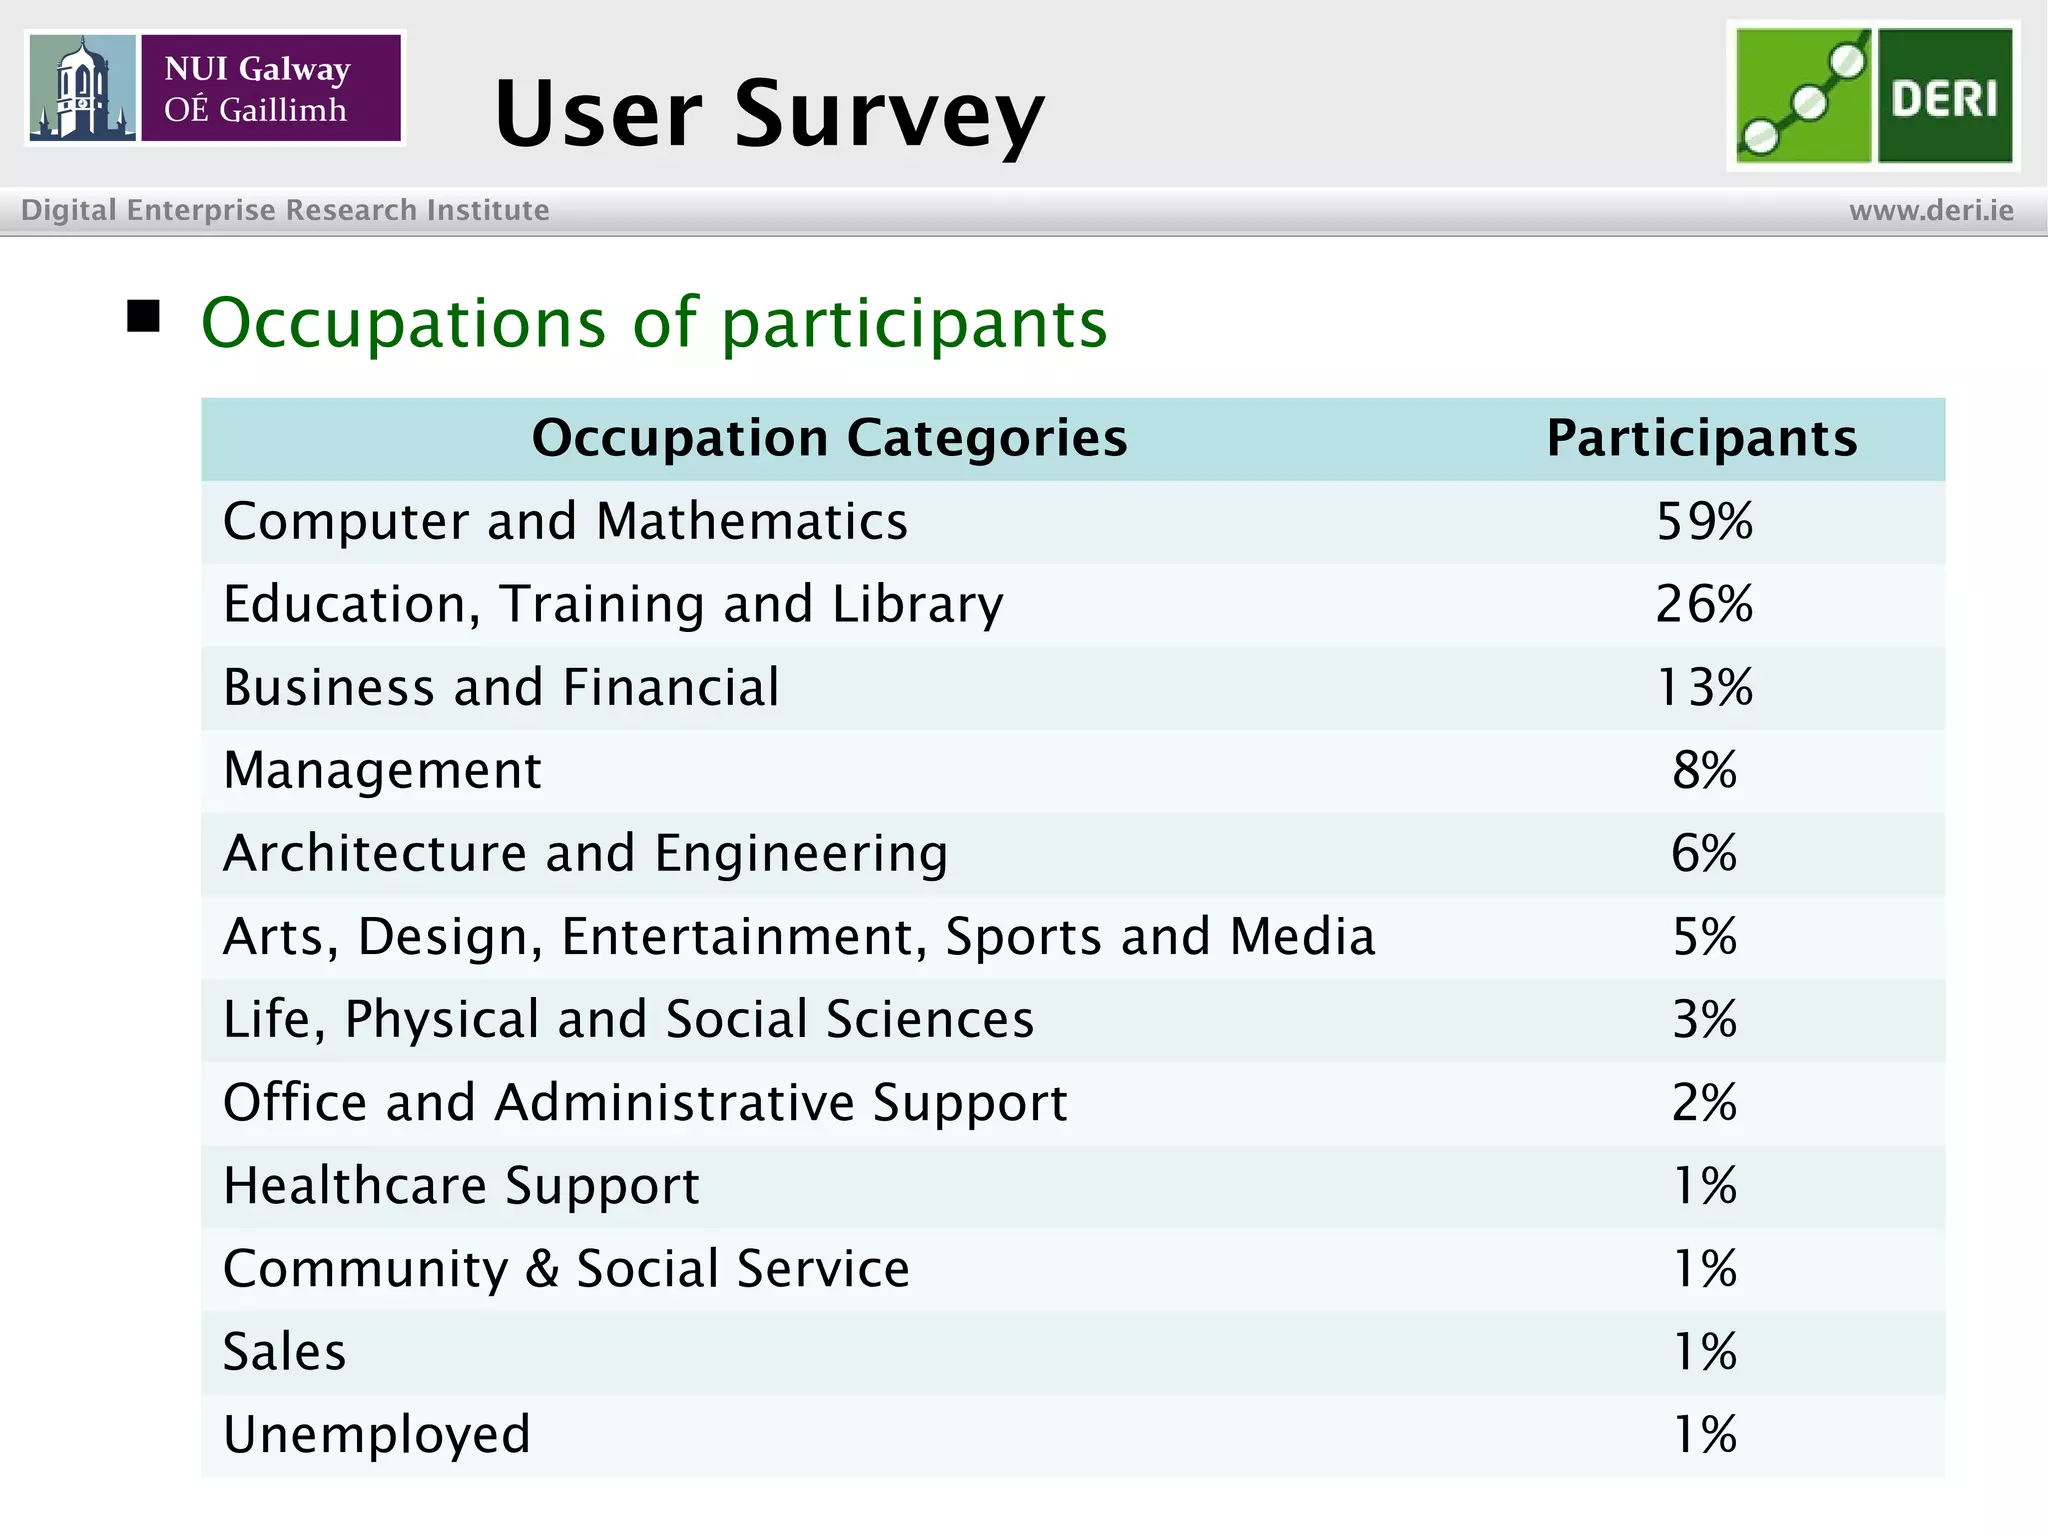
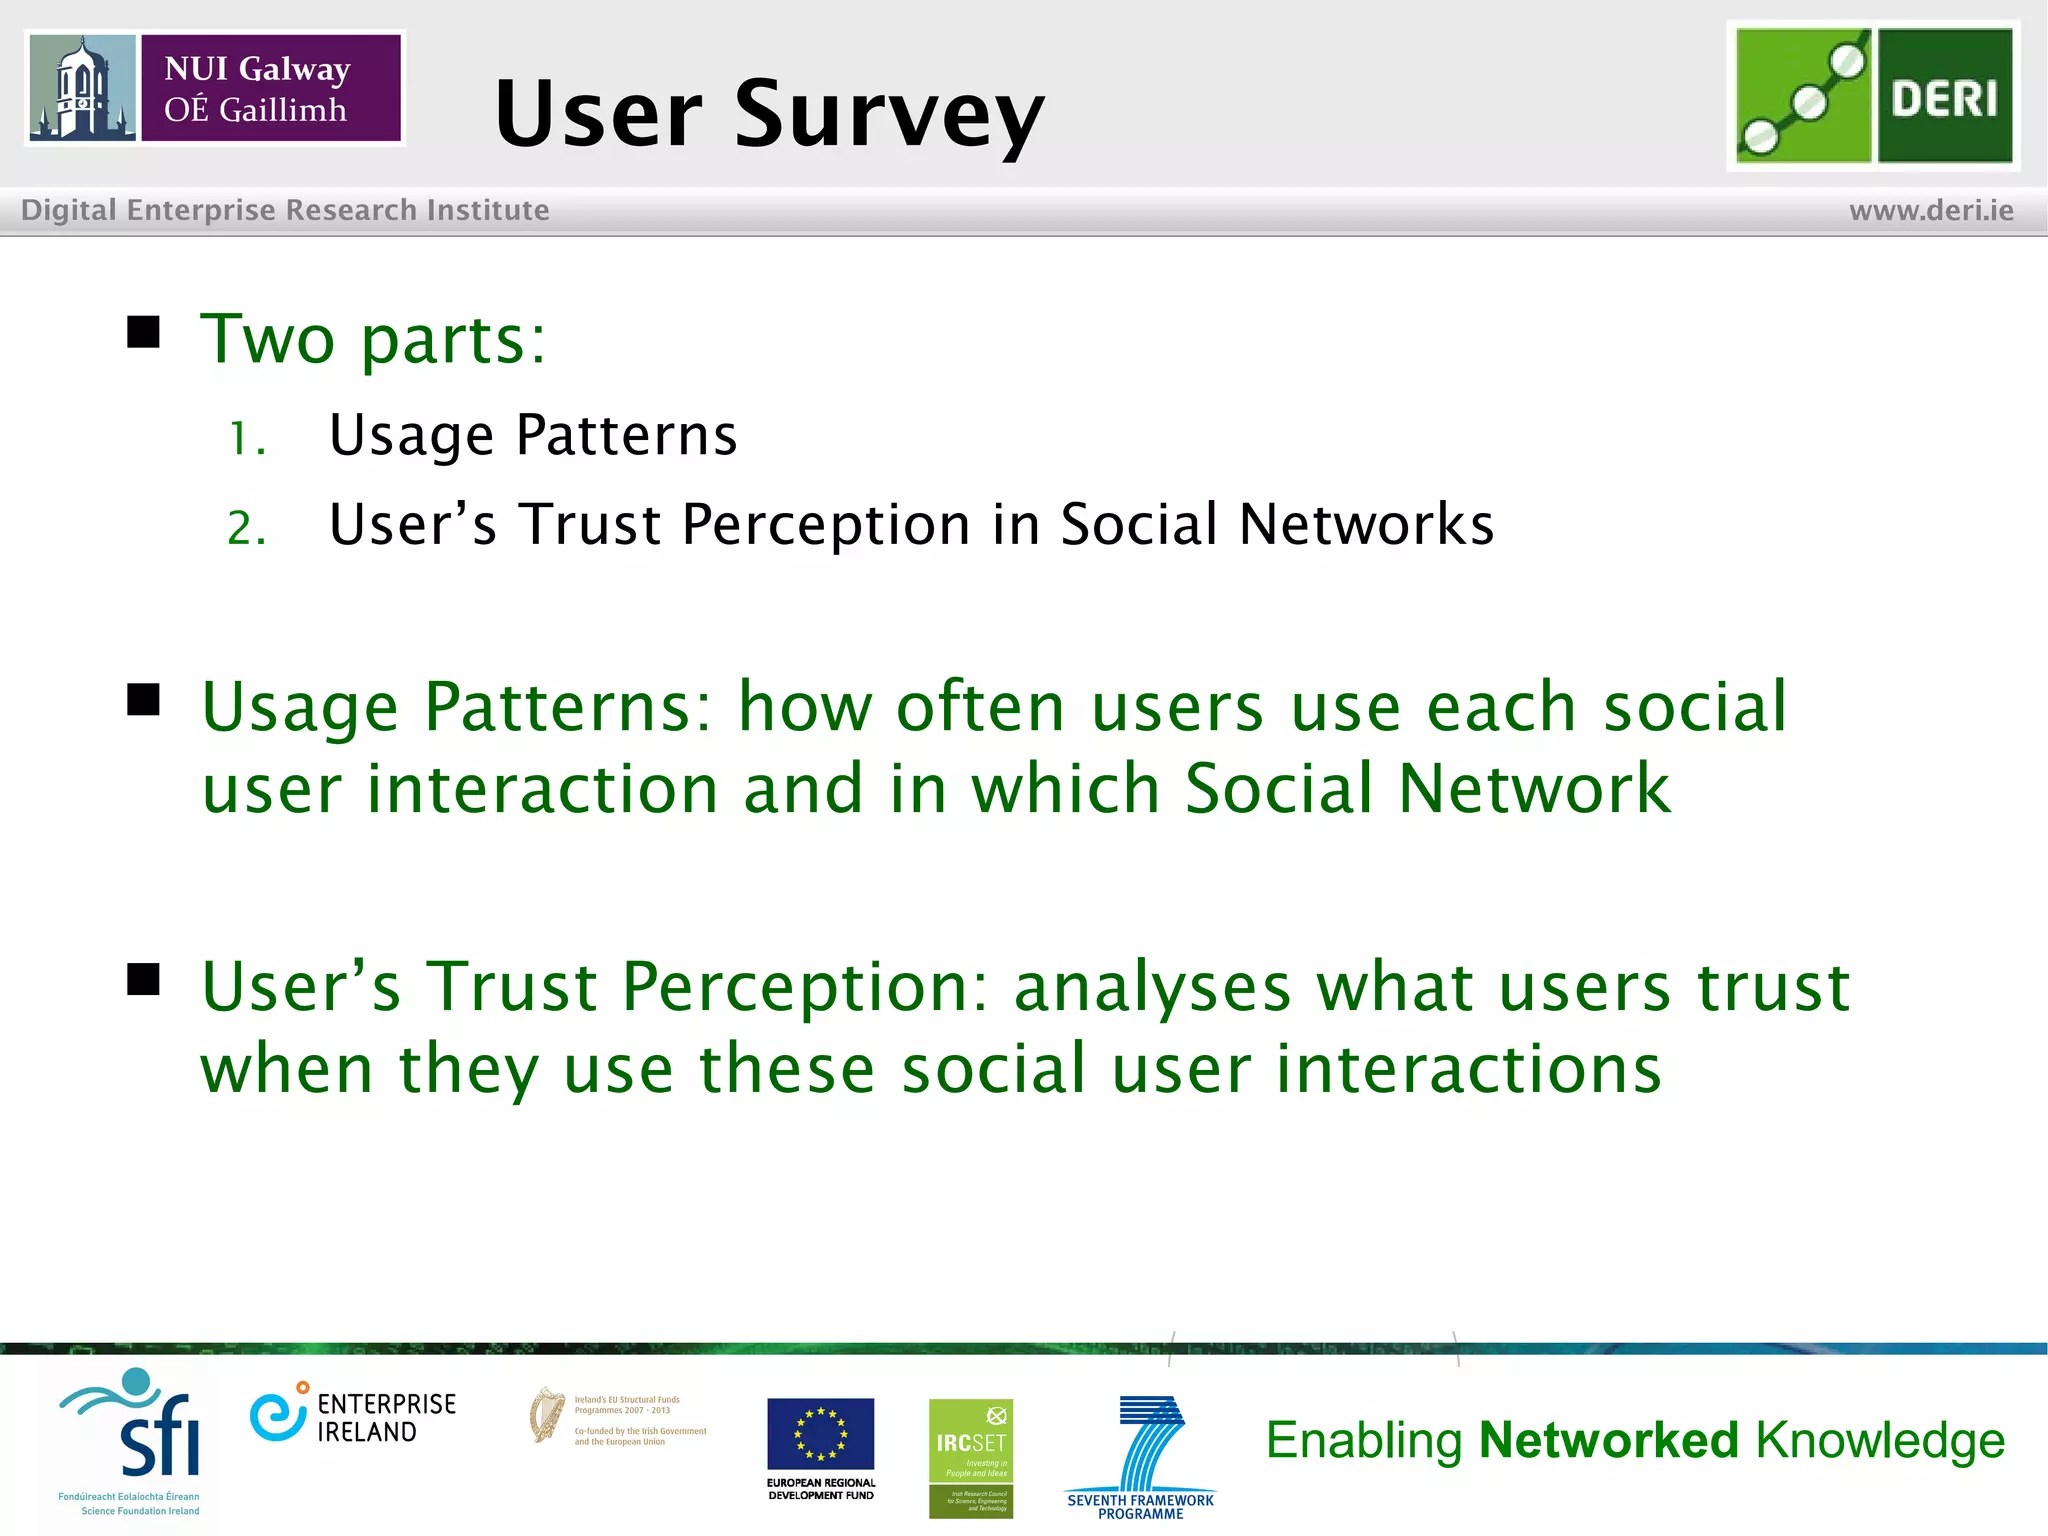
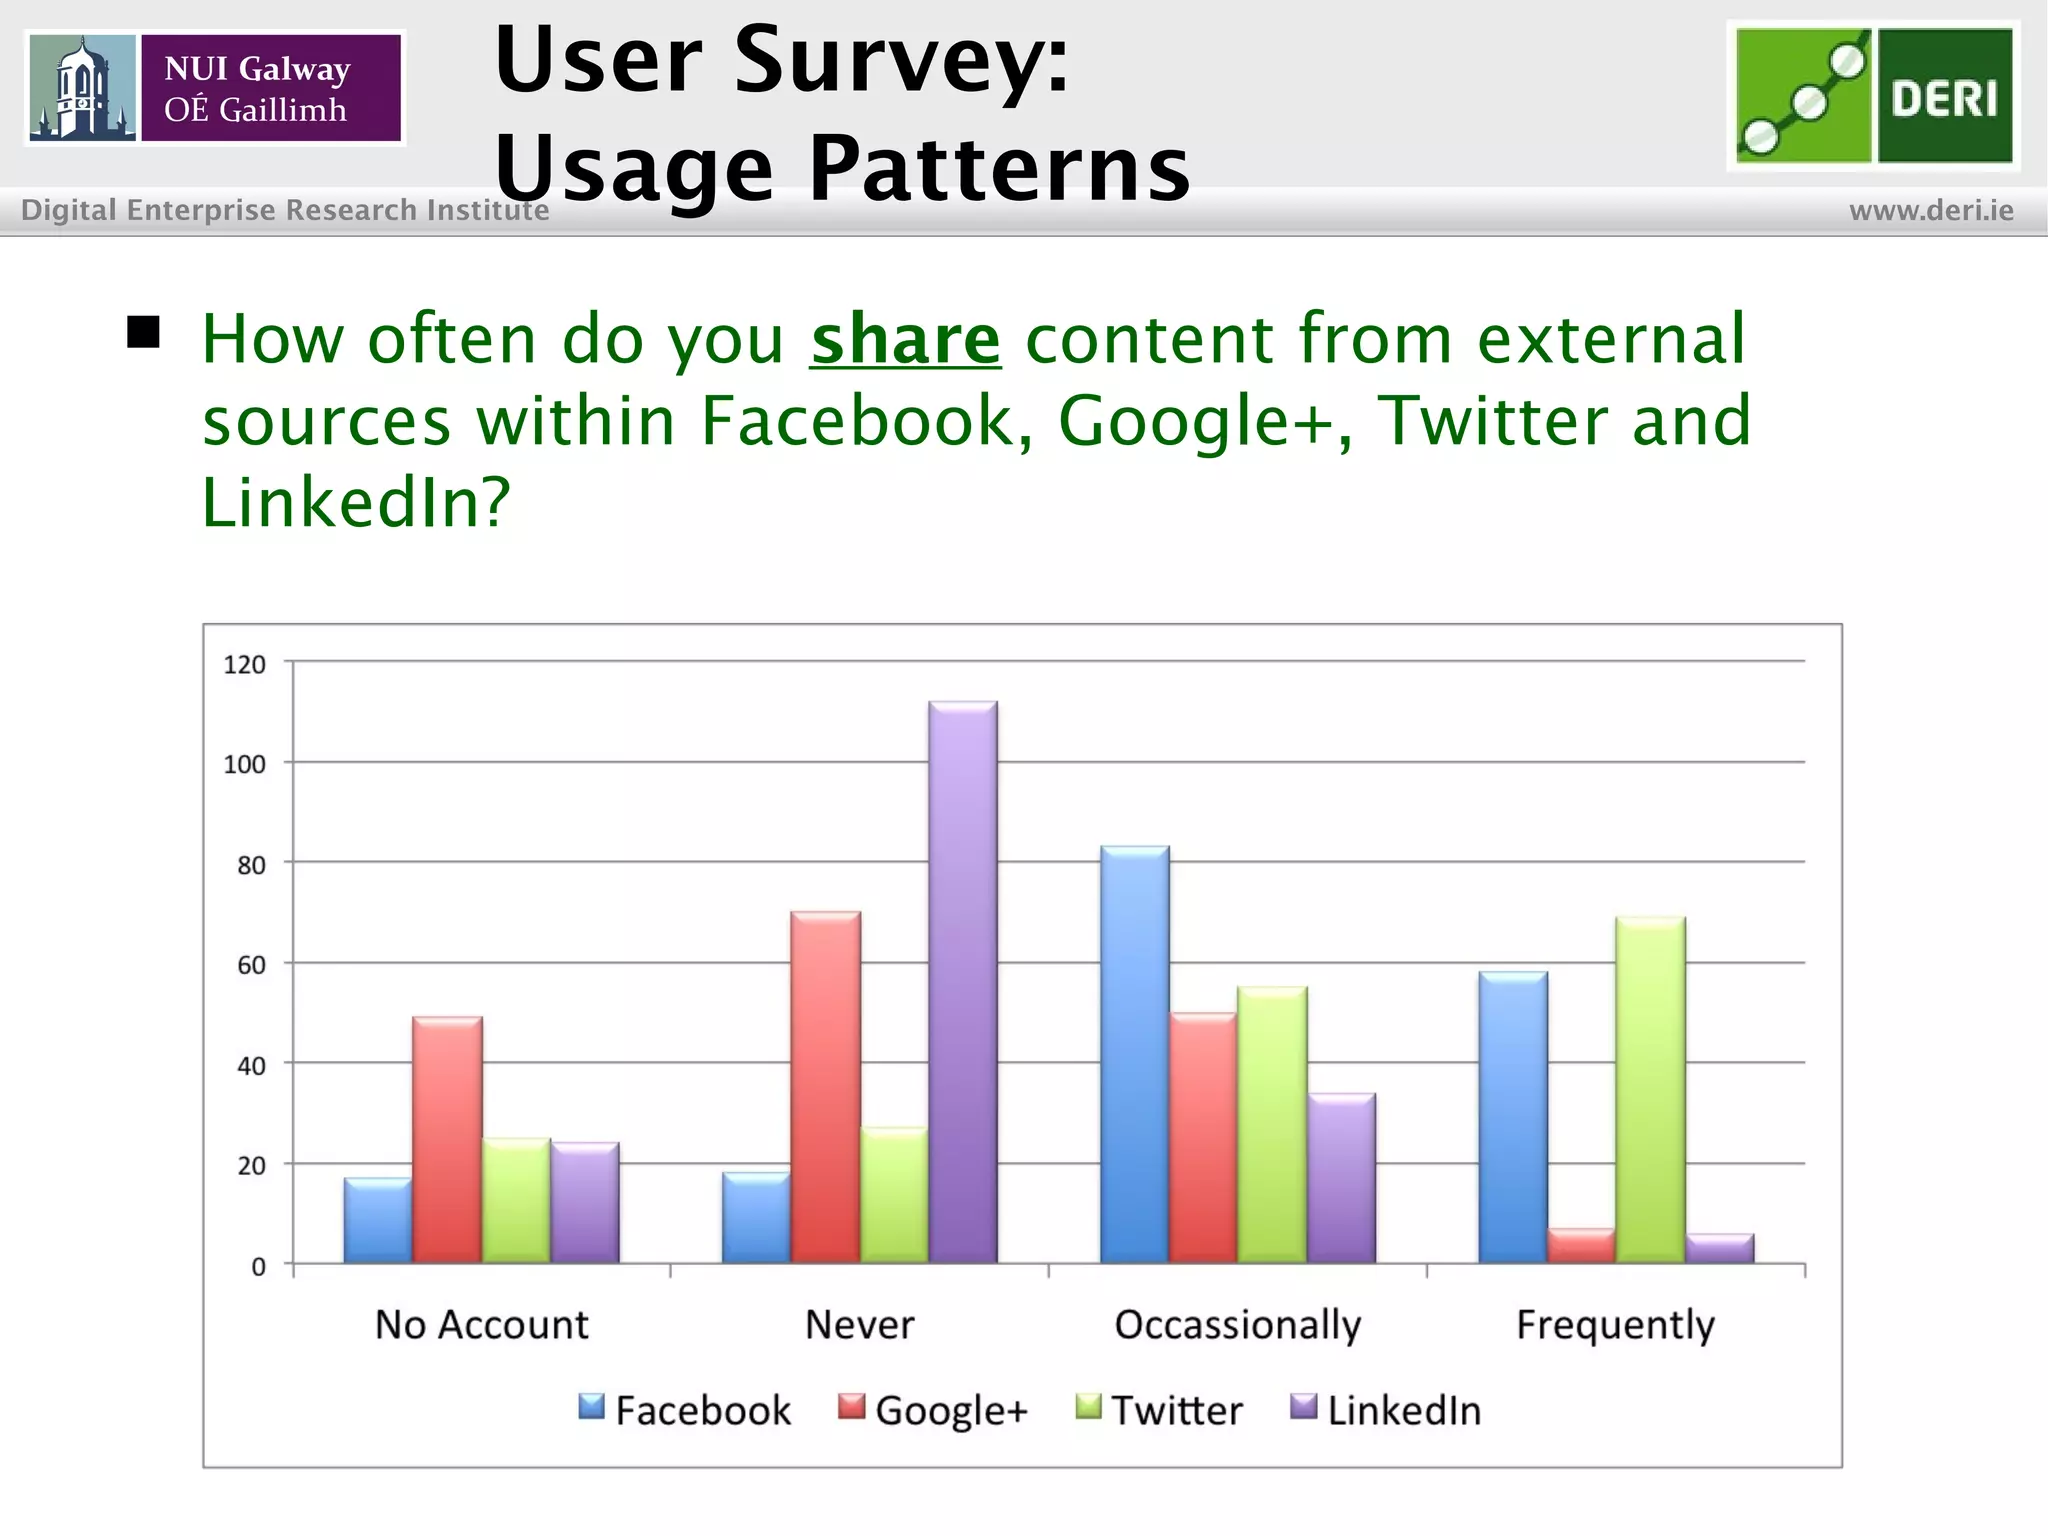
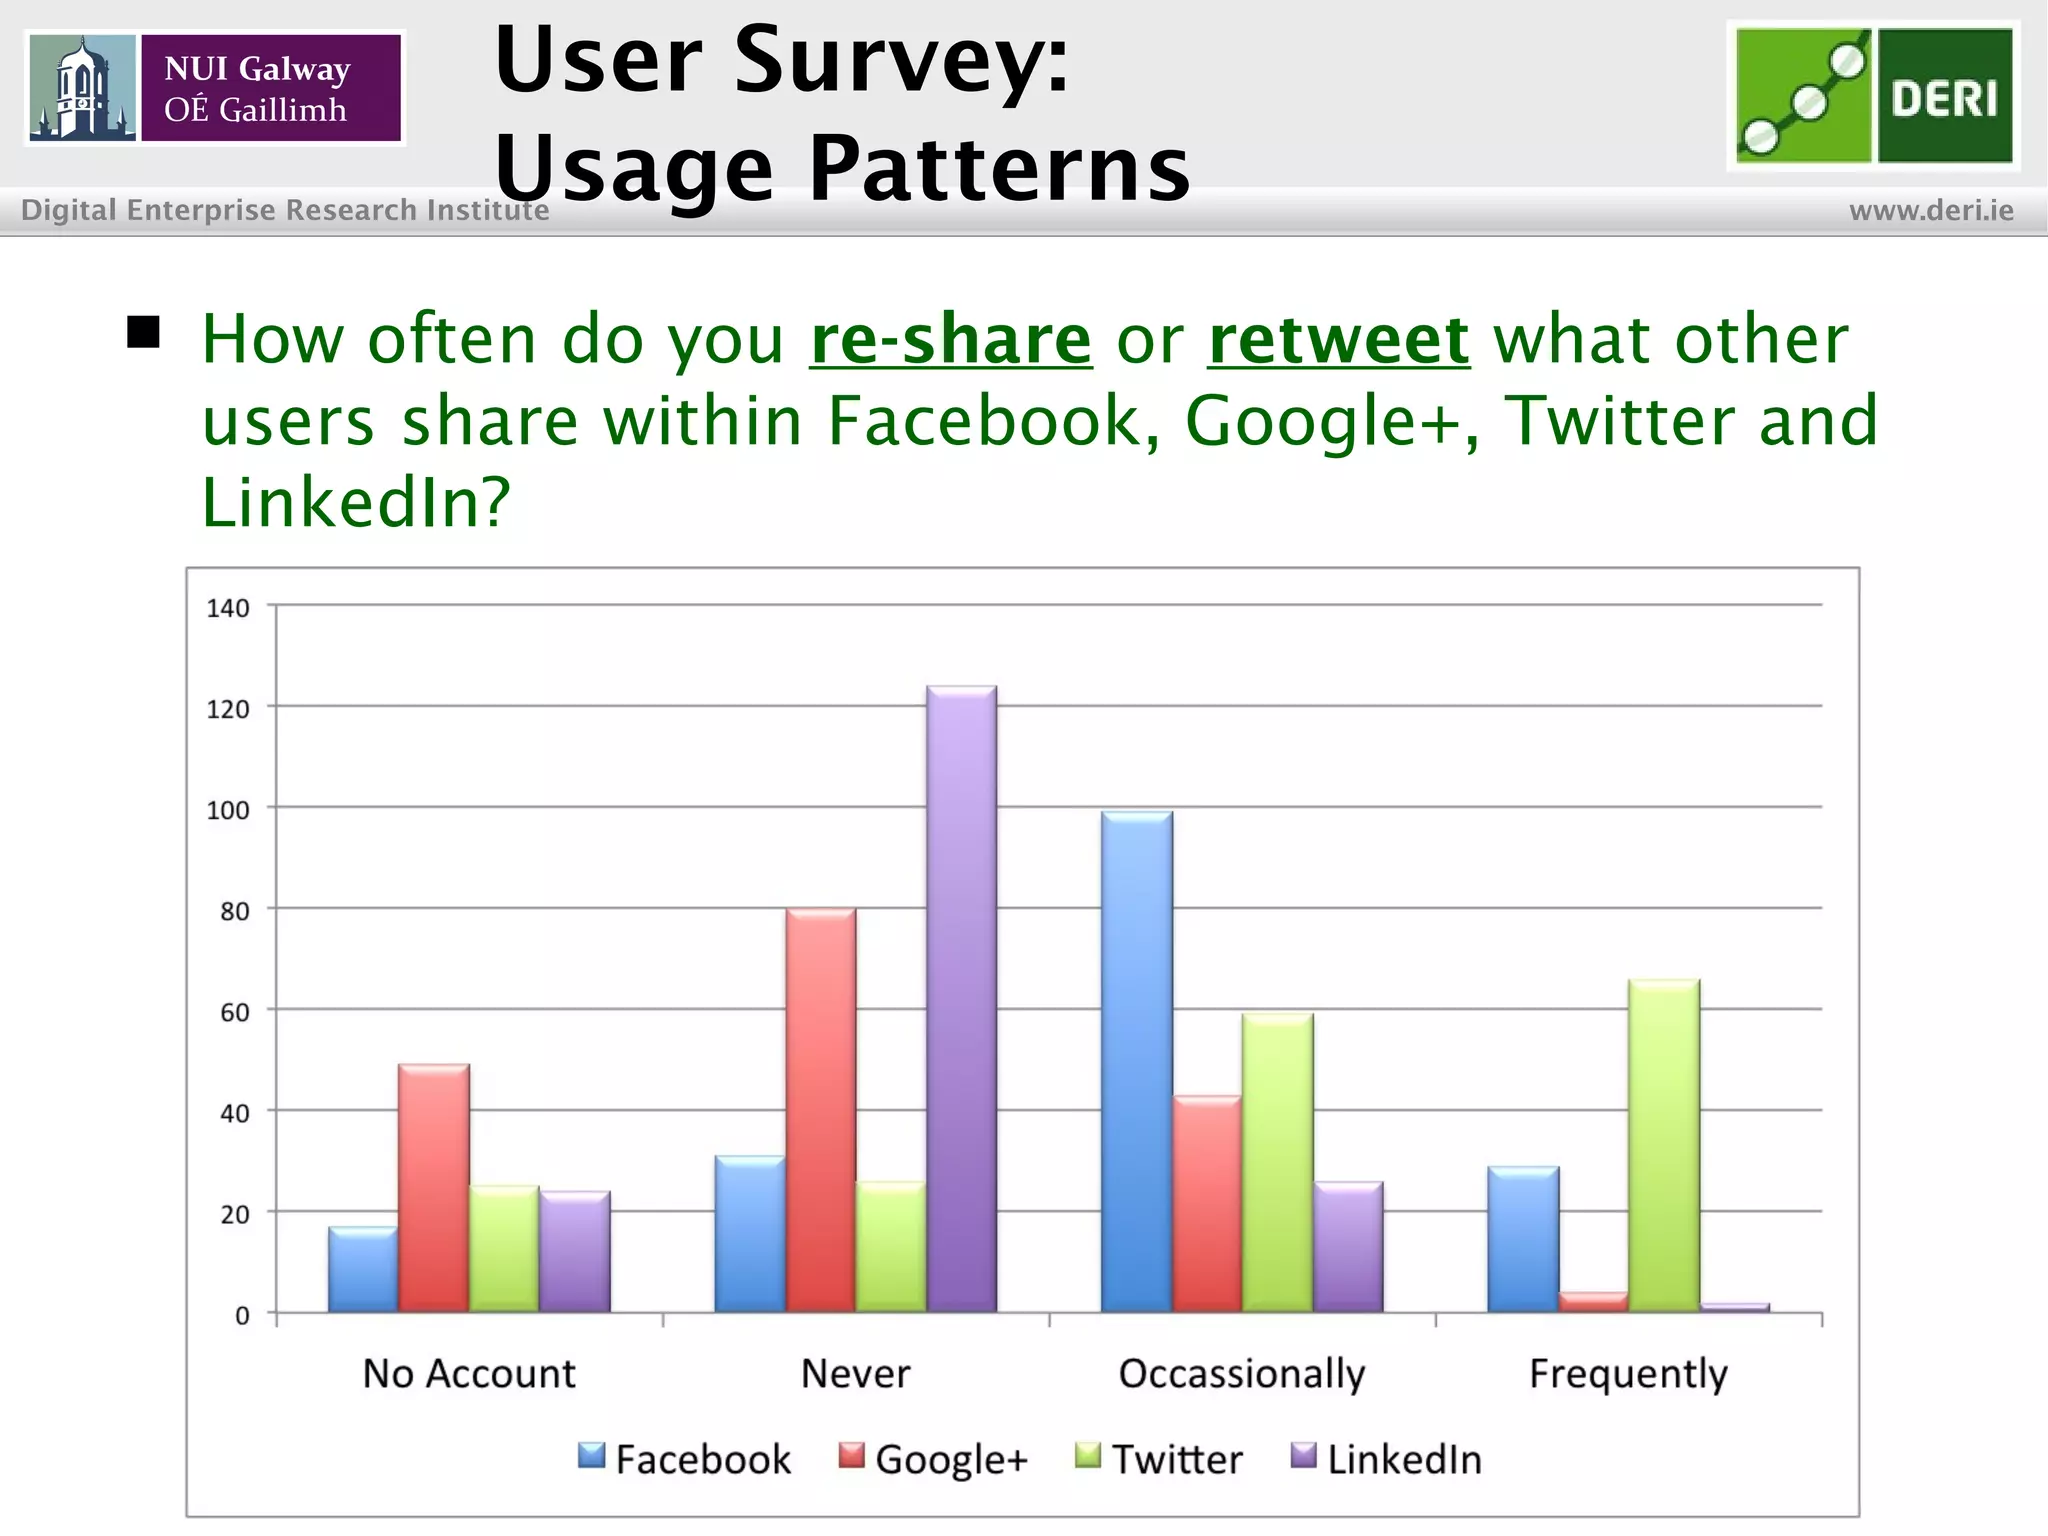
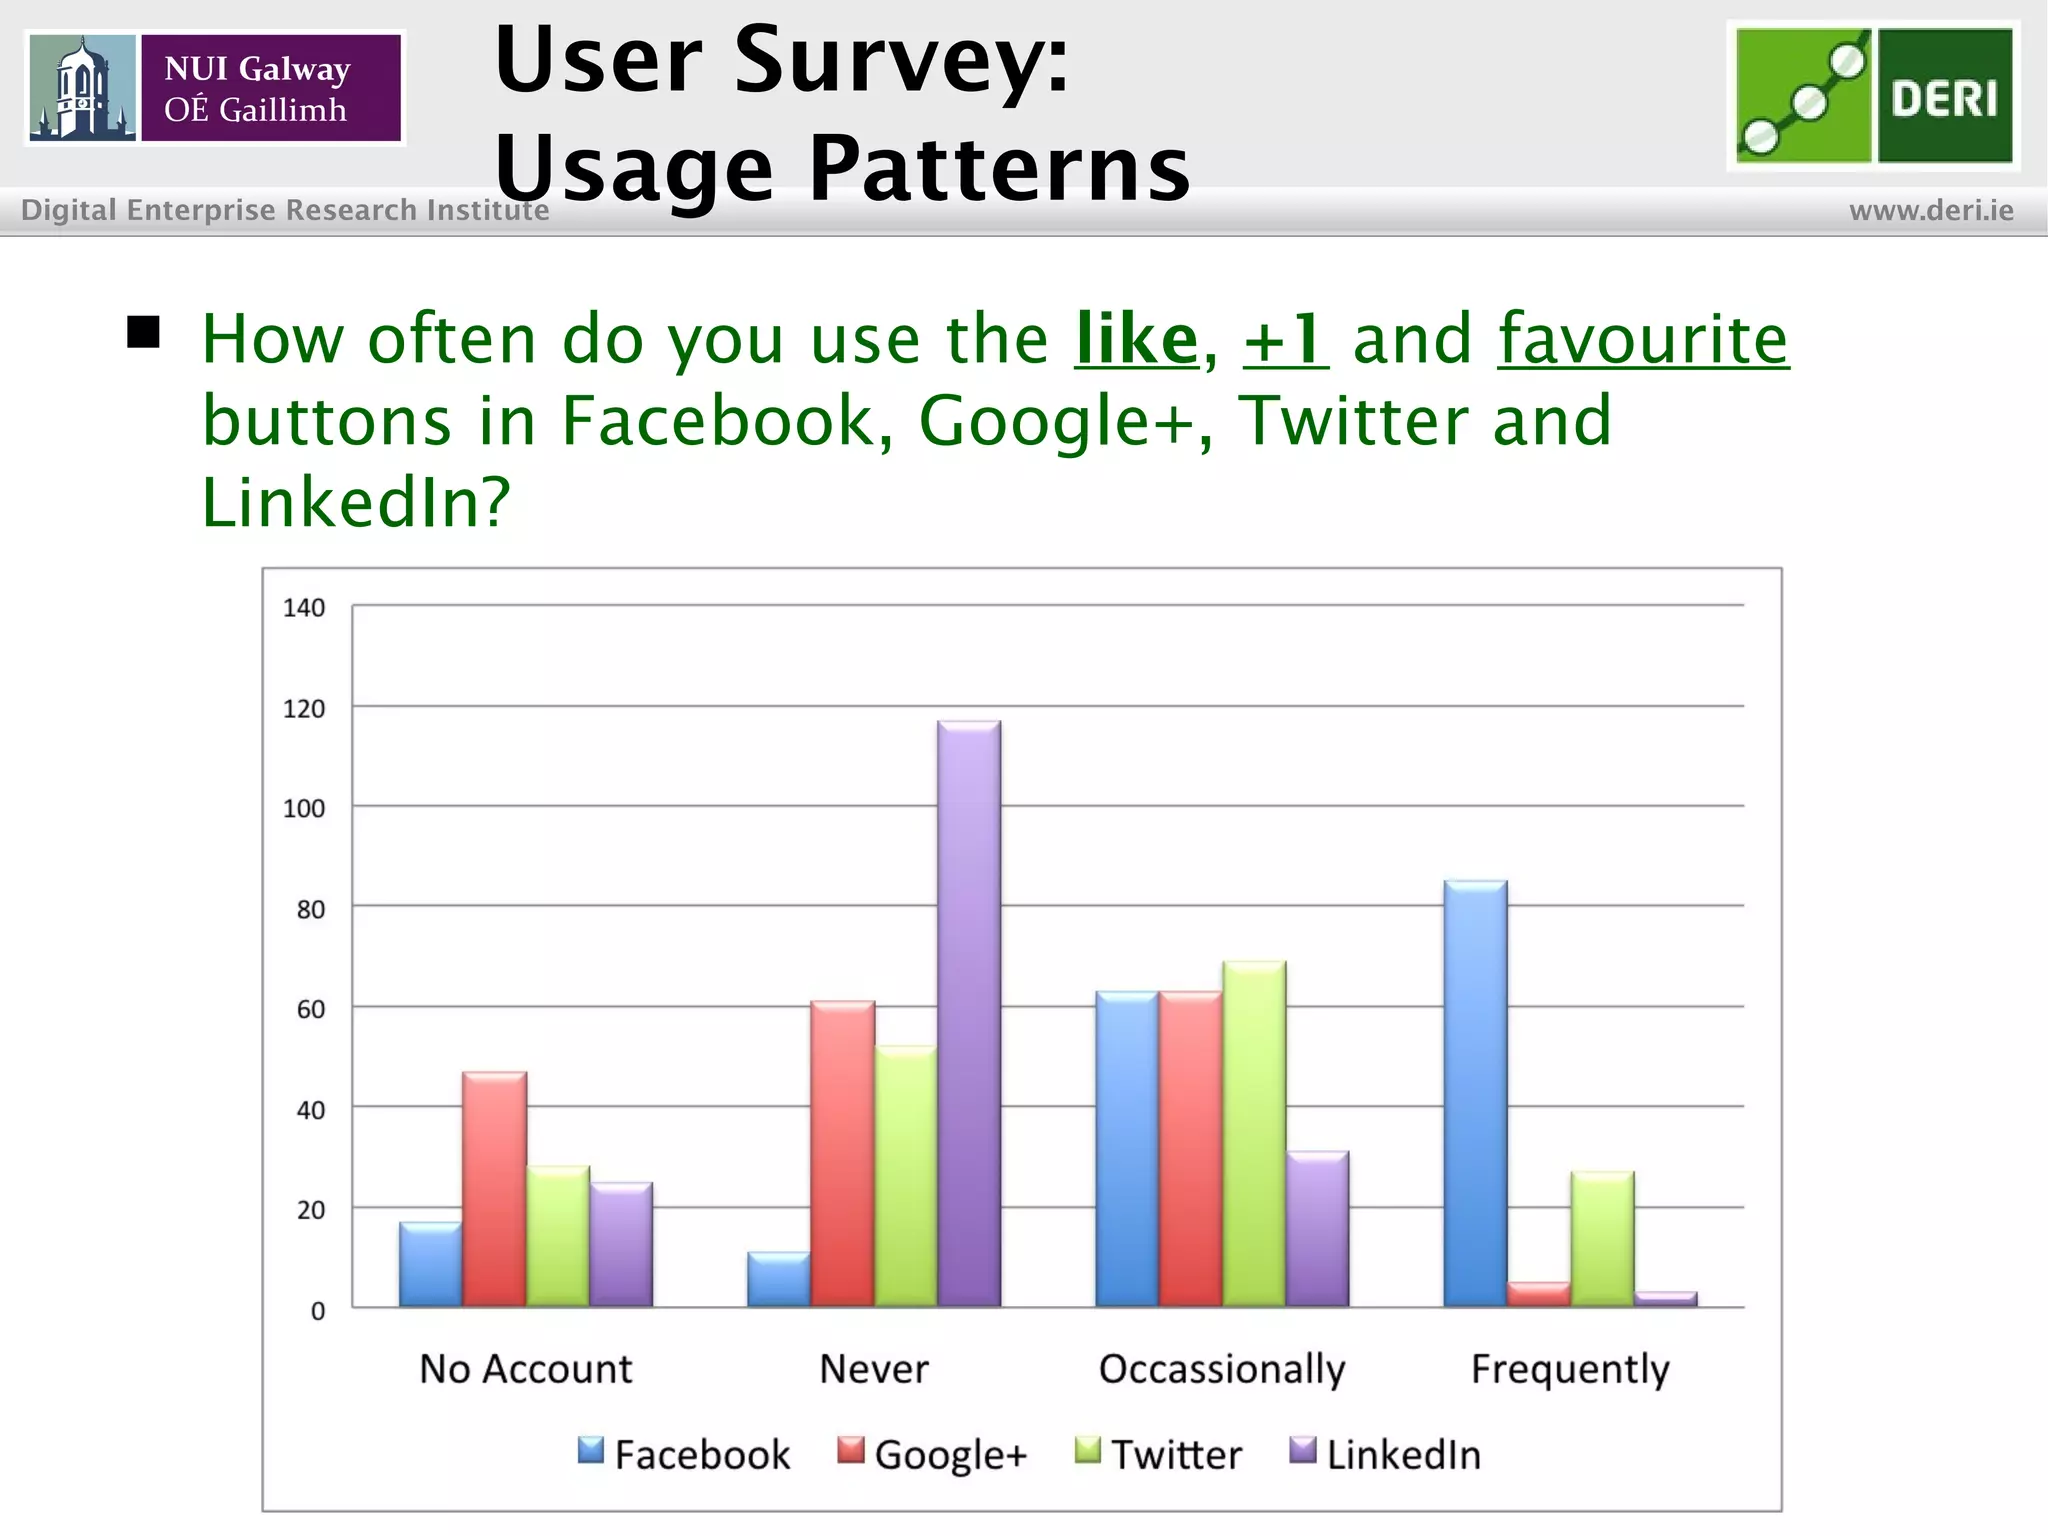
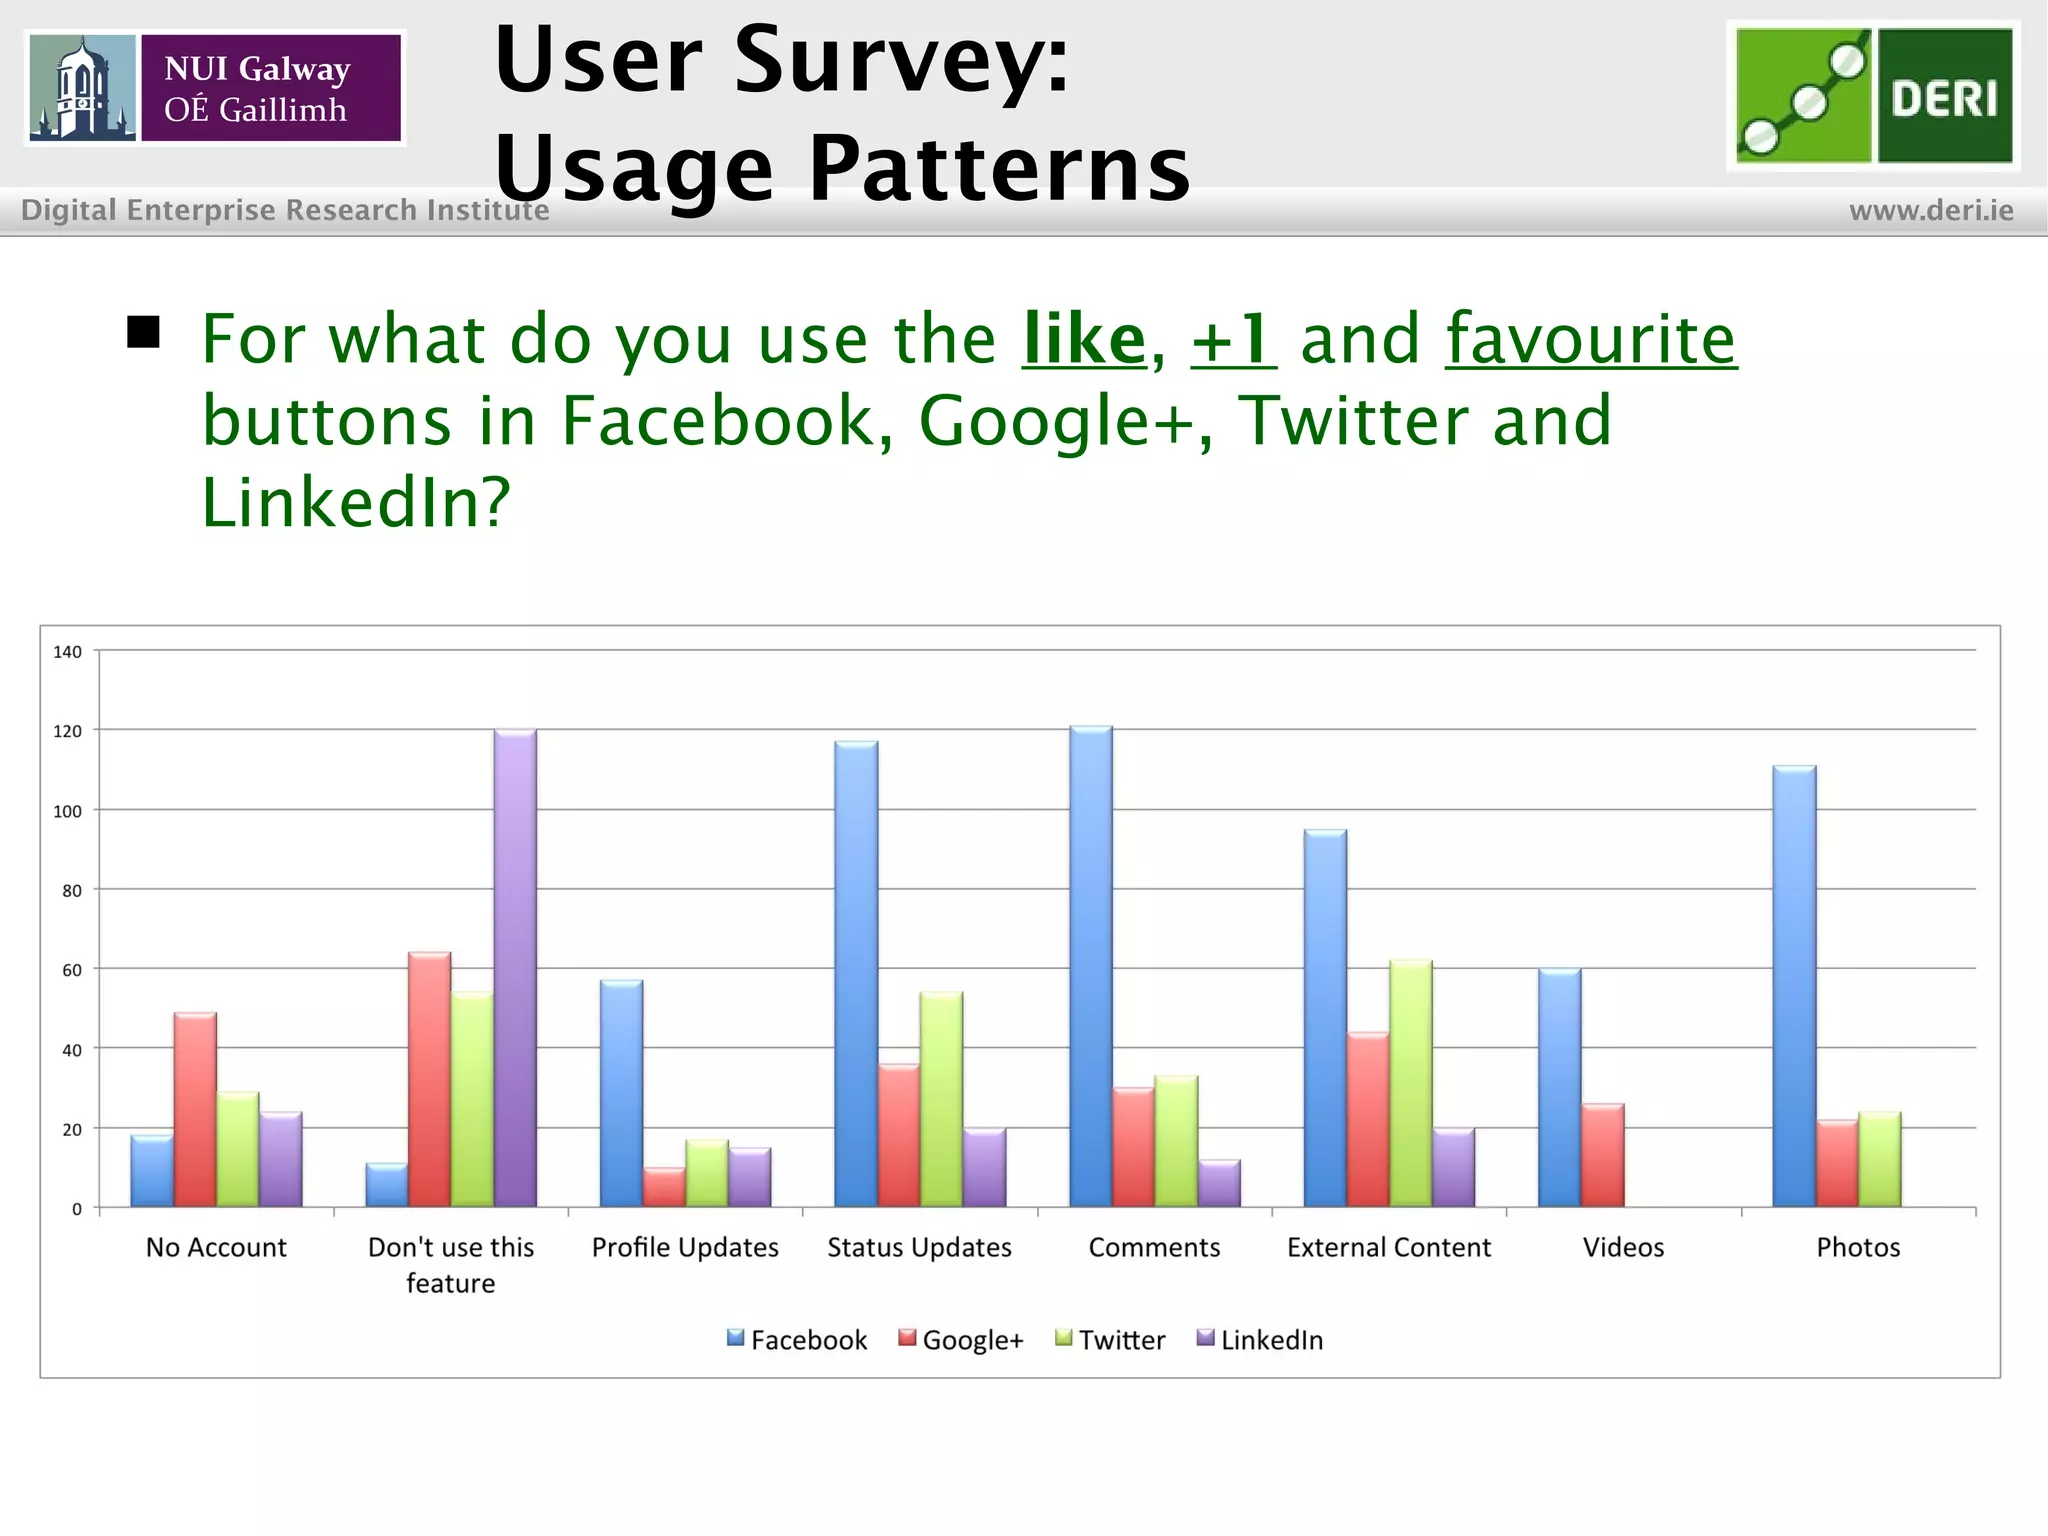
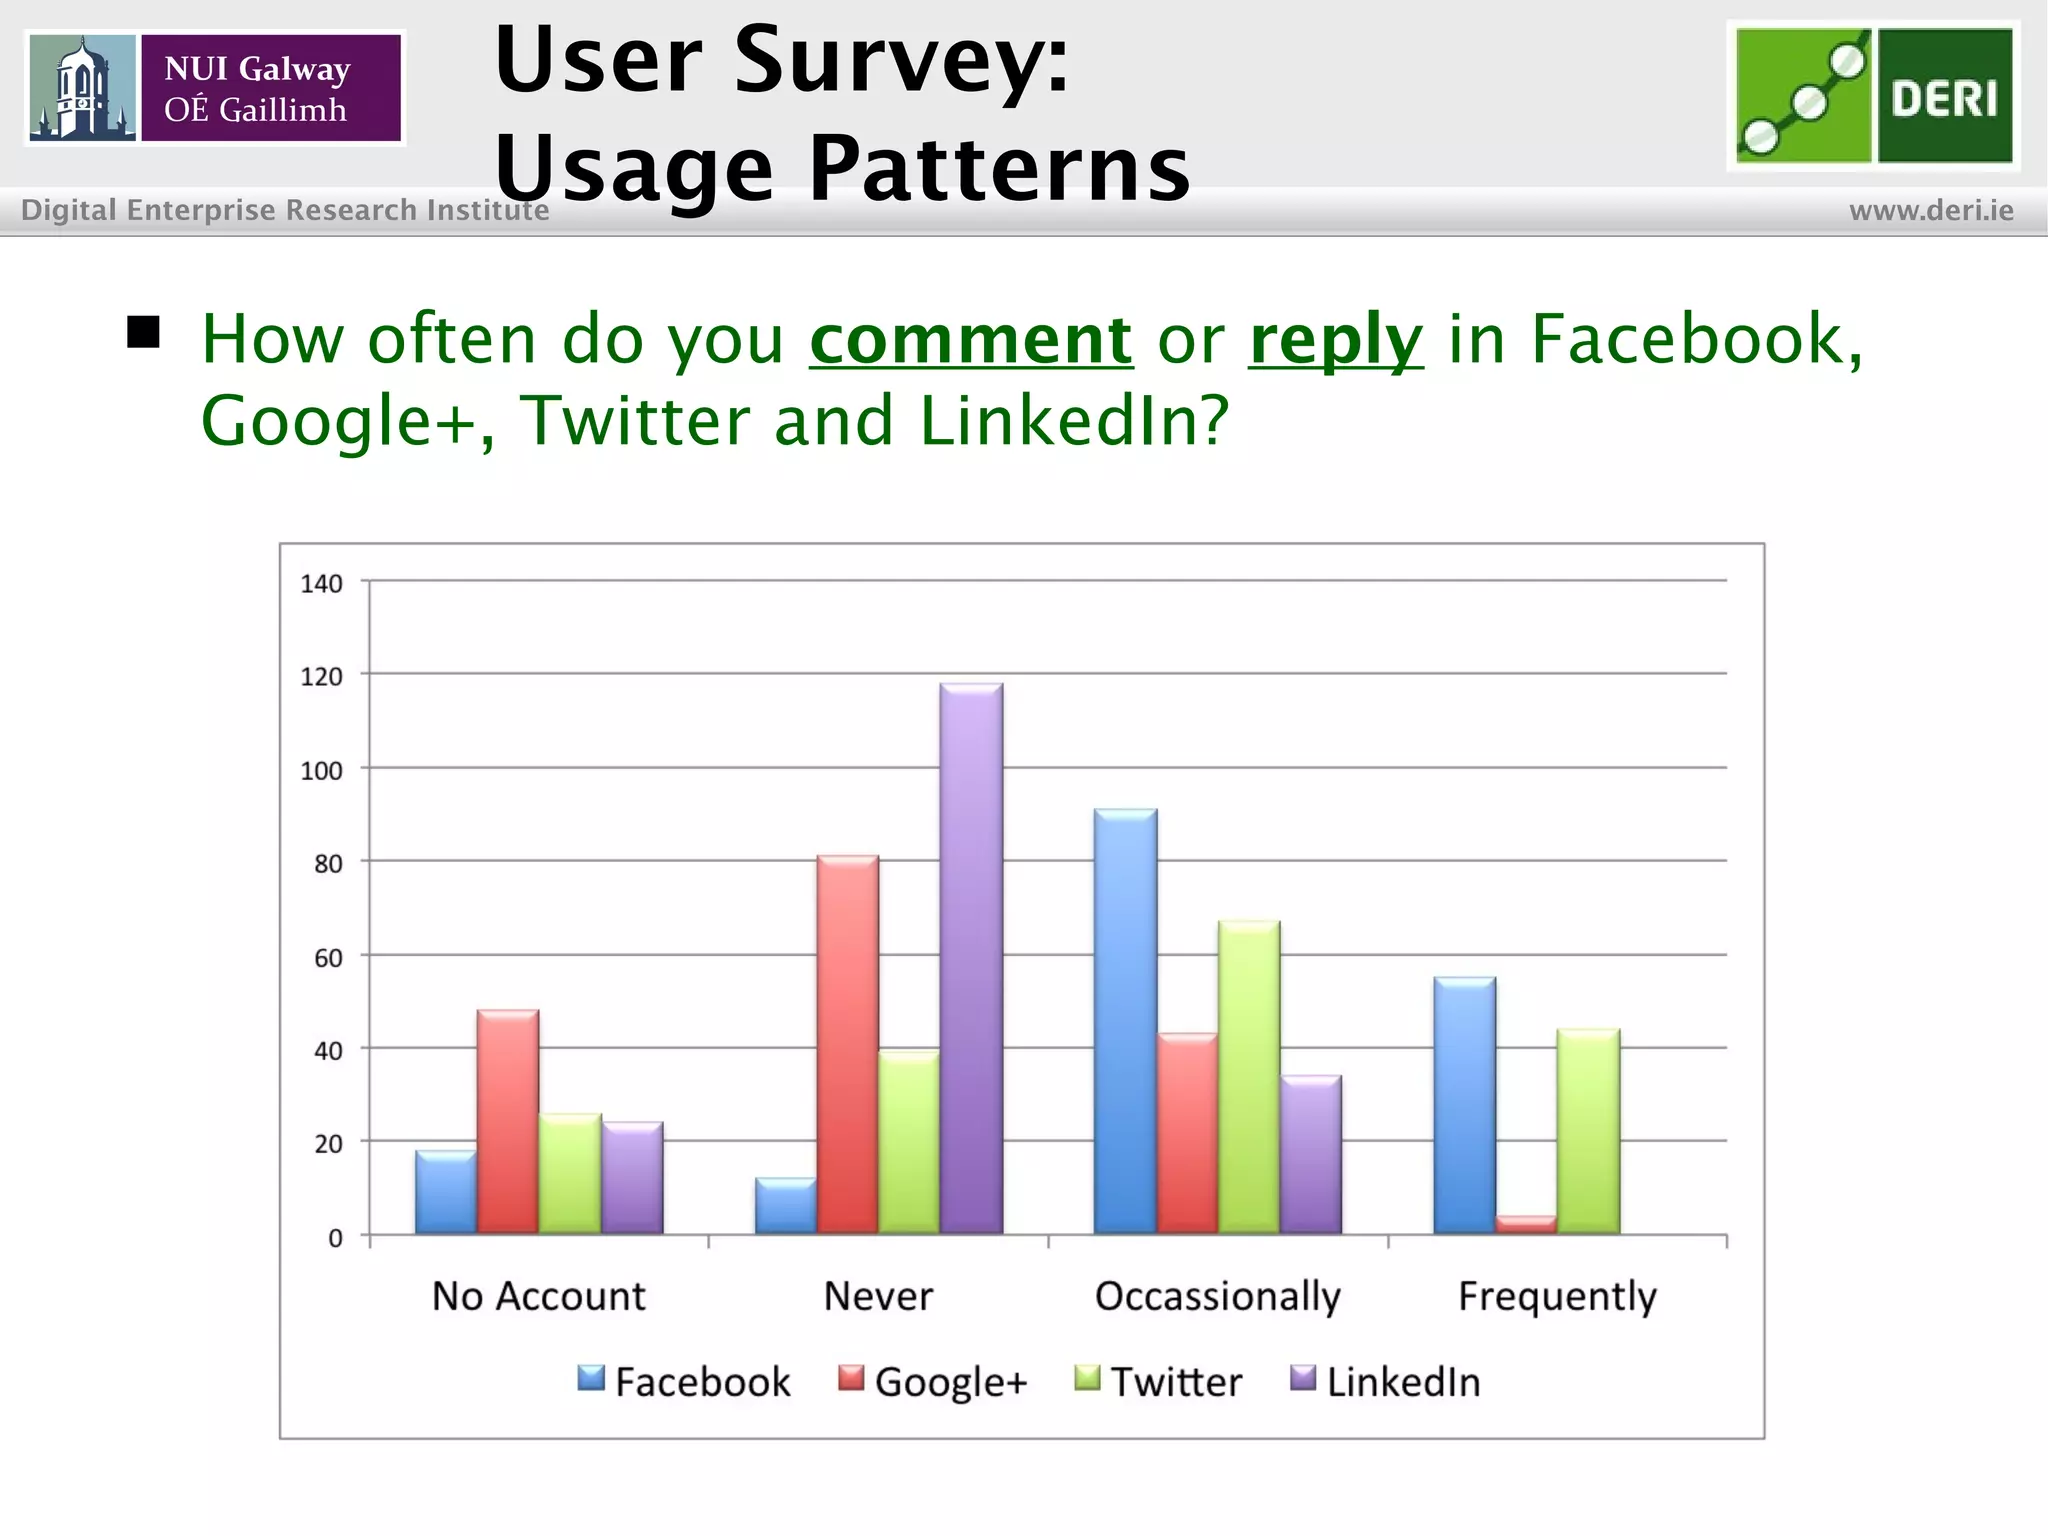
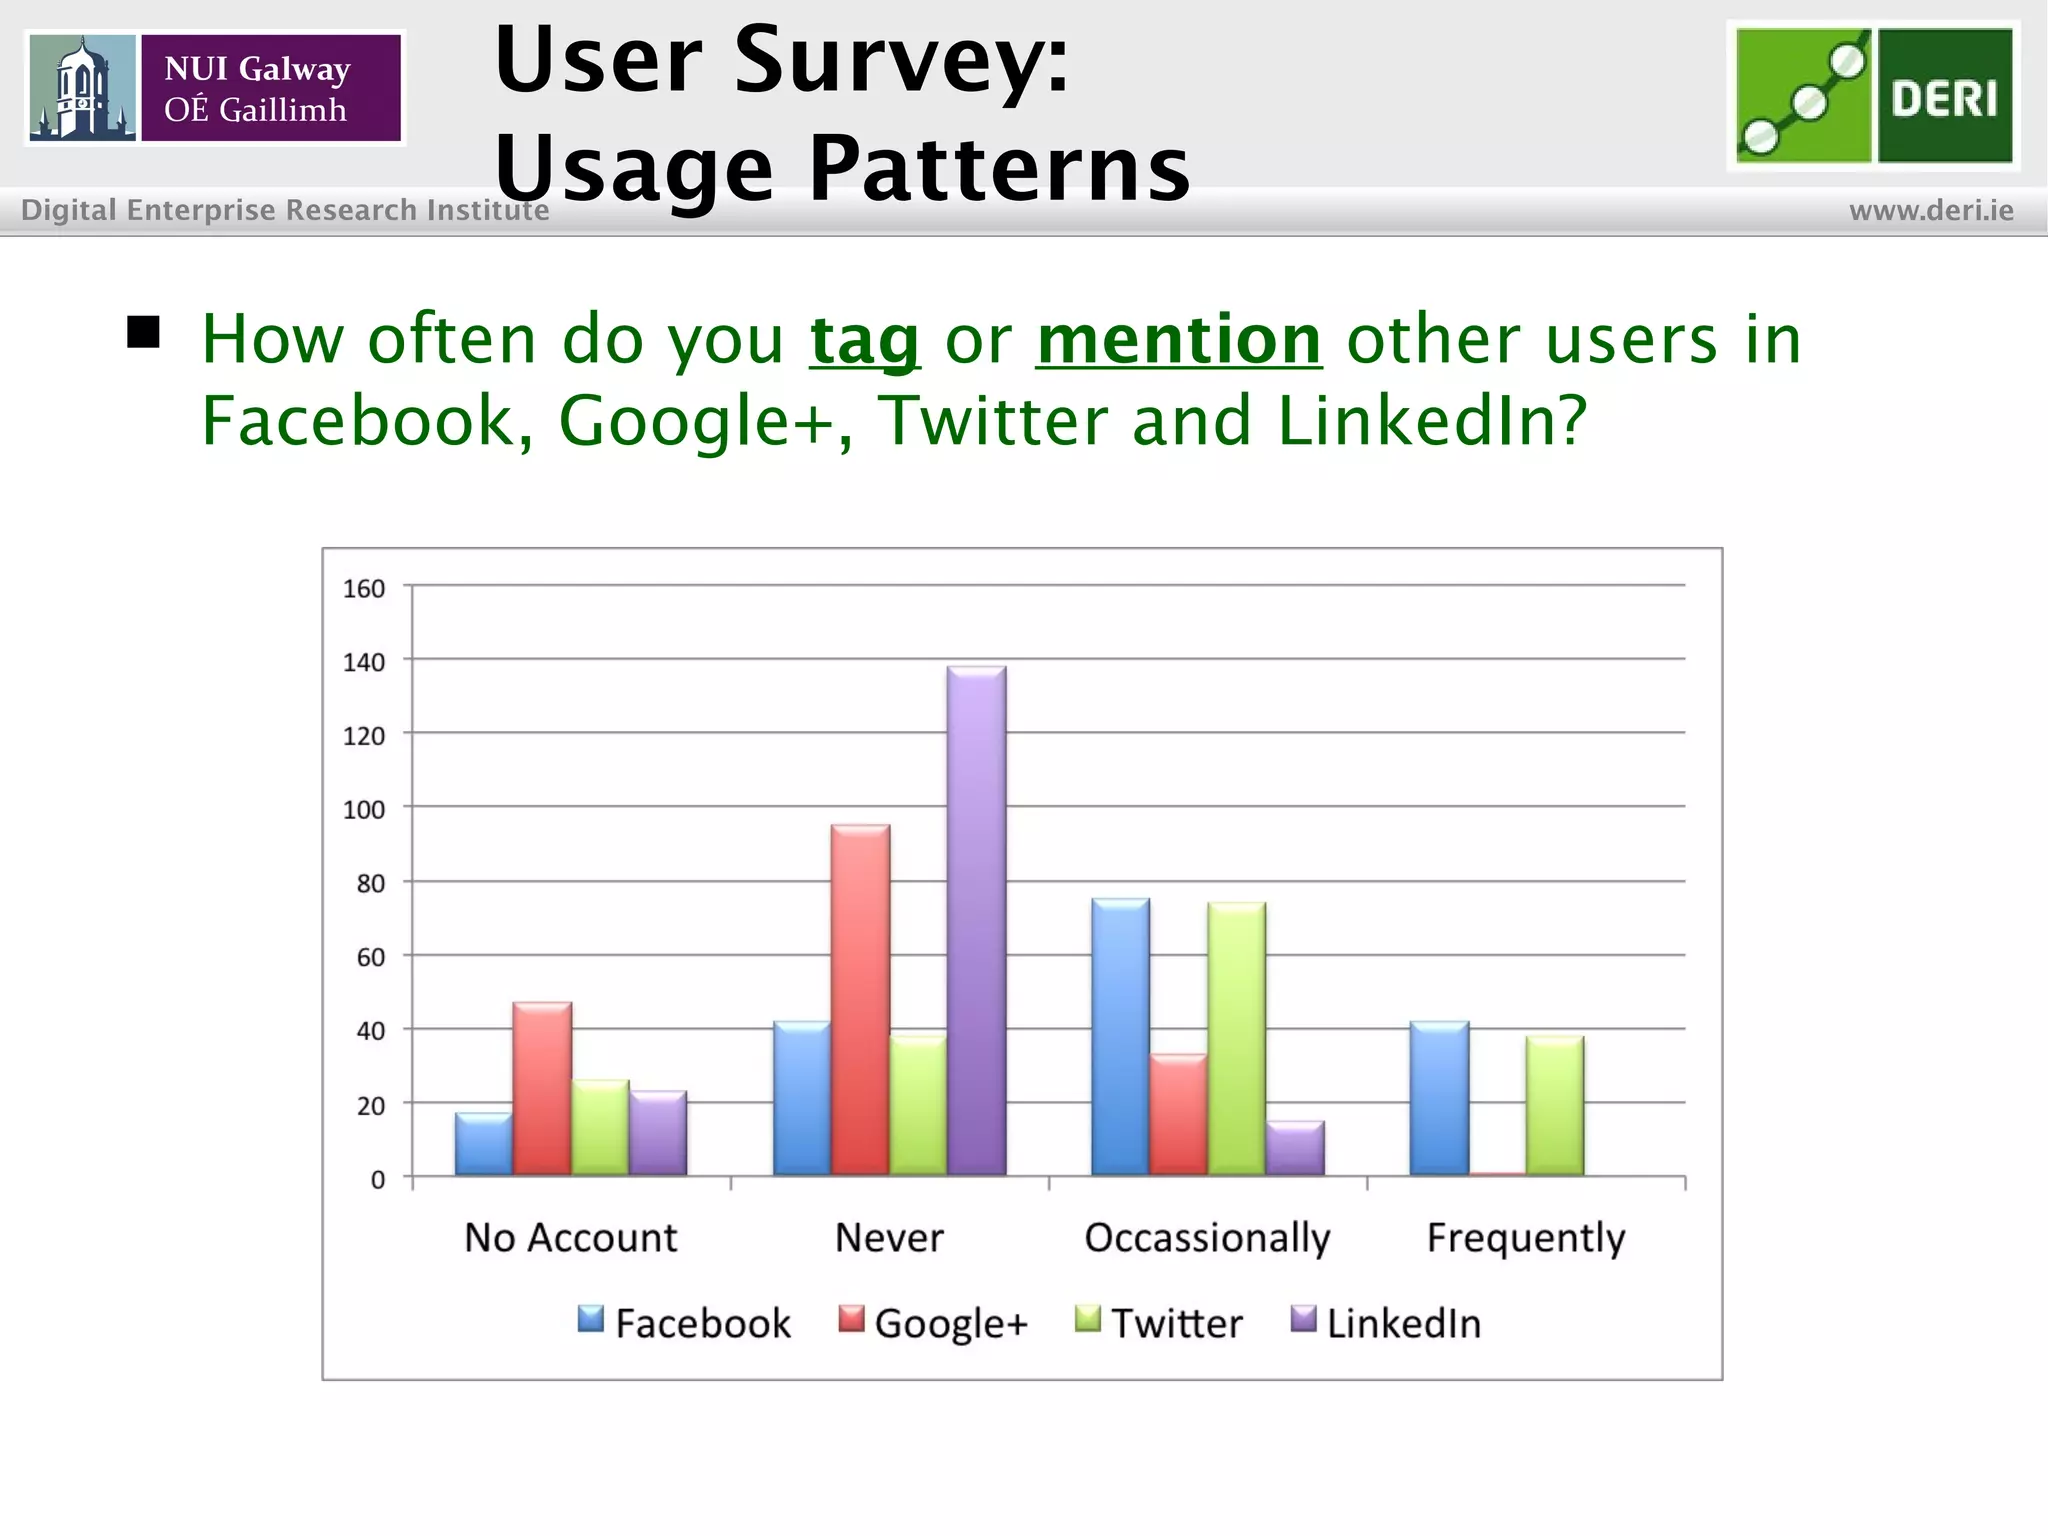
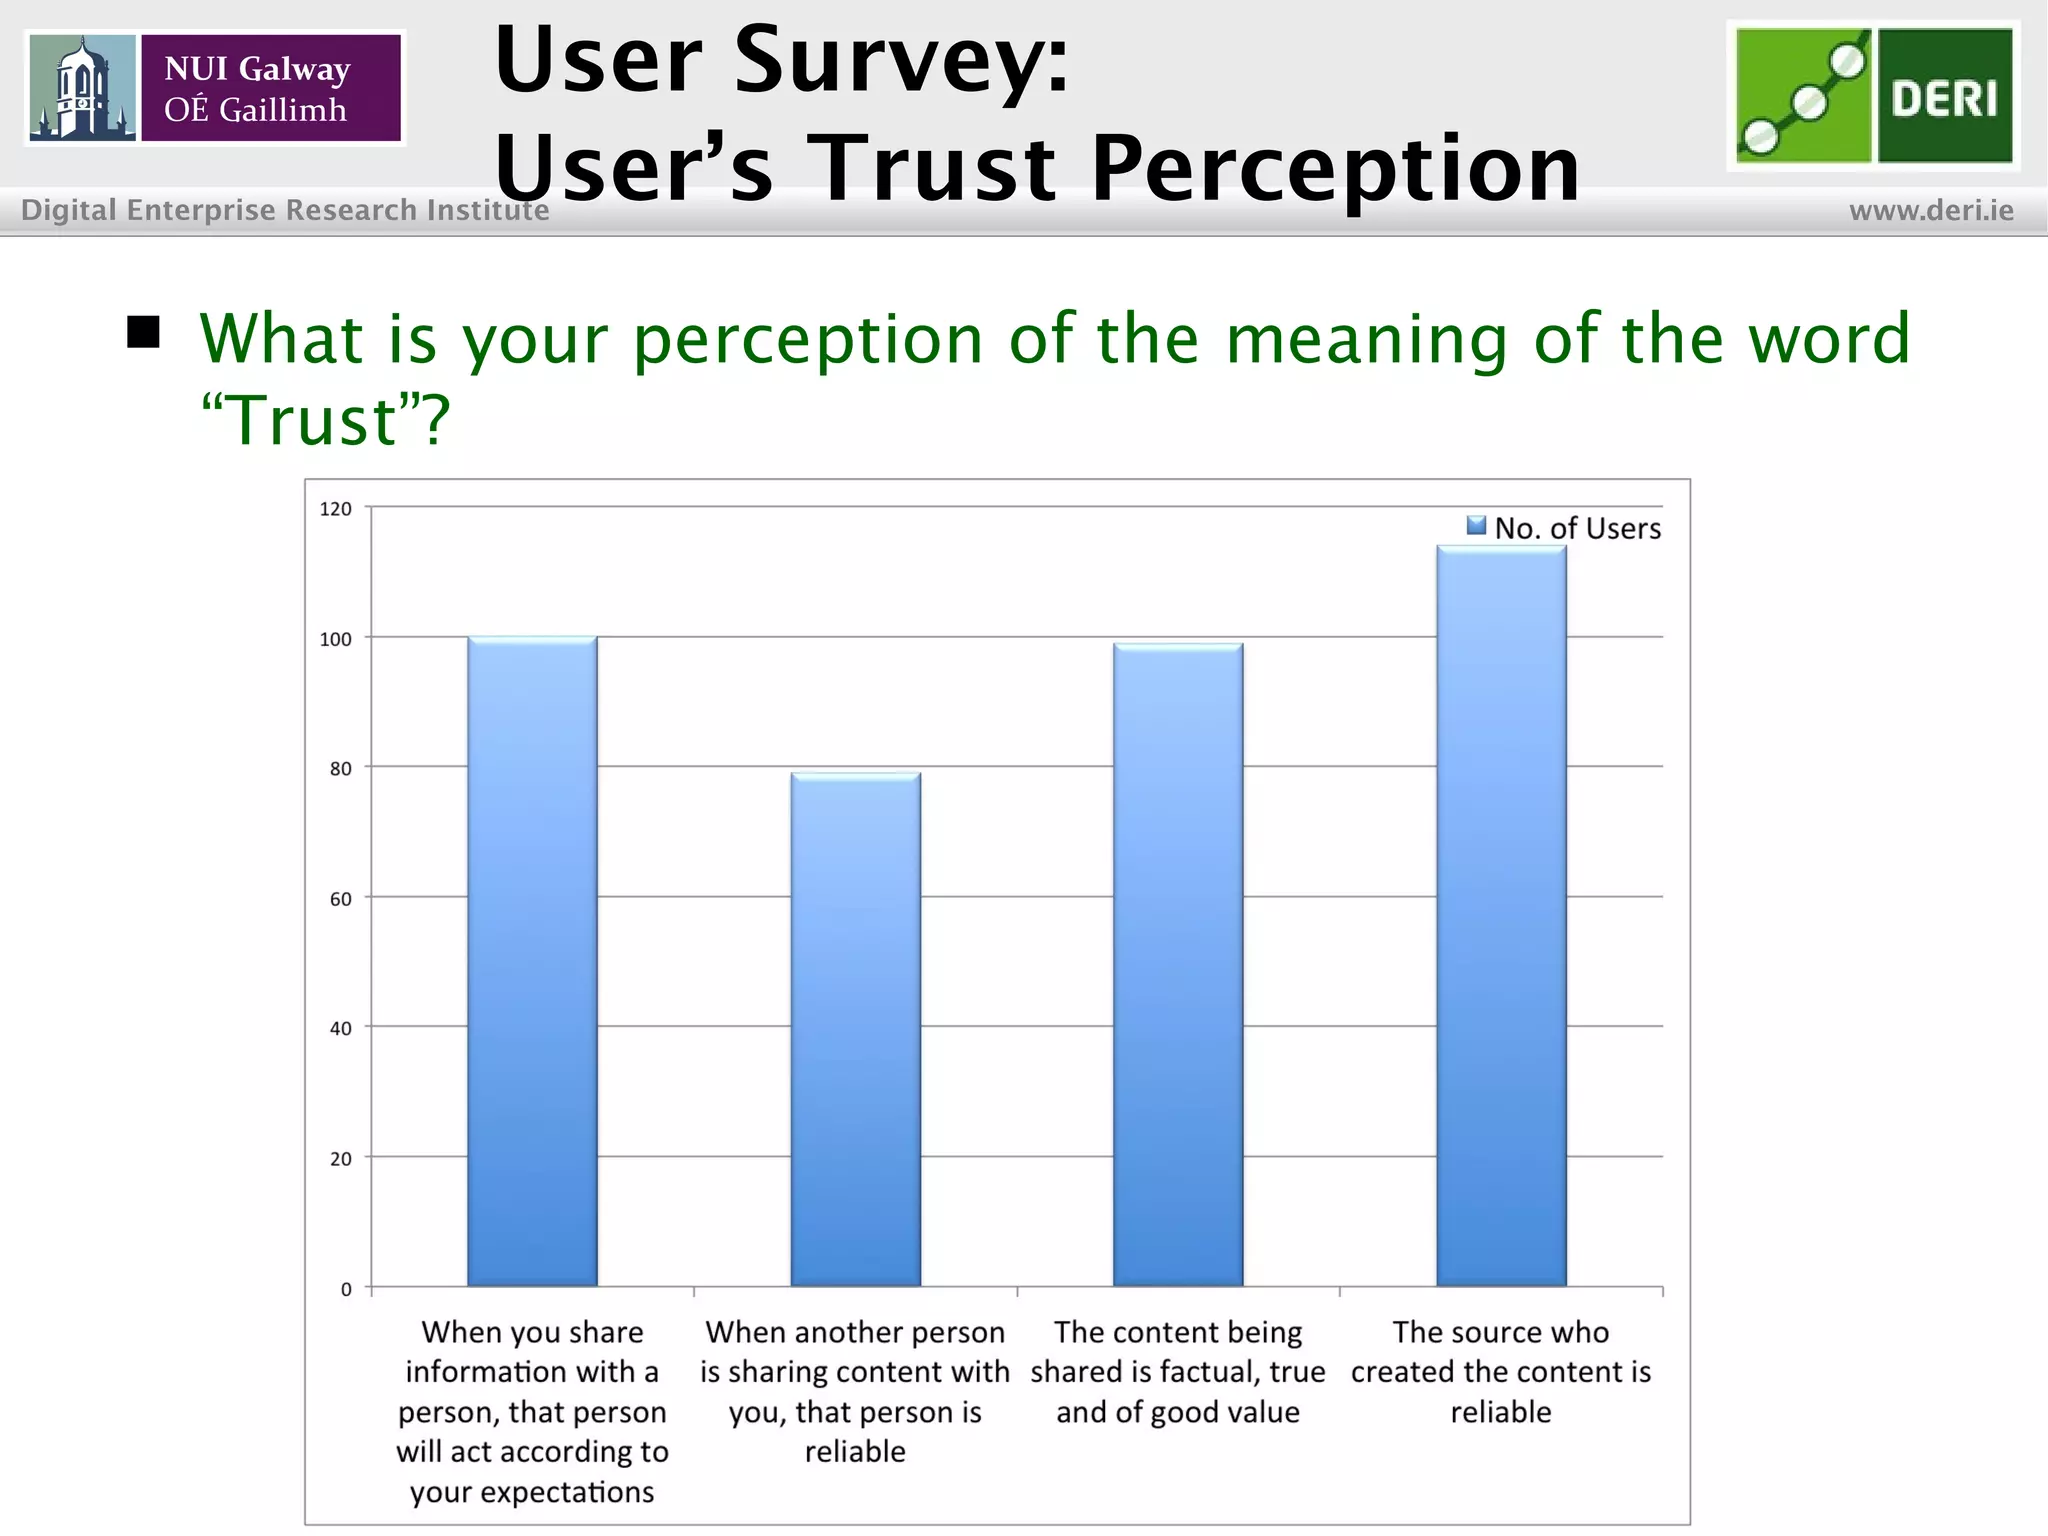
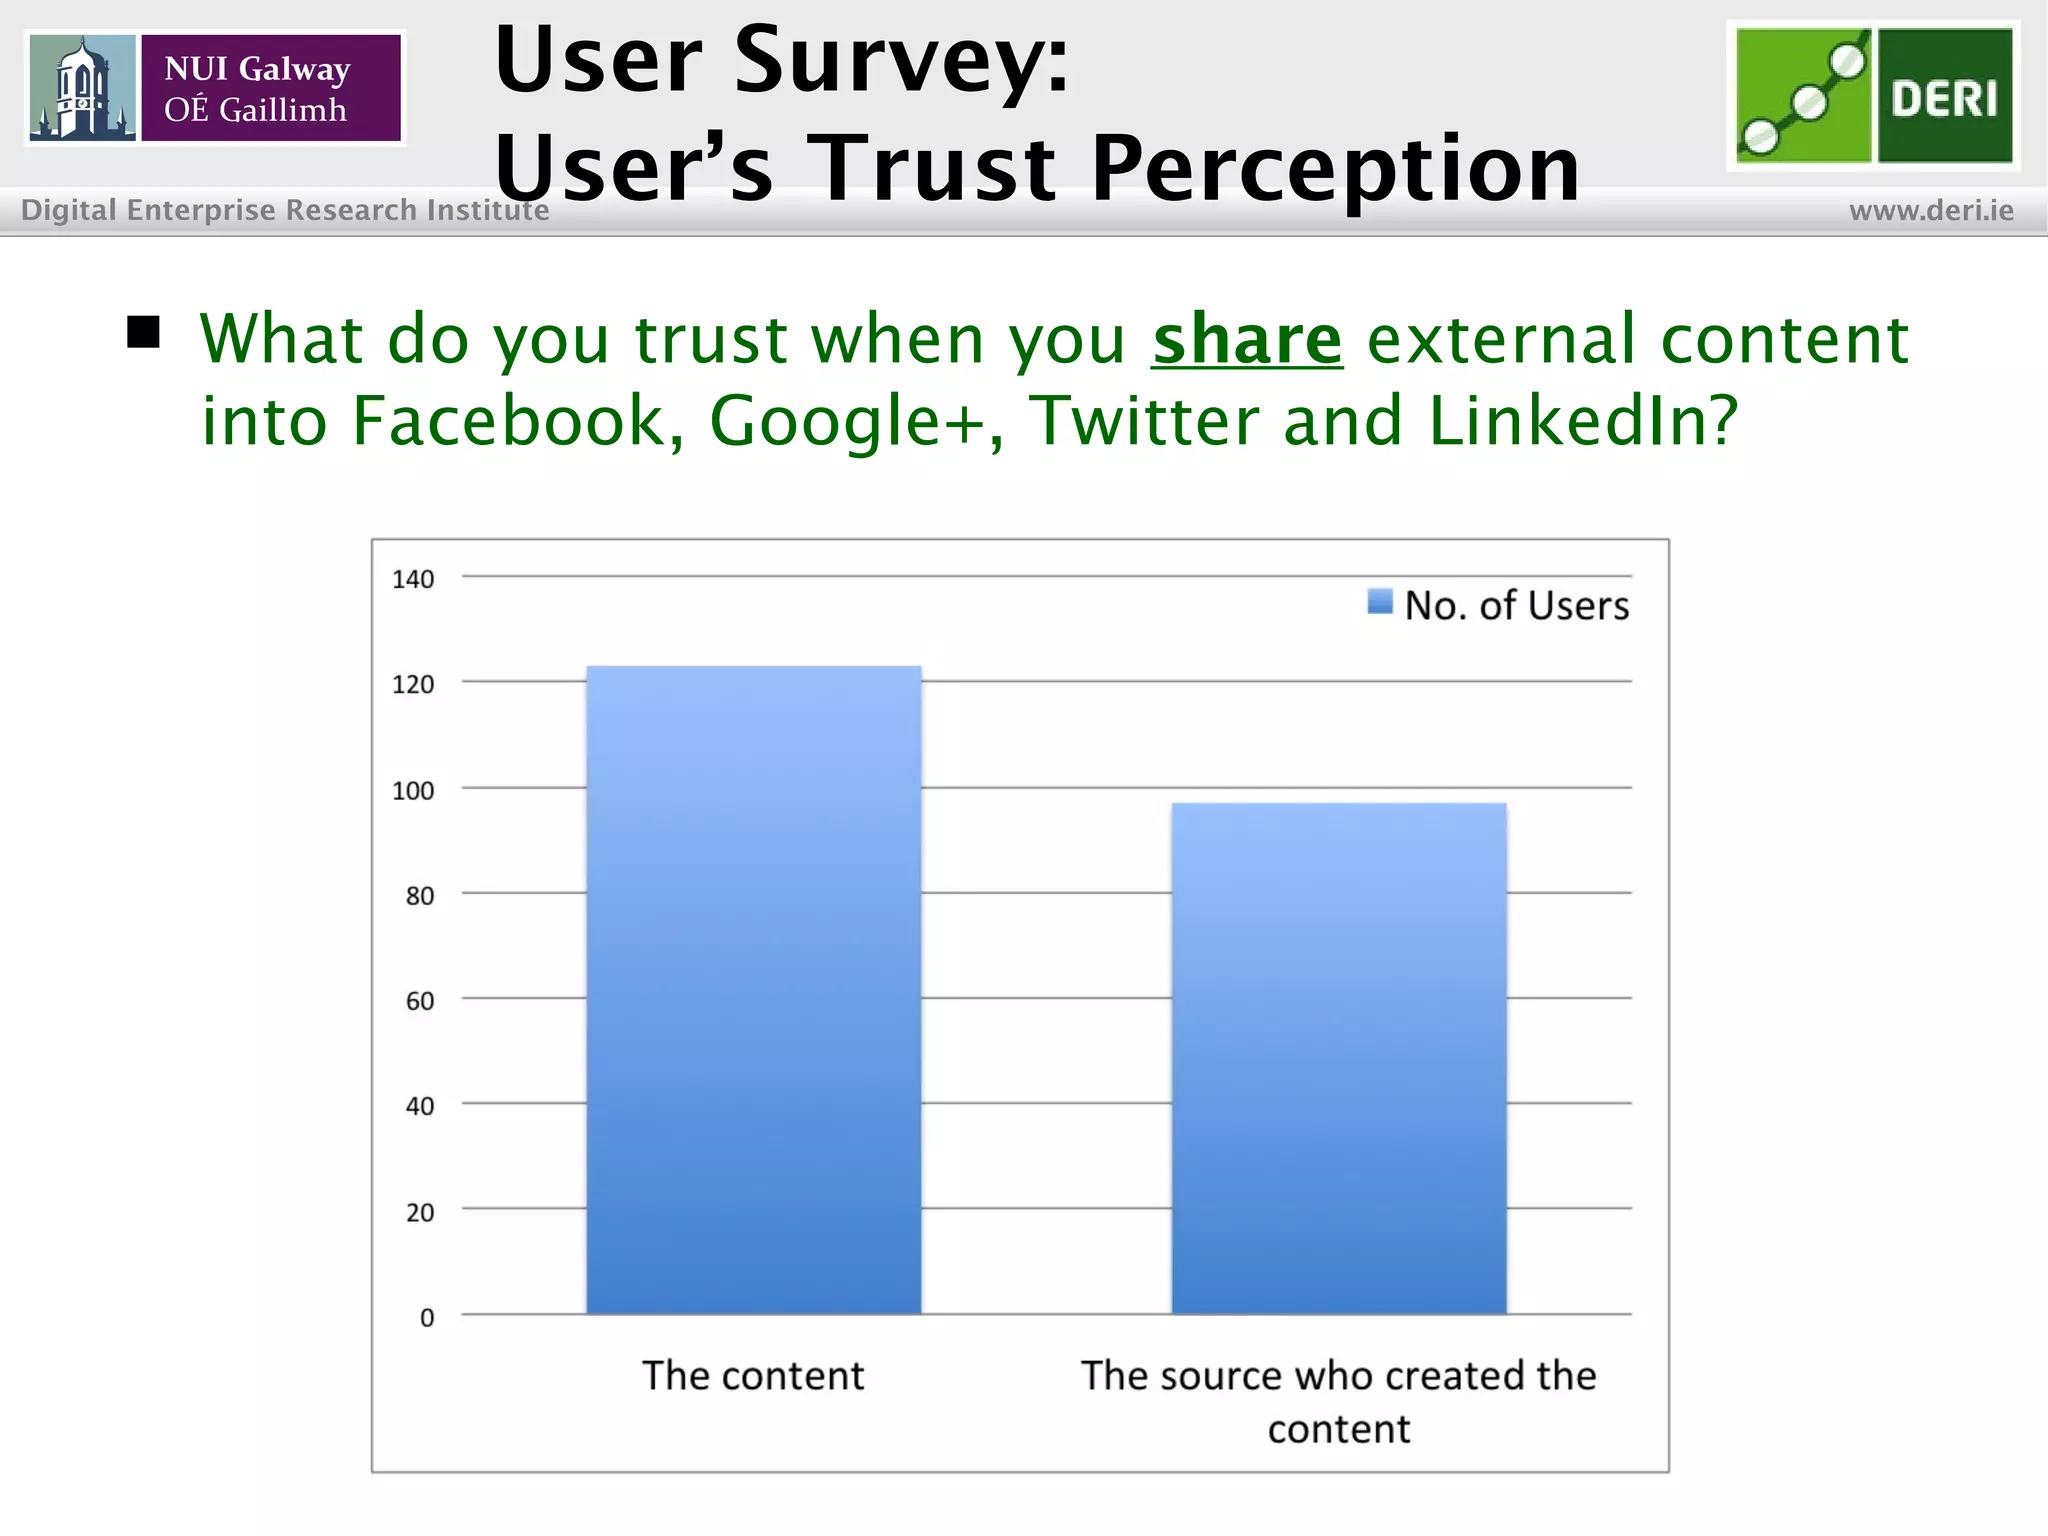
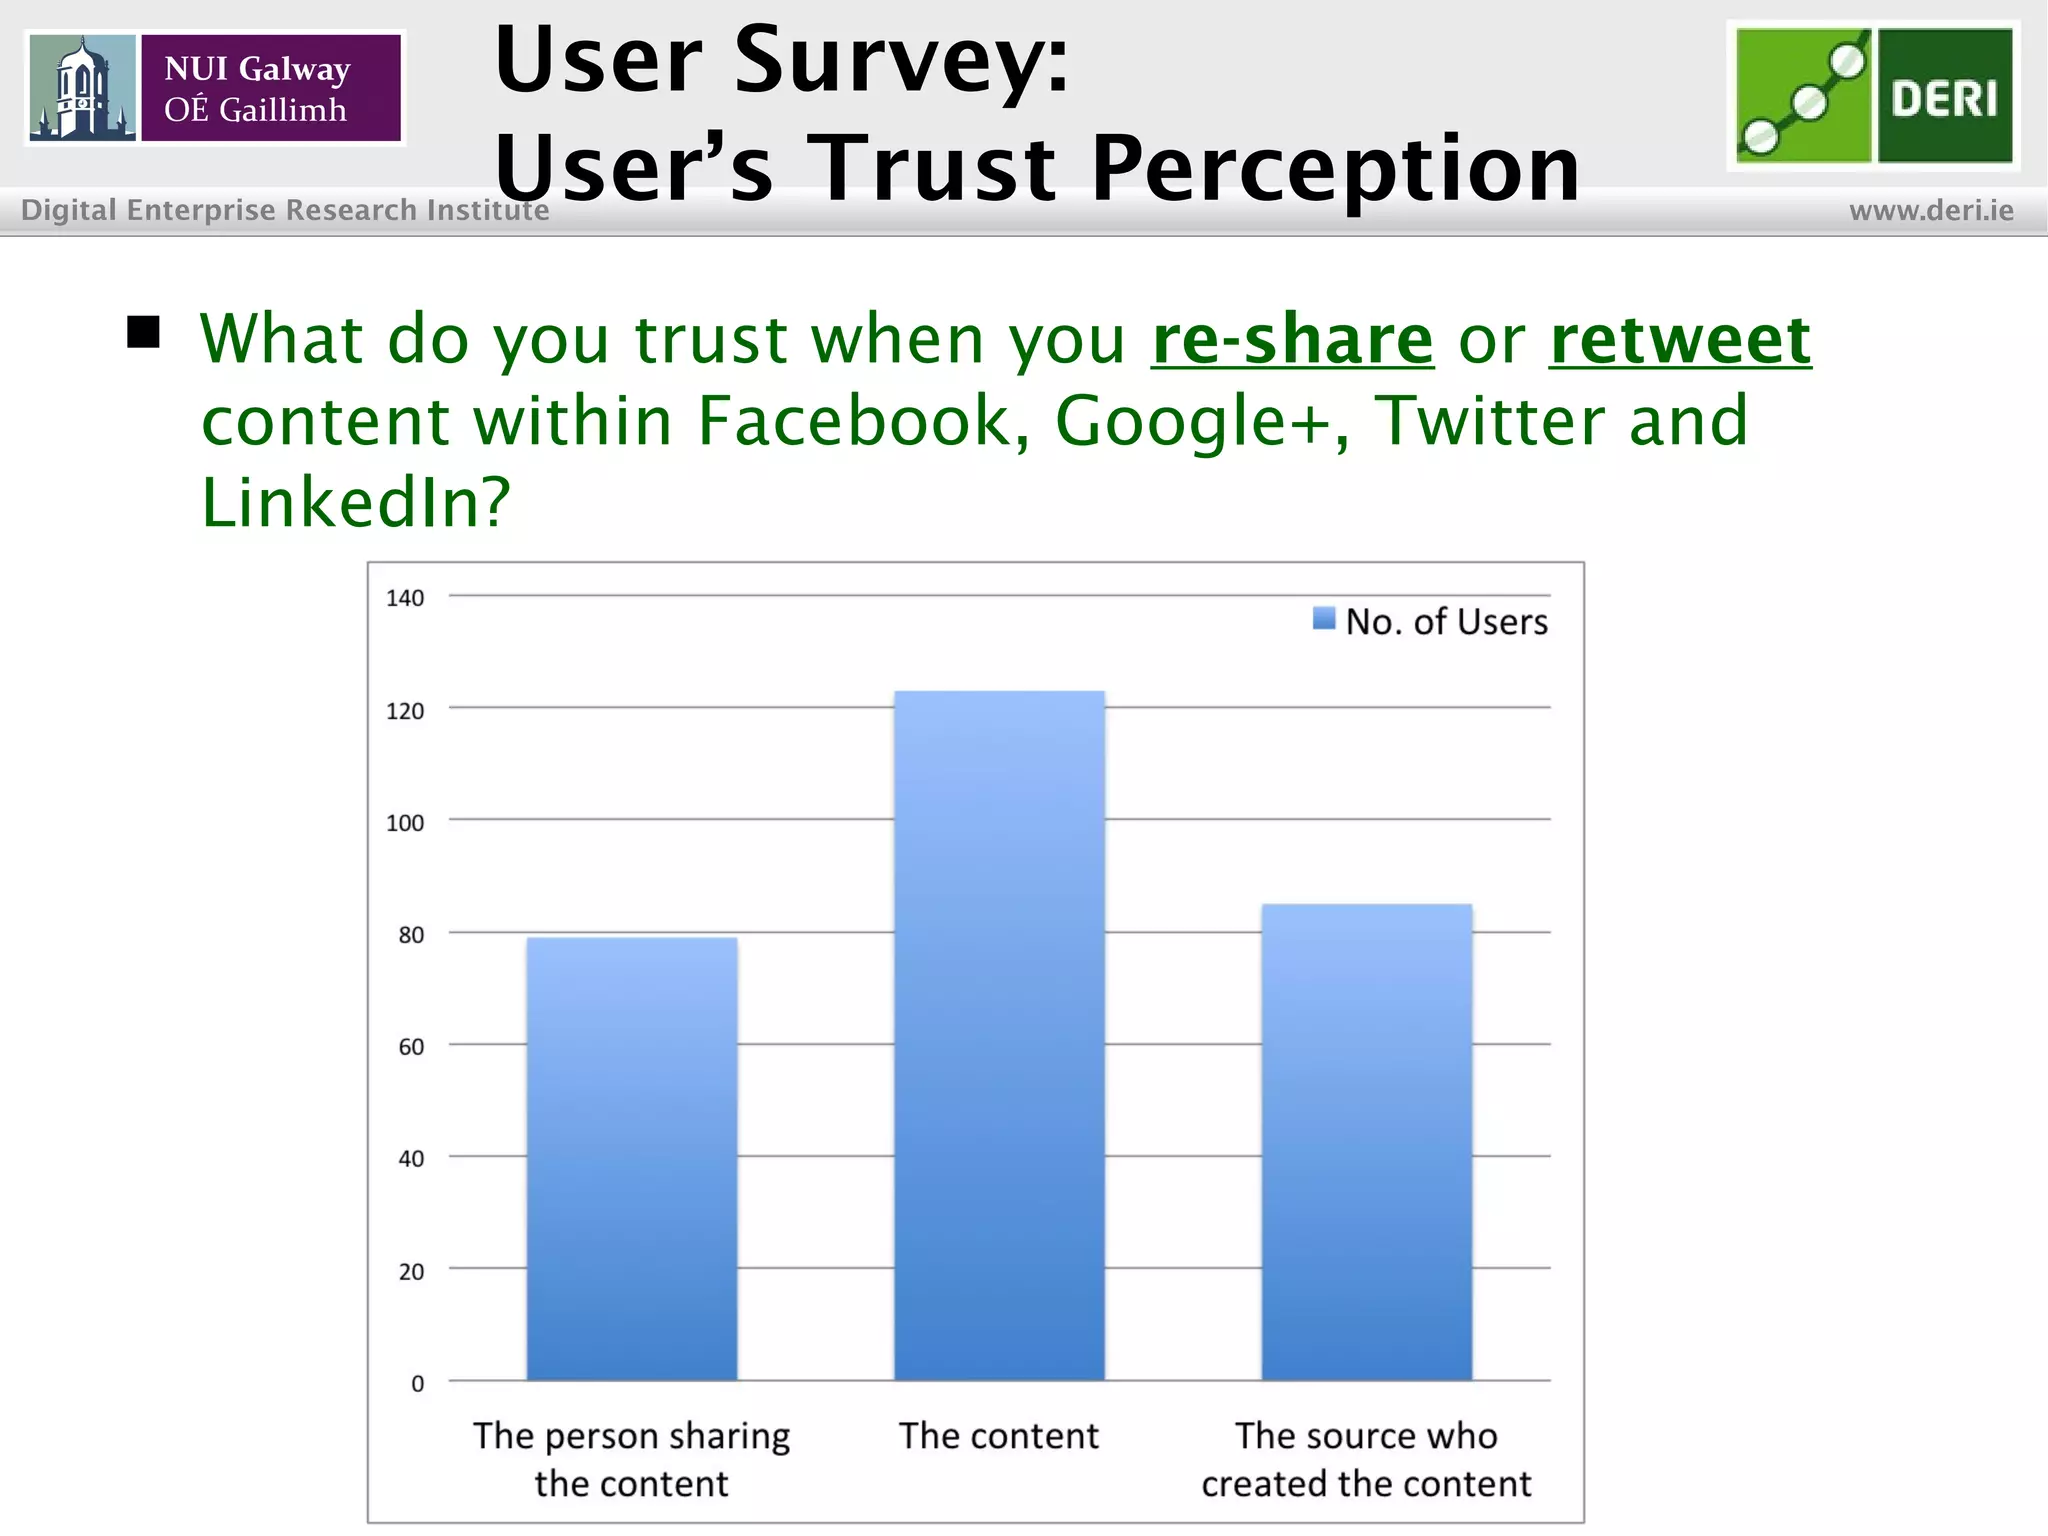
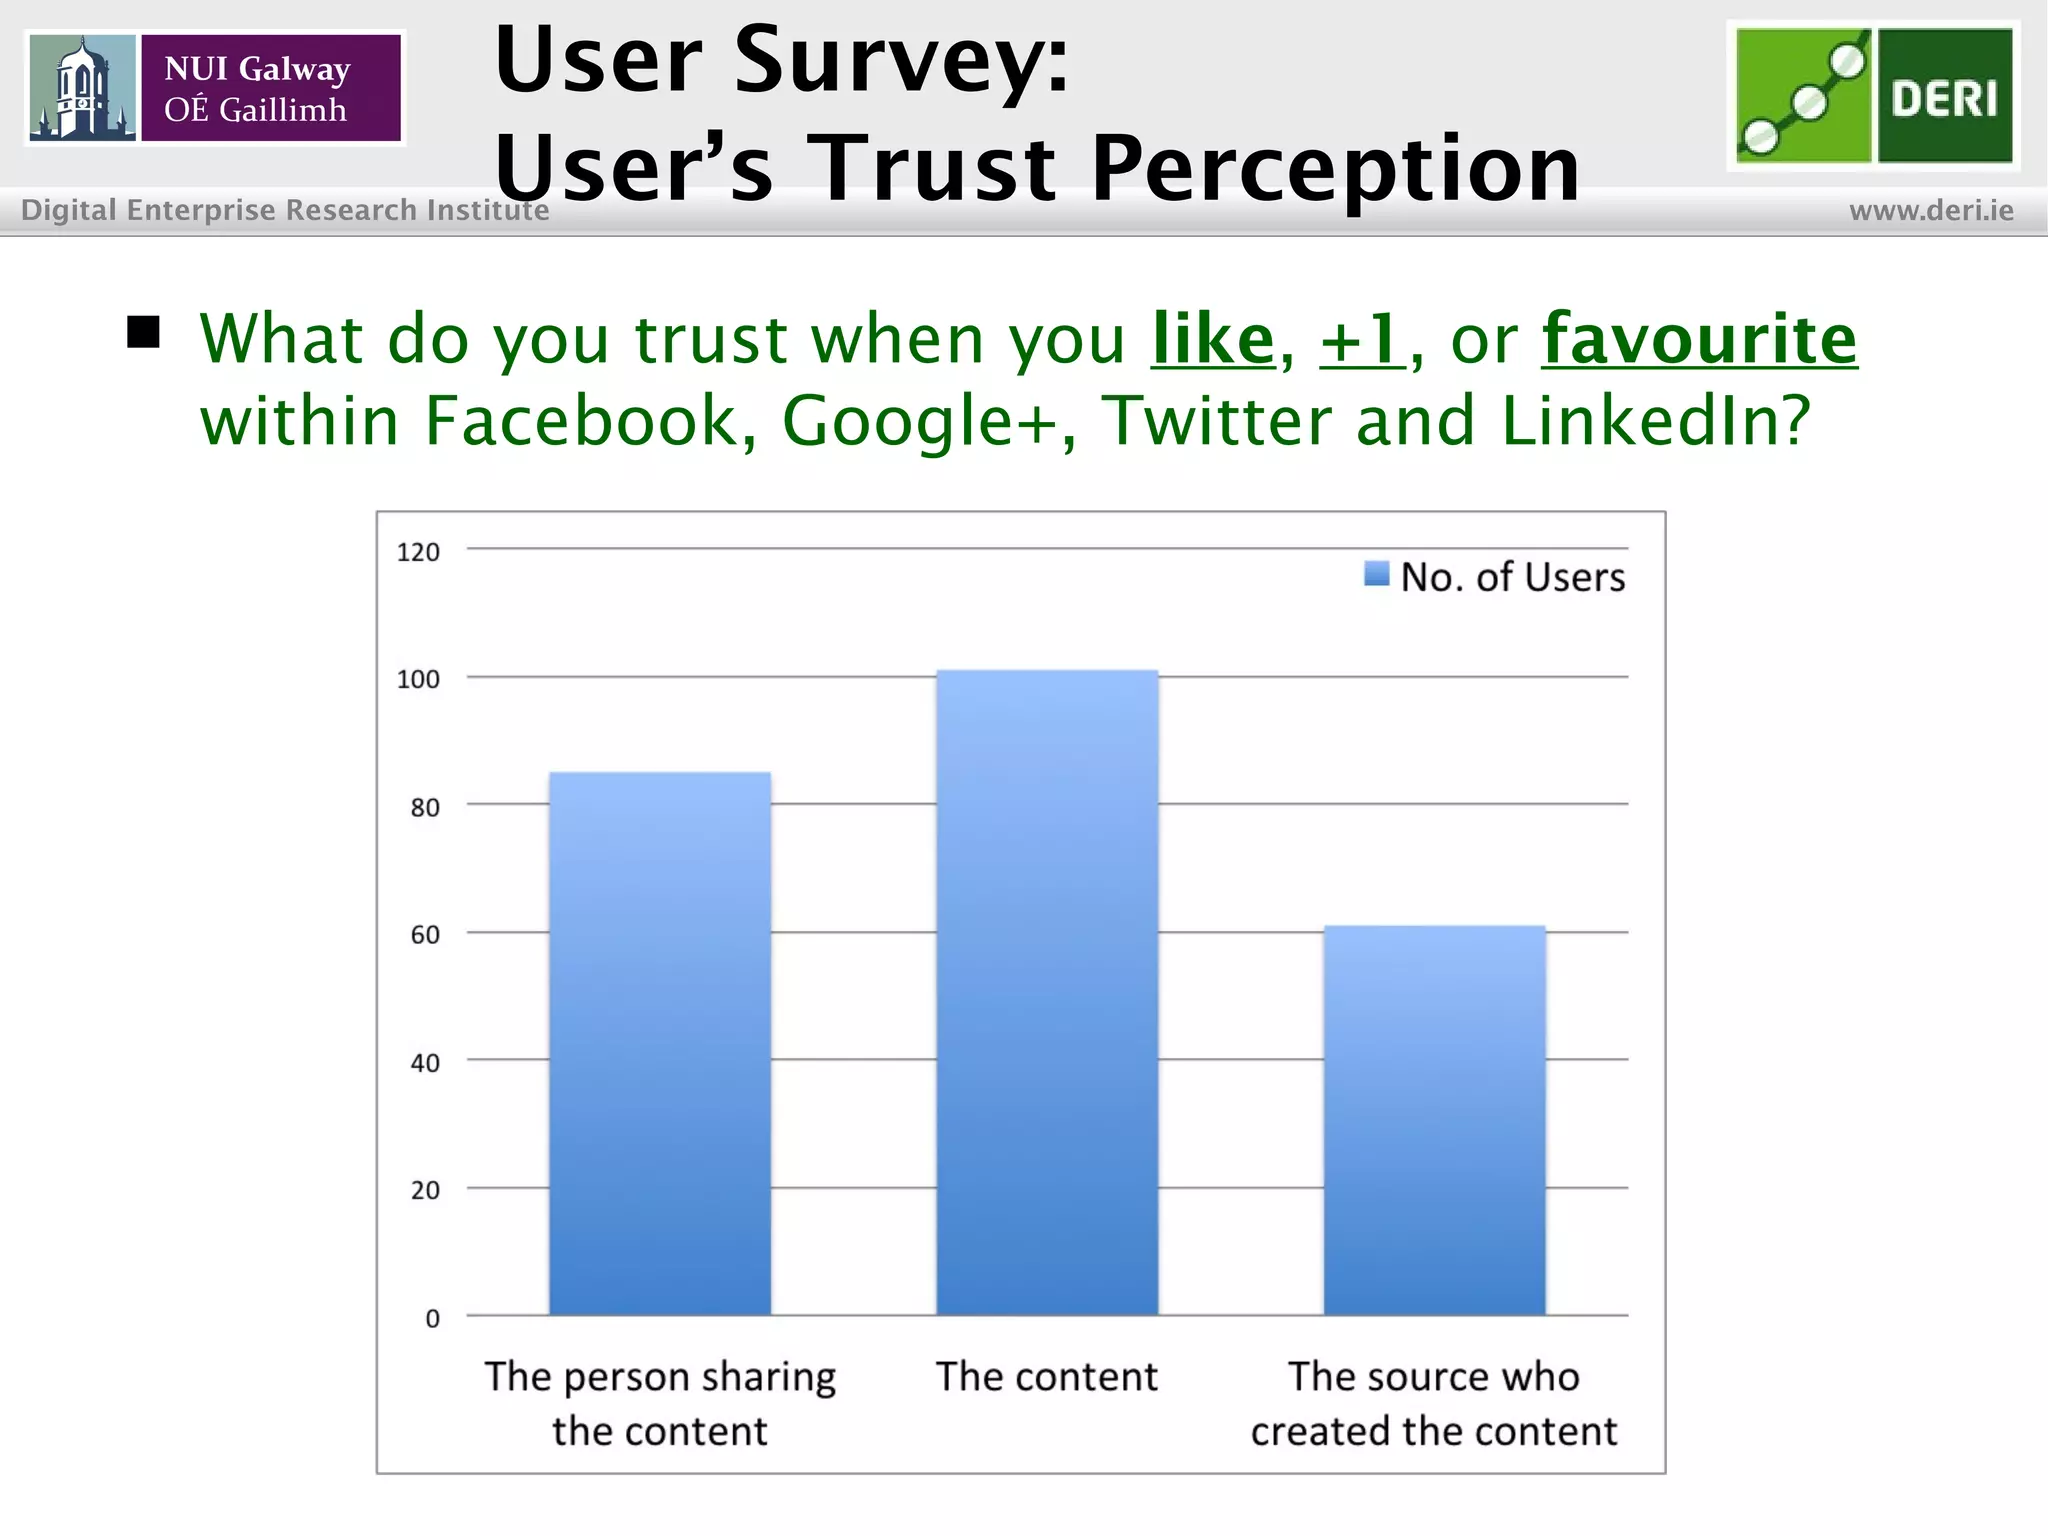
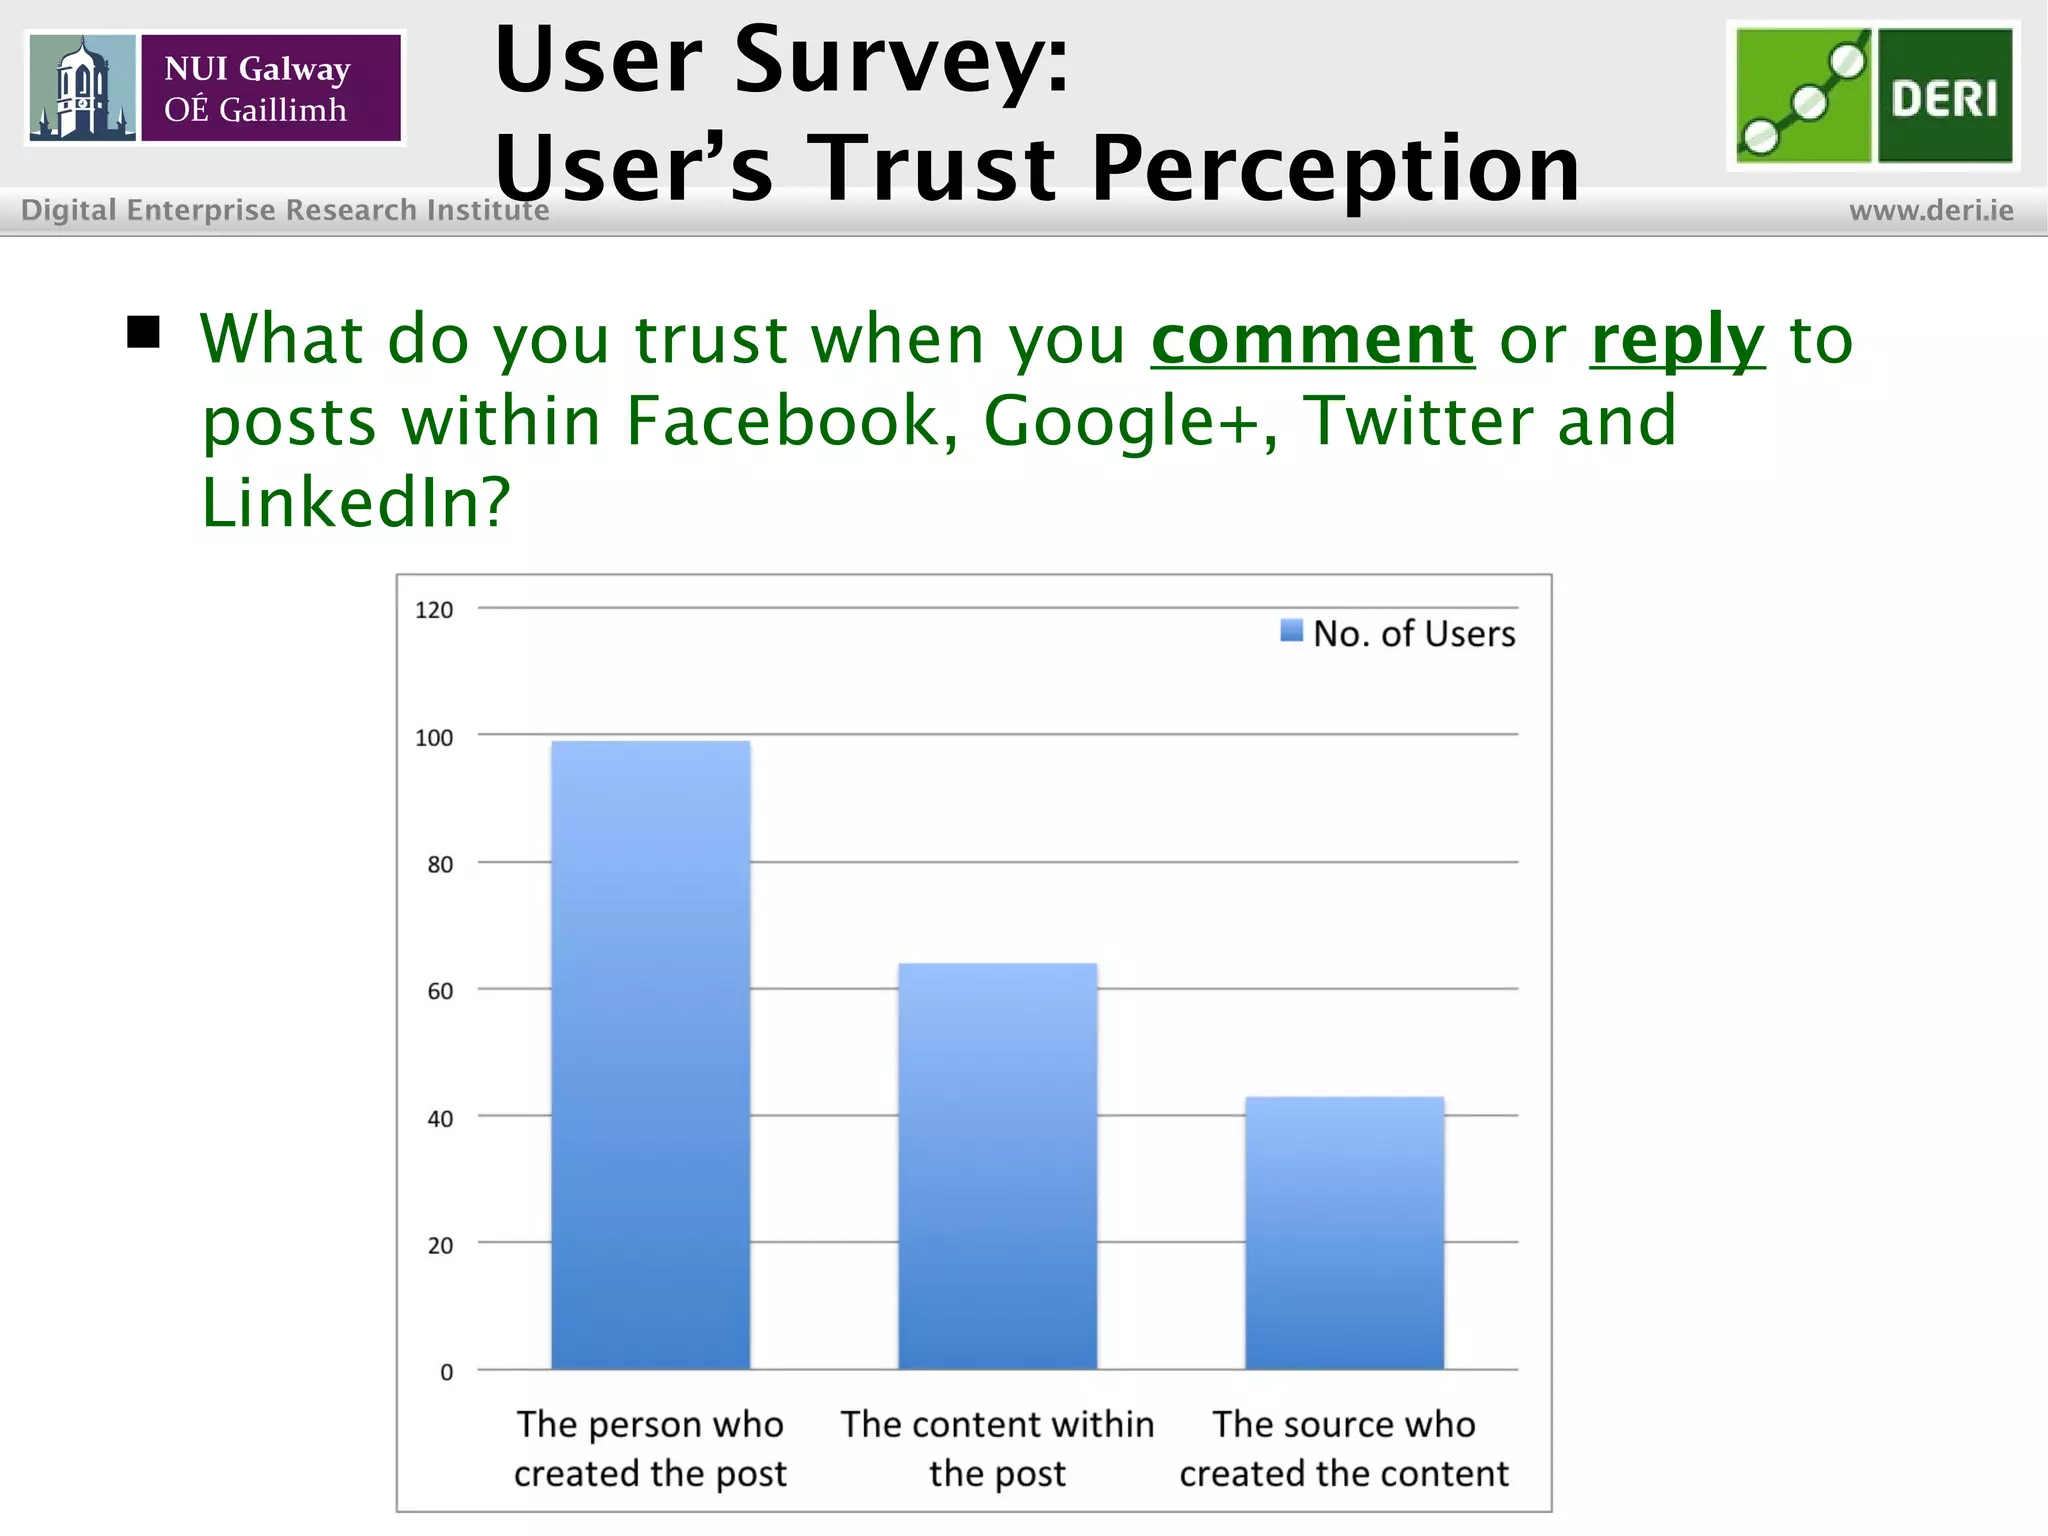
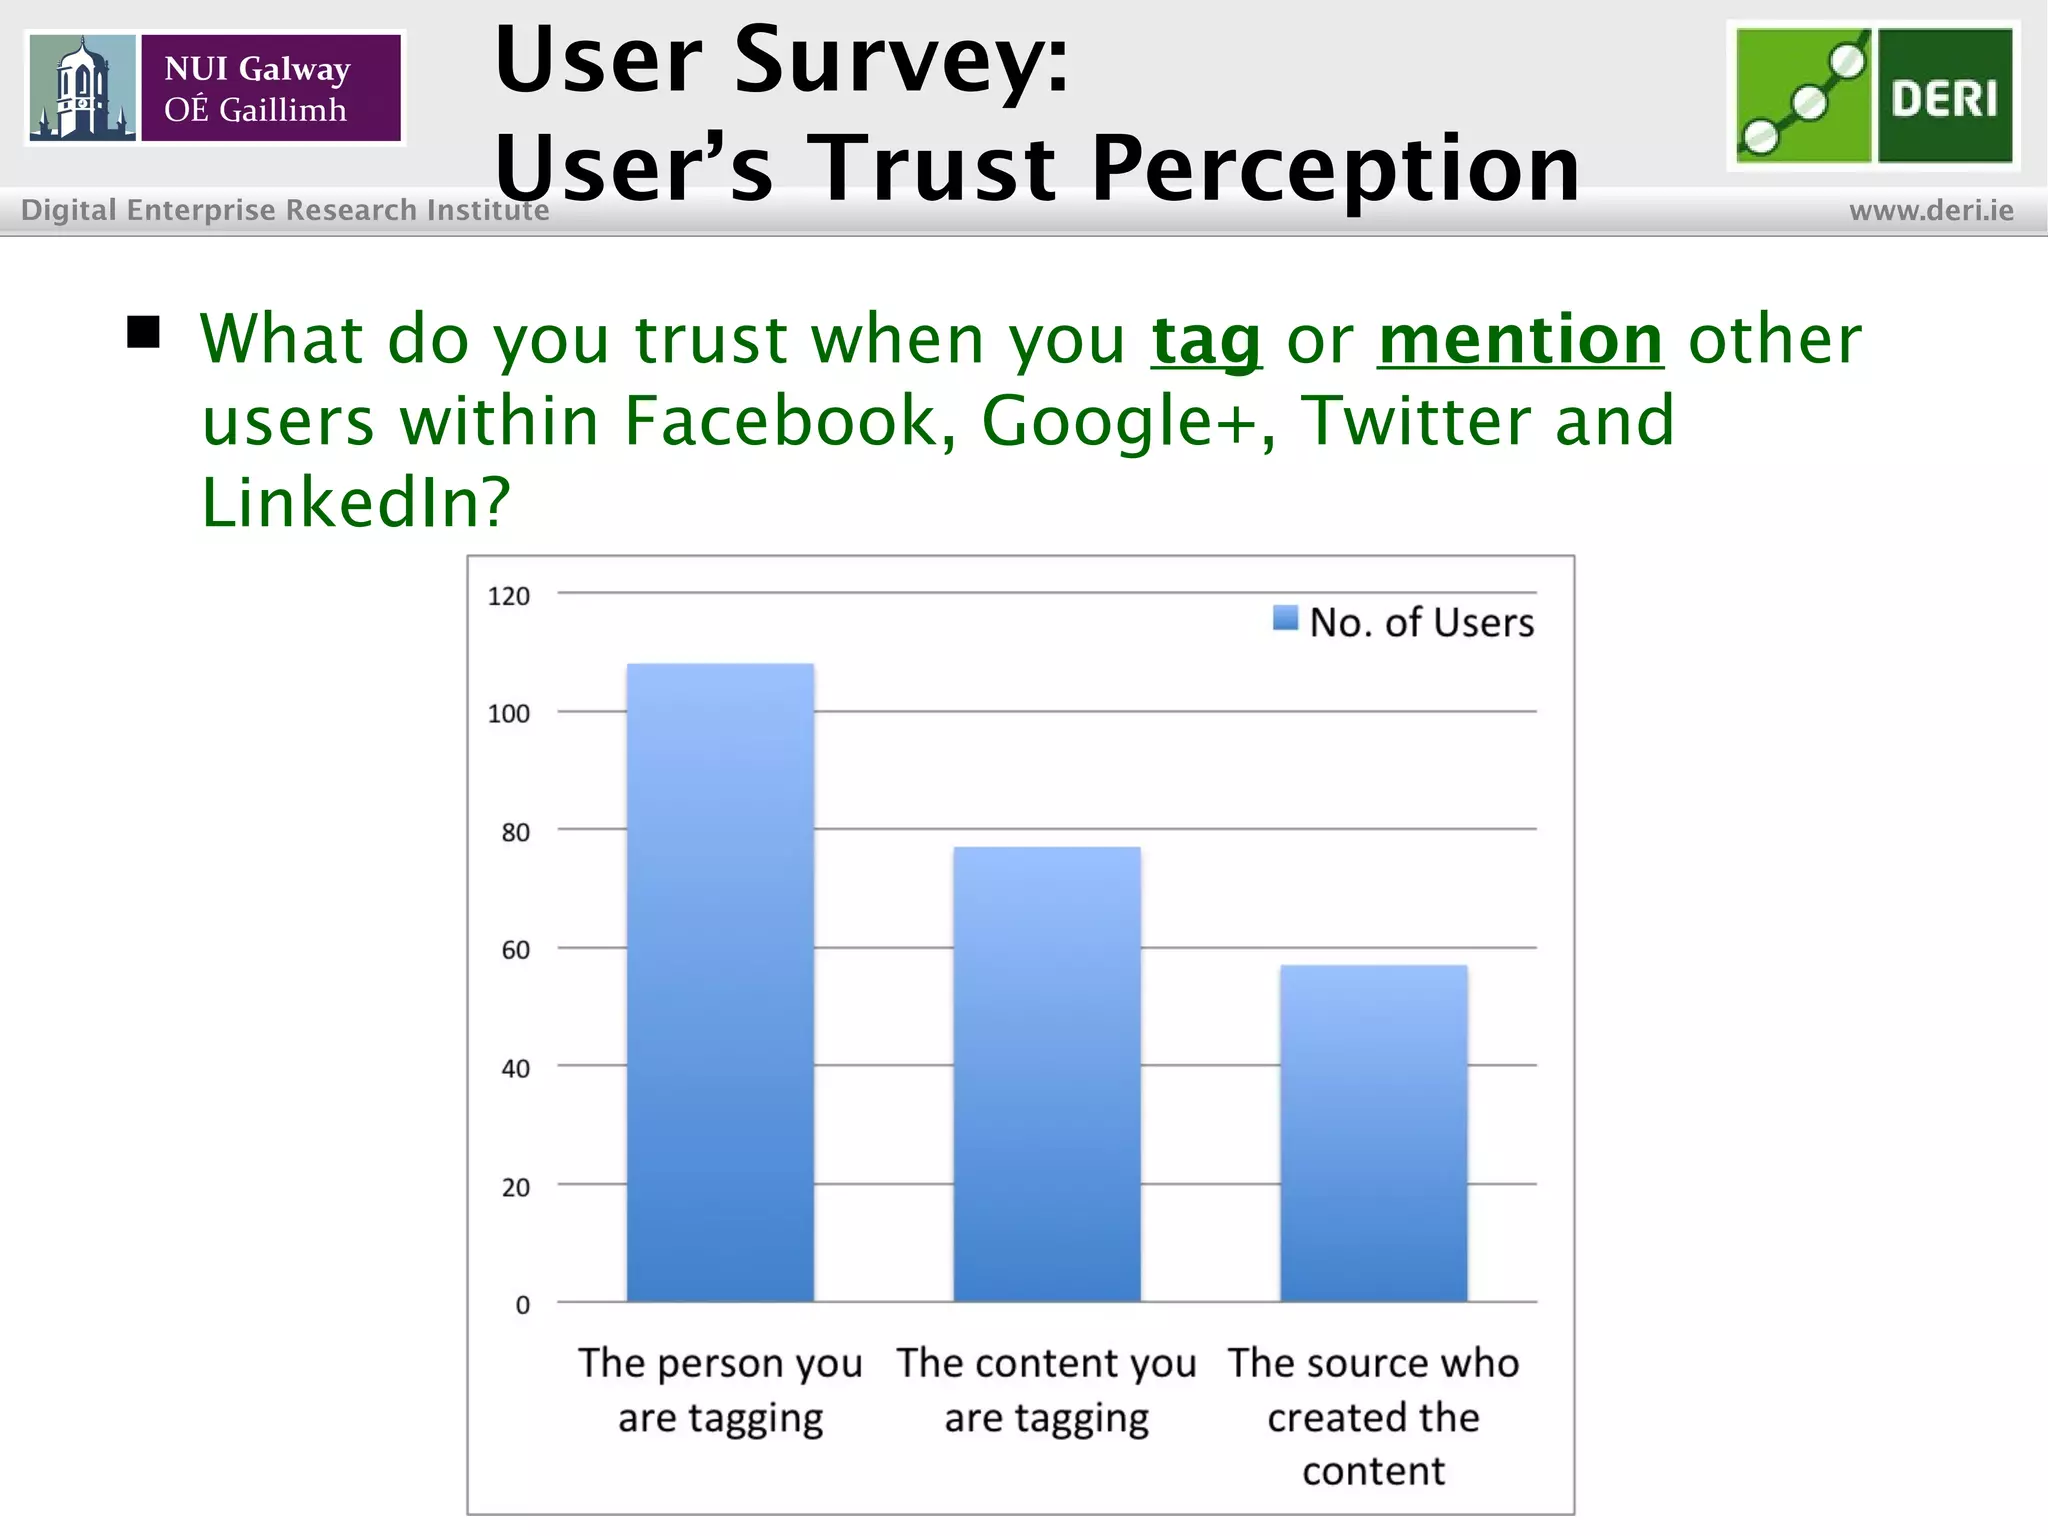
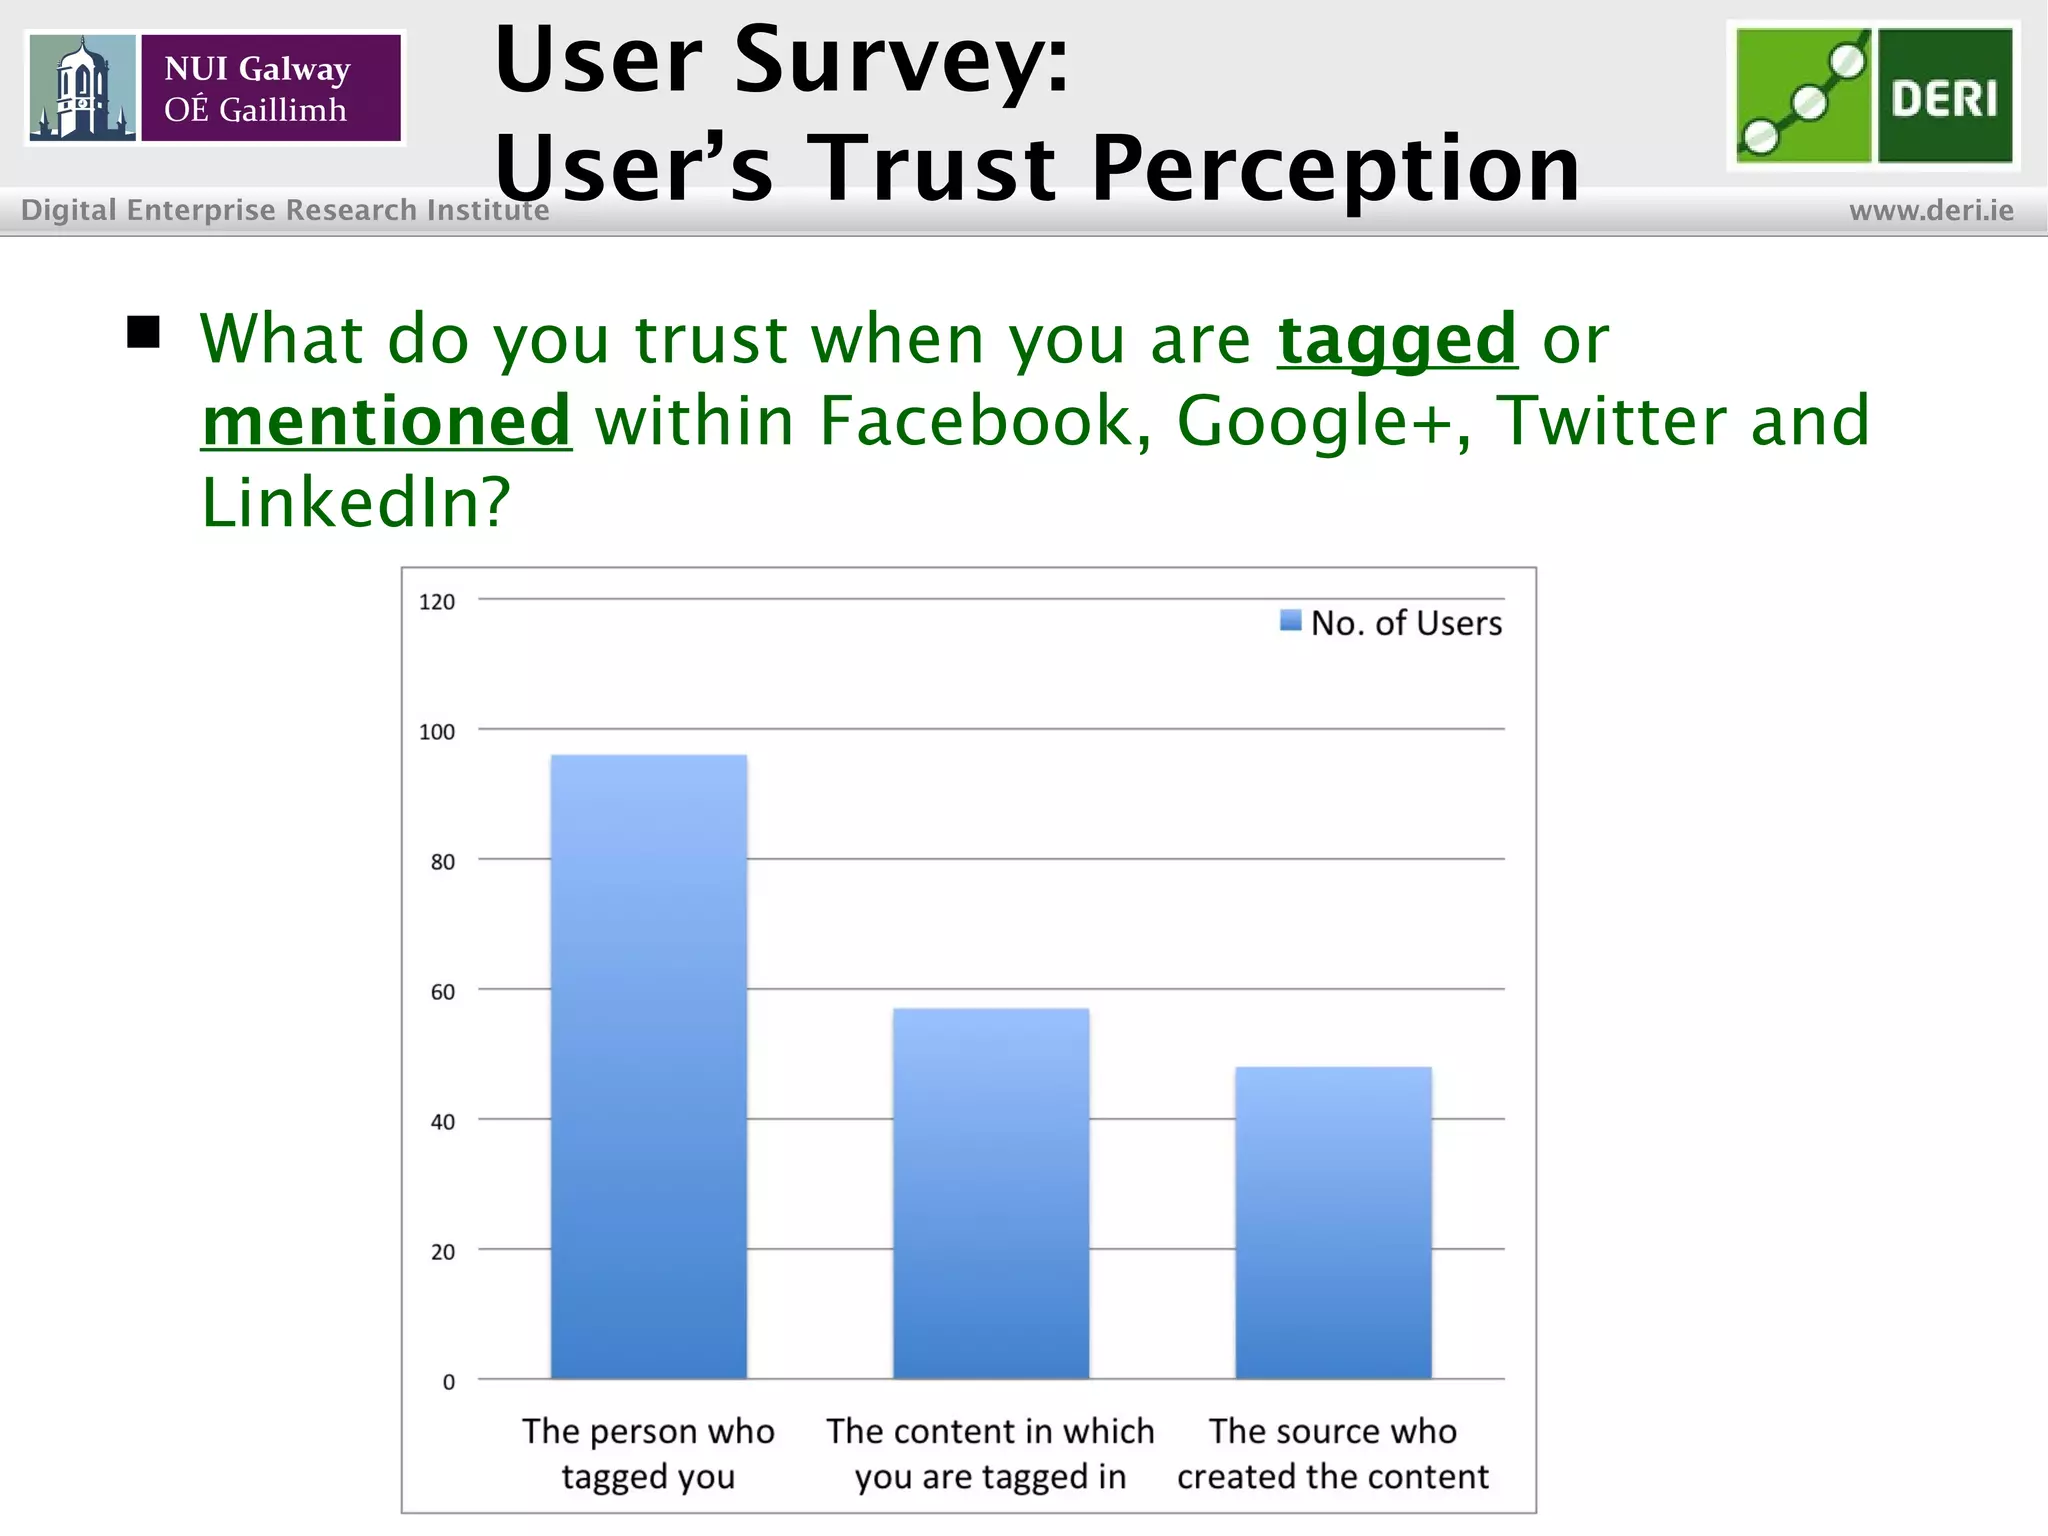
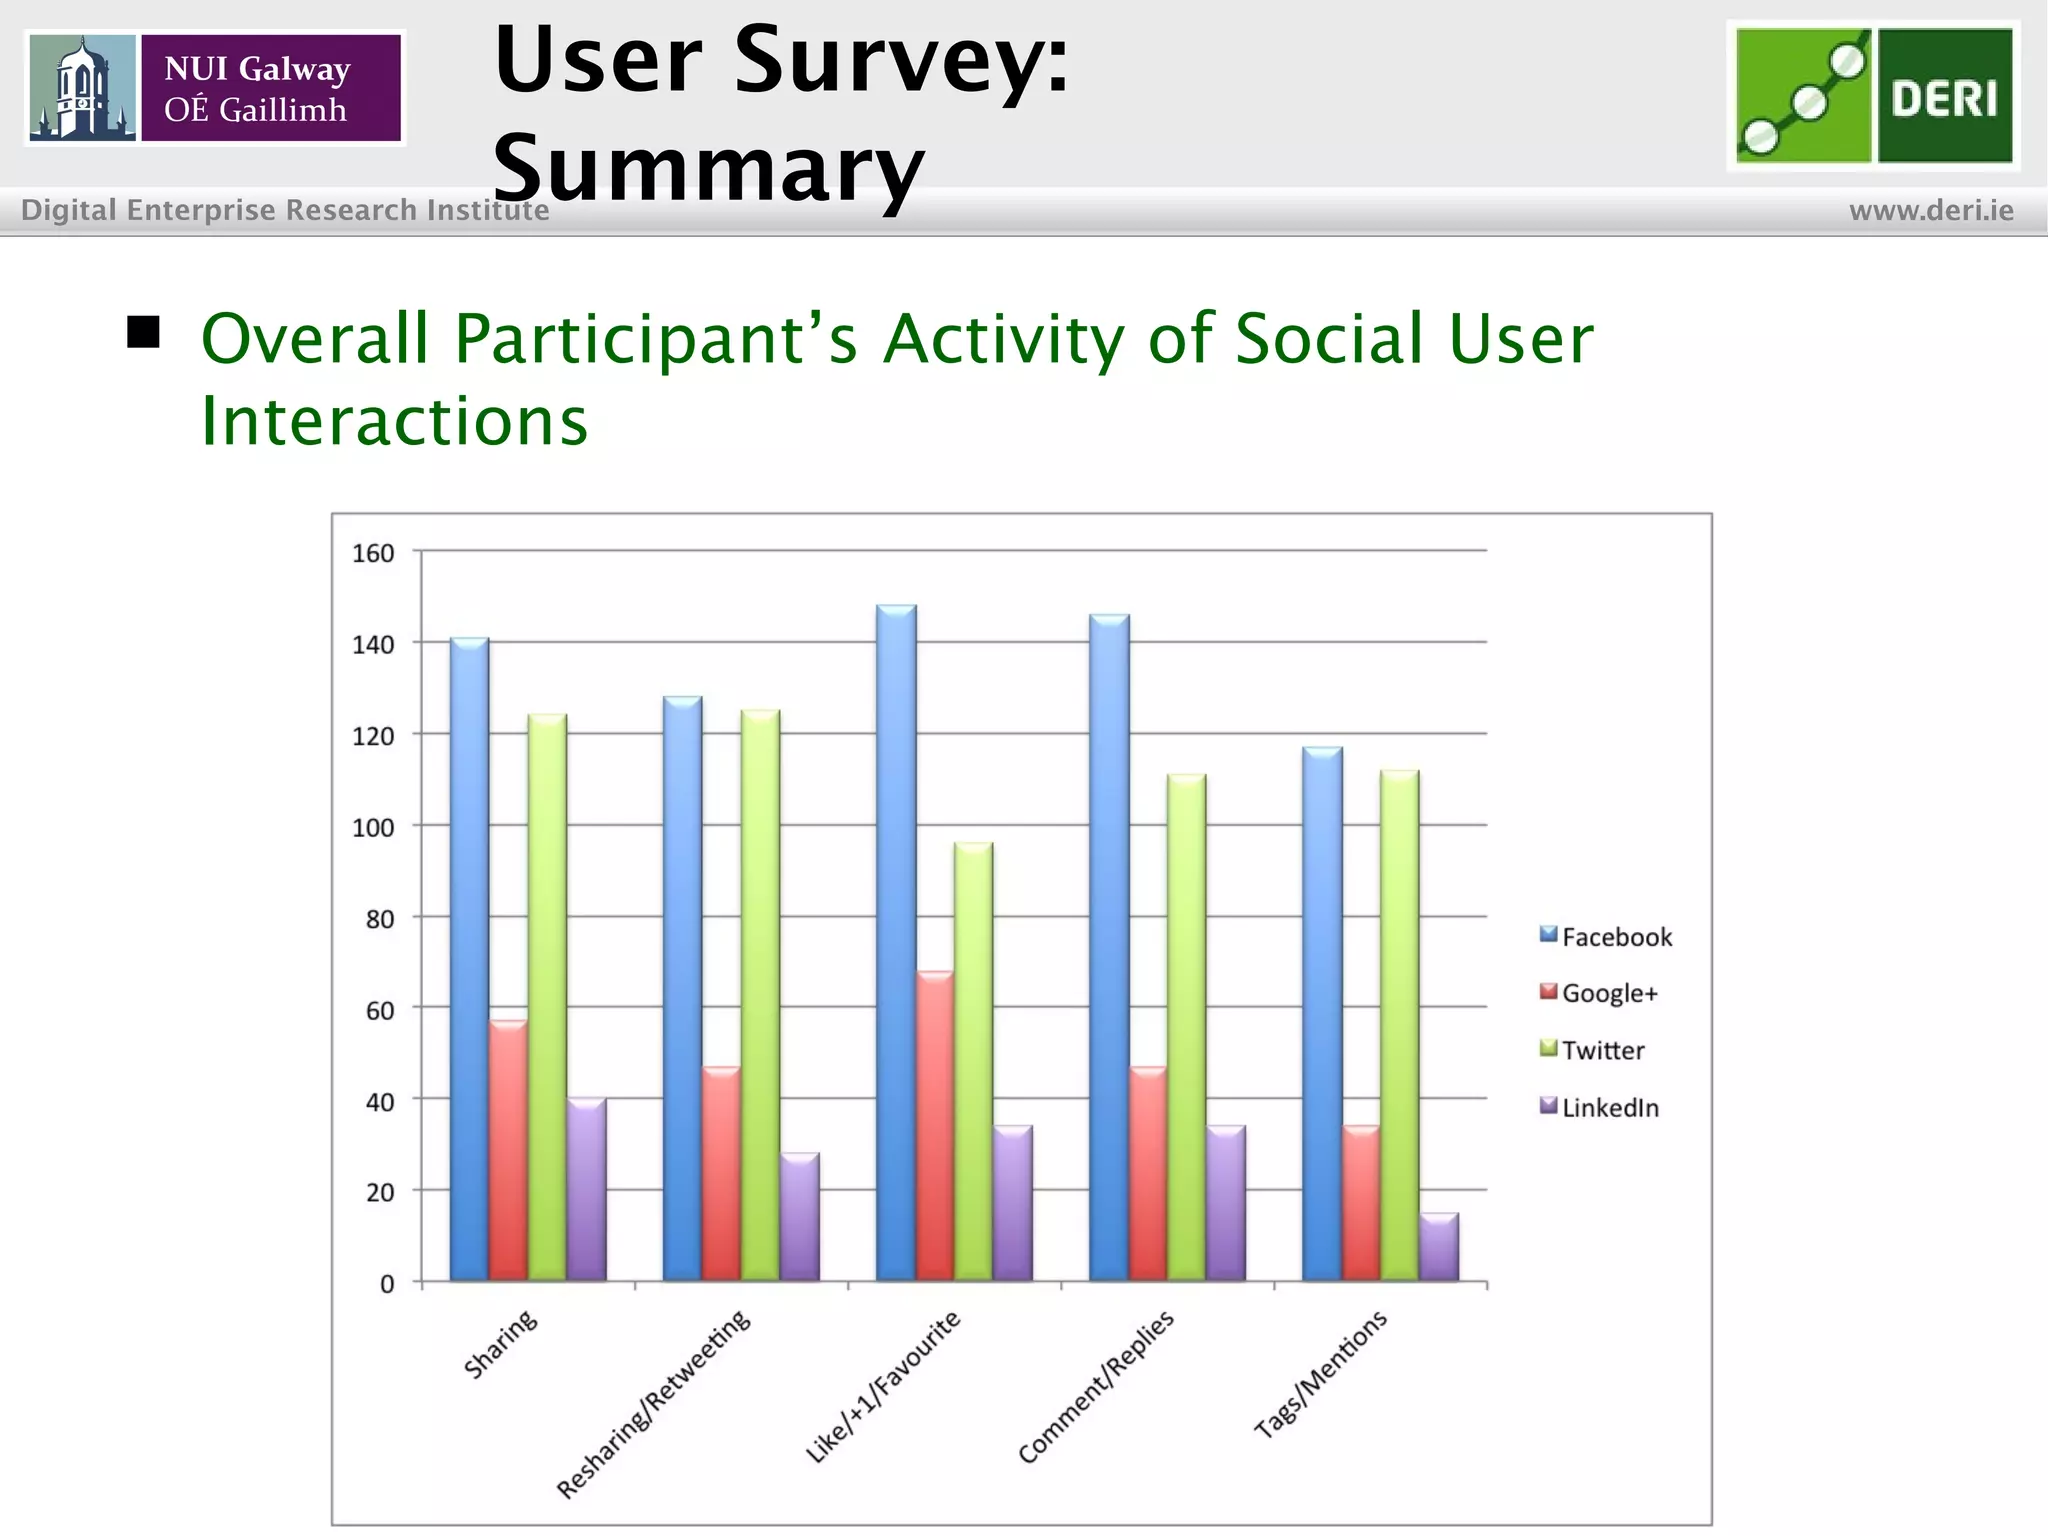
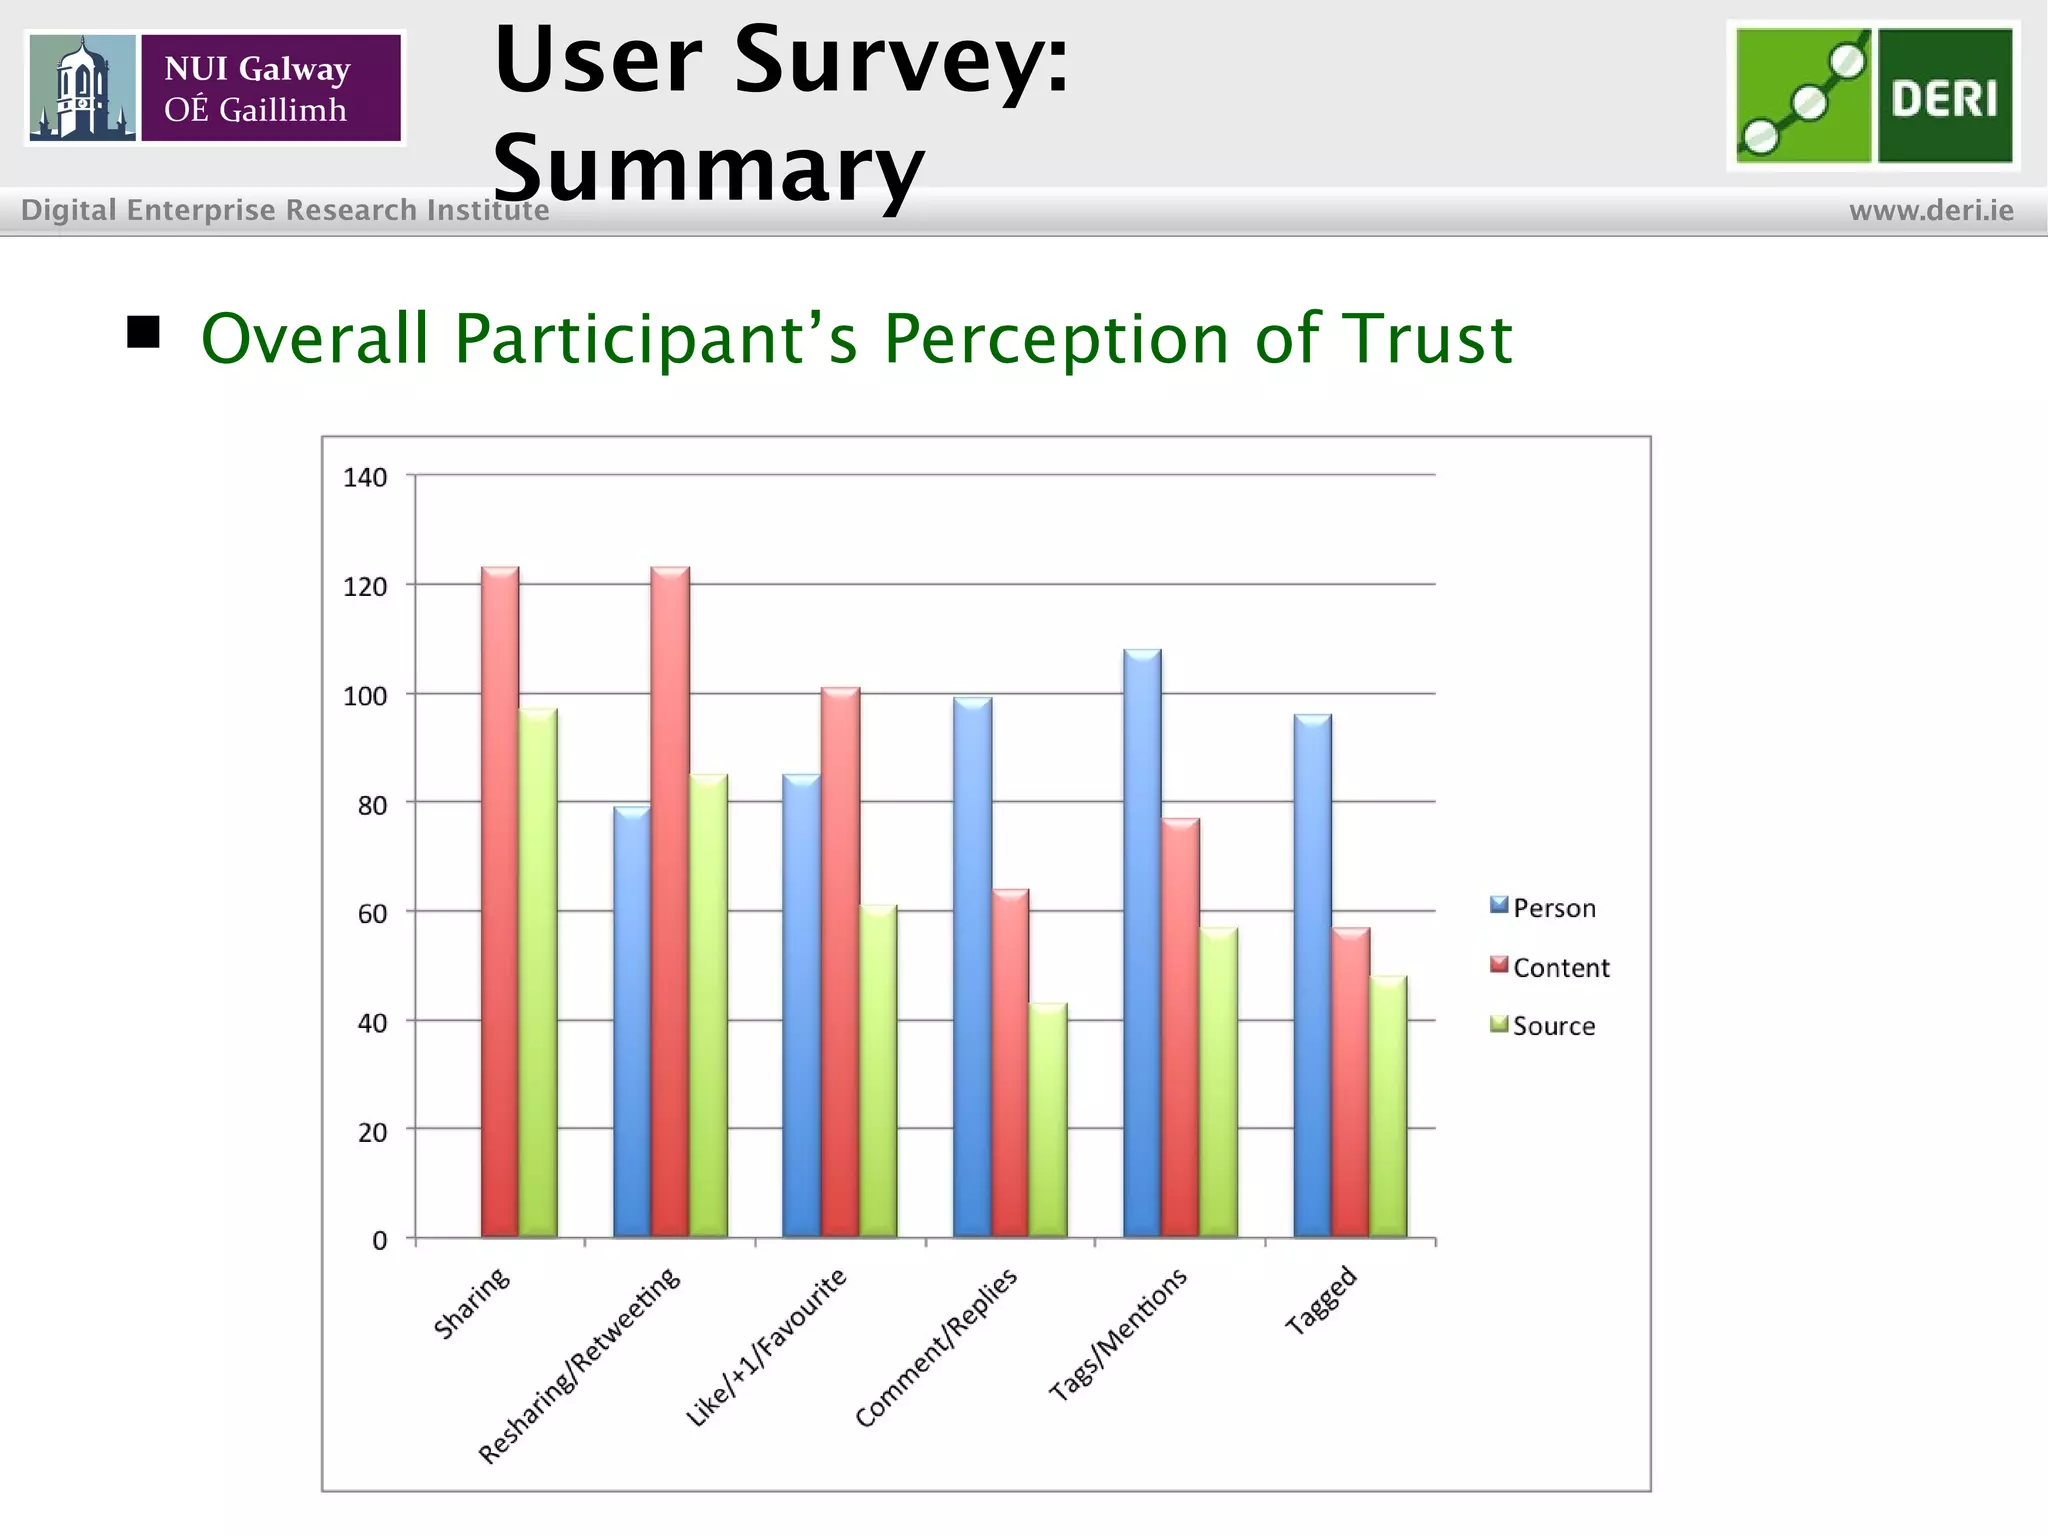
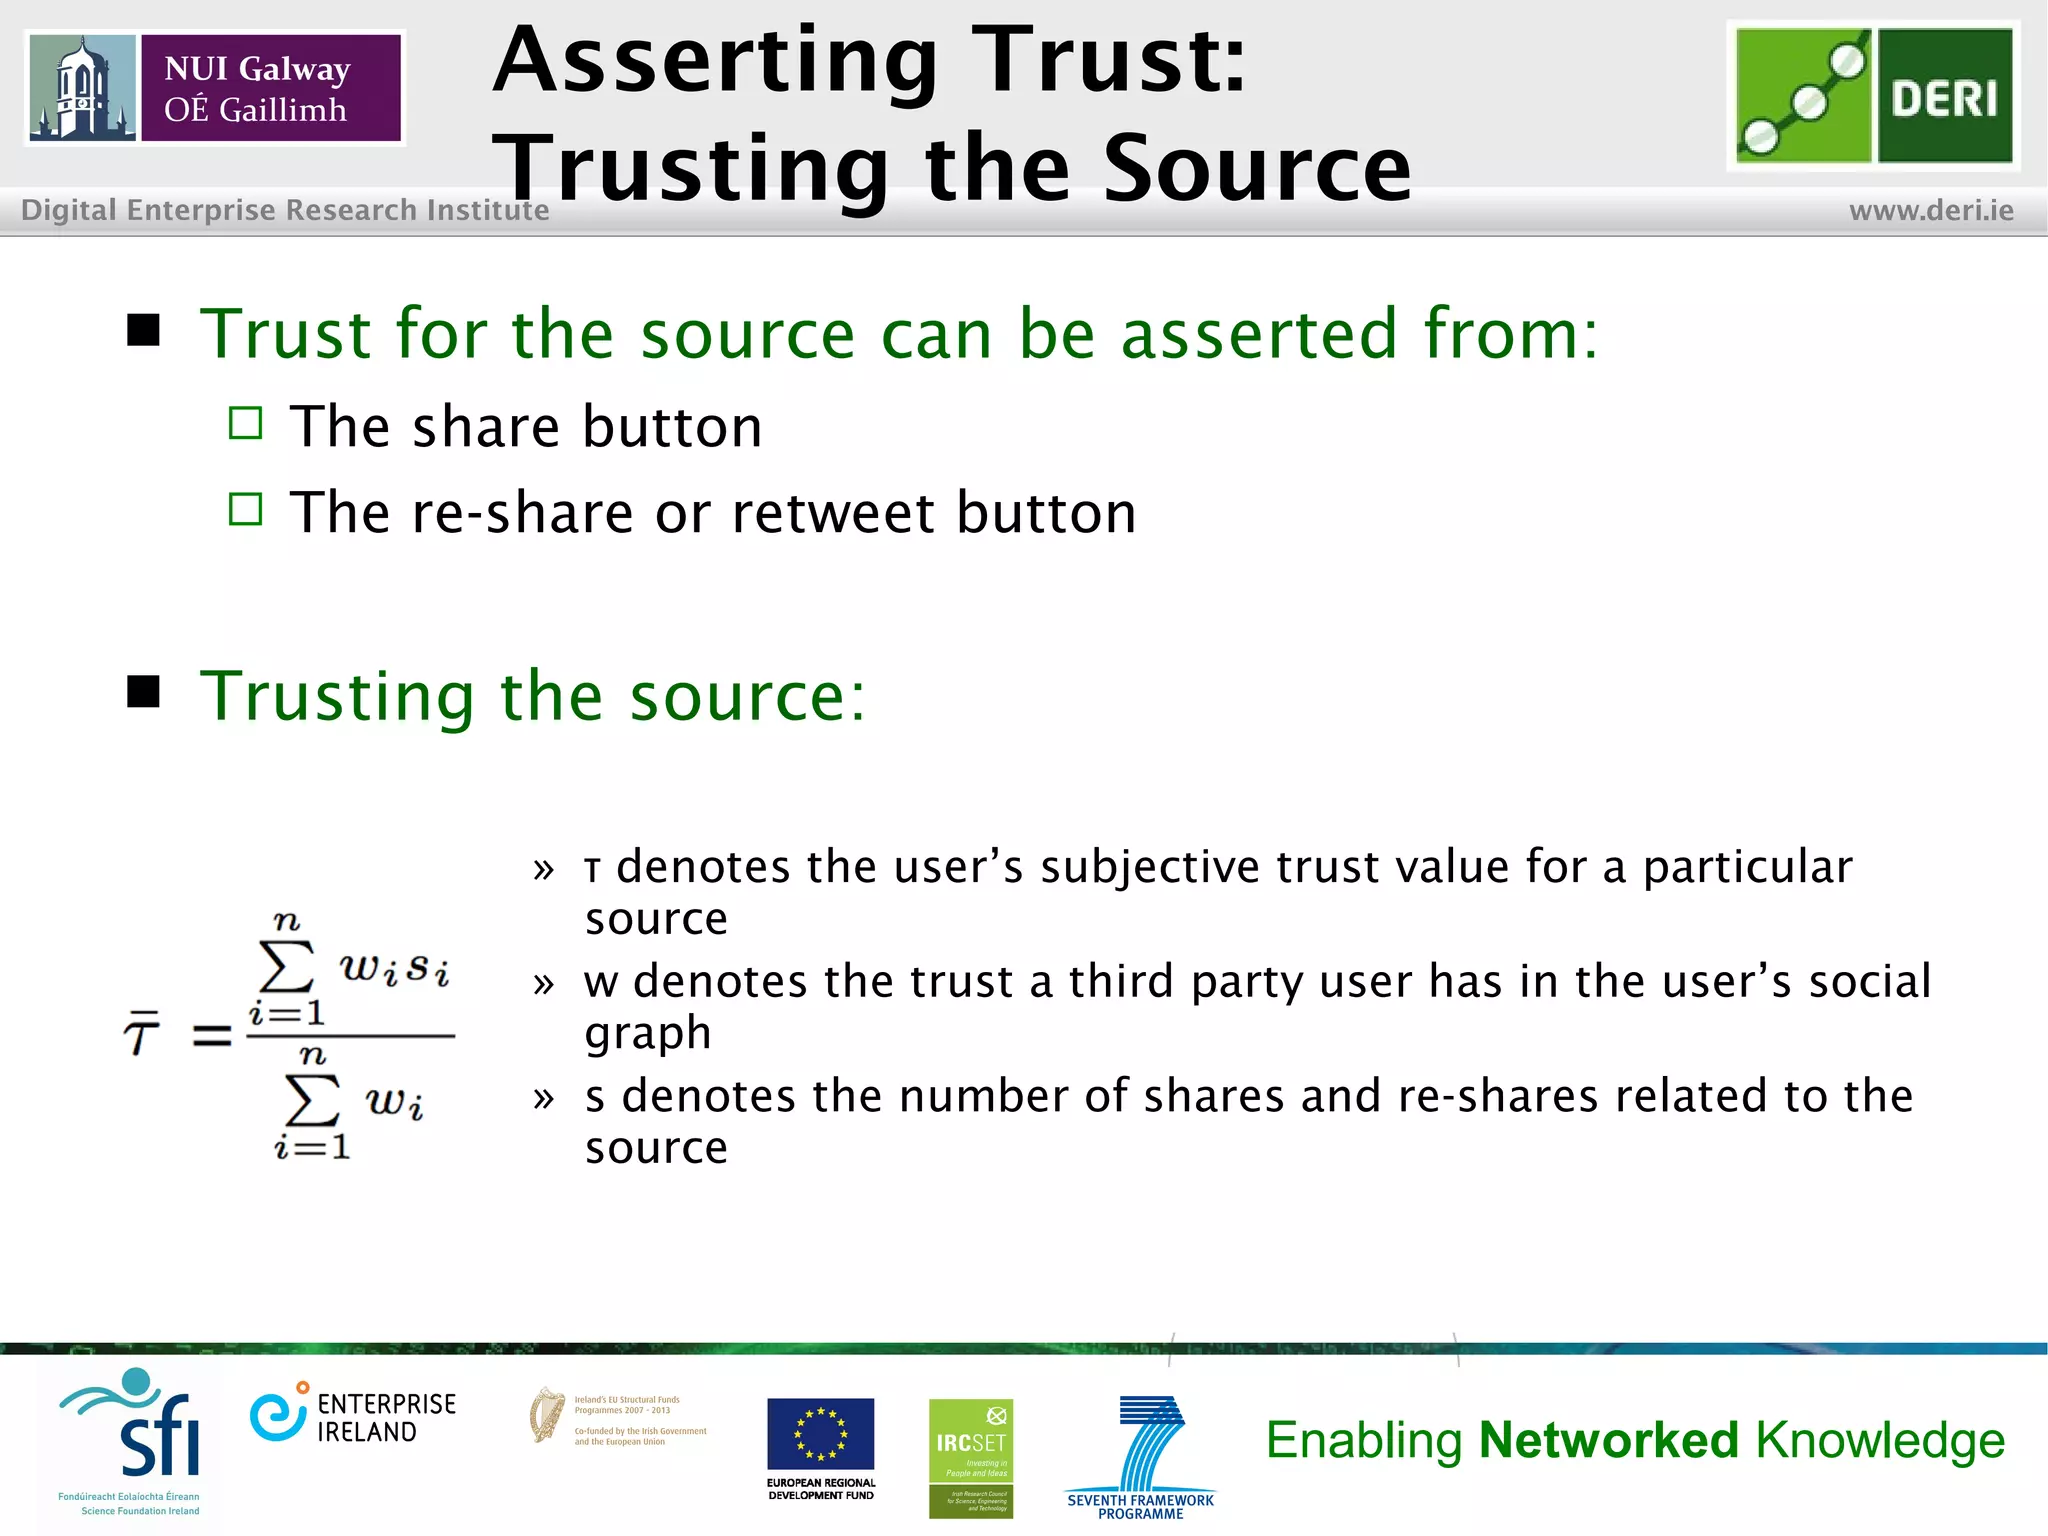
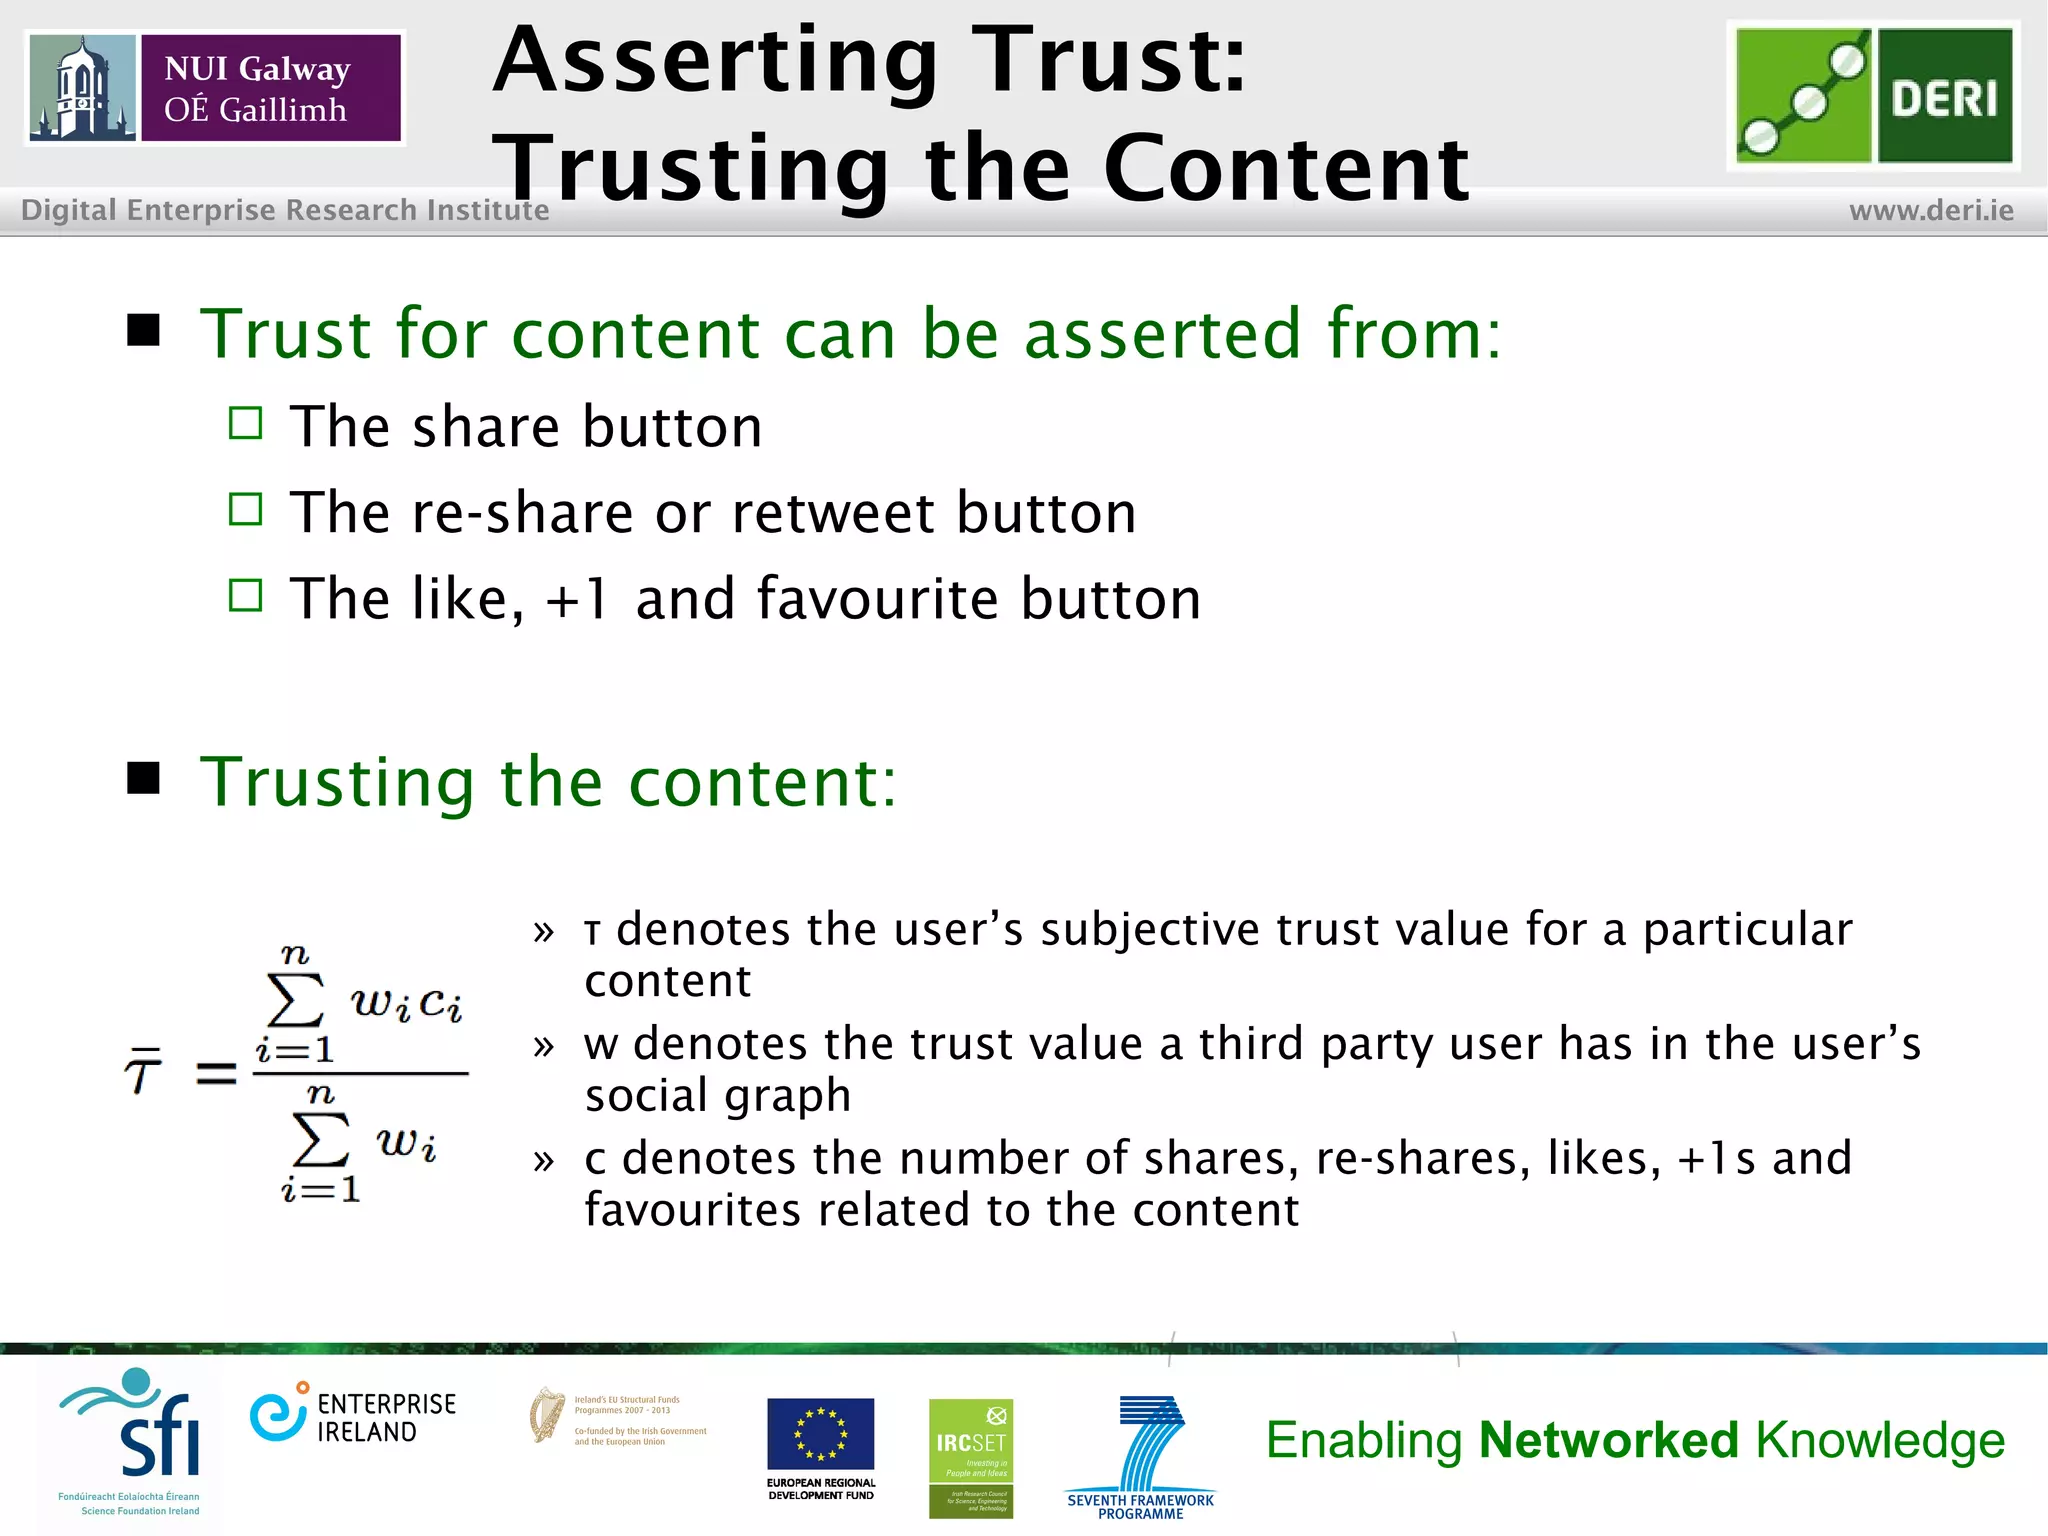
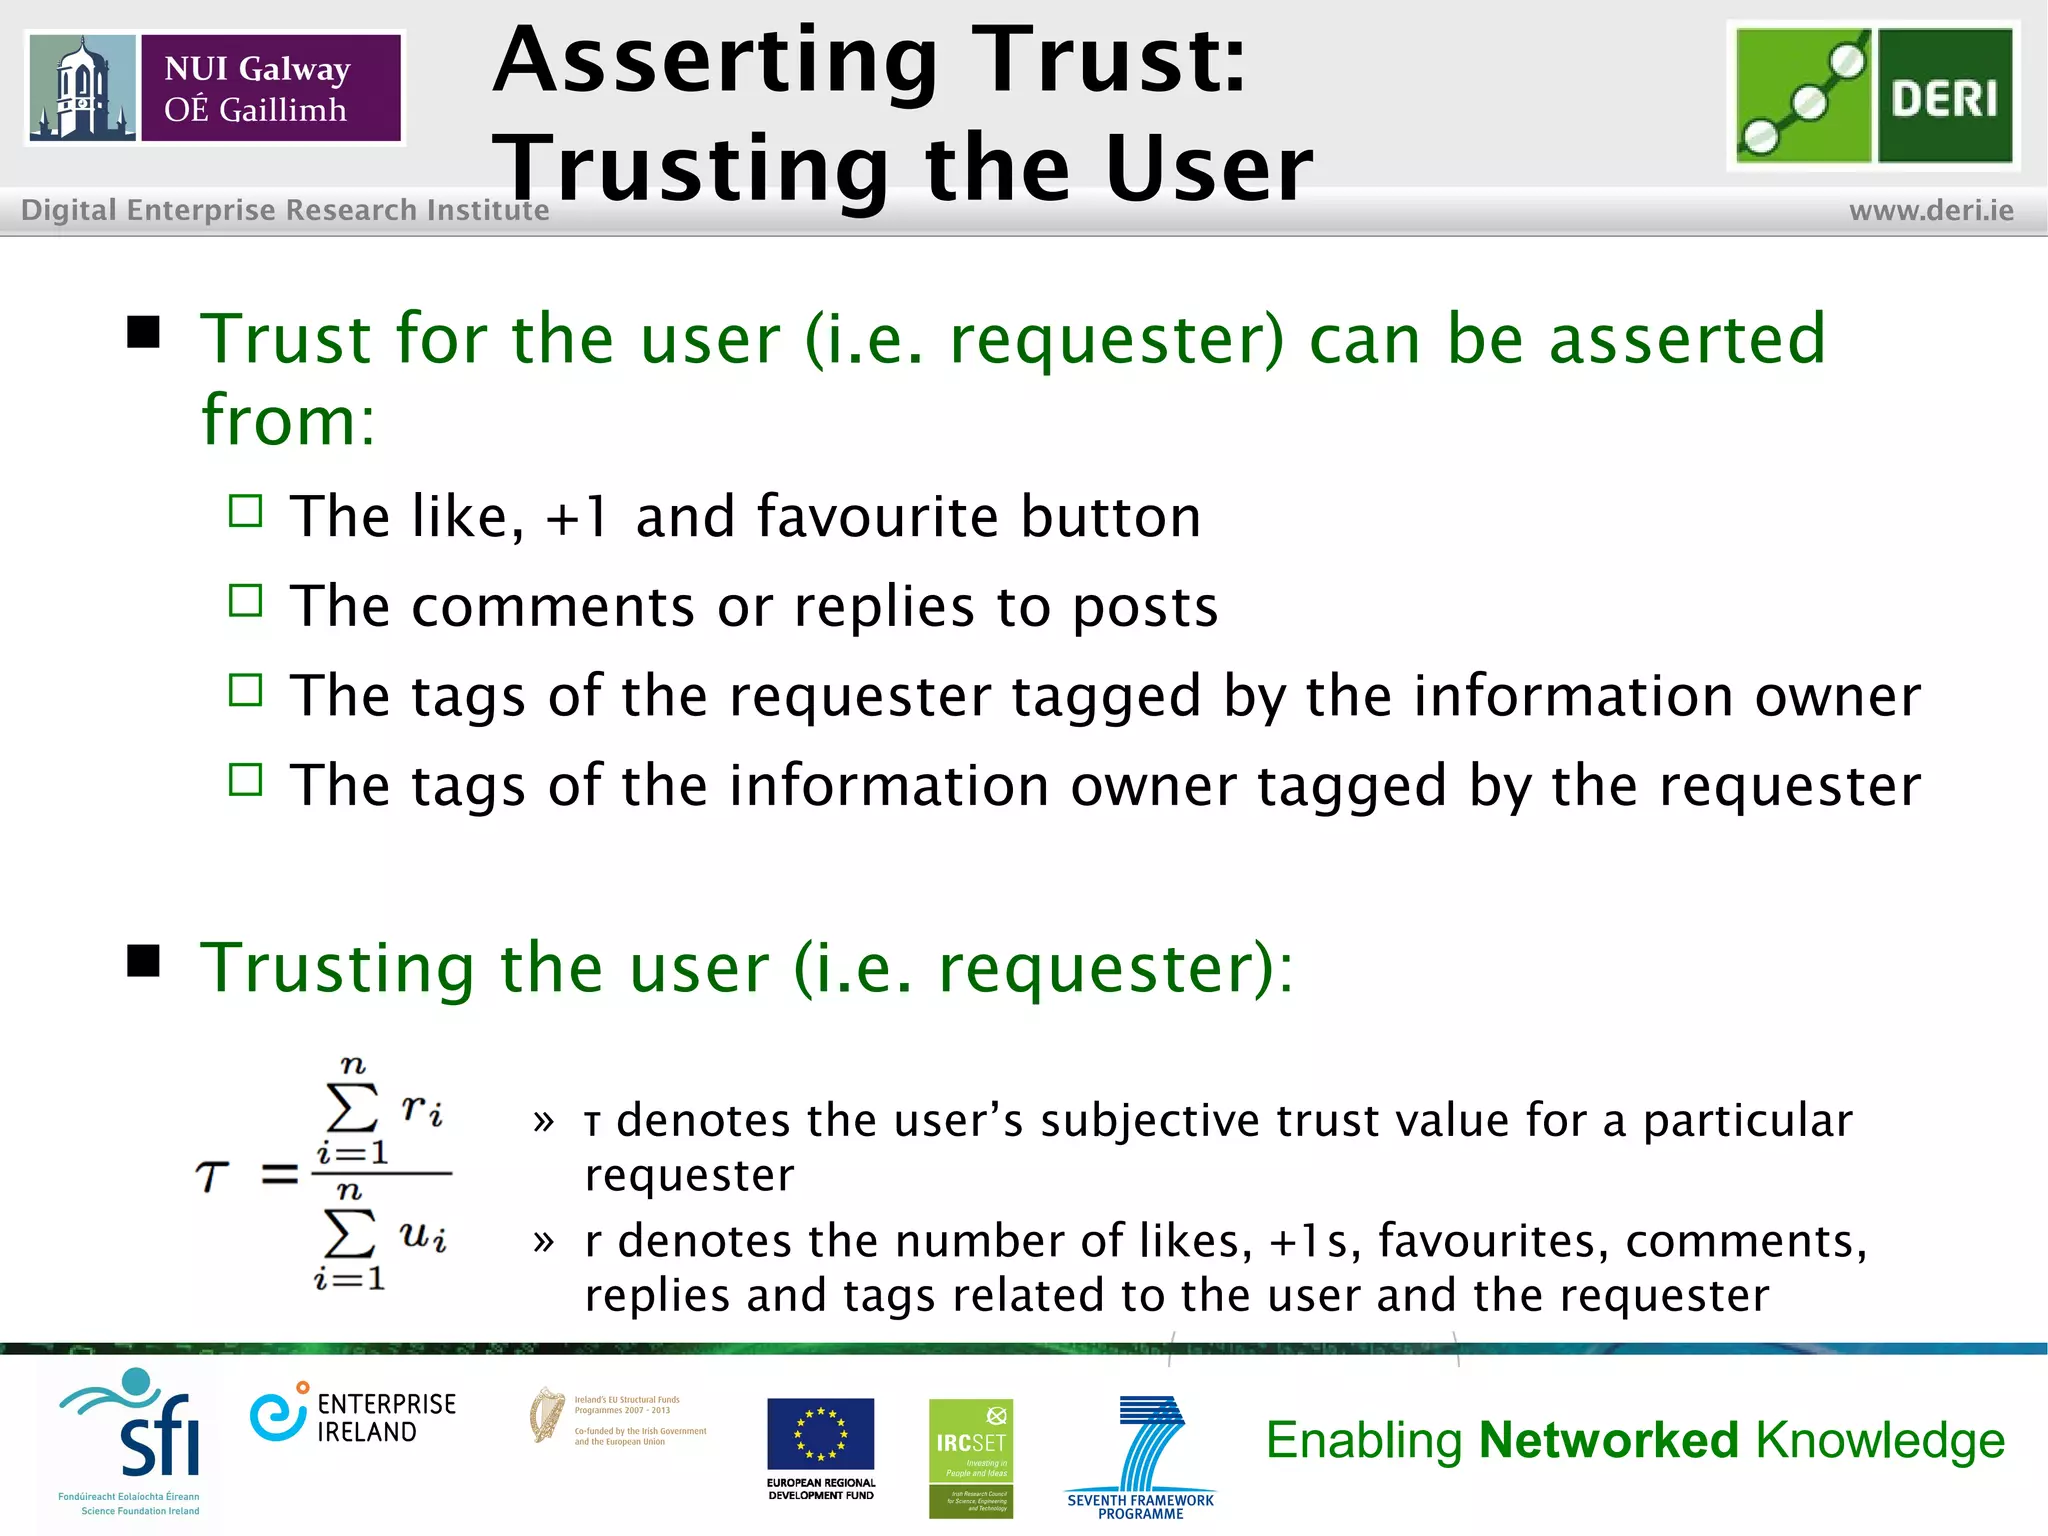
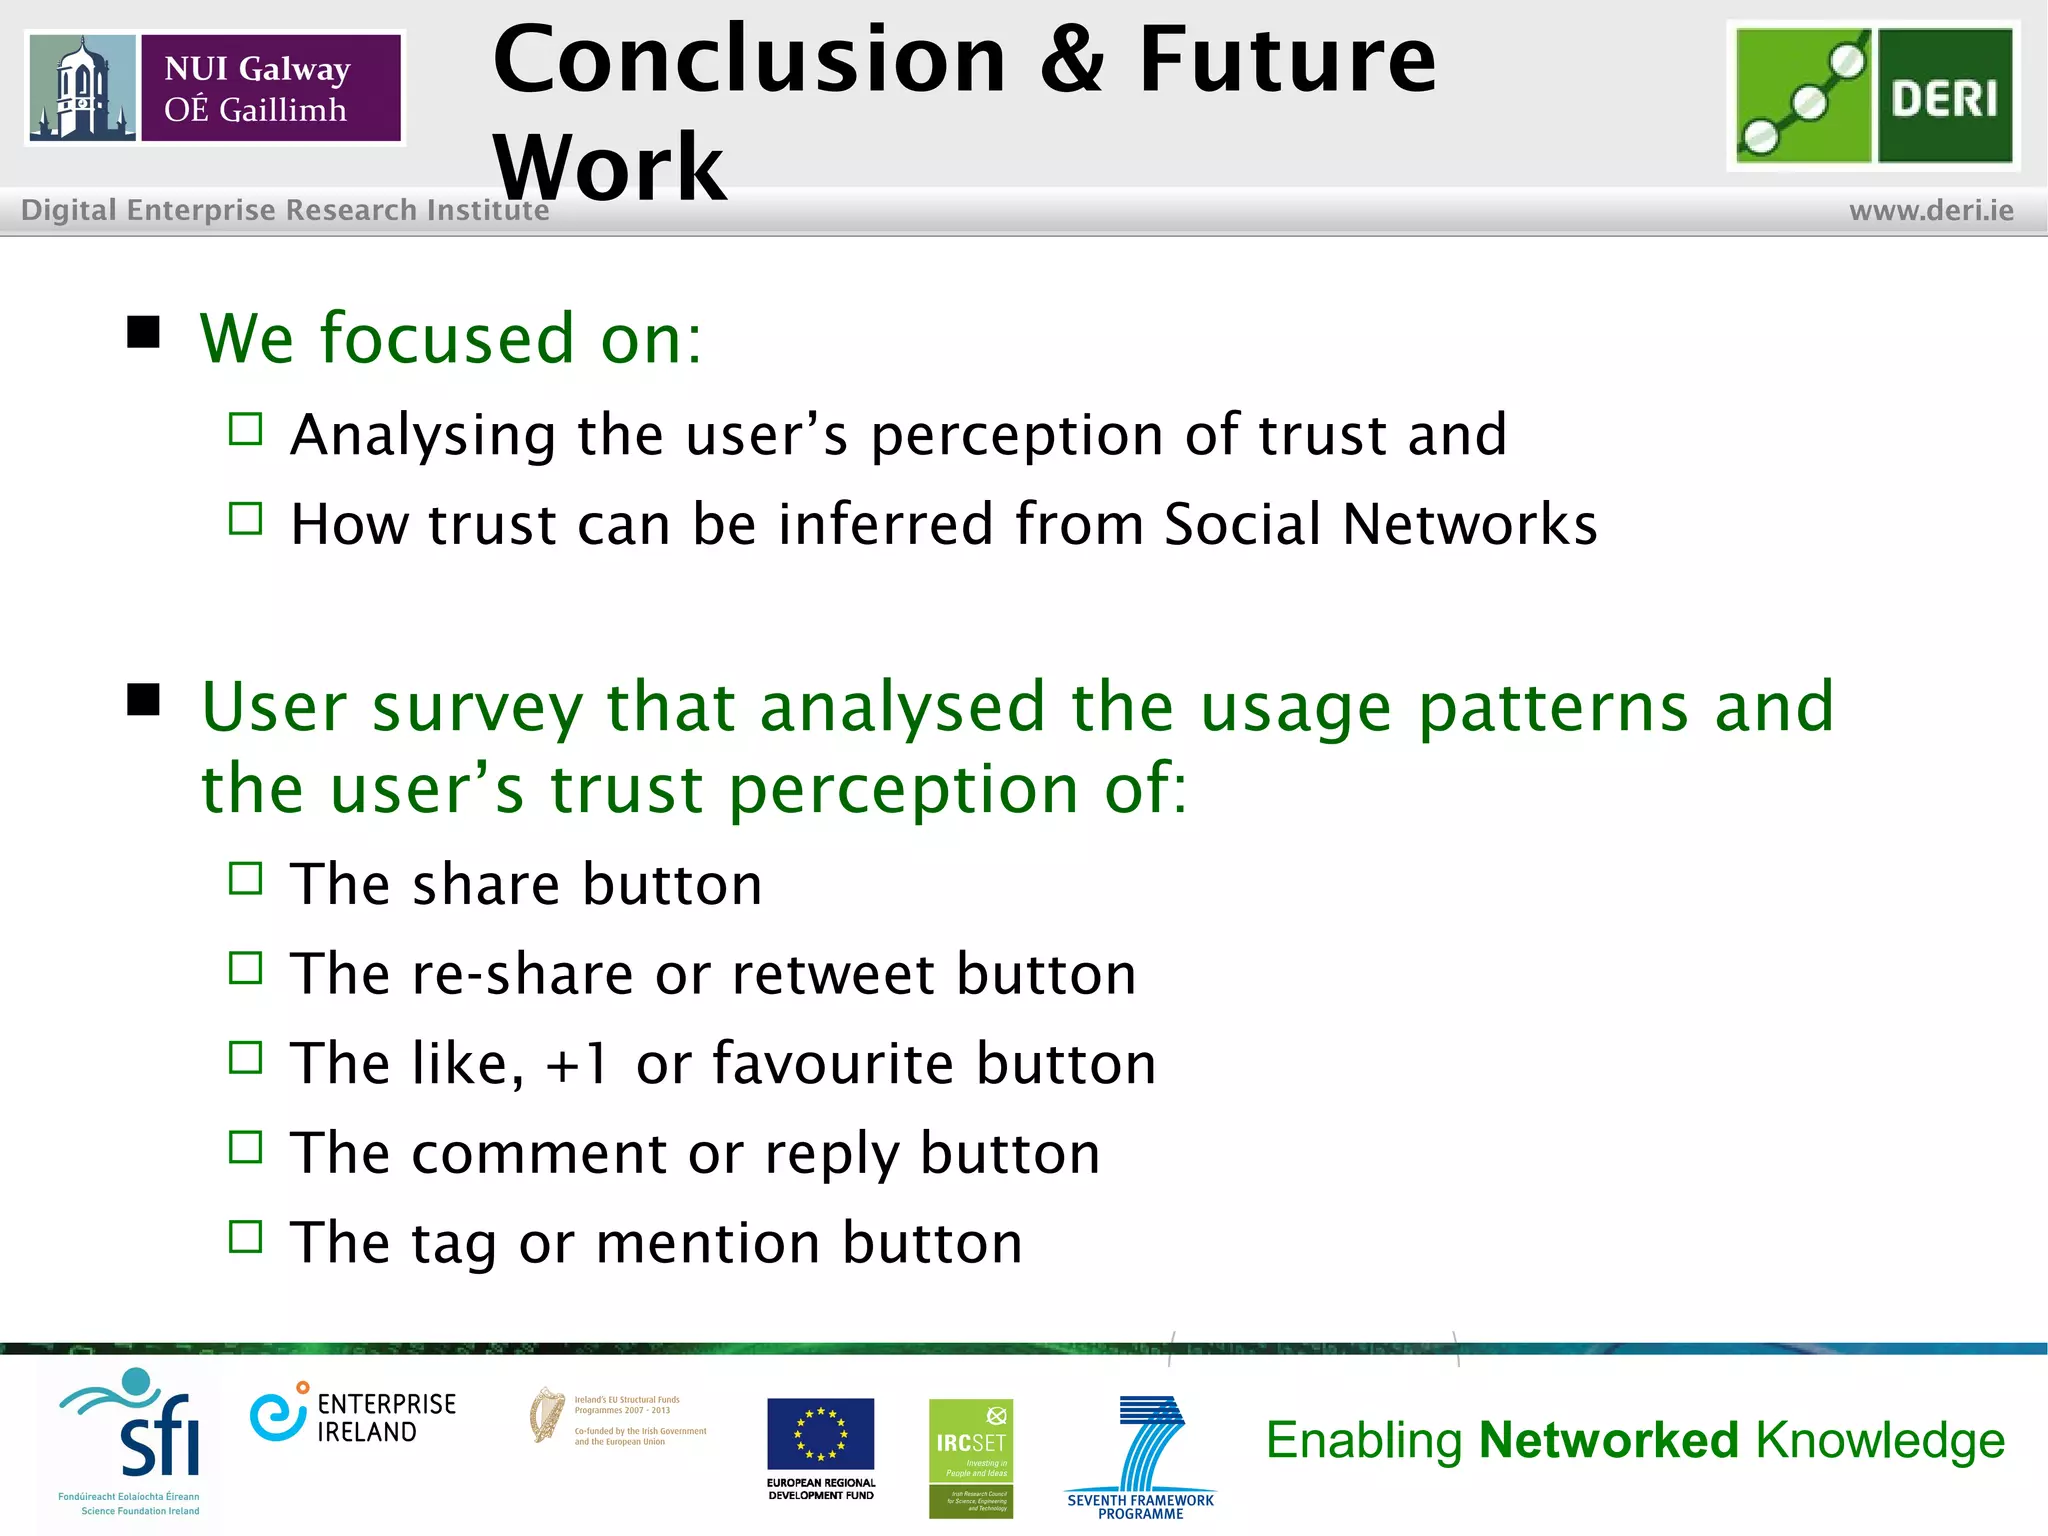
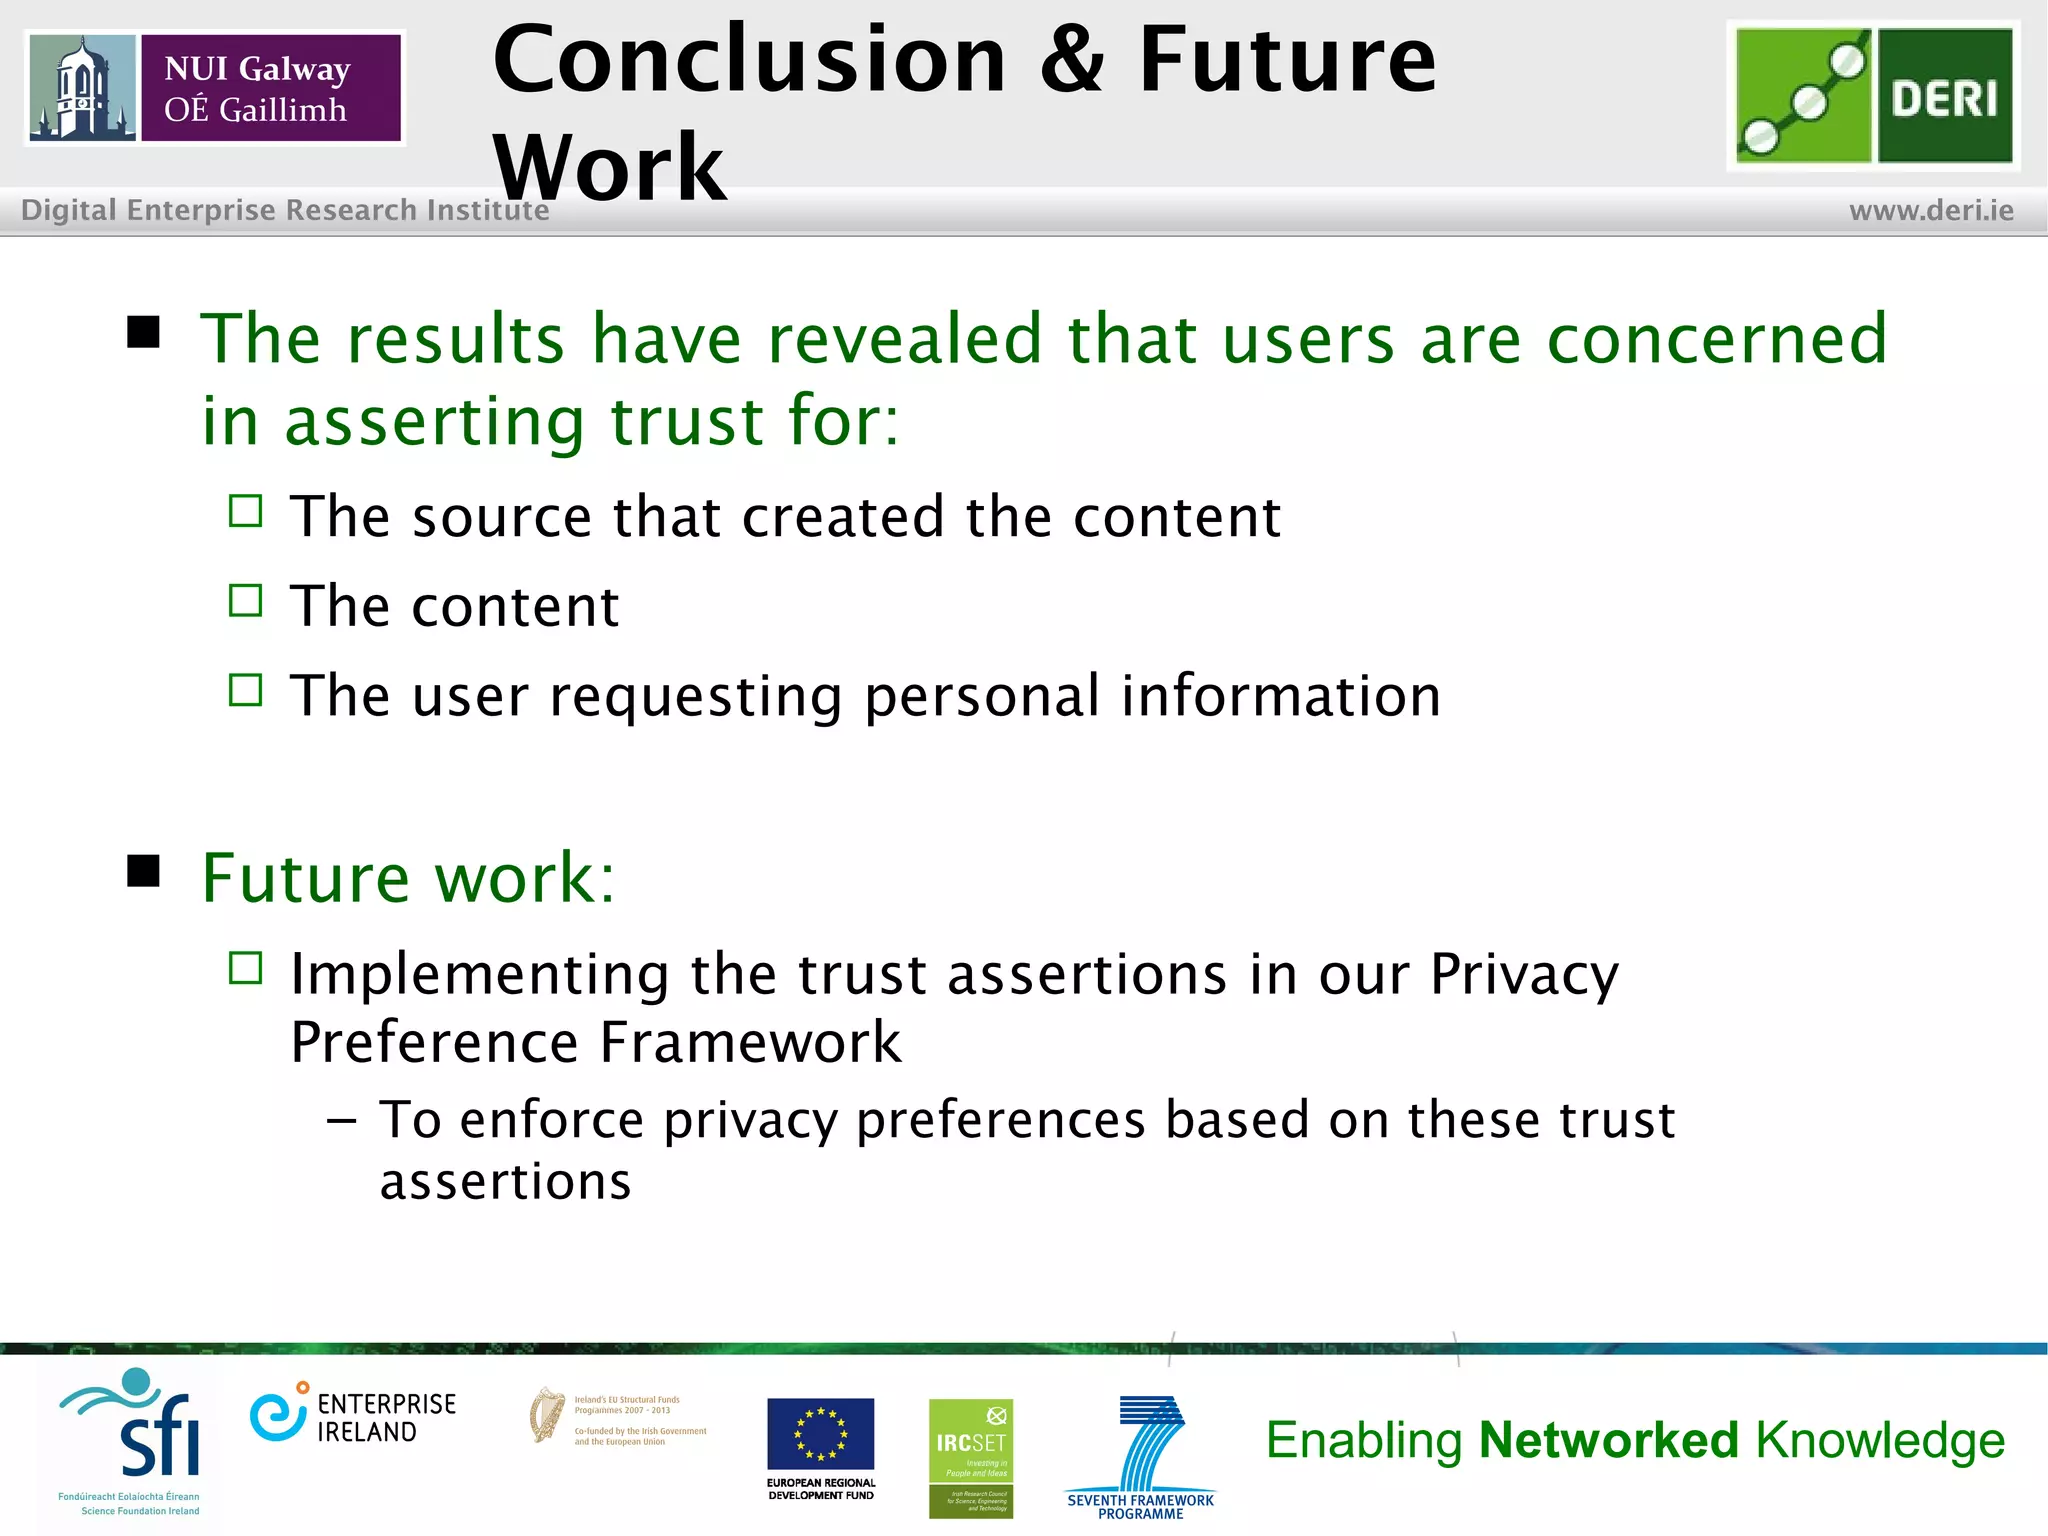

The document discusses research on how trust can be inferred from user interactions within social networks, highlighting the need for privacy settings that account for user trust. A survey of 178 participants explored their social media usage patterns and perceptions of trust regarding various interactions like sharing, liking, and commenting. The findings emphasize the importance of trusting the source, content, and individuals involved in social interactions, with future work aimed at implementing these insights into privacy frameworks.


![Social Media 101 for Not-for-Profits [Webinar]](https://cdn.slidesharecdn.com/ss_thumbnails/socialmedia101-webinar2012-120420013953-phpapp02-thumbnail.jpg?width=640&height=640&fit=bounds)


![Support, Monitoring, Continuous Improvement & Scaling Agentic Automation [3/3]](https://cdn.slidesharecdn.com/ss_thumbnails/agenticcommunityseries-day3-cfd-251120170304-ddef8112-thumbnail.jpg?width=640&height=640&fit=bounds)


![[BDD 2025 - Full-Stack Development] Agentic AI Architecture: Redefining Syste...](https://cdn.slidesharecdn.com/ss_thumbnails/fs-agenticaiarchitectureredefiningsystemcommunication-251124030838-e6c70cc2-thumbnail.jpg?width=640&height=640&fit=bounds)


![[BDD 2025 - Full-Stack Development] The Modern Stack: Building Web & AI Appli...](https://cdn.slidesharecdn.com/ss_thumbnails/fs-themodernstackbuildingwebaiapplicationswithserverless-251124030844-388cf04f-thumbnail.jpg?width=640&height=640&fit=bounds)


