Download as PDF, PPTX


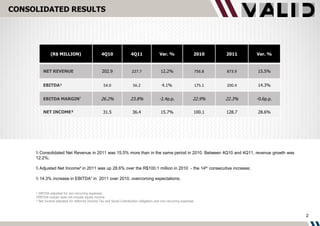
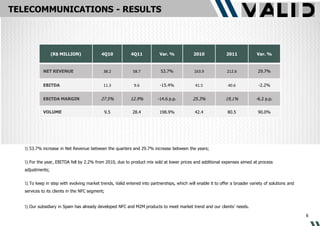


1) Consolidated net revenue grew 15.5% in 2011 over 2010, led by strong increases in the Identification Systems and Telecommunications divisions. 2) Adjusted net income increased 28.6% in 2011 to R$128.7 million, marking the 14th consecutive year of growth. 3) The company proposed paying 80% of adjusted net income for 2011 in dividends, totaling R$65 million to shareholders.


![Getting Started with Apache Spark: Big Data Made Simple [Free Meetup]](https://cdn.slidesharecdn.com/ss_thumbnails/apachesparkgettingstarted-260203175547-8361bcc3-thumbnail.jpg?width=640&height=640&fit=bounds)
