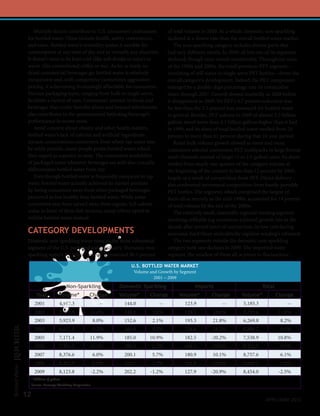
1) Bottled water experienced strong growth through the mid-2000s but saw declining growth and then reductions in volume during the economic downturn of 2008-2009. However, the reductions were smaller than for other beverage categories like carbonated soft drinks and sports drinks.
2) Through the 2000s, bottled water significantly grew its market share compared to carbonated soft drinks. By 2009, bottled water volume was nearly 8.5 billion gallons with 14.5% market share, up from 4.7 billion gallons and 9% market share in 2000.
3) While short-term economic conditions reduced bottled water demand, consumers' strong preference for bottled water over other beverages will support continued
This document describes a method for studying soil decomposition using tea bags. Green tea and rooibos tea bags are buried in soil to compare decomposition rates. After 90 days, the tea bags are removed and weighed to measure weight loss from decomposition by soil organisms. Comparing the faster decomposing green tea to the more recalcitrant rooibos tea allows calculation of a tea bag index that provides information about the soil's ability to decompose organic matter and release nutrients for plant growth. The simple method provides a standardized way to assess and compare decomposition across different soil types and conditions.
The document discusses designing teams and processes to adapt to changing needs. It recommends structuring teams so members can work within their competencies and across projects fluidly with clear roles and expectations. The design process should support the team and their work, and be flexible enough to change with team, organization, and project needs. An effective team culture builds an environment where members feel free to be themselves, voice opinions, and feel supported.
UX, ethnography and possibilities: for Libraries, Museums and ArchivesNed Potter
1) The document discusses how the University of York Library has used various user experience (UX) techniques like ethnographic observation and interviews to better understand user needs and behaviors.
2) Some changes implemented based on UX findings include installing hot water taps, changing hours, and adding blankets - aimed at improving the small details of user experience.
3) The presentation encourages other libraries, archives and museums to try incorporating UX techniques like behavioral mapping and cognitive interviews to inform design changes that enhance services for users.
An immersive workshop at General Assembly, SF. I typically teach this workshop at General Assembly, San Francisco. To see a list of my upcoming classes, visit https://generalassemb.ly/instructors/seth-familian/4813
I also teach this workshop as a private lunch-and-learn or half-day immersive session for corporate clients. To learn more about pricing and availability, please contact me at http://familian1.com
3 Things Every Sales Team Needs to Be Thinking About in 2017Drift
Thinking about your sales team's goals for 2017? Drift's VP of Sales shares 3 things you can do to improve conversion rates and drive more revenue.
Read the full story on the Drift blog here: http://blog.drift.com/sales-team-tips
How to Become a Thought Leader in Your NicheLeslie Samuel
Are bloggers thought leaders? Here are some tips on how you can become one. Provide great value, put awesome content out there on a regular basis, and help others.
The document provides an overview of the 2013 Britvic Soft Drinks Review, which analyzes the performance of the UK soft drinks market in 2012. It reports that the grocery, convenience and impulse channel saw value sales growth of 2.8% to £7.21 billion, while the pubs and clubs channel saw value growth of 1.5% to £2.73 billion. It also summarizes some of the key trends in the different channels, including strong growth of energy drinks and water plus brands, and a shift toward more affordable late-night venues in the pubs and clubs sector.
This document provides a strategic marketing plan for a new bottled water called OXYwater. It begins with an in-depth market analysis of the beverage industry and bottled water category. It finds bottled water is the second largest beverage segment and consumption is steadily rising. The document then analyzes bottled water as a business, identifying business models and product types. It also provides a competitive analysis, identifying direct, indirect, and landscape competitors. Key target markets for OXYwater are identified as athletes, mothers/children, hungover drinkers, and health conscious consumers. The document concludes with a forecast of continued growth in the bottled water market.
The bottled water category in India has experienced significant growth in recent years driven by factors such as rising health awareness, urbanization, and tourism. Bottled water offers convenience compared to tap water due to concerns over quality and safety. Key players dominate the market while new entrants face challenges of distribution and brand loyalty. The market is projected to continue growing substantially in the coming years given India's young population and increasing disposable incomes.
Fiji Water is facing several strategic issues including economic challenges from the recession, environmental concerns about packaging waste, and questions about the socio-economic impact of its operations. Shifting consumer trends around health, sustainability, and price sensitivity have negatively impacted sales. Fiji Water has strengths in its brand awareness and distribution, but weaknesses in its remote sourcing location and declining resources. It must adapt to trends through initiatives like testing water quality, using sustainable packaging, and leveraging its charitable foundation to improve its image while exploring new product opportunities.
Author of “The Future of Water” and a long-time strategic consultant and transactional advisor to the water industry, Maxwell will review current challenges and opportunities in the world water market, and will highlight four critical trends which will increasingly categorize the water business and water decision-making over the longer-term future.
The document analyzes the demand and supply factors of the packaged drinking water industry in India. On the demand side, key drivers include a shortage of safe drinking water, increasing consumer awareness and purchasing power, and growth in domestic and foreign tourism. Supply is boosted by low production costs due to unregulated groundwater extraction. However, supply faces challenges from archaic laws, scarcity of raw materials like water, and issues with availability of labor, transportation and power. The packaged drinking water industry has experienced significant growth over the past decade and is expected to continue expanding.
Bottled water More than just a story about sales growth; Stringen.docxAASTHA76
Bottled water: More than just a story about sales growth; Stringent federal, state and industry standards help ensure safety, quality and good taste. (2007, April 9). PR Newswire. Retrieved October 8, 2009, from ProQuest Newsstand. (Document ID: 1251895191).
Abstract
The International Bottled Water Association (IBWA) is the authoritative source of information about all types of bottled waters. Founded in 1958, IBWA's membership includes U.S. and international bottlers, distributors and suppliers. IBWA is committed to working with the U.S. Food and Drug Administration (FDA), which regulates bottled water as a packaged food product, and state governments to set stringent standards for safe, high quality bottled water products. Additionally, IBWA requires member bottlers to adhere to the IBWA Bottled Water Code of Practice, which mandates additional standards and practices, that in some cases, are more stringent than federal and state regulations. A key feature of the IBWA Model Code is an annual unannounced plant inspection by an independent, third party organization. For more information about IBWA, bottled water and a list of member's brands, please contact IBWA Manager of Communications Tom Gardner at 703-647-4607 or [email protected]
Full Text
·
ALEXANDRIA, Va., April 9 /PRNewswire-USNewswire/ -- The InternationalBottled Water Association (IBWA), in conjunction with Beverage MarketingCorporation (BMC), today released bottled water statistics for the year 2006,compiled by BMC. These numbers show that U.S. bottled water sales andconsumption continue to rise, as consumers increasingly choose bottled waterover other beverages.
The latest upward trend was reflected in 2006 when total bottled water volume exceeded 8.25 billion gallons, a 9.5 percent increase over 2005, and the 2006 bottled water per capita consumption level of 27.6 gallons increased by over two gallons, from 25.4 gallons per capita the previous year. Additionally, the wholesale dollar sales for bottled water exceeded $10.8 billion in 2006, an 8.5 percent increase over the $10 billion in 2005. These statistics demonstrate continued consumer demand and appreciation for the convenience and good taste of bottled water brands consumed on-the-go, during exercise, at restaurants or meetings, and at home or the office. However, consumers should also know that bottled water safety and quality result from multiple layers of regulation and standards at the federal, state and industry levels.
Bottled water is comprehensively regulated by the U.S. Food and Drug Administration (FDA) as a packaged food product, and has issued stringent standards for safety, quality, production, labeling, and identity. Along with the FDA's Good Manufacturing Practices (GMPs), which are required of all foods, bottled water must comply with several other applicable regulations, including Standards of Identity, Standards of Quality and additional, specific bottled water GMPs. Being a packaged food product, bott ...
This document provides an overview of the bottled water industry and Parle Bisleri's strategic development over time. It includes a table of contents, introduction on the bottled water market and consumer behavior, literature review on regulations and Bisleri's history, objectives of studying Bisleri's marketing strategies, and sections on company profile, competitors, strategies, SWOT analysis, and future plans. The objectives are to analyze Bisleri's marketing strategies, determine its market share, assess brand awareness, and study its brand positioning in the mineral water segment.
The document summarizes consumer research conducted in the 1990s on beverage trends and consumer preferences. It found that people were excited about beverages that offered more functionality beyond soft drinks. They wanted exotic tastes, natural ingredients and healthier options. Since then, many successful beverage brands have launched that meet these desires, such as Vitaminwater and Red Bull. The document also examines current and future opportunities across various beverage categories like bottled water, energy drinks, juices and sports drinks. It predicts continued innovation and proliferation of new brands and categories in the coming years.
Bottled Water More Than Just a Story About Sales Growth; String.docxhartrobert670
Bottled Water: More Than Just a Story About Sales Growth; Stringent Federal, State and Industry Standards Help Ensure Safety, Quality and Good Taste
[New York] 09 Apr 2007:
ALEXANDRIA, Va., April 9 /PRNewswire-USNewswire/ -- The InternationalBottled Water Association (IBWA), in conjunction with Beverage MarketingCorporation (BMC), today released bottled water statistics for the year 2006,compiled by BMC. These numbers show that U.S. bottled water sales andconsumption continue to rise, as consumers increasingly choose bottled waterover other beverages.
The latest upward trend was reflected in 2006 when total bottled water volume exceeded 8.25 billion gallons, a 9.5 percent increase over 2005, and the 2006 bottled water per capita consumption level of 27.6 gallons increased by over two gallons, from 25.4 gallons per capita the previous year. Additionally, the wholesale dollar sales for bottled water exceeded $10.8 billion in 2006, an 8.5 percent increase over the $10 billion in 2005. These statistics demonstrate continued consumer demand and appreciation for the convenience and good taste of bottled water brands consumed on-the-go, during exercise, at restaurants or meetings, and at home or the office. However, consumers should also know that bottled water safety and quality result from multiple layers of regulation and standards at the federal, state and industry levels.
Bottled water is comprehensively regulated by the U.S. Food and Drug Administration (FDA) as a packaged food product, and has issued stringent standards for safety, quality, production, labeling, and identity. Along with the FDA's Good Manufacturing Practices (GMPs), which are required of all foods, bottled water must comply with several other applicable regulations, including Standards of Identity, Standards of Quality and additional, specific bottled water GMPs. Being a packaged food product, bottled water is also bound by the Nutrition Labeling Education Act (NLEA) and the full range of FDA protective measures designed to enforce product safety and protect consumers. States also regulate bottled water inspections, sampling, analyzing and approving bottled water sources. Testing laboratory certification is another area where states may regulate bottled water. As part of the IBWA Bottled Water Code of Practice, IBWA members voluntarily utilize the principles of Hazard Analysis and Critical Control Point (HACCP) for a science-based approach to bottled water production and safety. FDA recognizes HACCP as a key component of food safety and consumer protection.
"While all beverages have their role in a marketplace with an abundance of drink choices," says Stephen R. Kay, IBWA Vice President of Communications, "consumers are choosing bottled water as a refreshing, hydrating beverage and as an alternative to others that may contain calories, caffeine, sugar, artificial colors, alcohol or other ingredients, which they wish to moderate or avoid. For instance, during 2006, individual ...
Water, which was until recently considered a natural resource with no costs attached, has grown dearer with the increased demand in the recent past. With a fleet of industries like cement, chemical, fertilizers, pharmaceuticals, power, etc., depending on water, the water industry players are likely to have a very bright future.
The global outlook series on the Non-Alcoholic Beverages Industry provides a collection of statistical anecdotes, market briefs, and concise summaries of research findings. Illustrated with 100 fact-rich market data tables, the report offers a rudimentary overview of the industry, and highlights latest trends and demand drivers. Regional markets briefly abstracted and covered include United States, Canada, Japan, Europe (France, Germany, and United Kingdom), Asia Pacific (Australia, China, India, Indonesia, South Korea, Sri Lanka, Vietnam and Thailand) and Latin America. The report offers a compilation of recent mergers, acquisitions, and strategic corporate developments. Also included is an indexed, easy-to-refer, fact-finder directory listing the addresses, and contact details of 640 companies worldwide.
2022 Beverage Forum Non-Alcoholic Workshop[87].pdfNeil Kimberley
The document summarizes key trends in the non-alcoholic beverage market presented at a market trends workshop. It finds that while the overall beverage market rebounded in 2021 after declines in 2020, inflation increased costs and may dampen future growth. Liquid refreshment beverages outperformed while traditional categories declined. Bottled water significantly gained volume share over the last decade while carbonated soft drinks lost share. Health and wellness attributes are driving category growth.
Water is our most essential resource for life, the economy, and has no substitute. However, water demand is increasing with population growth while supply remains fixed. As water becomes scarcer, political conflicts are likely to emerge. Currently, many people live without access to clean water and infrastructure in the US and elsewhere is failing. Climate change will exacerbate water challenges. By 2050, half the world's population may face water stress. Solutions include conservation, reuse, technology advances, and better management of water as a valued resource rather than a right. Water prices will need to rise to reflect its true cost and value to shape sustainable use.
This document provides an overview and analysis of the packaged drinking water industry in India. It discusses key aspects of the industry including major players like Bisleri, types of bottled water, market size and growth, consumer habits, and strategies of industry leaders. The packaged water market in India is large and growing, though still less organized than in other countries. Major players use strategies around branding, distribution networks, and marketing to compete in this expanding market.
Brands in the alcohol industry face significant challenges from changing consumer behaviors and new technologies. Consumers are spending more time online than watching TV, developing more sophisticated tastes, and drinking more at home. To succeed, brands must engage customers through online communities, mobile apps, social media, and events to build relationships and stay relevant as trends evolve. The document provides examples of how Bacardi, Flying Dog, Diageo, Pabst Blue Ribbon, and Rock Art Brewery have adapted successfully to these new realities.
Brands in the alcohol industry face significant challenges from changing consumer behaviors and economic factors. Consumers are spending more time online than watching TV, developing more sophisticated tastes, and drinking more at home. To succeed, brands must engage customers through online communities, mobile apps, social media, and events to build relationships and stay relevant as trends evolve. The document provides examples of how Bacardi, Flying Dog, Diageo, Pabst Blue Ribbon, and Rock Art Brewery have adapted successfully to these new realities.
Based on what you have read, do you believe that pollution standards.docxAMMY30
Based on what you have read, do you believe that pollution standards should be established for bottled water? What arguments most influenced your decision? How would you explain your position to someone who disagrees with you?
The International Bottled Water Association (IBWA) is the authoritative source of information about all types of bottled waters. Founded in 1958, IBWA's membership includes U.S. and international bottlers, distributors and suppliers. IBWA is committed to working with the U.S. Food and Drug Administration (FDA), which regulates bottled water as a packaged food product, and state governments to set stringent standards for safe, high quality bottled water products. Additionally, IBWA requires member bottlers to adhere to the IBWA Bottled Water Code of Practice, which mandates additional standards and practices, that in some cases, are more stringent than federal and state regulations. A key feature of the IBWA Model Code is an annual unannounced plant inspection by an independent, third party organization. For more information about IBWA, bottled water and a list of member's brands, please contact IBWA Manager of Communications Tom Gardner at 703-647-4607 or
[email protected]
Full Text
ALEXANDRIA, Va., April 9 /PRNewswire-USNewswire/ -- The InternationalBottled Water Association (IBWA), in conjunction with Beverage MarketingCorporation (BMC), today released bottled water statistics for the year 2006,compiled by BMC. These numbers show that U.S. bottled water sales andconsumption continue to rise, as consumers increasingly choose bottled waterover other beverages.
The latest upward trend was reflected in 2006 when total bottled water volume exceeded 8.25 billion gallons, a 9.5 percent increase over 2005, and the 2006 bottled water per capita consumption level of 27.6 gallons increased by over two gallons, from 25.4 gallons per capita the previous year. Additionally, the wholesale dollar sales for bottled water exceeded $10.8 billion in 2006, an 8.5 percent increase over the $10 billion in 2005. These statistics demonstrate continued consumer demand and appreciation for the convenience and good taste of bottled water brands consumed on-the-go, during exercise, at restaurants or meetings, and at home or the office. However, consumers should also know that bottled water safety and quality result from multiple layers of regulation and standards at the federal, state and industry levels.
Bottled water is comprehensively regulated by the U.S. Food and Drug Administration (FDA) as a packaged food product, and has issued stringent standards for safety, quality, production, labeling, and identity. Along with the FDA's Good Manufacturing Practices (GMPs), which are required of all foods, bottled water must comply with several other applicable regulations, including Standards of Identity, Standards of Quality and additional, specific bottled water GMPs. Being a packaged food product, bottled water is also bound by the Nutrition La ...
This document provides an overview and analysis of the global alcoholic drinks market. It discusses trends in the industry as it recovers from the pandemic, including a slowdown in growth rates and intensifying headwinds. Beer is facing challenges as premium varieties and economy beers shift. Spirits and wine are experiencing premiumization. Hard seltzers are declining as spirit-based RTDs rise. Inflation poses downside risks, but the industry has proven resilient to crises. Leading companies continue to dominate market share despite some challenges from craft beers and private labels.
This document discusses the technology of non-alcoholic beverages. It begins with an introduction that defines beverages and provides an overview of the beverage industry in India. It then discusses various topics related to non-alcoholic beverages including water sources and quality, ingredients used in beverages, carbonated and non-carbonated beverages, and sanitation in the beverage industry. The document also provides details on the status of the Indian and global beverage markets as well as the growth of various beverage segments in India such as fruit juices, bottled water, and dairy drinks.
This document discusses business ecosystems and how they relate to sustainability. It defines a business ecosystem as the network of organizations involved in delivering a product or service, including suppliers, distributors, customers, competitors, and government agencies. It notes that in an ecosystem, these organizations both compete and cooperate, and each entity affects and is affected by the others. This creates constantly evolving relationships where organizations must adapt to survive, similar to biological ecosystems. The document also discusses how ecosystems create barriers to entry and how their goals include driving innovation, sharing knowledge, and addressing social/environmental challenges.
The document describes cultivation practices for mango production in India. It discusses suitable climate and soil conditions, common varieties grown in India, propagation methods, planting practices including high-density planting, training and pruning, fertilizer application, intercropping, and irrigation. The key varieties mentioned are Alphonso, Banganapalli, Bombay Green, and others. Propagation is done through grafting, with seeds from southern varieties often producing true-to-type seedlings.
Pseudomonas aeruginosa WS-1 shows potential as a biopesticide for managing fruit rot and die back disease in chili caused by Colletotrichum capsici. In laboratory experiments, P. aeruginosa WS-1 inhibited the growth of C. capsici in dual plate cultures and produced antifungal compounds including chitinases, proteases, hydrogen cyanide, and siderophores. In greenhouse tests, treatment of chili seedlings with P. aeruginosa WS-1 prior to inoculation with C. capsici resulted in similar disease control as the fungicide carbendazim. This suggests that P. aeruginosa WS-1 could provide effective biological control of the disease under field conditions.
This document provides information about growing ginger. It discusses suitable climate and soil conditions, recommended varieties, planting methods, fertilizer application, irrigation, and pest and disease management. The key points are:
- Ginger grows best in warm, humid climates with moderate rainfall and well-drained soil between 19-28°C.
- Popular varieties include IISR Varada and IISR Rejatha, suited for different purposes.
- Planting is done from February to May using seed rhizomes treated with fungicide. Proper spacing and soil preparation is important.
- Fertilizer, irrigation, weeding, and mulching practices are outlined to maximize yield.
This document discusses the role of youth in rural development in India. It outlines that youth play an important role in many aspects of rural development, such as agriculture, small industries, skill development, education, and generating employment opportunities. Some key points made include:
- Youth can contribute to agriculture through research, use of technology, and crop production.
- They help develop skills training needed for small industries and jobs.
- Developing skills and education amongst rural populations leads to overall development.
- Youth generate employment in sectors like agriculture, industries, and small businesses.
- However, there are some impediments to youth participation like poor education, weak infrastructure, inequality and exclusion, and costs.
- Overall, the
- Mango is India's leading fruit crop, providing nutritional and economic benefits. It can be grown with comparatively low maintenance costs across a variety of soils and climates.
- India accounts for about 45% of global mango production but exports a limited quantity, mainly the Alphonso and Dashehari varieties. There is potential to increase mango cultivation area and productivity in India.
- A model was proposed for cultivating mangoes on 1 hectare of land, including technical requirements for varieties, planting, irrigation, pest management, and harvest. Financial analysis showed an internal rate of return of 31% and profitability over 12 years.
The document summarizes a report from an independent panel of experts on sustainable food systems. The report outlines the threats of industrial agriculture, including its reliance on monocultures, pesticides, and lack of biodiversity. This makes these systems vulnerable to stressors like pests and disease. The report instead promotes an agroecological model of farming that works with nature by protecting ecosystems, fostering biodiversity, and providing more stable incomes for farmers. It serves as a roadmap for transitioning to more sustainable agricultural practices.
Top mailing list providers in the USA.pptxJeremyPeirce1
Discover the top mailing list providers in the USA, offering targeted lists, segmentation, and analytics to optimize your marketing campaigns and drive engagement.
Zodiac Signs and Food Preferences_ What Your Sign Says About Your Tastemy Pandit
Know what your zodiac sign says about your taste in food! Explore how the 12 zodiac signs influence your culinary preferences with insights from MyPandit. Dive into astrology and flavors!
LA HUG - Video Testimonials with Chynna Morgan - June 2024Lital Barkan
Have you ever heard that user-generated content or video testimonials can take your brand to the next level? We will explore how you can effectively use video testimonials to leverage and boost your sales, content strategy, and increase your CRM data.🤯
We will dig deeper into:
1. How to capture video testimonials that convert from your audience 🎥
2. How to leverage your testimonials to boost your sales 💲
3. How you can capture more CRM data to understand your audience better through video testimonials. 📊
buy old yahoo accounts buy yahoo accountsSusan Laney
As a business owner, I understand the importance of having a strong online presence and leveraging various digital platforms to reach and engage with your target audience. One often overlooked yet highly valuable asset in this regard is the humble Yahoo account. While many may perceive Yahoo as a relic of the past, the truth is that these accounts still hold immense potential for businesses of all sizes.
Understanding User Needs and Satisfying ThemAggregage
https://www.productmanagementtoday.com/frs/26903918/understanding-user-needs-and-satisfying-them
We know we want to create products which our customers find to be valuable. Whether we label it as customer-centric or product-led depends on how long we've been doing product management. There are three challenges we face when doing this. The obvious challenge is figuring out what our users need; the non-obvious challenges are in creating a shared understanding of those needs and in sensing if what we're doing is meeting those needs.
In this webinar, we won't focus on the research methods for discovering user-needs. We will focus on synthesis of the needs we discover, communication and alignment tools, and how we operationalize addressing those needs.
Industry expert Scott Sehlhorst will:
• Introduce a taxonomy for user goals with real world examples
• Present the Onion Diagram, a tool for contextualizing task-level goals
• Illustrate how customer journey maps capture activity-level and task-level goals
• Demonstrate the best approach to selection and prioritization of user-goals to address
• Highlight the crucial benchmarks, observable changes, in ensuring fulfillment of customer needs
Event Report - SAP Sapphire 2024 Orlando - lots of innovation and old challengesHolger Mueller
Holger Mueller of Constellation Research shares his key takeaways from SAP's Sapphire confernece, held in Orlando, June 3rd till 5th 2024, in the Orange Convention Center.
Unveiling the Dynamic Personalities, Key Dates, and Horoscope Insights: Gemin...my Pandit
Explore the fascinating world of the Gemini Zodiac Sign. Discover the unique personality traits, key dates, and horoscope insights of Gemini individuals. Learn how their sociable, communicative nature and boundless curiosity make them the dynamic explorers of the zodiac. Dive into the duality of the Gemini sign and understand their intellectual and adventurous spirit.
The 10 Most Influential Leaders Guiding Corporate Evolution, 2024.pdfthesiliconleaders
In the recent edition, The 10 Most Influential Leaders Guiding Corporate Evolution, 2024, The Silicon Leaders magazine gladly features Dejan Štancer, President of the Global Chamber of Business Leaders (GCBL), along with other leaders.
Taurus Zodiac Sign: Unveiling the Traits, Dates, and Horoscope Insights of th...my Pandit
Dive into the steadfast world of the Taurus Zodiac Sign. Discover the grounded, stable, and logical nature of Taurus individuals, and explore their key personality traits, important dates, and horoscope insights. Learn how the determination and patience of the Taurus sign make them the rock-steady achievers and anchors of the zodiac.
Recruiting in the Digital Age: A Social Media MasterclassLuanWise
In this masterclass, presented at the Global HR Summit on 5th June 2024, Luan Wise explored the essential features of social media platforms that support talent acquisition, including LinkedIn, Facebook, Instagram, X (formerly Twitter) and TikTok.
SATTA MATKA SATTA FAST RESULT KALYAN TOP MATKA RESULT KALYAN SATTA MATKA FAST RESULT MILAN RATAN RAJDHANI MAIN BAZAR MATKA FAST TIPS RESULT MATKA CHART JODI CHART PANEL CHART FREE FIX GAME SATTAMATKA ! MATKA MOBI SATTA 143 spboss.in TOP NO1 RESULT FULL RATE MATKA ONLINE GAME PLAY BY APP SPBOSS
1. Bottled Water 2009
Challenging Circumstances Persist:
Future Growth Anticipated
U.S. and International Developments and Statistics
A
s recently as the mid-2000s, the U.S. bottled water industry
looked like a highly unusual beverage industry marvel: A category
that had achieved significant scale yet continued to register
forceful growth. Indeed, for a while that’s exactly what it was, with
both volume and sales continuing to enlarge at double-digit percentage
rates—or at rates close to those heady levels—even after bottled
water became the second-largest beverage type, as measured in
By John G. Rodwan, Jr.
total volume, in the country.
If vigorous growth (until very recently) distinguished bottled water from the rest
of the liquid refreshment beverage marketplace, then its performance lately made it
look rather typical. As a group, the various beverages vying with bottled water for
consumers’ attention declined for the second time too in 2009. Carbonated soft drinks
(CSDs), the sole category with greater volume than bottled water, extended its multi-
year streak of contraction. Sports beverages, like bottled water, had successfully
traded on the ability to hydrate and for many years enjoyed muscular volume
growth, suffered a far more substantial retrenchment, with volume falling
by 12.5 percent during the year. In contrast, bottled water’s rate of
reduction was much slower; it was also less pronounced than the
setbacks experienced by fruit beverages or ready-to-drink coffee.
Indeed, bottled water shrank by less than the liquid refreshment
beverage marketplace as a whole in 2009, allowing bottled water
to again augment its share of Americans’ beverage diet—
if only slightly.
BOTTLED WATER
AND SOFT DRINKS
The impact of the economic downturn on the bottled
water business—and the beverage market as a whole—at
the end of the 2000s punctuated a period of considerable
changes in consumer preferences. At the beginning of
the decade, CSDs accounted for nearly 28 percent of total
liquid consumption by U.S. consumers. Then, Americans
drank more than 15 billion gallons of CSDs, compared
Bottled Water
with 4.7 billion gallons of bottled water, which represented
less than 9 percent of total beverage consumption and placed
bottled water as the number five beverage category behind beer,
coffee, and milk as well as CSDs.
10
April/MAy 2010
2. By 2009, CSD volume had slipped to less than 14 billion permanent diminishment in demand for bottled water.
gallons, while bottled water’s stood at almost 8.5 billion Straitened economy conditions affected all sectors of the
gallons. Consequently, CSDs’ market share had eroded to industry. Energy and commodities costs presented ongoing
less than 24 percent, while water’s had neared 14.5 percent. challenges. Input costs for items including polyethylene
In terms of liquid refreshment beverages exclusively, bottled terephthalate (PET), aluminum, and fuel contributed to
water accounted for more than 29 percent of total volume higher prices for consumers, which, in turn, affected virtually
in 2009, up two-tenths of a percentage point from the all liquid refreshment beverage segments. In addition, some
year before. consumers began opting for smaller, more affordable package
sizes. While people still are consuming the same overall
U.S. BOTTLED WATER MARKET amount of liquid, the impact of trading to smaller sizes—
Volume and Producer Revenues
such as going from the 20-ounce size to the 16-ounce—may
2001 – 2009
be the reduction of product waste. Consumers may have
Year Millions of Annual % Millions of Annual % become vigilant about not throwing away 4 ounces of the
Gallons Change Dollars Change 20-ounce size.
2001 5,185.3 -- $6,880.6 --
2002 5,795.6 11.8% $7,901.4 14.8%
DEMAND FOR BOTTLED
2003 6,269.8 8.2% $8,526.4 7.9% WATER PERSISTS
2004 6,806.7 8.6% $9,169.5 7.5% Consumers have demonstrated a strong thirst for bottled
2005 7,538.9 10.8% $10,007.4 9.1% water, which will persist in the future. Changes in average
2006 8,255.0 9.5% $10,857.8 8.5%
intake indicate potent interest in a product that consumers
look to as a healthful alternative to other beverages. Americans
2007 8,757.6 6.1% $11,551.5 6.4%
upped their annual consumption by more than 11 gallons
2008 8,669.3 -1.0% $11,178.5 -3.2% from 16.2 gallons per person in 1999 to 27.6 gallons 10
2009 8,454.0 -2.5% $10,595.0 -5.2% years later. During the same period, per capita consumption
Source: Beverage Marketing Corporation of CSDs dropped by more than nine gallons. Per capita
consumption of other major beverage categories, like milk and
Prior to the U.S. recession and the attendant industry
fruit beverages, also declined. Other types, including coffee
downturn, rapid volume growth characterized bottled water
and tea, were characterized by stability (though the ready-to-
for much of this period, as reported in the latest edition of
drink versions of both categories made gains). Thus, bottled
Bottled Water in the U.S., Beverage Marketing Corporation’s
water proved itself to be the key component of the liquid
annually published analysis of the market. Bottled water
refreshment beverage market.
volume achieved double-digit percentage growth rates in two
years and advanced at rates close to that level in several others.
U.S. BOTTLED WATER MARKET
After growing by 10.8 percent in 2005, for instance, bottled
Per Capita Consumption
water volume enlarged by 9.5 percent in the following year. 1999 – 2009
CSDs, in pronounced contrast, followed several years of slow
growth with multiple volume reductions. Indeed, the category Year Gallons Per Capita Annual % Change
underwent its fifth year in a row of volume reduction in 2009.
1999 16.2 --
However, in a significant turnabout from earlier years,
bottled water volume declined by 1.0 percent in 2008 and 2000 16.7 3.5%
losses intensified in 2009. Furthermore, producers’ revenues 2001 18.2 8.6%
declined in both 2008 and 2009 as well. Bottled water 2002 20.1 10.6%
Bottled Water
wholesale dollar sales first exceeded $6 billion in 2000. By 2003 21.6 7.2%
2007, they topped $11.5 billion. Category sales declined to 2004 23.2 7.5%
$11.2 billion the following year and to less than $10.6 billion
2005 25.4 9.7%
in 2009.
2006 27.6 8.4%
STRAINED U.S. ECONOMY 2007 29.0 5.3%
2008 28.5 -1.8%
While bottled water failed to realize growth in 2008
2009 27.6 -3.2%
or 2009, its sluggishness reflected forces affecting the entire
Source: Beverage Marketing Corporation
beverage marketplace and most likely did not indicate a
11
April/MAy 2010
3. Multiple factors contribute to U.S. consumers’ enthusiasm of total volume in 2009. As a whole, domestic non-sparkling
for bottled water. These include health, safety, convenience, declined at a slower rate than the overall bottled water market.
and value. Bottled water’s versatility makes it suitable for The non-sparkling category includes diverse parts that
consumption at any time of day and in virtually any situation. had very different results. In 2009, all but one of its segments
It doesn’t need to be kept cold (like soft drinks or juice) or declined, though rates varied considerably. Throughout most
warm (like conventional coffee or tea). As far as ready-to- of the 1990s and 2000s, the retail premium PET segment—
drink commercial beverages go, bottled water is relatively consisting of still water in single-serve PET bottles—drove the
inexpensive and, with competitive (sometimes aggressive) overall category’s development. Indeed, the PET component
pricing, it is becoming increasingly affordable for consumers. enlarged by a double-digit percentage rate 16 consecutive
Various packaging types, ranging from bulk to single-serve, times through 2007. Growth slowed markedly in 2008 before
facilitate a variety of uses. Consumers’ interest in foods and it disappeared in 2009. Yet PET’s 0.7 percent reduction was
beverages that confer benefits above and beyond refreshment far less than the 2.5 percent loss measured for bottled water
also contributes to the quintessential hydrating beverage’s in general. Besides, PET volume in 2009 of almost 5.2 billion
performance in recent years. gallons stood more than 4.1 billion gallons higher than it had
Amid concern about obesity and other health matters, in 1999, and its share of total bottled water swelled from 24
bottled water’s lack of calories and artificial ingredients percent to more than 61 percent during that 10-year period.
attracts conscientious consumers. Even where tap water may Retail bulk volume growth slowed as more and more
be safely potable, many people prefer bottled water, which consumers selected convenient PET multipacks in large format
they regard as superior in taste. The convenient availability retail channels instead of larger (1 to 2.5 gallon) sizes. Its share
of packaged water wherever beverages are sold also crucially eroded from nearly one-quarter of the category volume at
differentiates bottled water from tap. the beginning of the century to less than 12 percent by 2009,
Even though bottled water is frequently compared to tap largely as a result of competition from PET. Direct delivery
water, bottled water actually achieved its market position also confronted intramural competition from handy, portable
by luring consumers away from other packaged beverages PET bottles. The segment, which comprised the largest of
perceived as less healthy than bottled water. While some them all as recently as the mid-1990s, accounted for 14 percent
consumers may have turned away from regular, full-calorie of total volume by the end of the 2000s.
sodas in favor of their diet versions, many others opted to The relatively small, essentially regional vending segment
imbibe bottled water instead. involving refillable jug containers achieved growth late in the
decade after several years of contraction. Its low cost during
CATEGORY DEVELOPMENTS economic hard times undoubtedly explains vending’s rebound.
Domestic non-sparkling water remains the most substantial The two segments outside the domestic non-sparkling
segment of the U.S. packaged water industry. Domestic non- category both saw declines in 2009. The imported water
sparkling water’s 8.1 billion gallons represented 96.1 percent segment, the smallest of them all, is prone to fluctuations.
U.S. BOTTLED WATER MARKET
Volume and Growth by Segment
2001 – 2009
Non-Sparkling Domestic Sparkling Imports Total
Year Volume* Change Volume* Change Volume* Change Volume* Change
2001 4,917.3 -- 144.0 -- 123.9 -- 5,185.3 --
2002 5,487.5 11.6% 149.5 3.8% 158.7 28.0% 5,795.6 11.8%
2003 5,923.9 8.0% 152.6 2.1% 193.3 21.8% 6,269.8 8.2%
2004 6,411.3 8.2% 166.8 9.3% 228.6 18.2% 6,806.7 8.6%
2005 7,171.4 11.9% 185.0 10.9% 182.5 -20.2% 7,538.9 10.8%
2006 7,901.4 10.2% 189.3 2.3% 164.3 -10.0% 8,255.0 9.5%
2007 8,376.6 6.0% 200.1 5.7% 180.9 10.1% 8,757.6 6.1%
2008 8,302.9 -0.9% 204.7 2.3% 161.8 -10.6% 8,669.3 -1.0%
Bottled Water
2009 8,123.8 -2.2% 202.2 -1.2% 127.9 -20.9% 8,454.0 -2.5%
* Millions of gallons
Source: Beverage Marketing Corporation
12
April/MAy 2010
4. In the 2000s, it registered double-digit percentage growth in GLOBAL BOTTLED WATER MARKET
some years, and equally sizeable contractions in others. After Leading Countries’ Consumption and
an up year in 2007, imported water’s volume fell sharply in Compound Annual Growth Rates
2008 and then plummeted precipitously in 2009. Sparkling 2004 – 2009
dipped far more modestly. 2009 Millions of Gallons CAGR*
As usual, domestic non-sparkling water accounted for Rank Countries 2004 2009 2004/09
almost all per capita bottled water consumption in 2009. 1 United States 6,806.7 8,454.0 4.4%
Sparkling water and imports each represented less than one
2 Mexico 4,668.3 6,887.1 8.1%
gallon per person. In the key PET portion, average intake
moved from less than five gallons in 1999 to almost 17 gallons 3 China 3,181.2 5,688.6 12.3%
10 years later. 4 Brazil 3,062.0 4,252.5 6.8%
5 Italy 2,814.4 2,947.2 0.9%
INTERNATIONAL DEVELOPMENTS 6 Indonesia 1,943.5 2,938.6 8.6%
Bottled water emerged as a major beverage industry force not 7 Germany 2,722.6 2,840.7 0.9%
only in the United States—by far the single-largest national 8 France 2,257.3 2,163.8 -0.8%
market in terms of volume—but also in practically every major
9 Thailand 1,310.0 1,742.1 5.9%
geographical region of the world. Bottled water first became a
sizeable, mainstream commercial beverage category in Western 10 Spain 1,453.5 1,272.4 -2.6%
Europe, where consumption of it has long been part of many Top 10 Subtotal 30,219.4 39,187.1 5.3%
residents’ daily routine. It is now a truly global beverage, found All Others 10,709.8 14,336.0 6.0%
even in some of the more remote corners of the globe. Certain WORLD TOTAL 40,929.2 53,523.0 5.5%
Asian markets achieved strong growth to become major * Compound annual growth rate
bottled water markets during the 2000s. Source: Beverage Marketing Corporation
Global bottled water consumption is estimated to have
achieving hydration, but also as a functional beverage. At the
exceeded 53.5 billion gallons in 2009, according to data
from the latest volume of Beverage Marketing’s The Global same time, in the developing world, bottled water serves at
Bottled Water Market. The global rate of consumption rose least a partial solution to the problem of often-unsafe water
by 2.7 percent in 2009. Per capita consumption of 7.9 gallons found in many countries.
represented a gain of one-and-a-half gallons over the course Much of the world’s bottled water market is still highly
of five years. fragmented and controlled by local brands, but consolidation
Of course, per capita consumption by individual region or is rapidly occurring, as four companies have come to dominate
country can diverge dramatically from the global average. For much of the market. Swiss food and beverage giant Nestlé
instance, several Western European countries have per capita and France’s Danone are the traditional leaders of the bottled
consumption levels far above 25 gallons, and two markets water pack. Both companies centered their operations around
exceeded 50 gallons per person in 2009. At the same time, the core markets of Western Europe and the United States.
however, much of the developing world, where the bulk of the However, as water growth is increasingly coming from the
world’s population resides, finds its per capita consumption developing world, Nestlé and Danone have taken their battle
figures still in the single-digit range. to the new competitive fields of Asia, Latin America, and other
Although the global per capita consumption figure may areas. In fact, Danone stepped back from the U.S. market to
obscure pronounced regional differences, bottled water’s focus on some of those other markets. Soft drink industry
global growth indicates demand for it in diverse markets. leaders Coca-Cola and PepsiCo also joined the global bottled
Consumers have demonstrated a thirst for bottled water in water race. Following their strong showings in the United
States, both companies increasingly devoted resources and
Bottled Water
highly developed markets, in less developed ones, and in
economies in transition. Bottled water tapped into some energy to developing their global bottled water businesses.
divergent consumer trends around the globe. In developed Although Europe ranks as the leading regional consumer
countries such as the United States and Canada, bottled water of bottled water, the largest national markets do not lie within
has become an especially dynamic major commercial beverage the continent’s borders. In terms of volume by individual
category by registering as an attractive option for health- countries, North America boasts the two largest markets, the
conscious consumers. Marketers positioned bottled water as United States and Mexico, which together accounted for close
a beneficent alternative to CSDs and juice drinks. Many in to 29 percent of the world’s packaged water market in 2009.
the developed world see bottled water as not only a way of Although the U.S. bottled water market had been a catalyst
13
April/MAy 2010
5. for much of the global expansion up until the mid-2000s, its Average intake in Mexico jumped from 44.5 gallons in 2004 to
compound annual growth rate (CAGR) of 4.4 percent for the nearly 62 gallons five years later. The former leader in average
five-year period ending with 2009 was noticeably slower then intake, Italy, consumed the equivalent of 50.7 gallons per
the 5.5 percent CAGR achieved by the growth of the global person in 2009.
market during the same period. Several Middle Eastern markets rank very highly in per
Mexico alone accounted for 12.9 percent of the global capita bottled water consumption. With the equivalent of
volume with almost 6.9 billion gallons in 2009 and a market- more than 40 gallons for each resident in 2009, the United
beating CAGR of 8.1 percent. China became the third country Arab Emirates (UAE) had the third-highest level of bottled
that could claim a double-digit share of global volume with water consumption in the world. In addition to the UAE, the
5.7 billion gallons, or 10.6 percent of the total. Chinese bottled Middle East region has Lebanon and Saudi Arabia in the top
water volume has enjoyed double-digit percentage growth 20 in per capita bottled water consumption. At 20 gallons per
rates for several consecutive years, registering a 12.3 percent resident, Israel also consumes bottled water at a rate greater
CAGR for the period from 2004 to 2009—by far the highest than the global average.
rate among the 10 biggest bottled water markets. Fourth-place
Brazil and sixth-place Indonesia also registered CAGRs higher GLOBAL BOTTLED WATER MARKET
Per Capita Consumption by Leading Countries
than the international market’s. 2004 – 2009
Europe may not boast the biggest bottled water markets,
2009 Gallons Per Capita
but it does have several major ones, including four of the 10
Rank Countries 2004 2009
largest. However, as these are firmly established, their growth
tends to be slower than those where packaged water has a less 1 Mexico 44.5 61.9
entrenched tradition. Indeed, some of the most prominent 2 Italy 48.5 50.7
countries experienced contraction or only very slight growth. 3 United Arab Emirates 27.9 40.1
For instance, in 2009, France’s volume declined by 2.4 percent 4 Belgium-Luxembourg 39.1 36.7
and Italy’s dropped by 4.8 percent. During the five-year period 5 Germany 33.0 34.5
ending that year, Italy, the fifth-largest bottled water market in
6 France 37.4 33.8
the world, had a CAGR of just 0.9 percent, and eighth-place
7 Lebanon 26.8 31.8
Germany moved at the same pace. France, the number-eight
market, declined, as did Spain, the fourth-largest European 8 Spain 36.1 31.4
market and the tenth-biggest in world. As a group, the four 9 Hungary 20.1 29.3
leading European bottled water markets accounted for slightly 10 United States 23.2 27.6
more than 17 percent of the world’s total volume in 2009. 11 Slovenia 21.2 27.1
In the majority of countries throughout the globe, still 12 Thailand 20.2 26.4
water accounts for the majority of sales. Sparkling water sales
13 Saudi Arabia 23.2 26.4
are strong in a minority of countries, such as Argentina, Chile,
14 Switzerland 26.3 26.0
Uruguay, the Netherlands, and Germany, where sparkling
water is often tied to meal-consumption practices. On a global 15 Croatia 18.1 25.6
level, sparkling water accounts for an estimated 10 percent of 16 Qatar 20.6 25.5
the total volume, with still water accounting for the remaining 17 Cyprus 24.3 24.5
90 percent. 18 Austria 21.7 23.5
Plastic packaging is preferred over glass in almost every 19 Czech Republic 23.0 23.3
country, with the exception of Germany, where recycling laws
20 Hong Kong 15.4 21.9
make a determinative impact on packaging trends. However,
GLOBAL AVERAGE 6.4 7.9
even in Germany, and in other countries, such as the United
Source: Beverage Marketing Corporation
Kingdom, where glass has a strong presence, PET is the most
dynamic and rapidly growing segment. At about one-third While Europe may no longer hold the top spot in volume
of global volume, home and office delivery (HOD) —or bulk per capita, 12 of the top 20 bottled water consumers on a per
water—still accounts for a minority of global bottled water person basis are European countries. The consumers of the
sales. Yet, it is a vital segment in many countries, such as Mexico, combined market of Belgium-Luxembourg imbibed almost
where it accounts for more than two-thirds of the volume. 37 gallons each. France, Germany, Spain, and Italy were the
Bottled Water
Interest from the major water players has grown recently as only other countries with per capita consumption greater
HOD water becomes increasingly branded. An intense context than 30 gallons. French consumers quaffed 3.6 gallons less
for HOD supremacy could occur in the near future. bottled water in 2009 than they had five years earlier. In 2009,
Mexico leads the world in bottled water consumption.
14
April/MAy 2010
6. Germany and Spain had per capita consumption rates of FUTURE GROWTH ANTICIPATED
34.5 and 31.4 gallons, respectively, putting them in fifth and
eighth place in terms of average bottled water intake. Unlike Beverage Marketing fully anticipates bottled water to bounce
France and Spain, Germany consumed more bottled water per back from the weakness felt at the end of the 2000s and again
person in 2009 than it had five years before. Hungary, which invigorate the U.S. multiple beverage marketplace in the
ranked ninth, increased its bottled water consumption greatly near future. The total amount of liquid Americans annually
during the 2000s. While markets in the west hold the highest consume will remain stable, resulting in overall volume growth
numbers, Eastern Europe can claim several spots among the in line with population increase, but bottled water is on track
top-20 in per capita bottled water consumption, although to grow considerably faster. As has become the norm, CSDs
Bulgaria fell off the bottom of the list in 2009, when China’s will continue to contract. Most other beverage categories—
special administrative region of Hong Kong displaced it. including coffee, fruit beverages, and tea—are likely to grow
While Asian nations attained stature among the world’s much more slowly than bottled water, which is poised to
bottled water markets when measured in total volume, the achieve still another high in per capita consumption in the
populous countries generally do not have high per-person years ahead.
intake levels. Thailand stood among the top 20 in terms of per
capita bottled water consumption with 26.4 gallons in 2009. John G. Rodwan, Jr., is editorial director at Beverage Marketing
Hong Kong made the list for the first time as its average intake Corporation, a New York-based research, consulting, and
approached 22 gallons. Despite its status as the third-largest financial services firm dedicated to the global beverage industry.
market, mainland China had a per capita consumption figure Beverage Marketing publishes numerous market reports on
of just 4.2 gallons, well below the global norm. However, bottled water and other beverages.
Chinese consumption nearly doubled from 2004 to 2009.
Americans’ per capita bottled water consumption puts the
United States in the number 10 position among the countries
of the world, between Hungary and Slovenia.
Great PET Bottles – highest quality available
Over 40 years experience in the Bottled Water Industry
Optimum customer care – call us anytime!
Dependable service & consistent reliability
Proprietary packaging capable
Assortment of bottle sizes, colors and labeling options
Competitive prices – even as resin prices go higher!
Call us today! Contact Gene Ross
404.323.3978 (cell) • 404.363.8978 (office)
404.363.8979 (fax)
gene@goodpac.com • www.goodpac.com
Bottled Water
16
April/MAy 2010