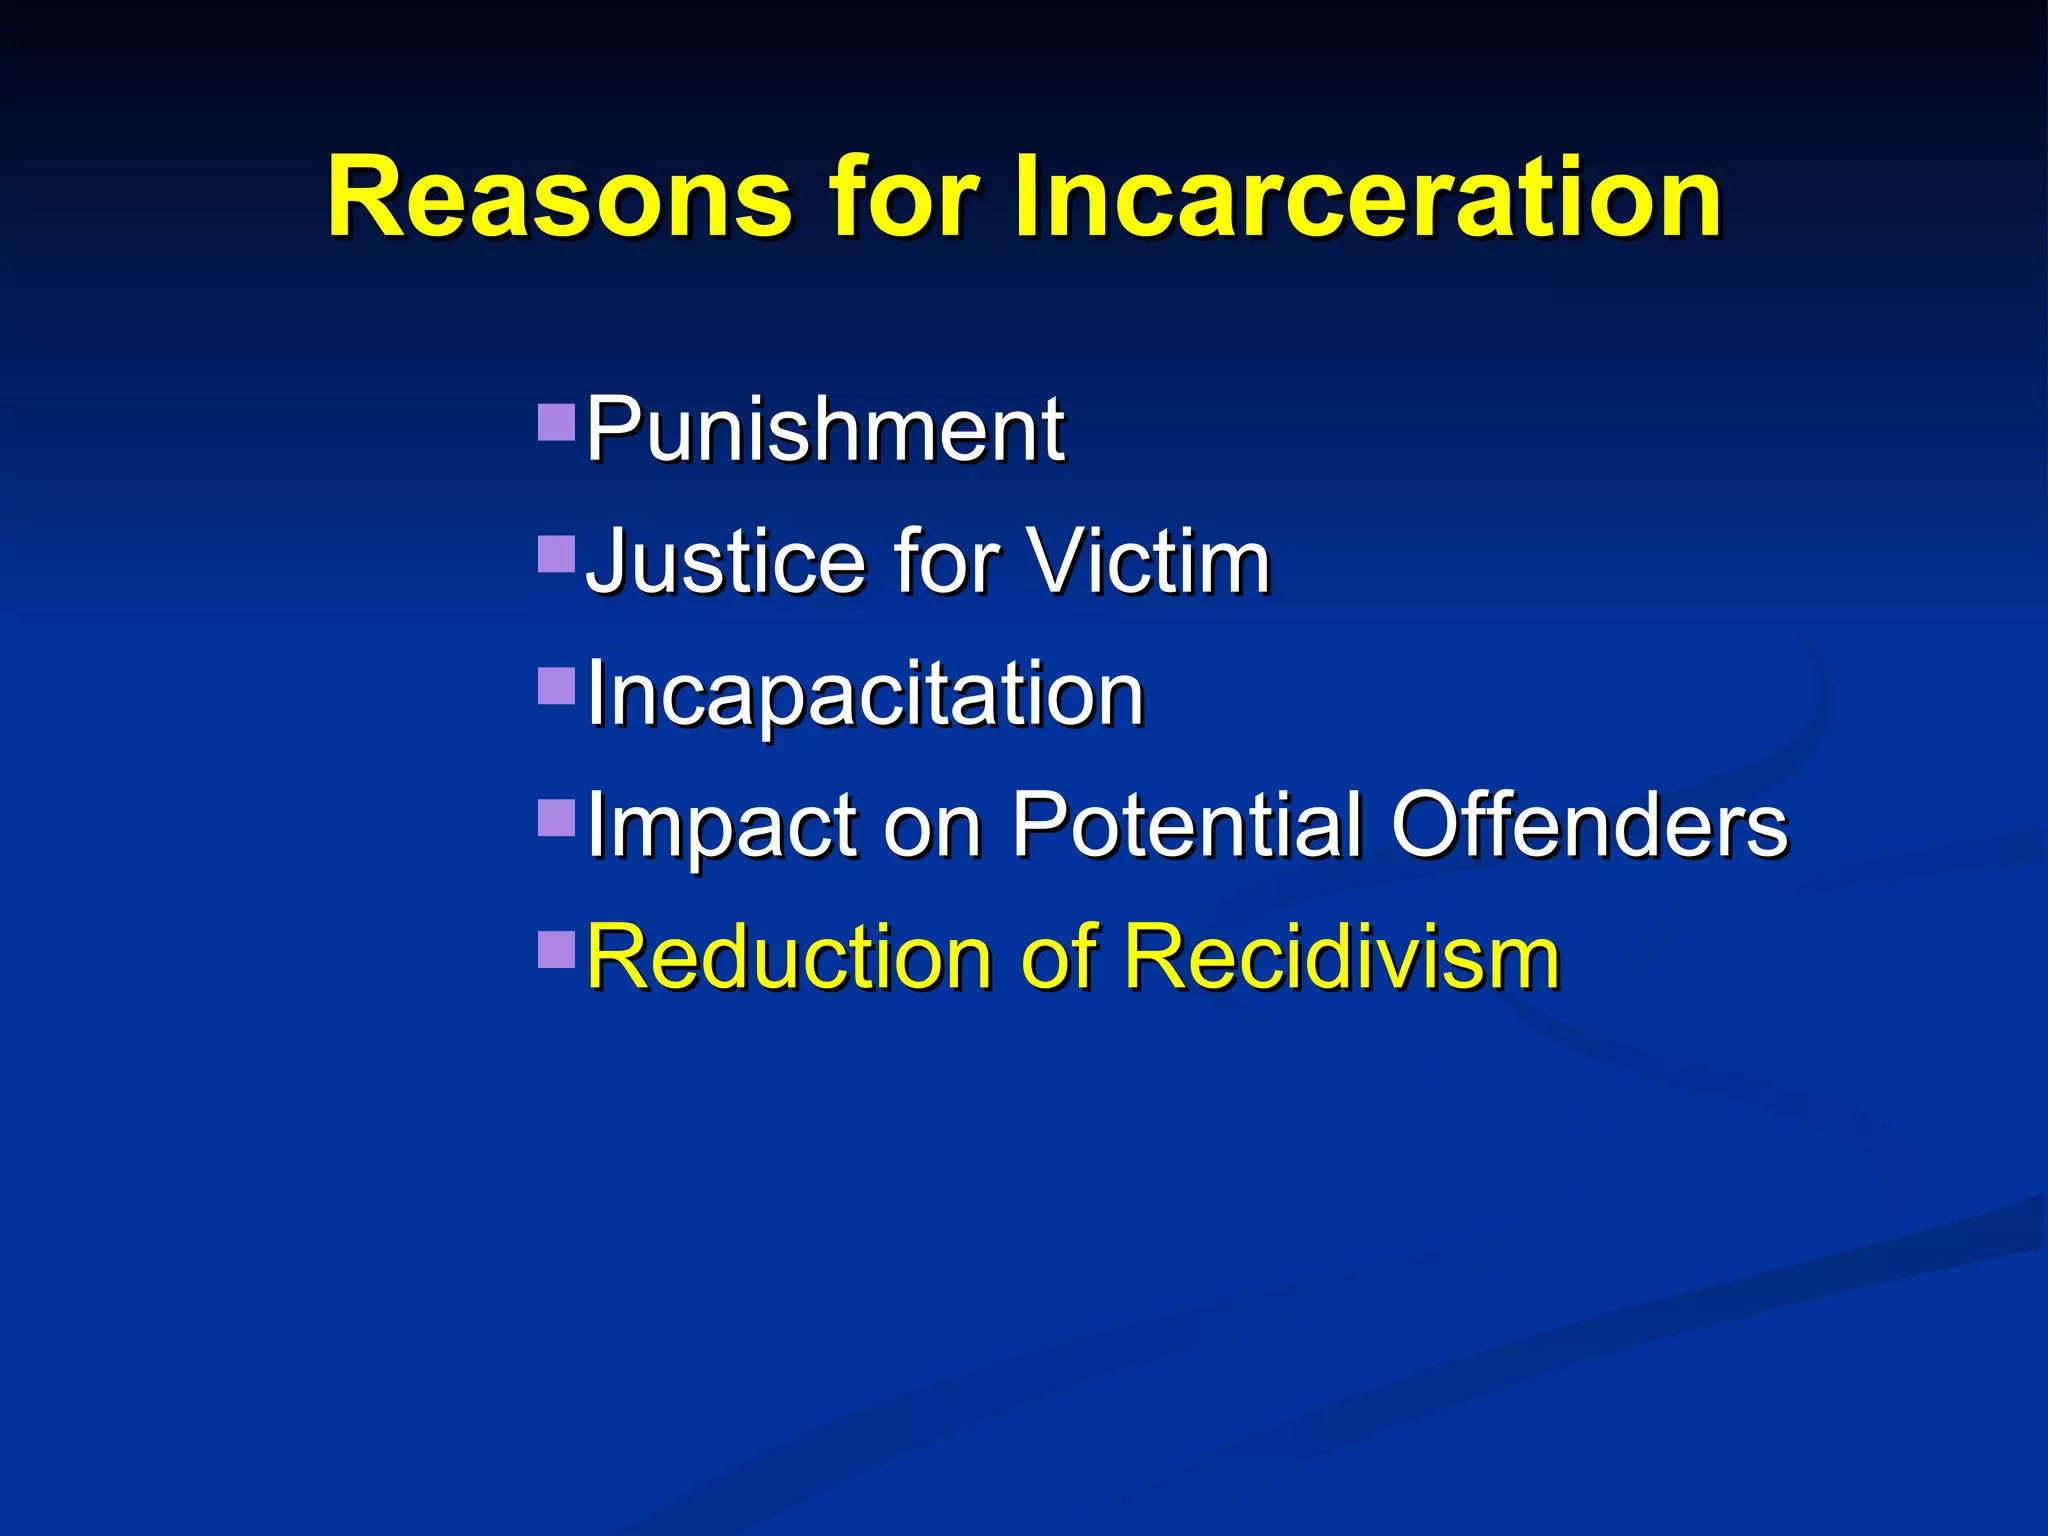
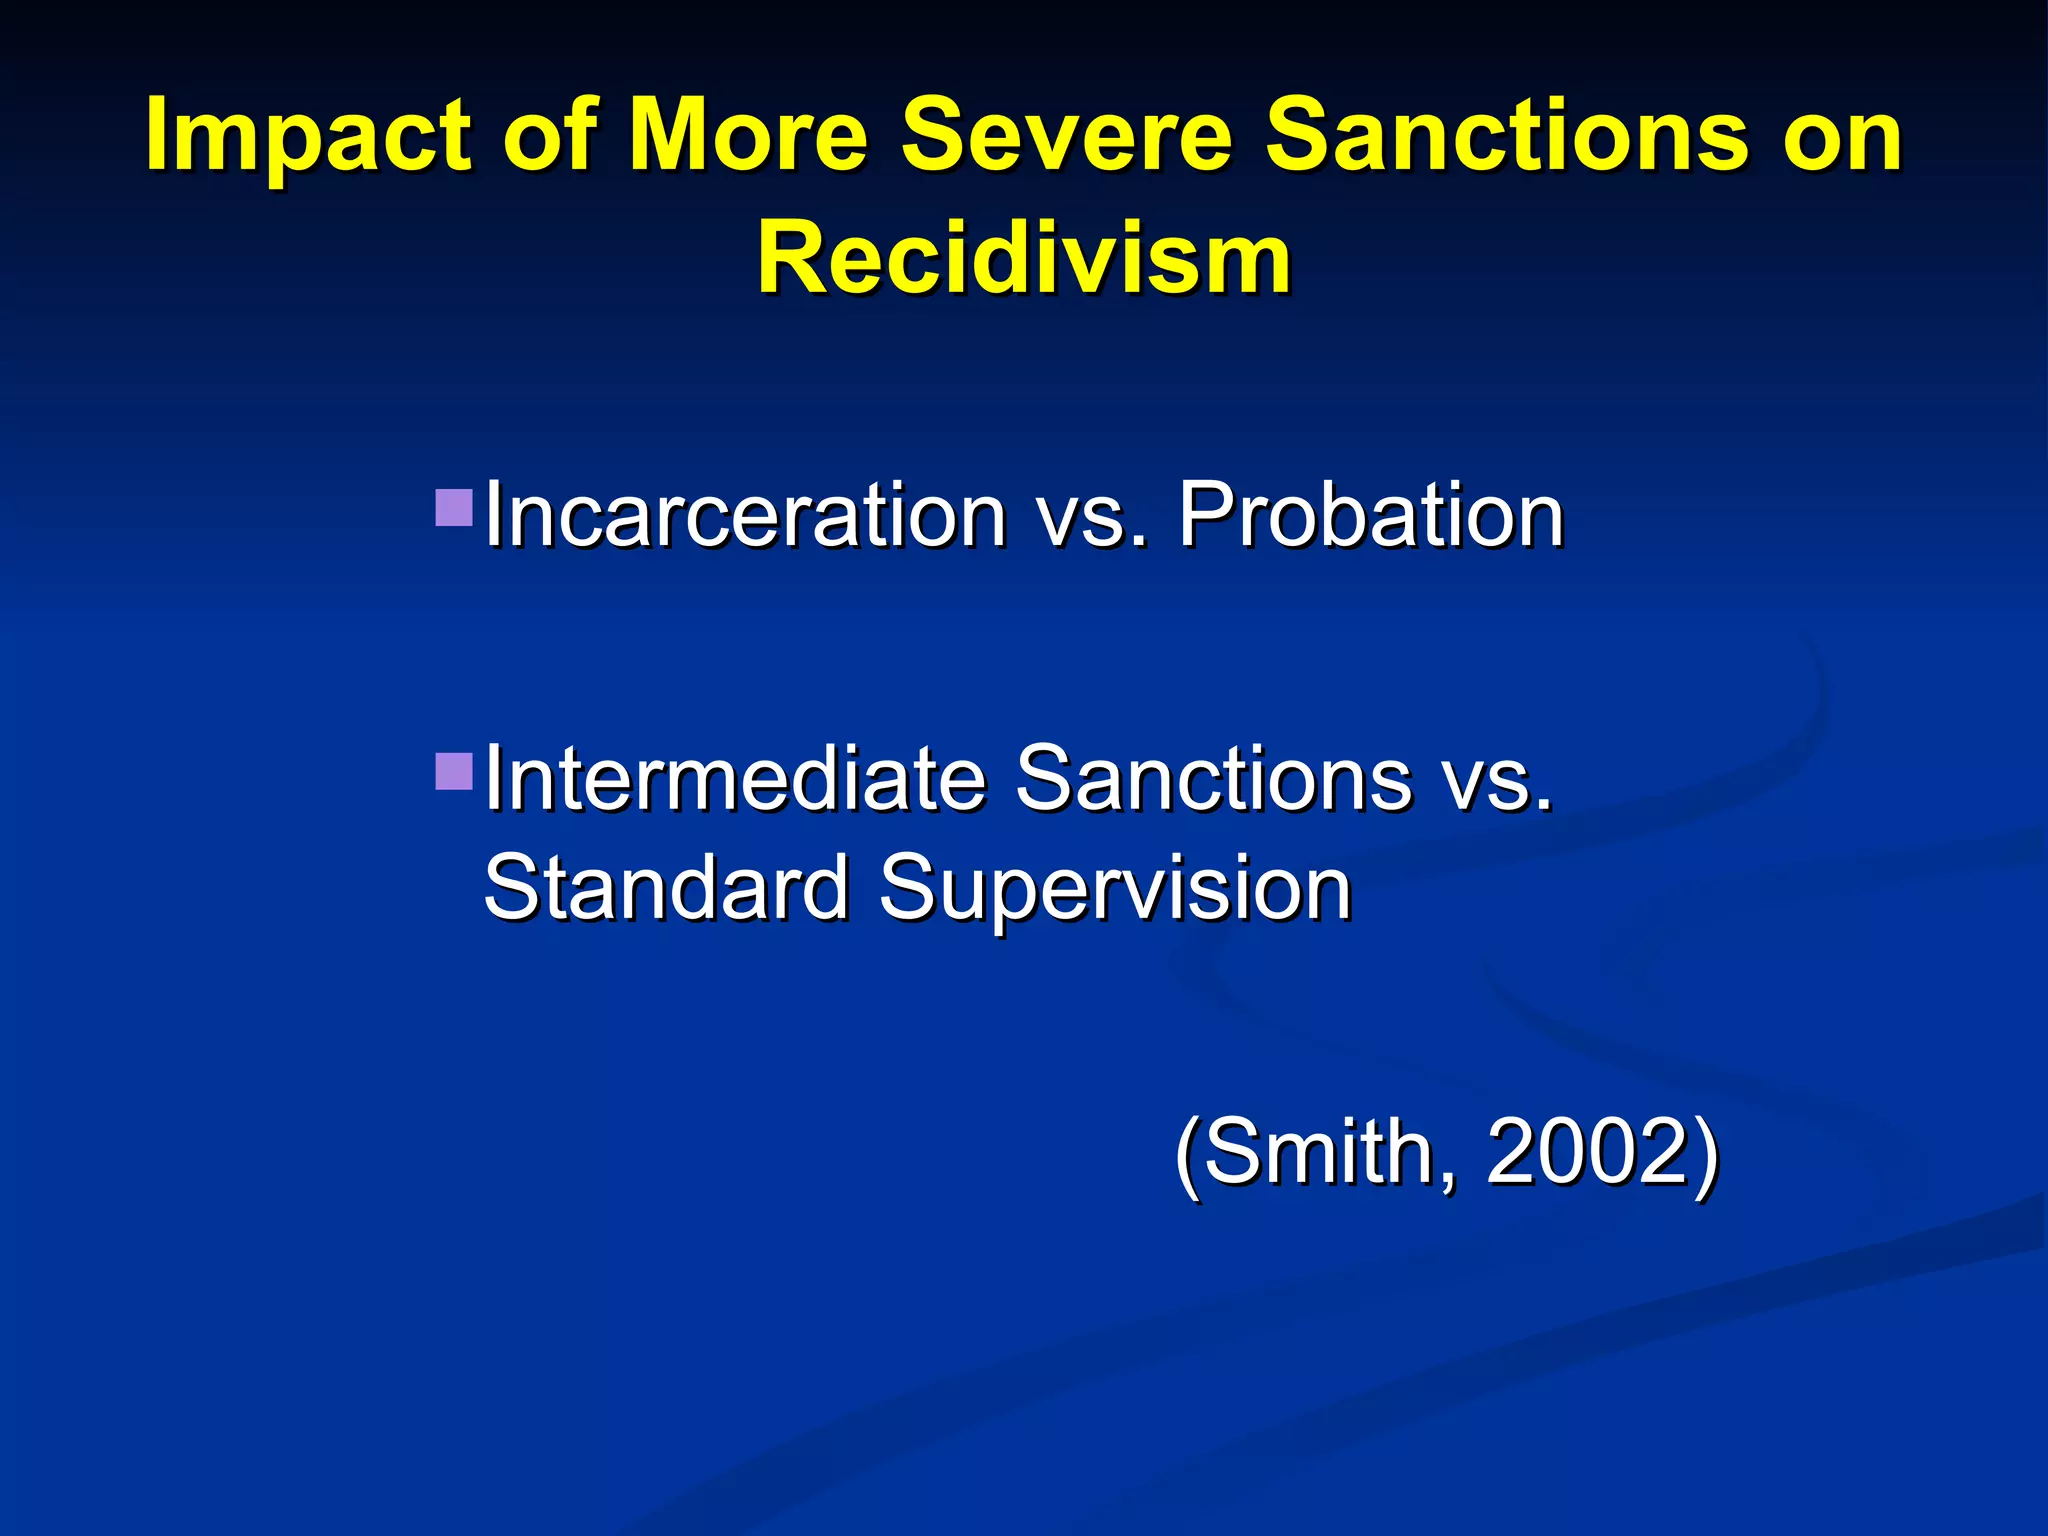
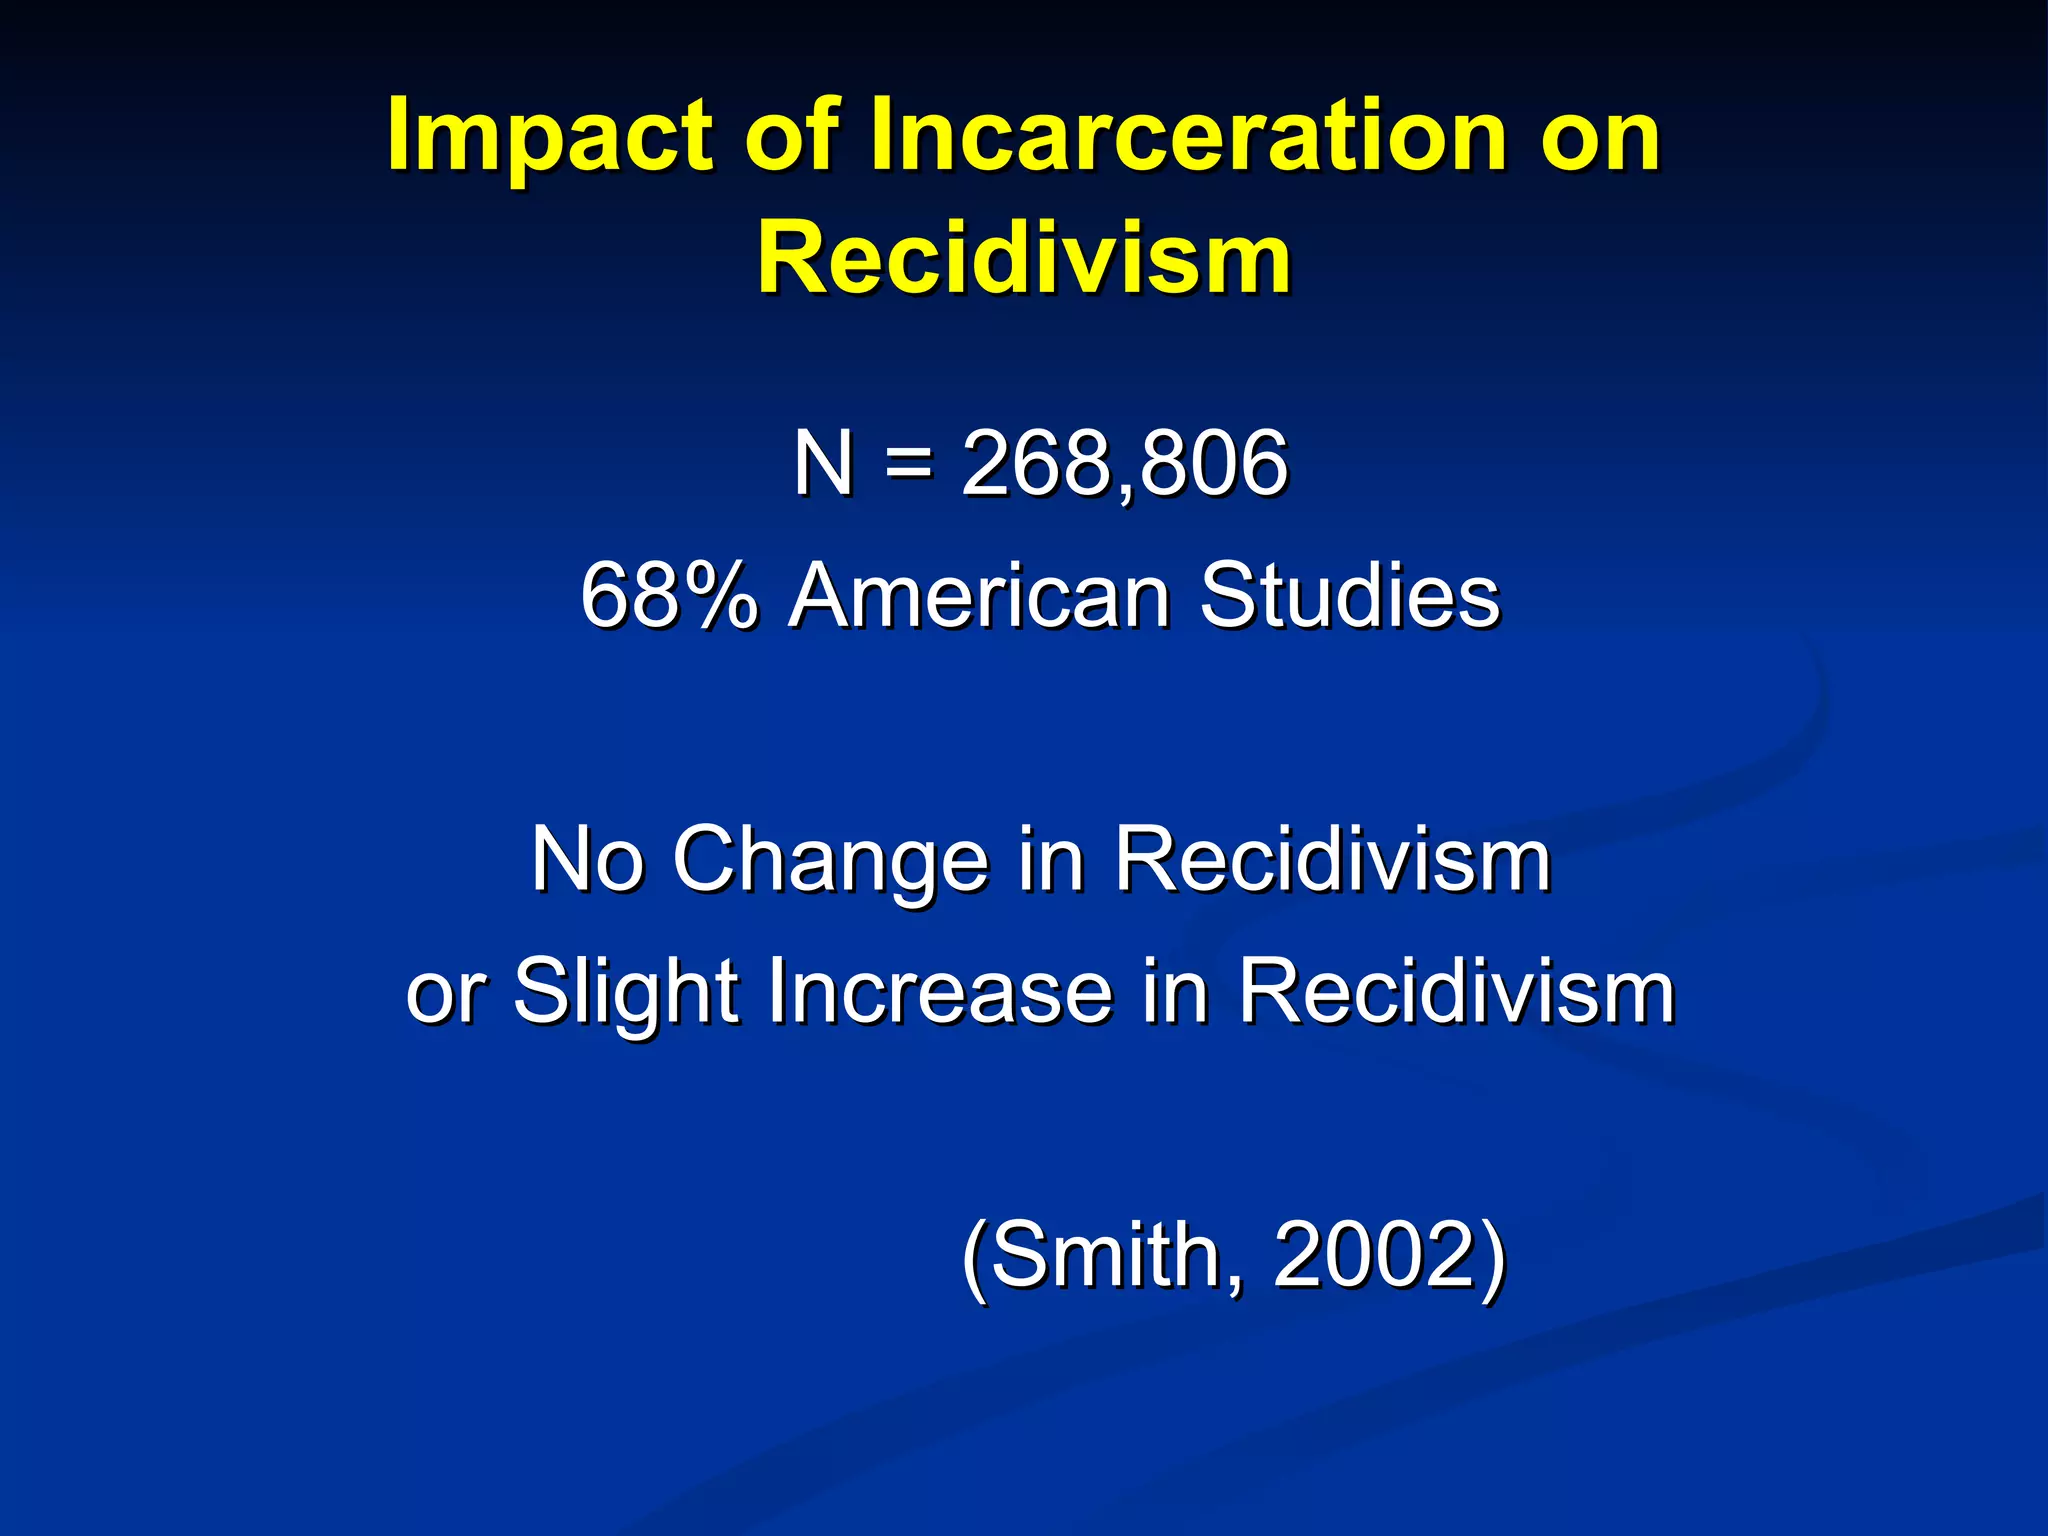
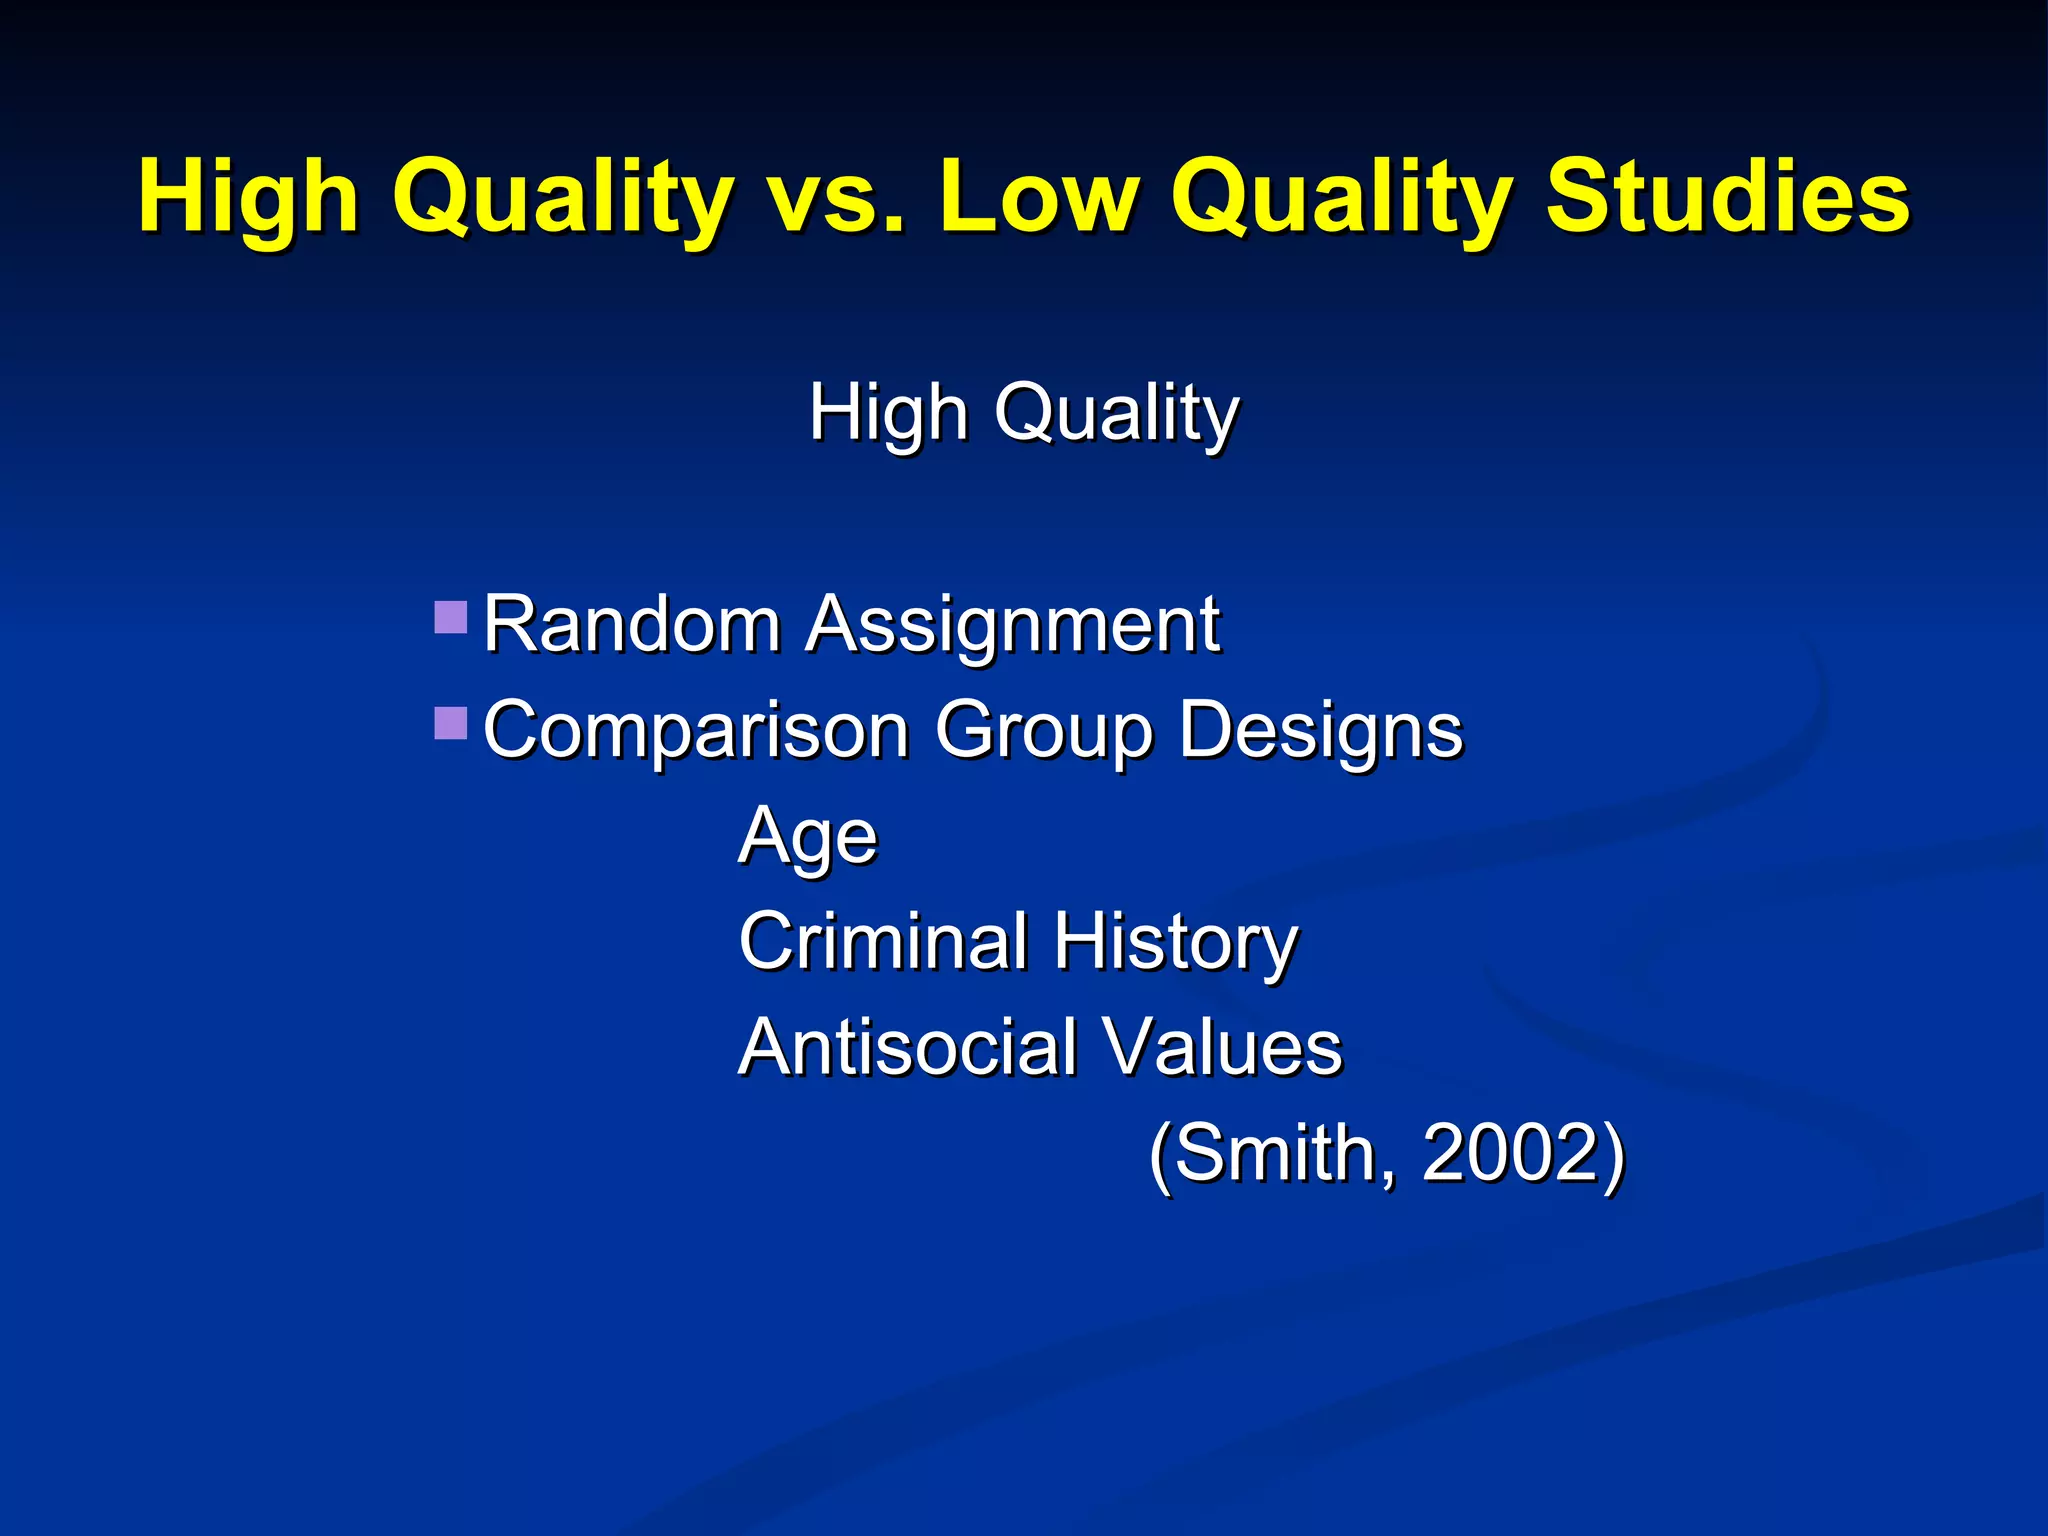
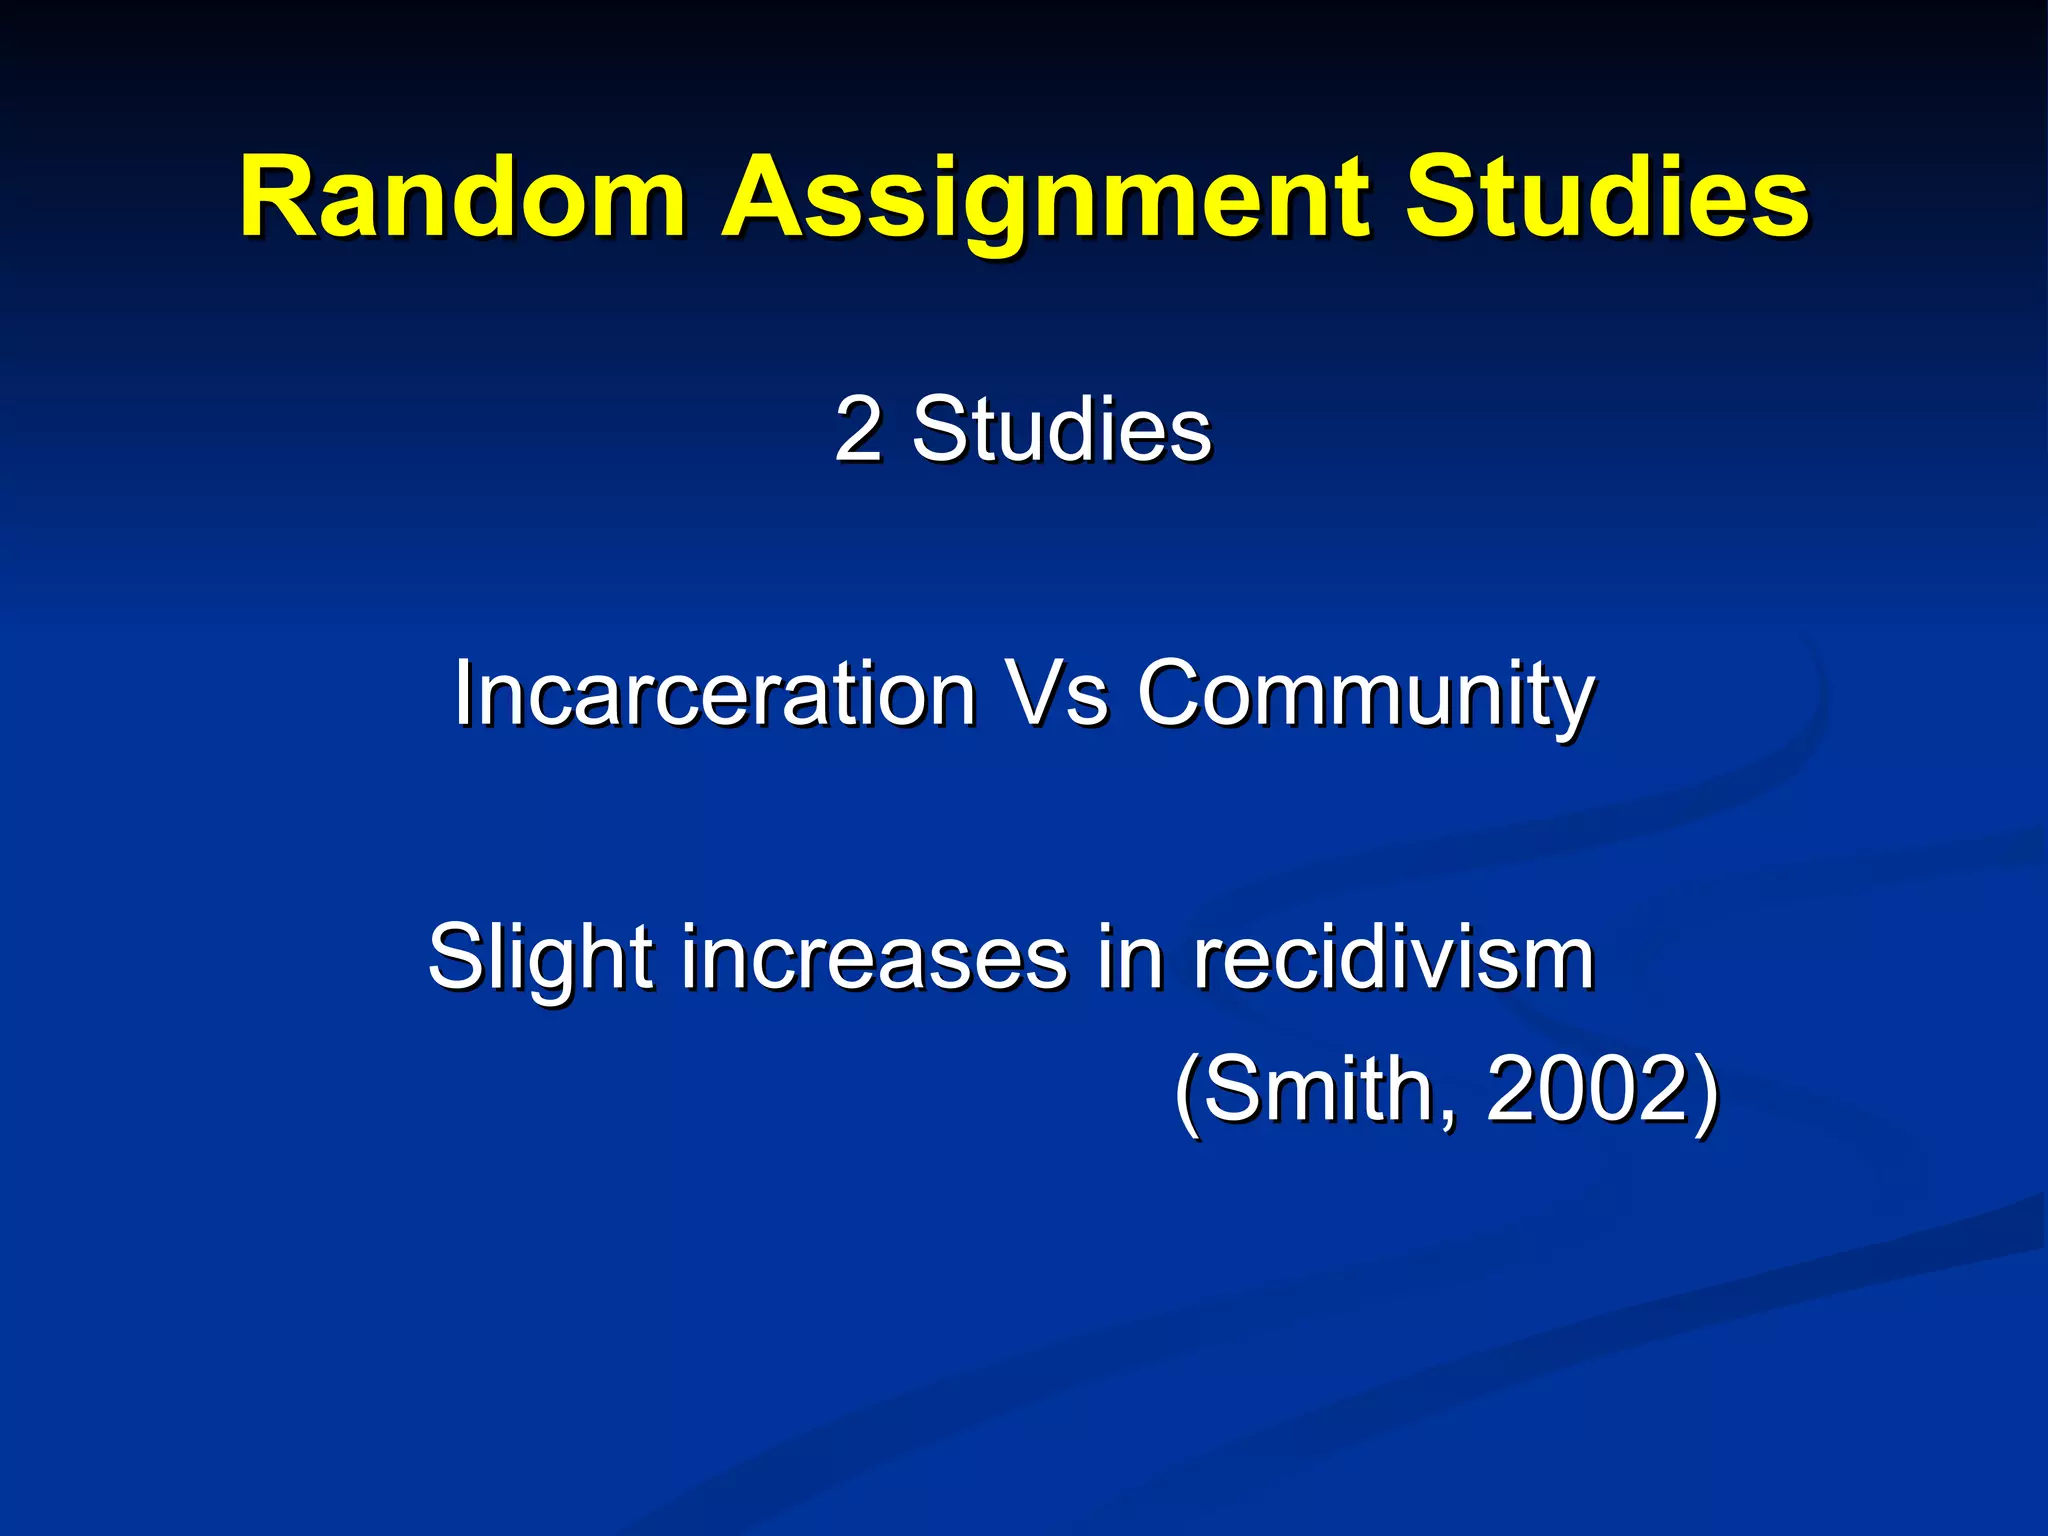
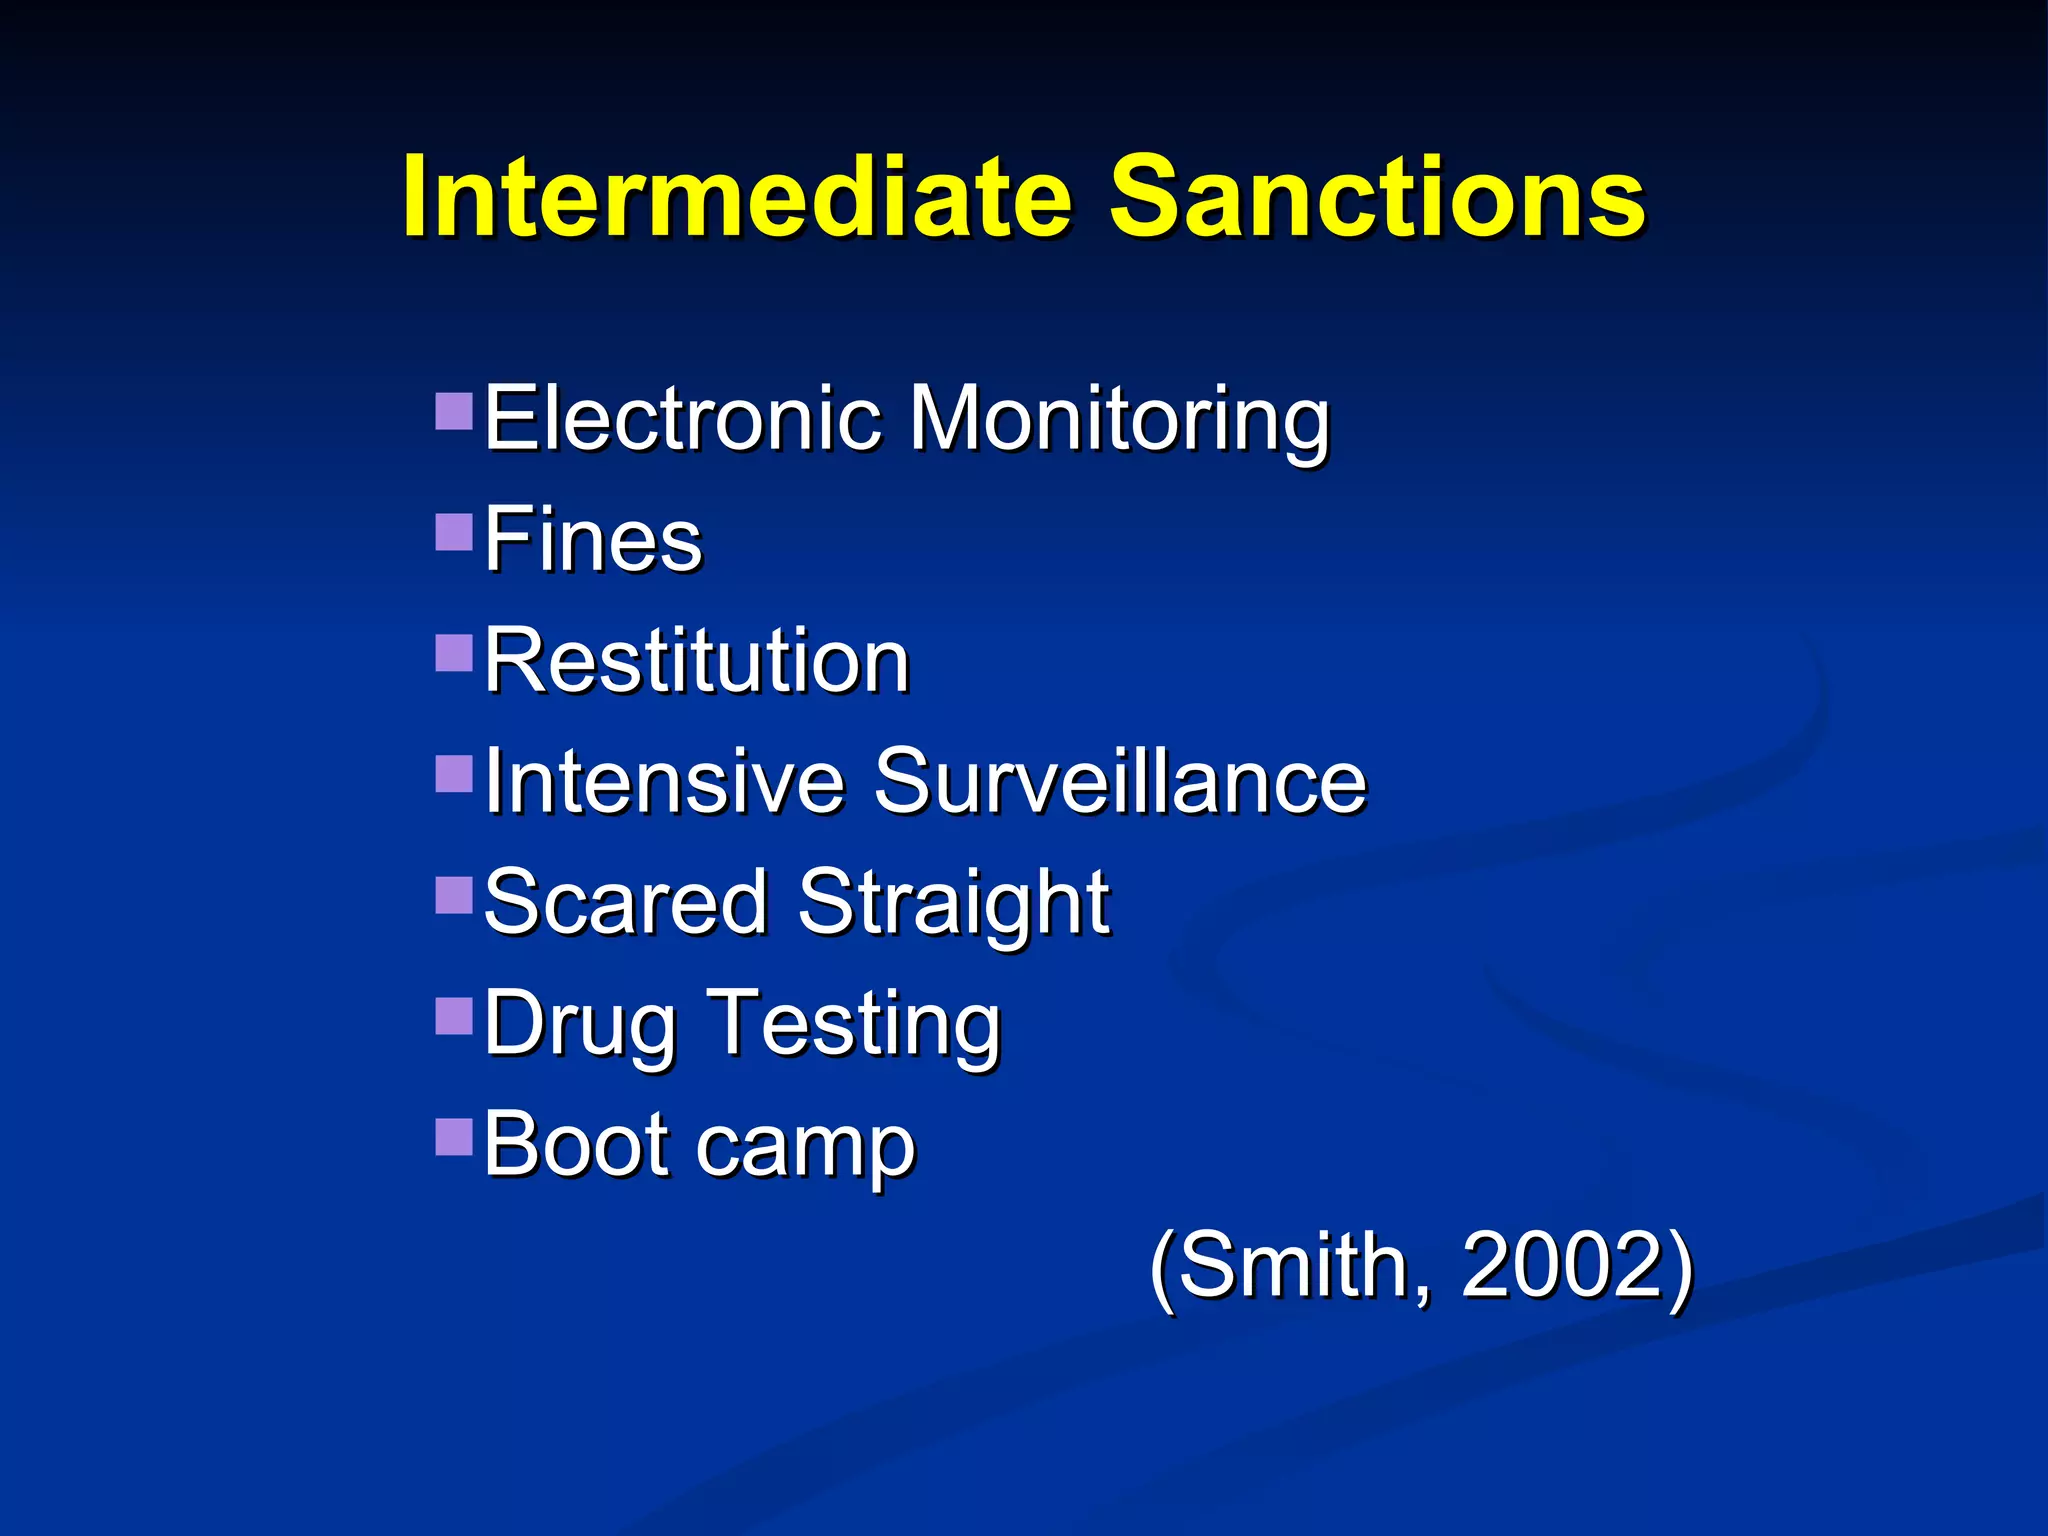
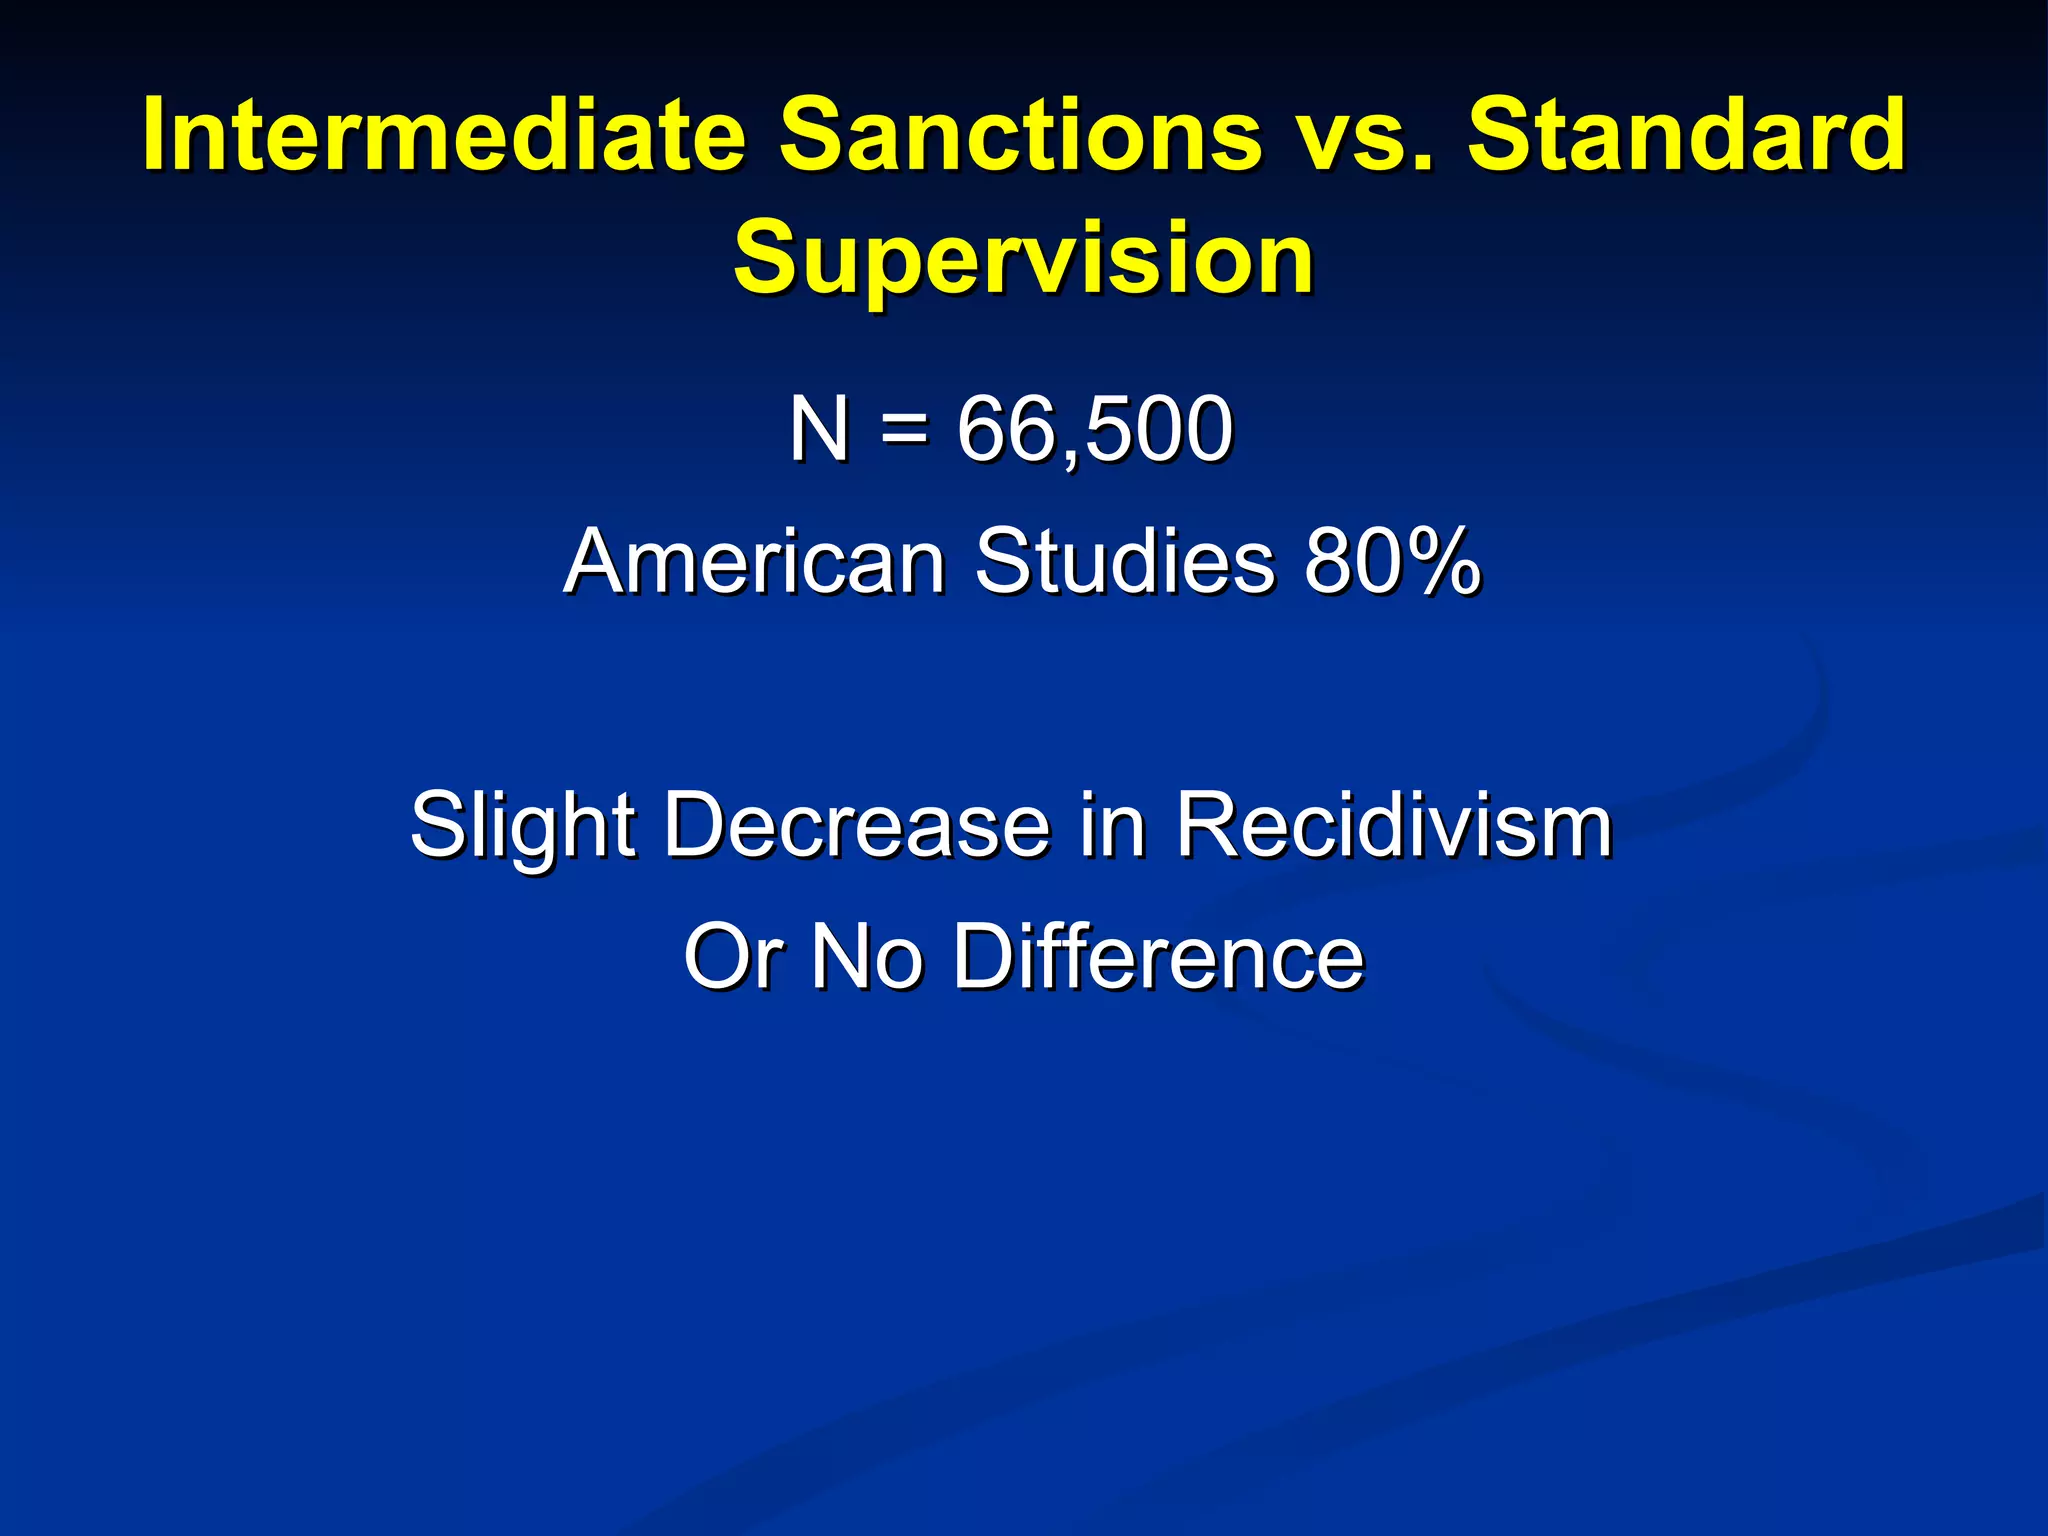
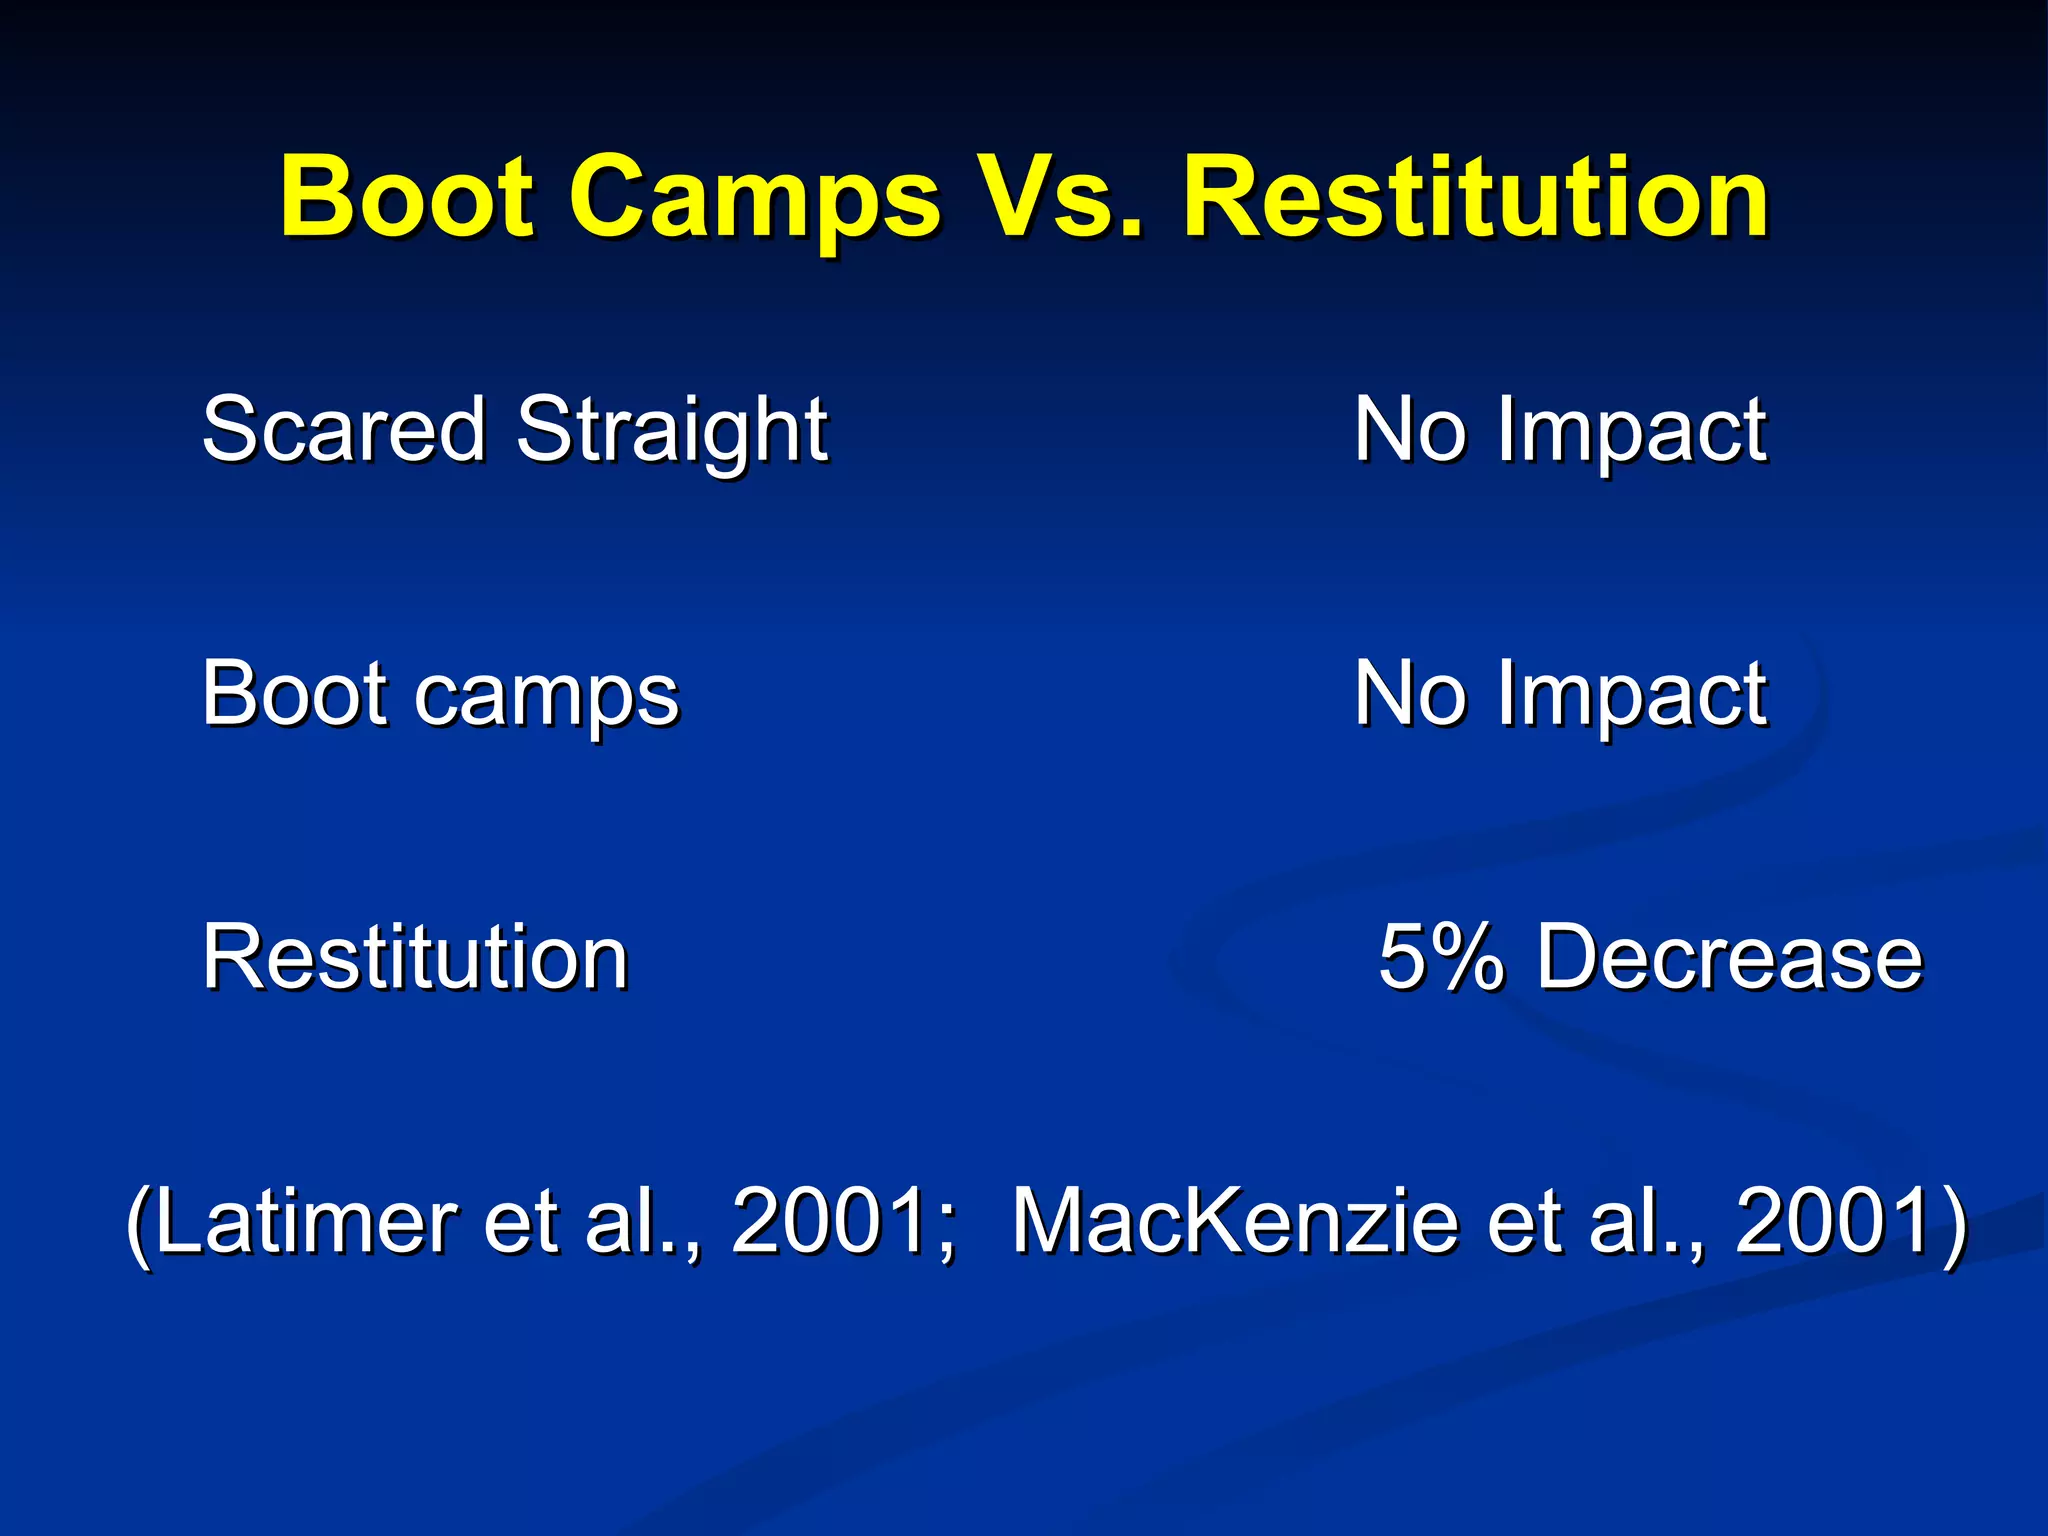
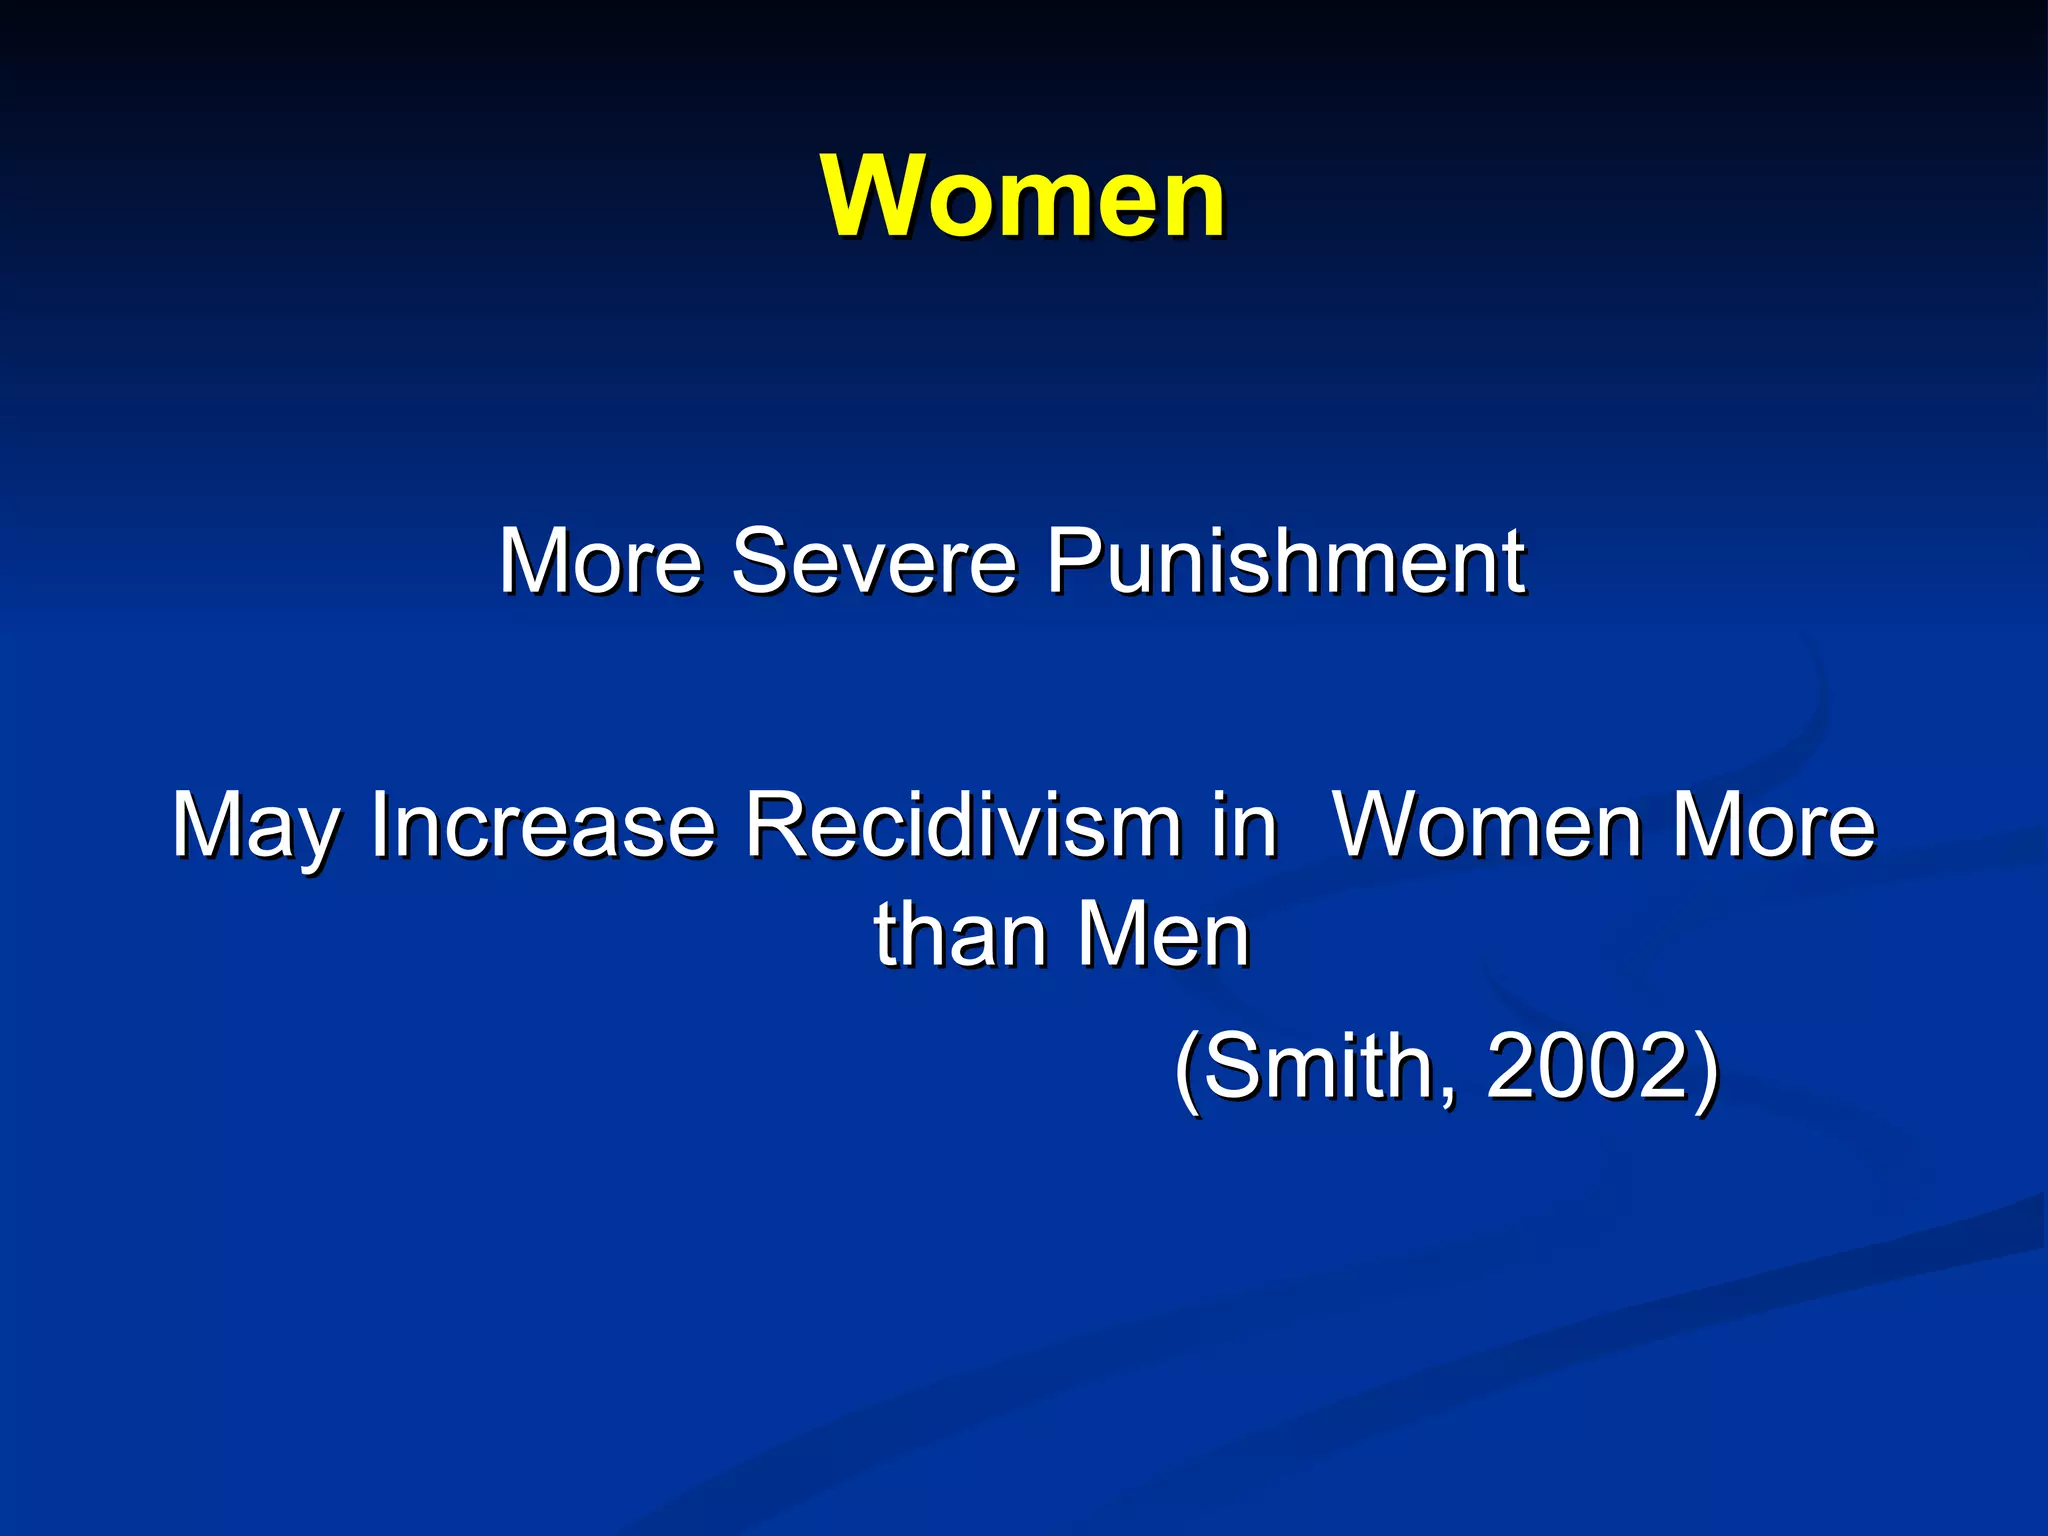
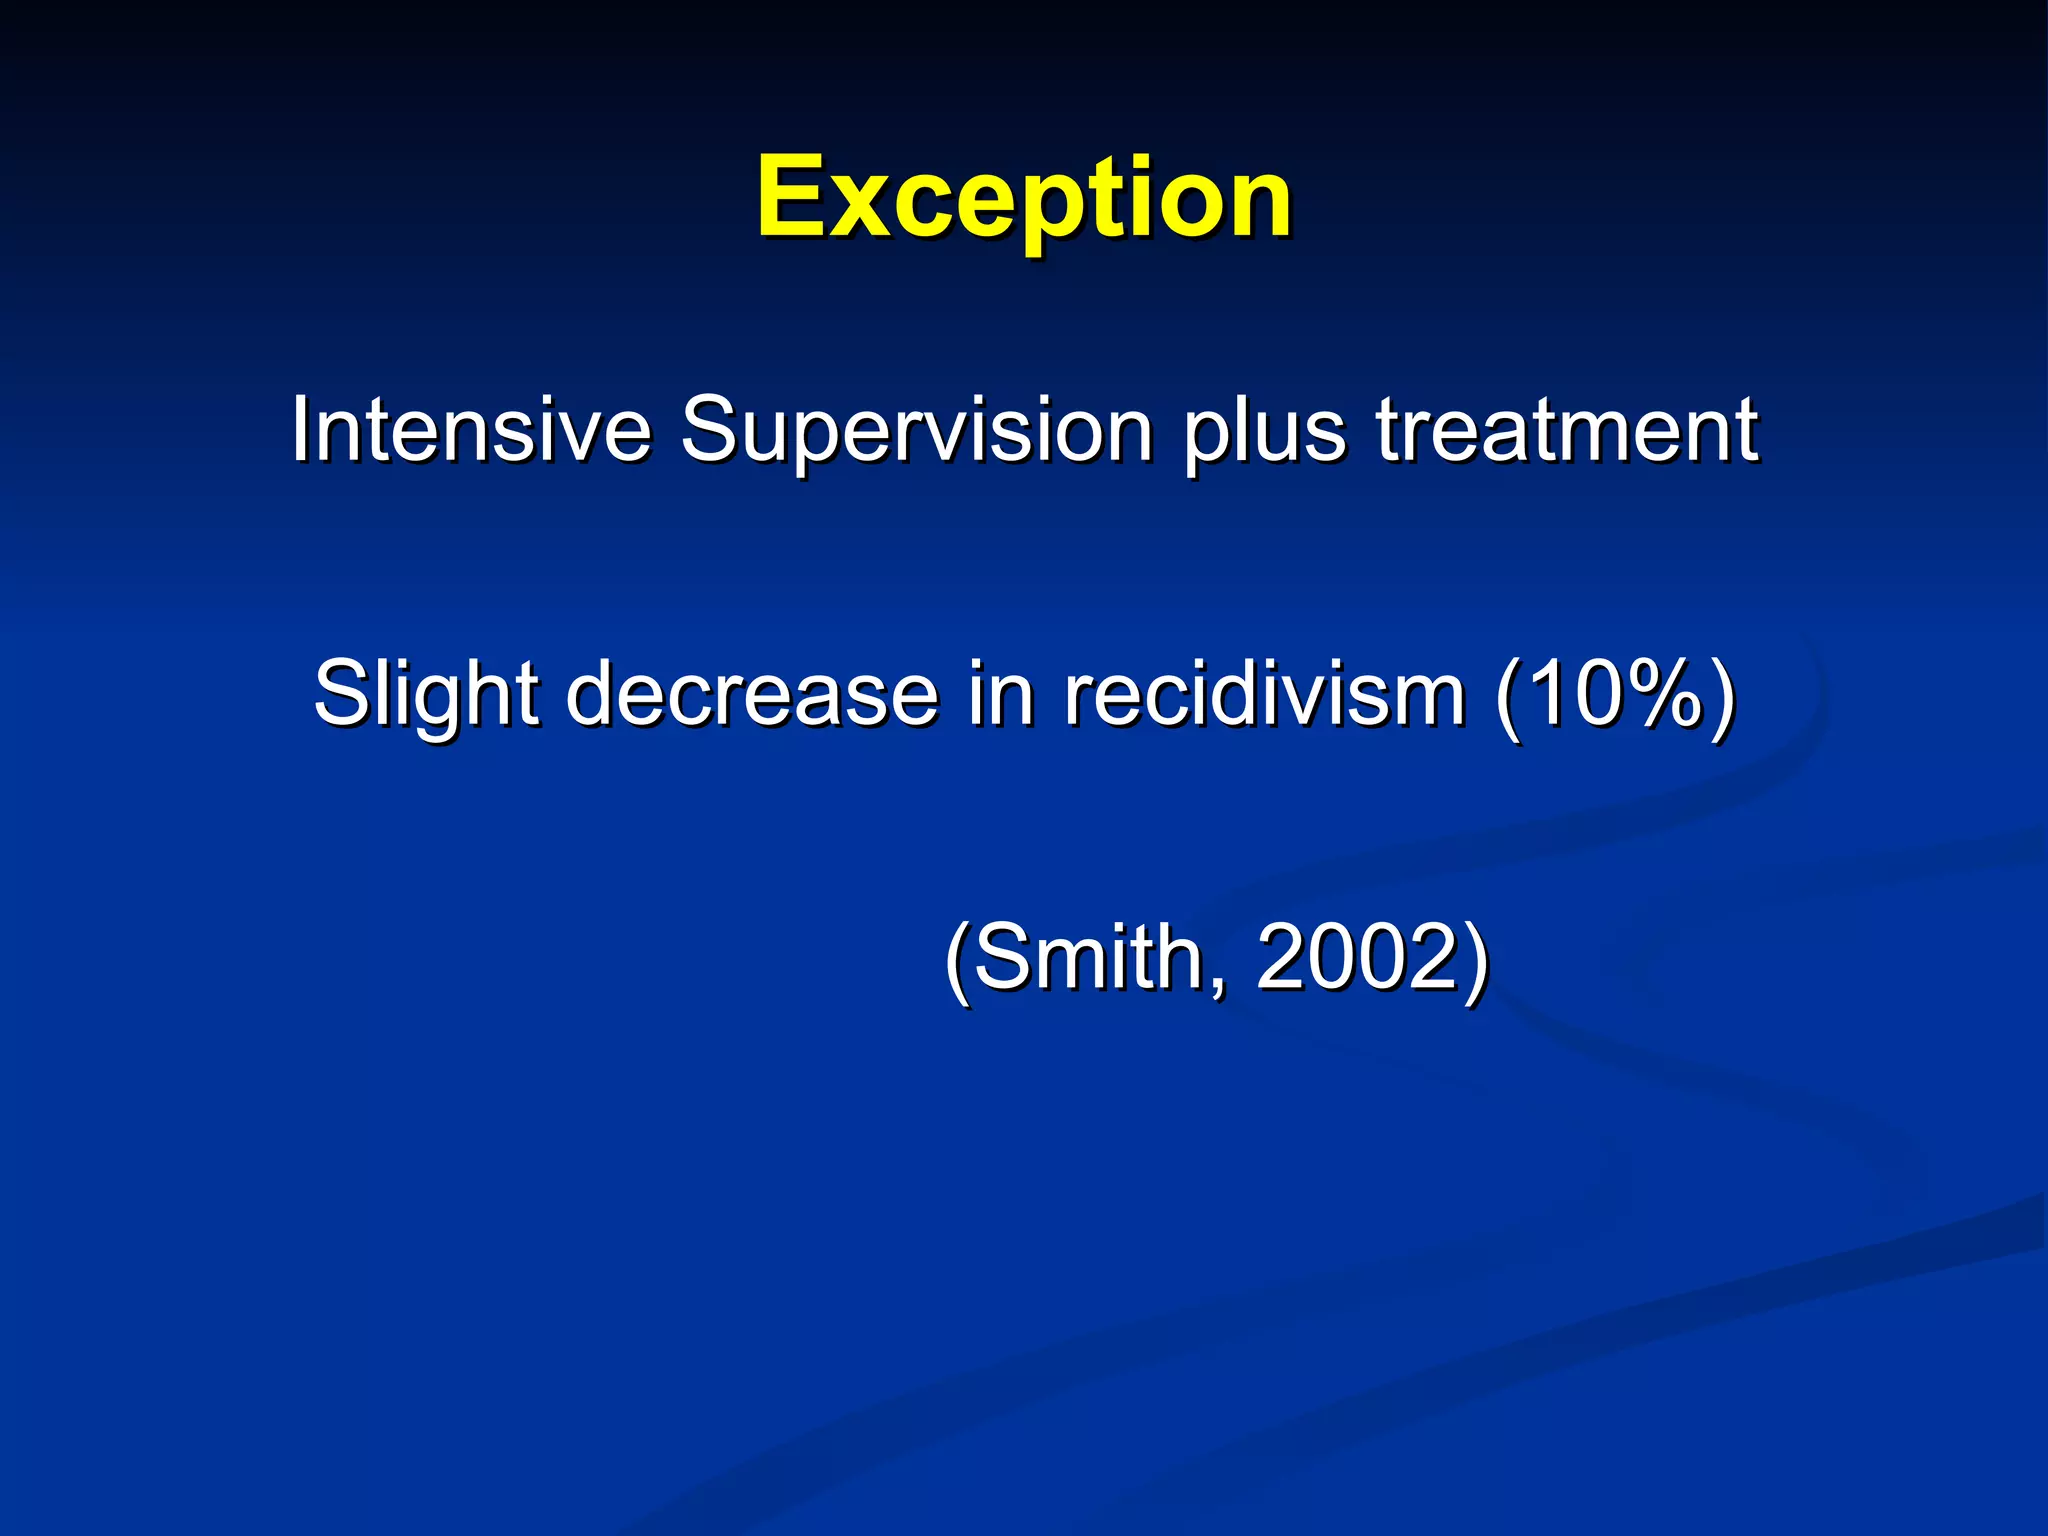
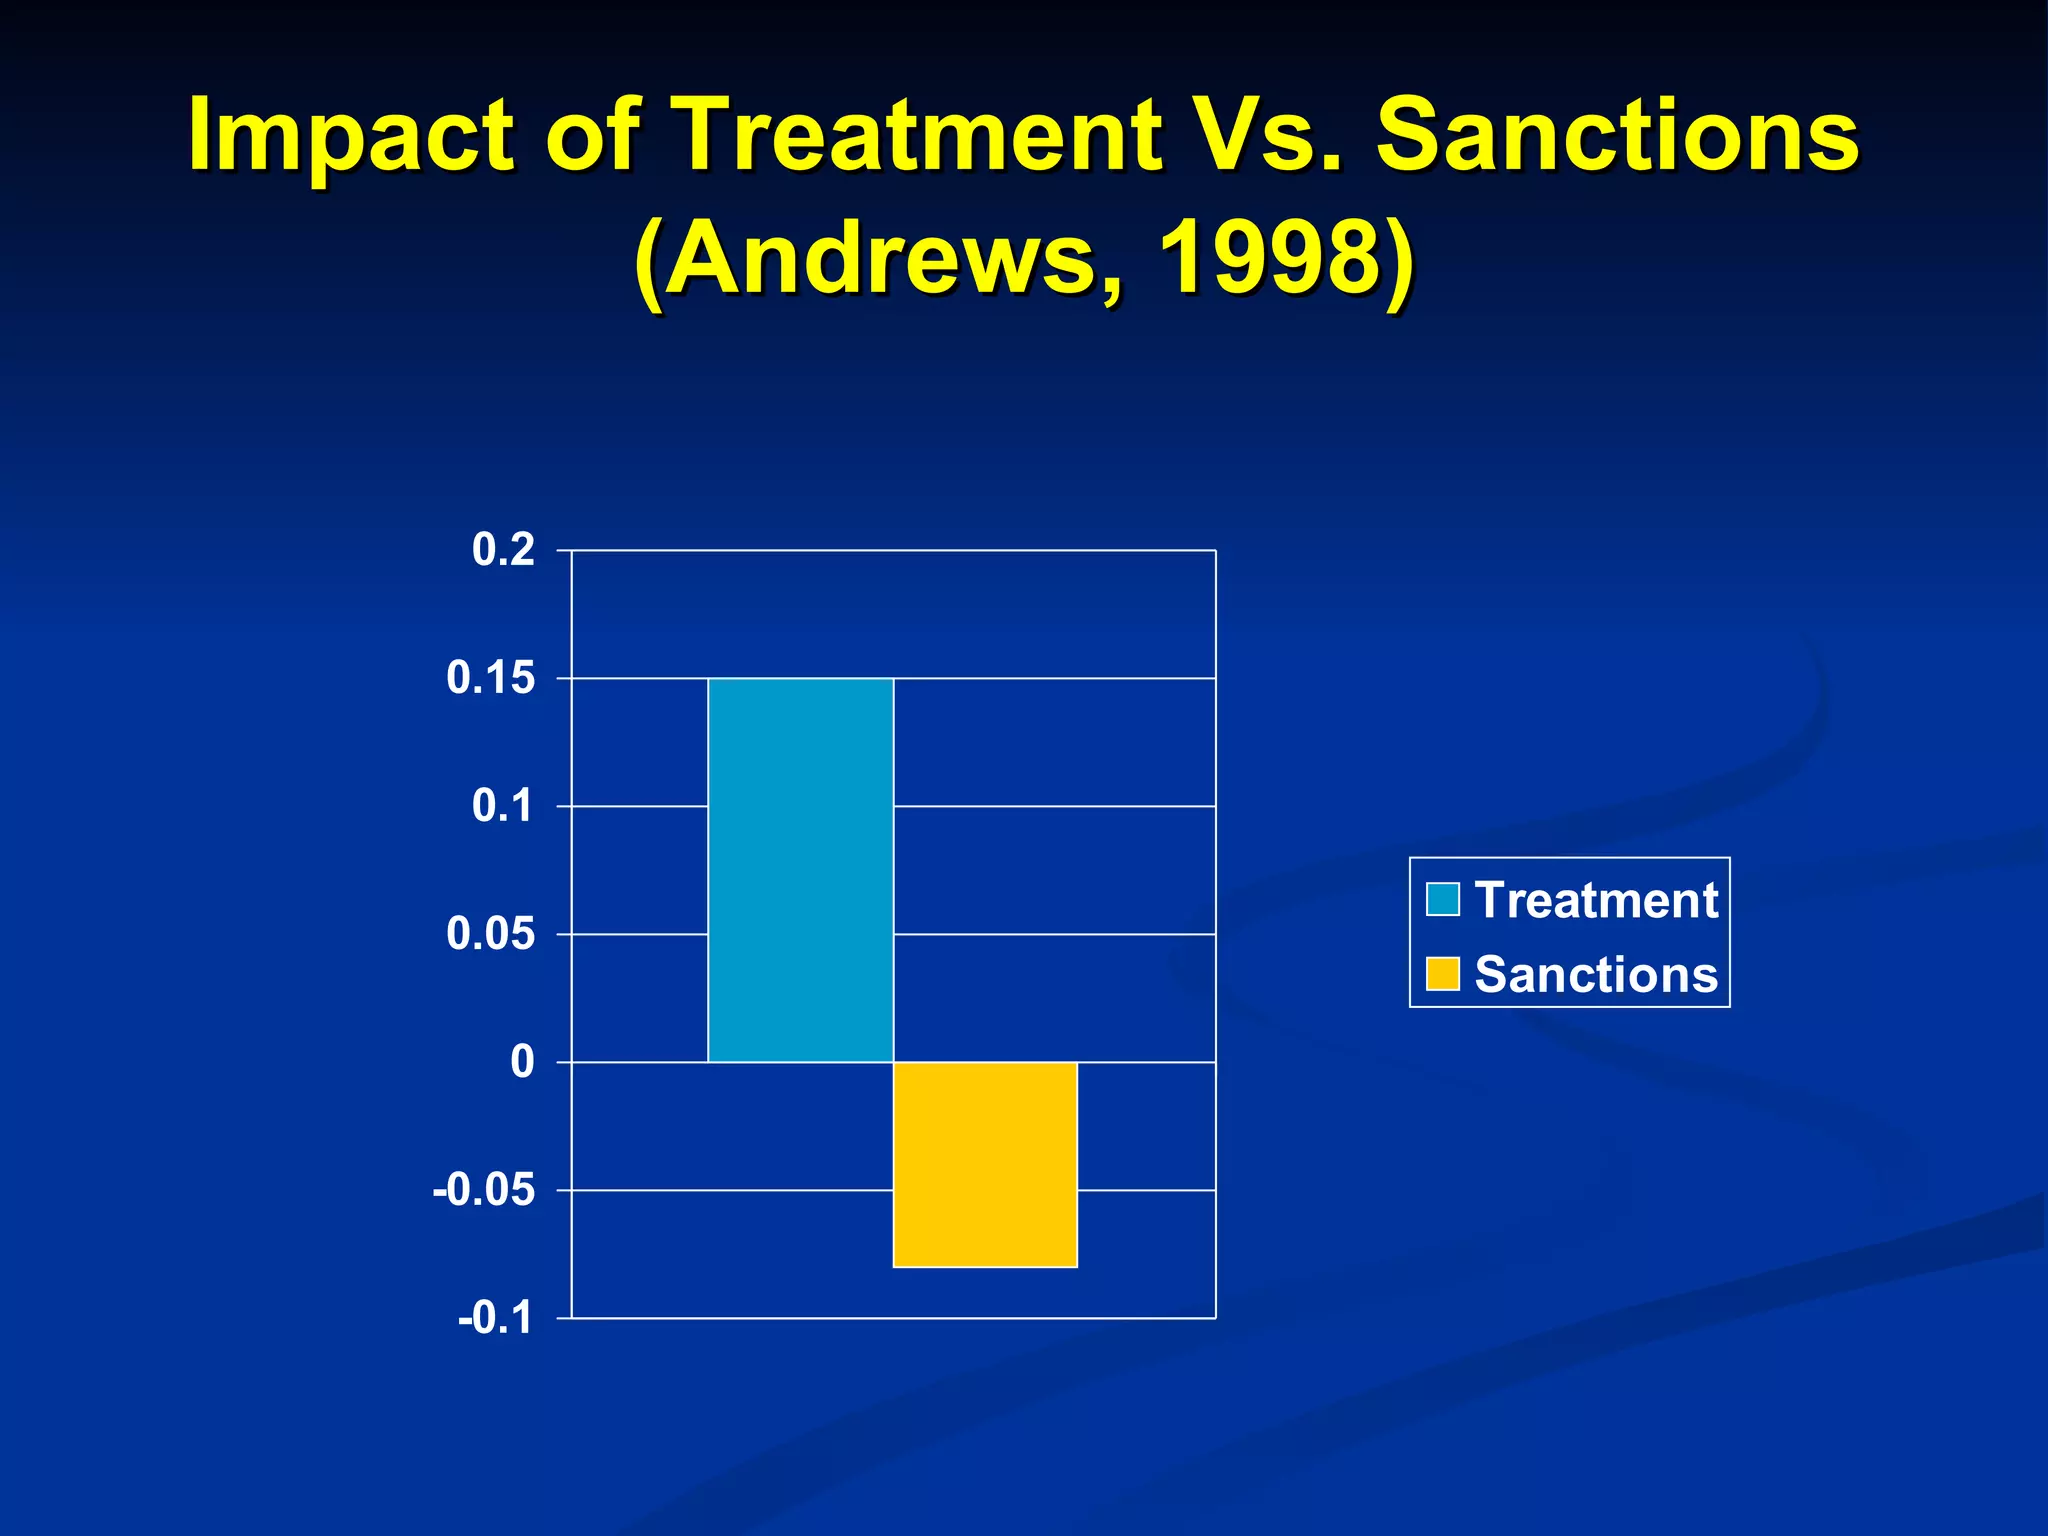
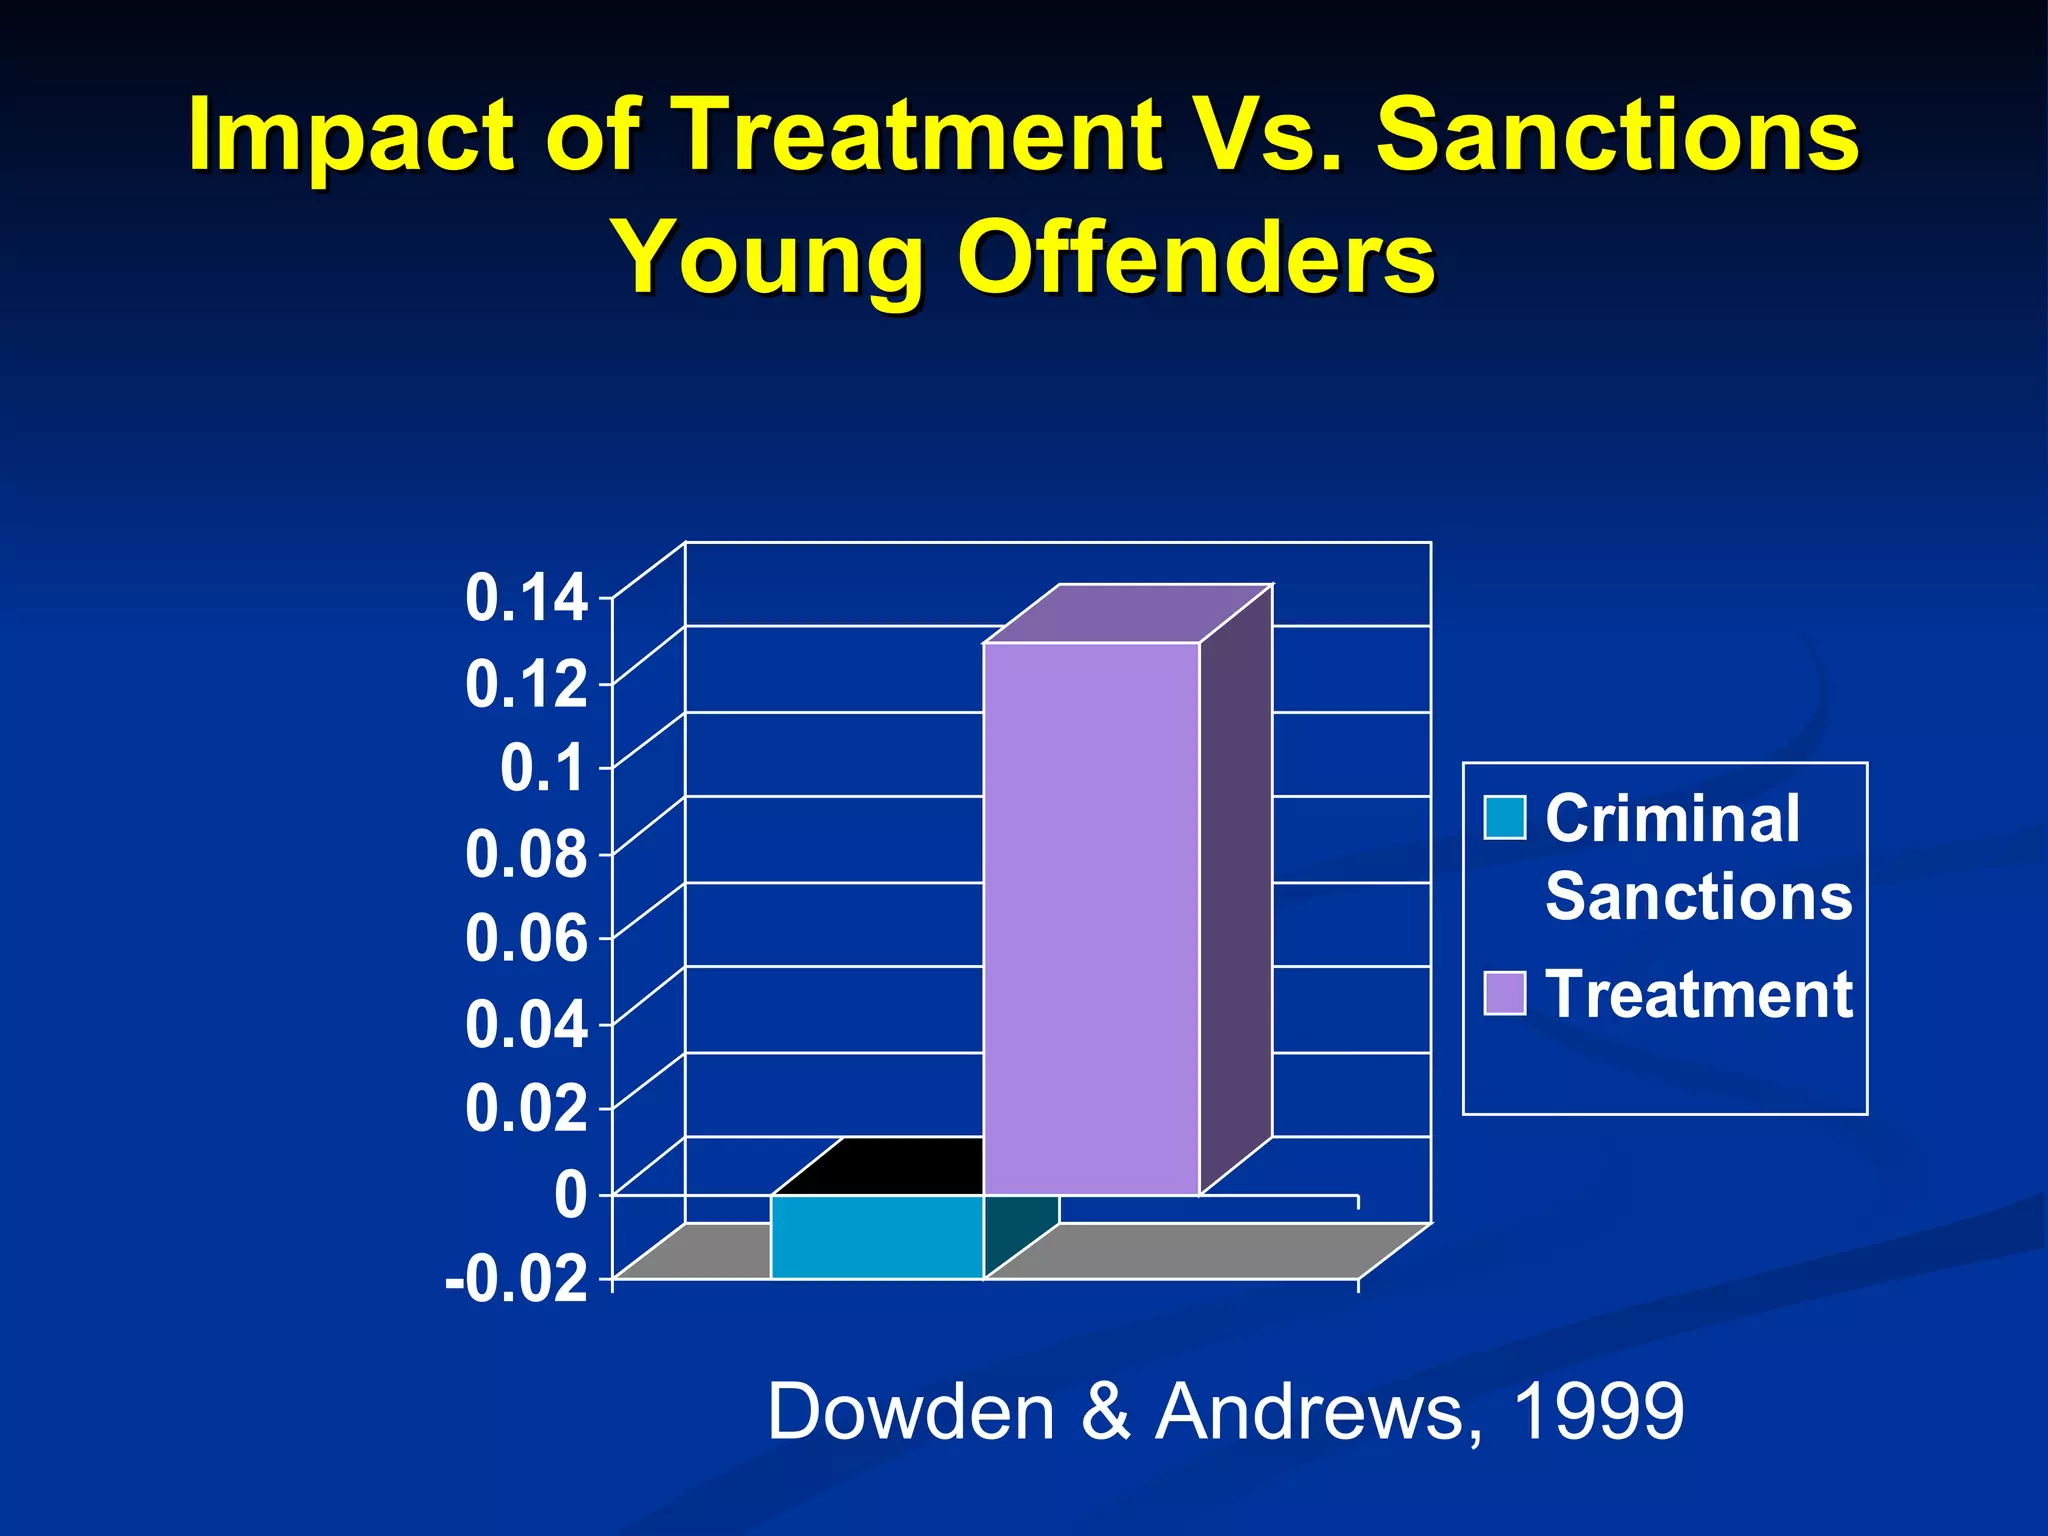
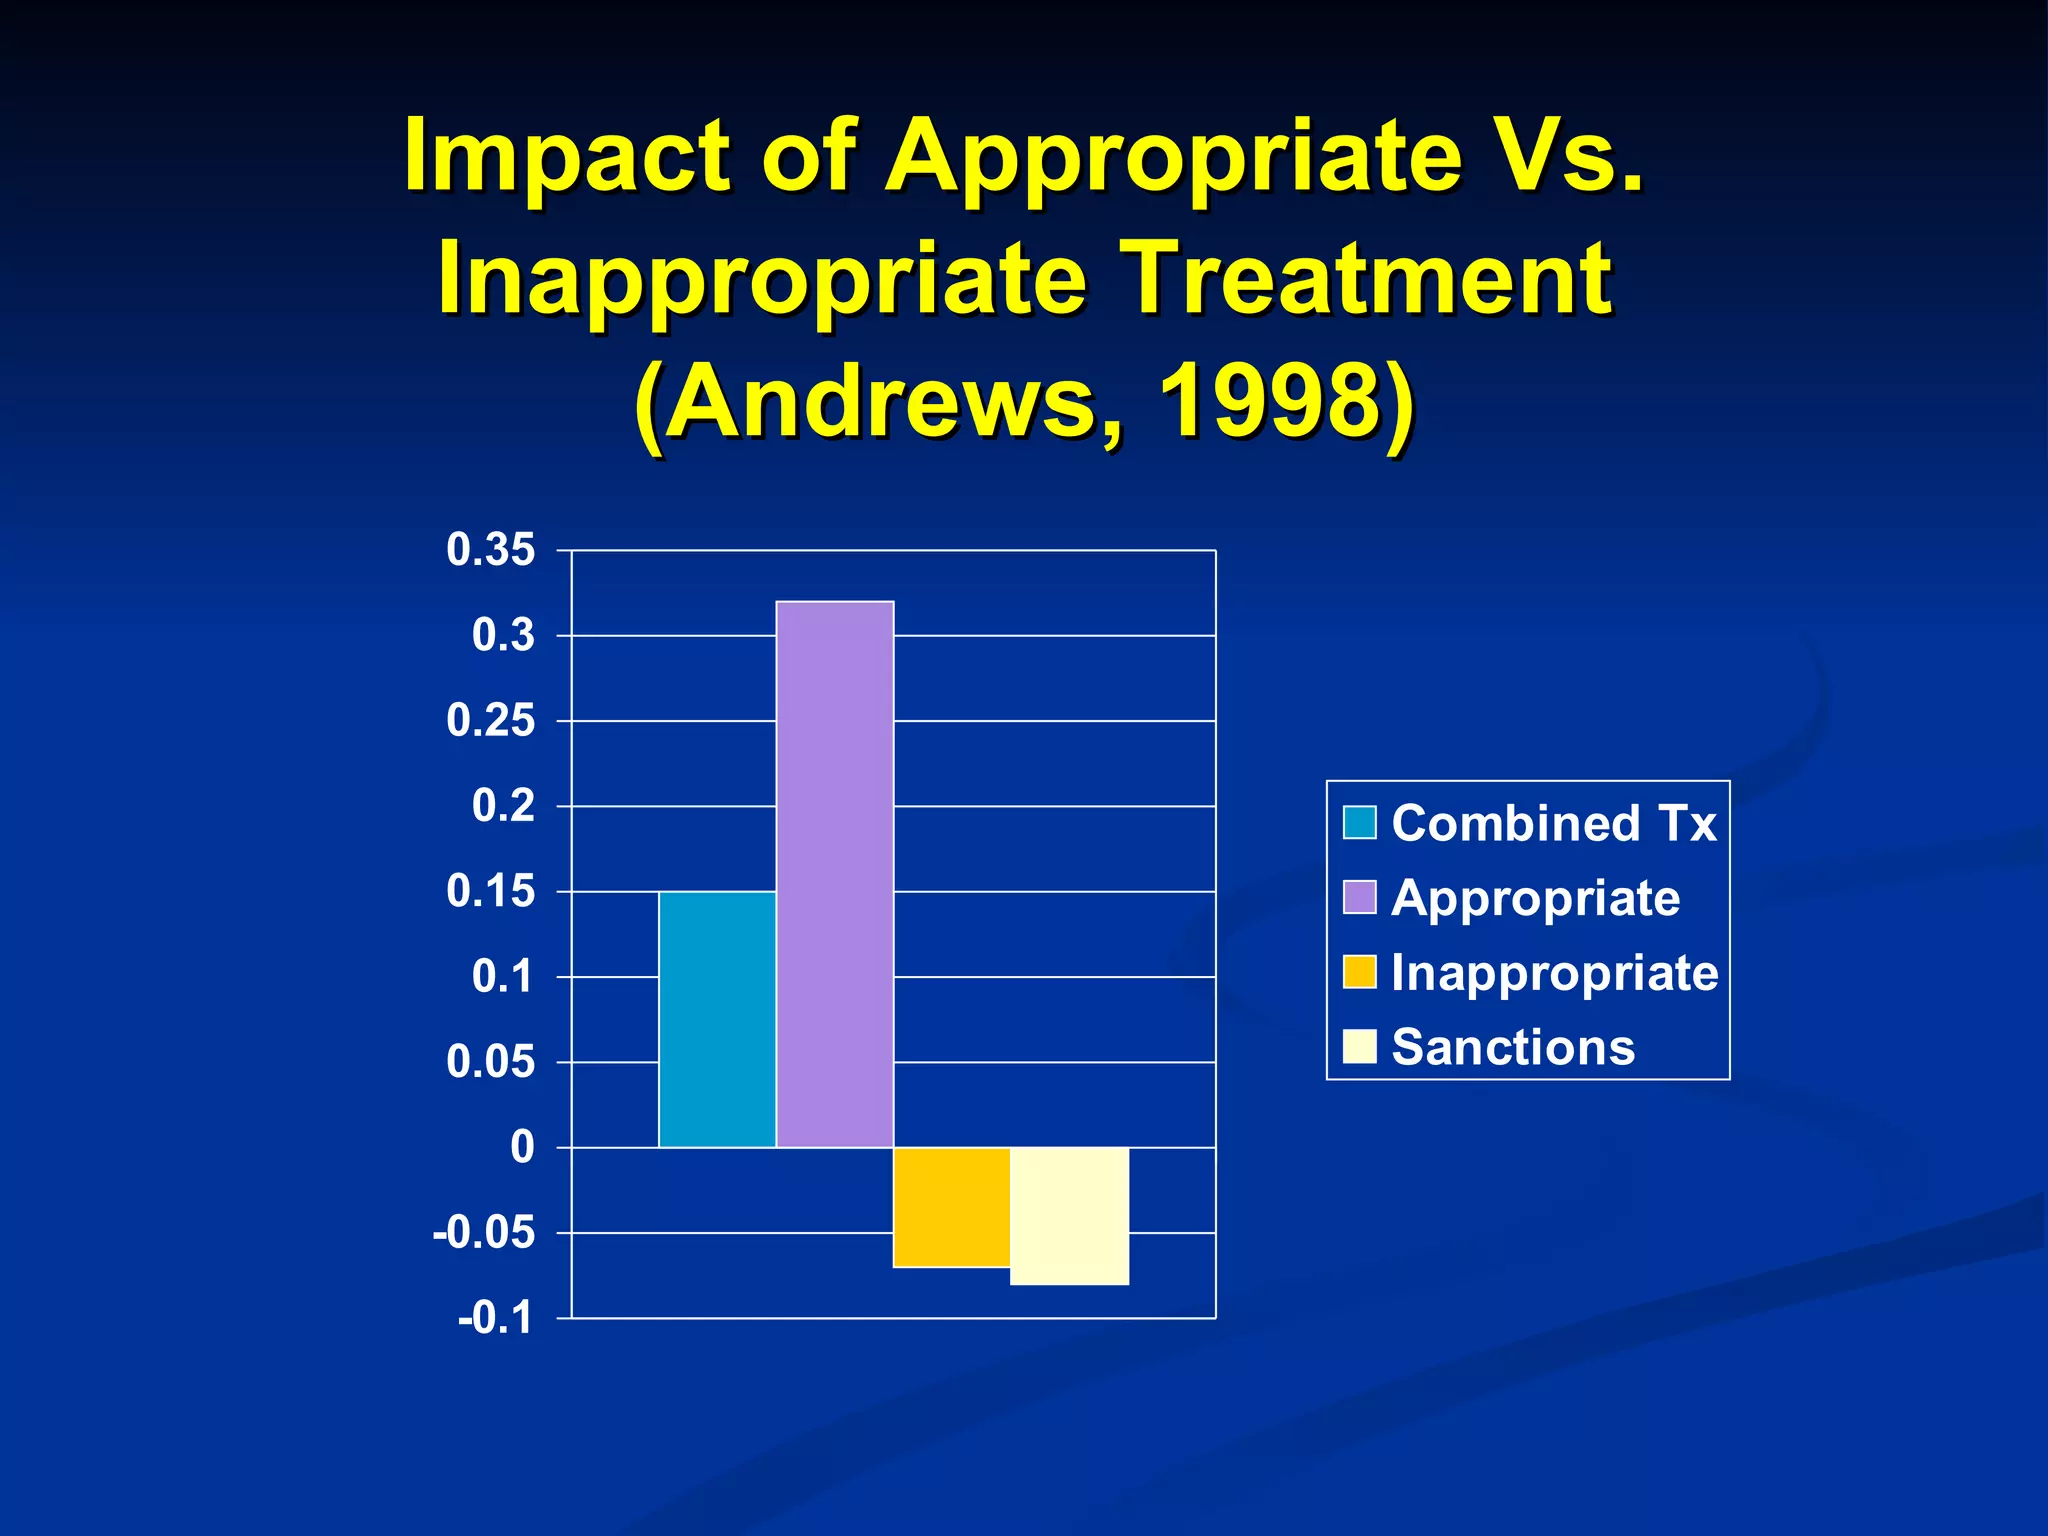
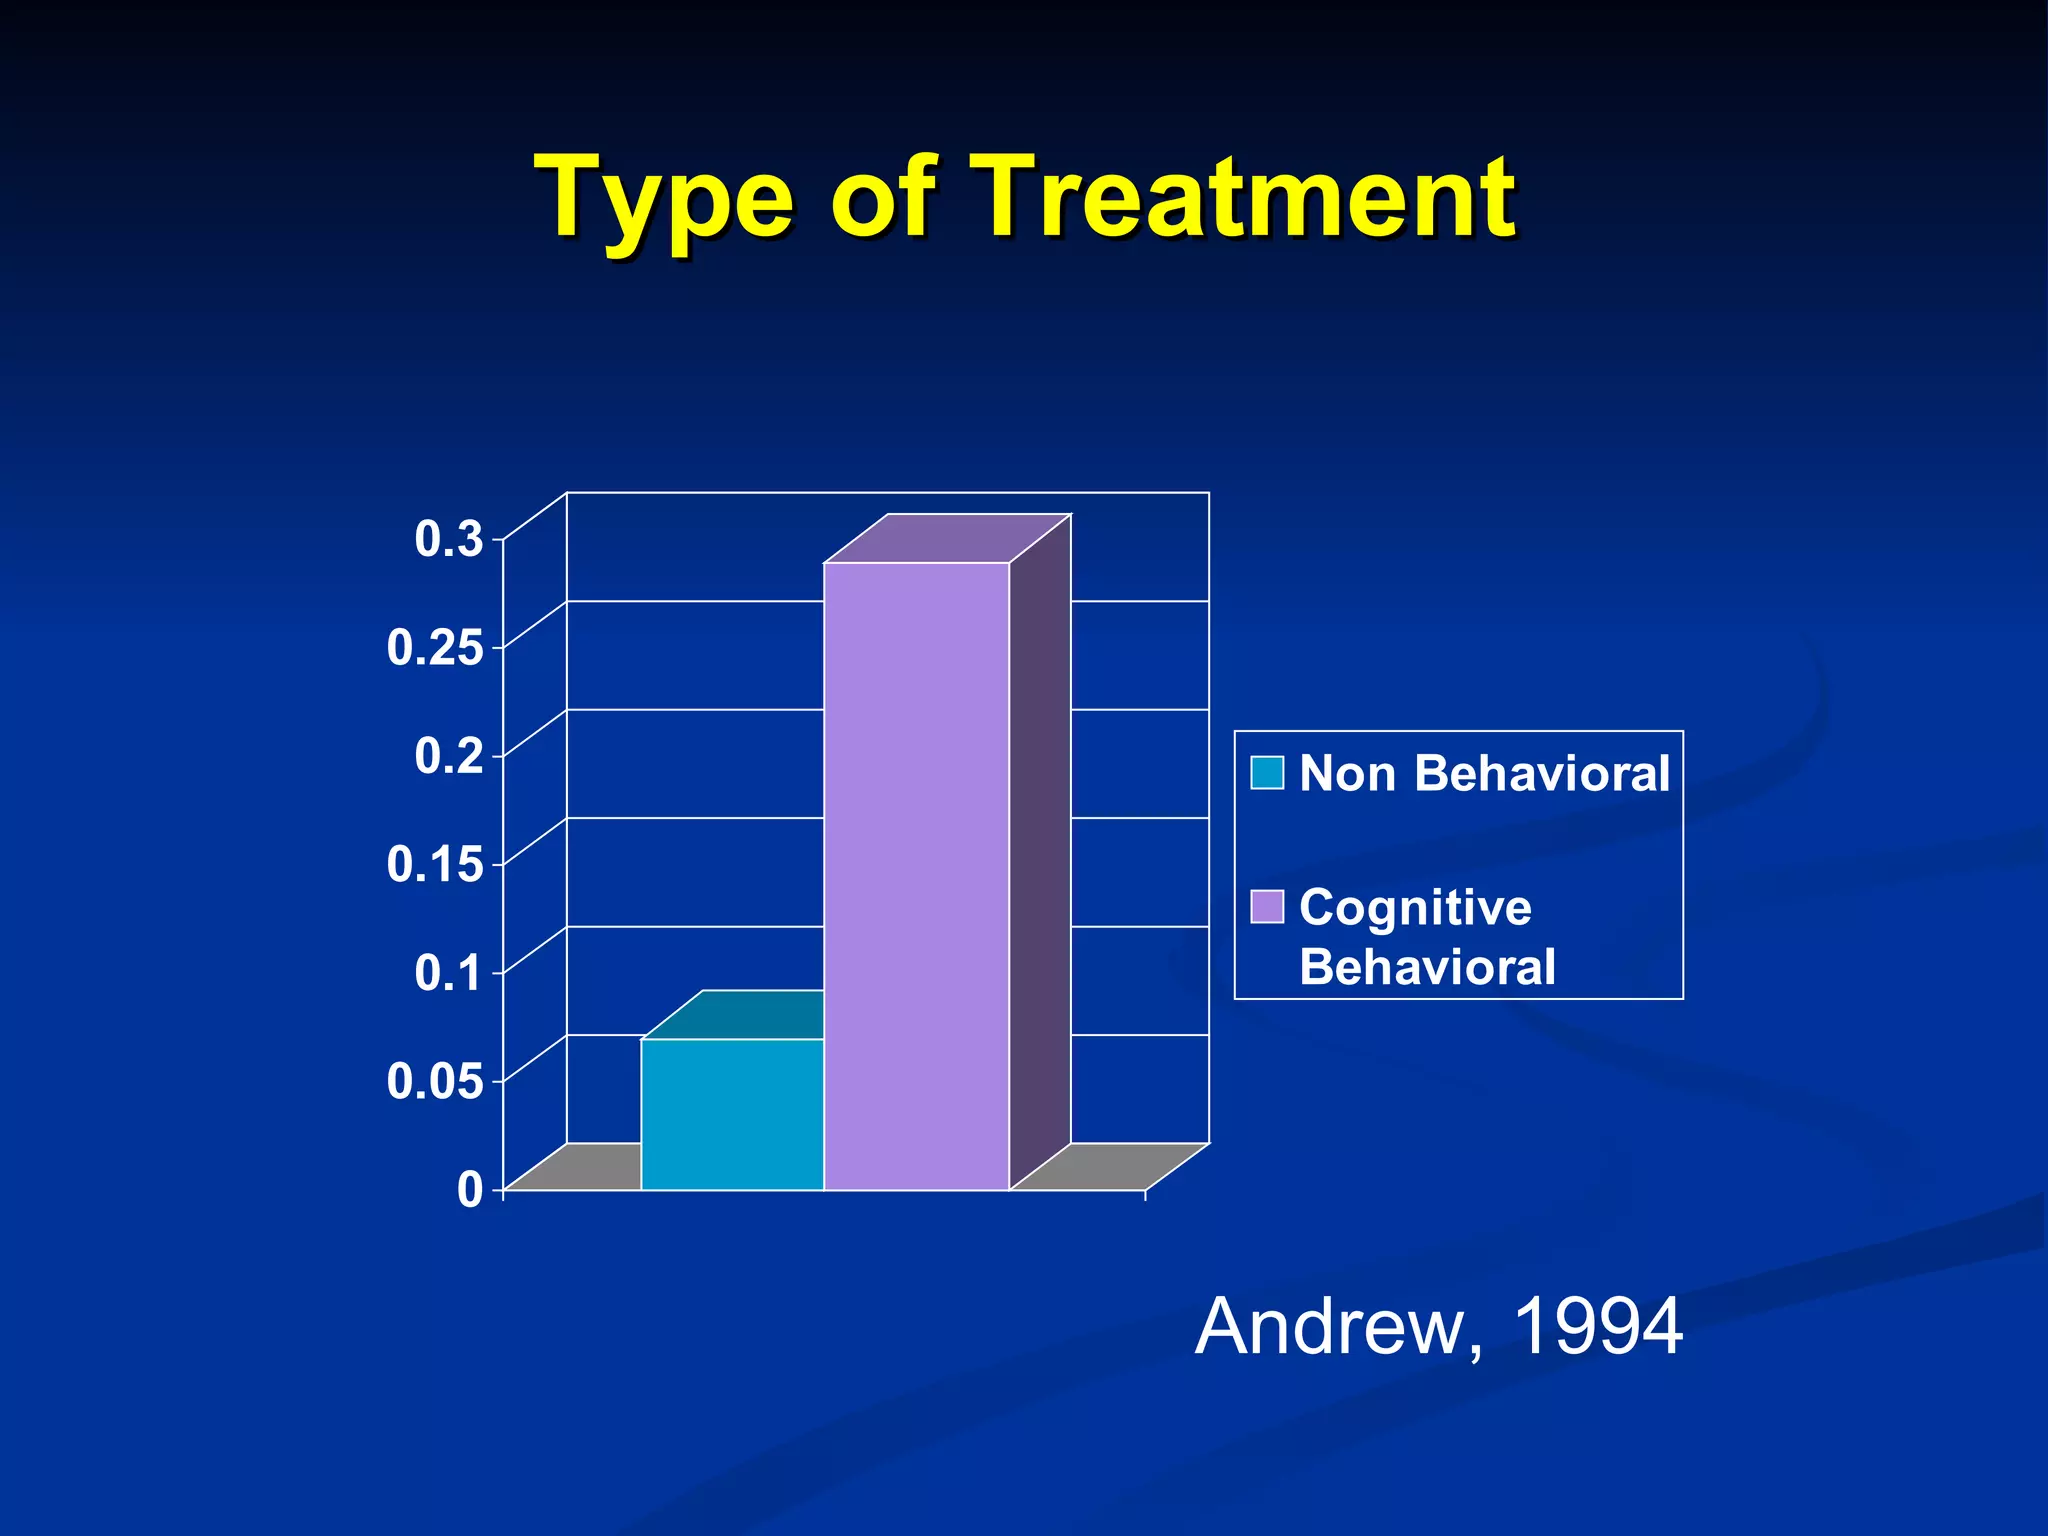
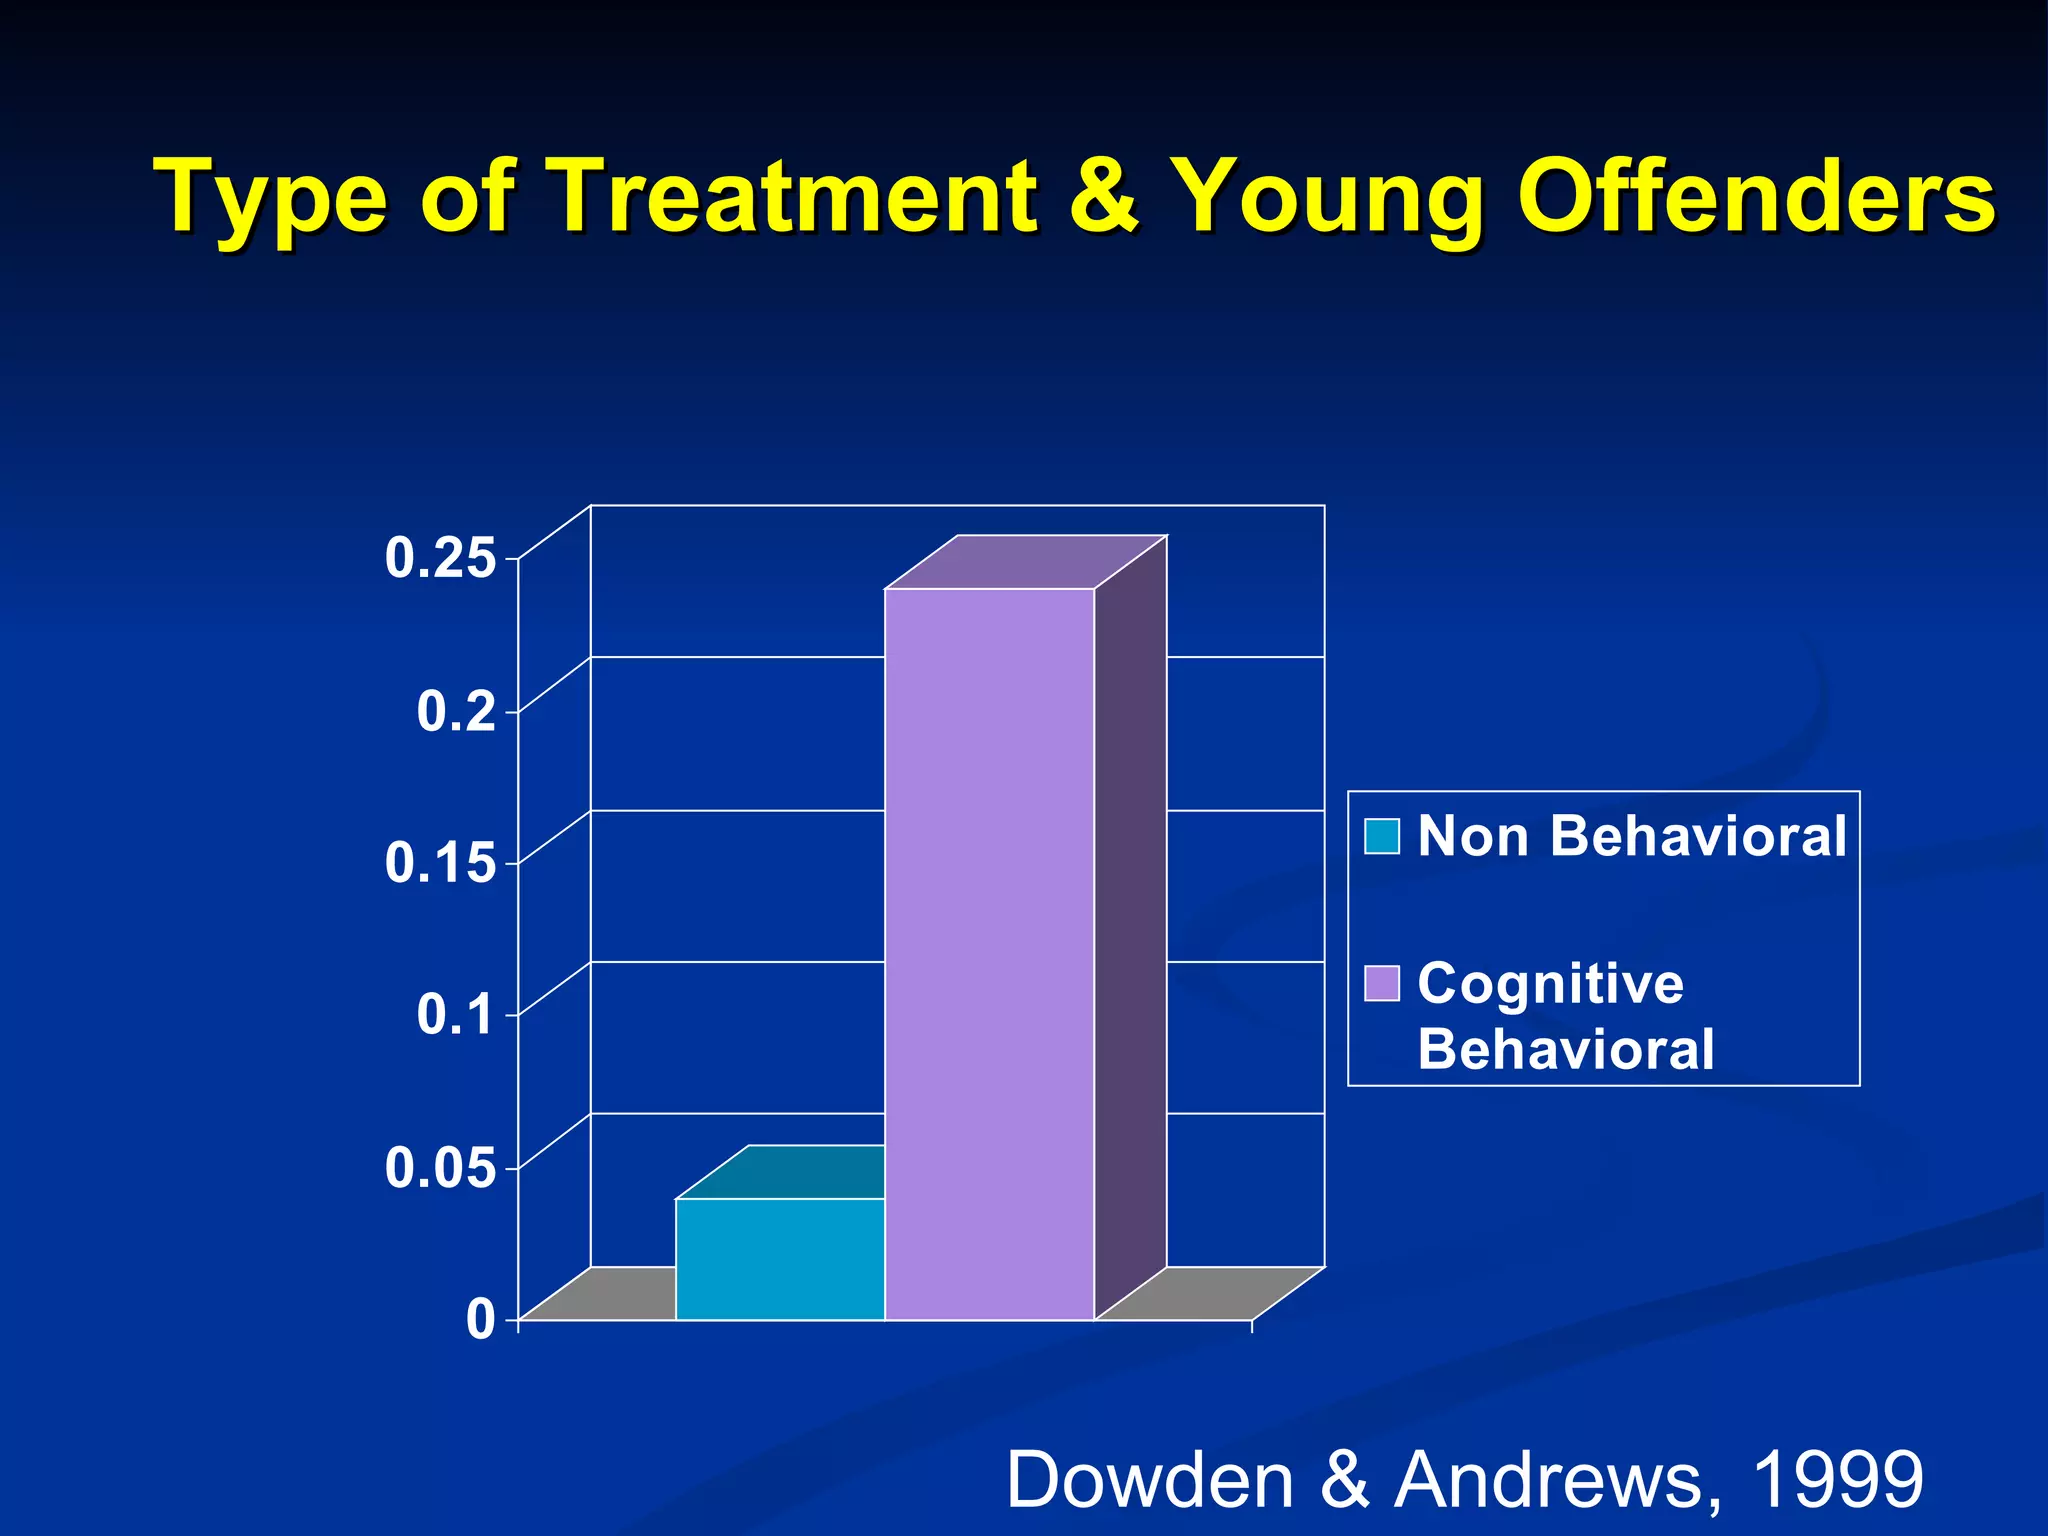
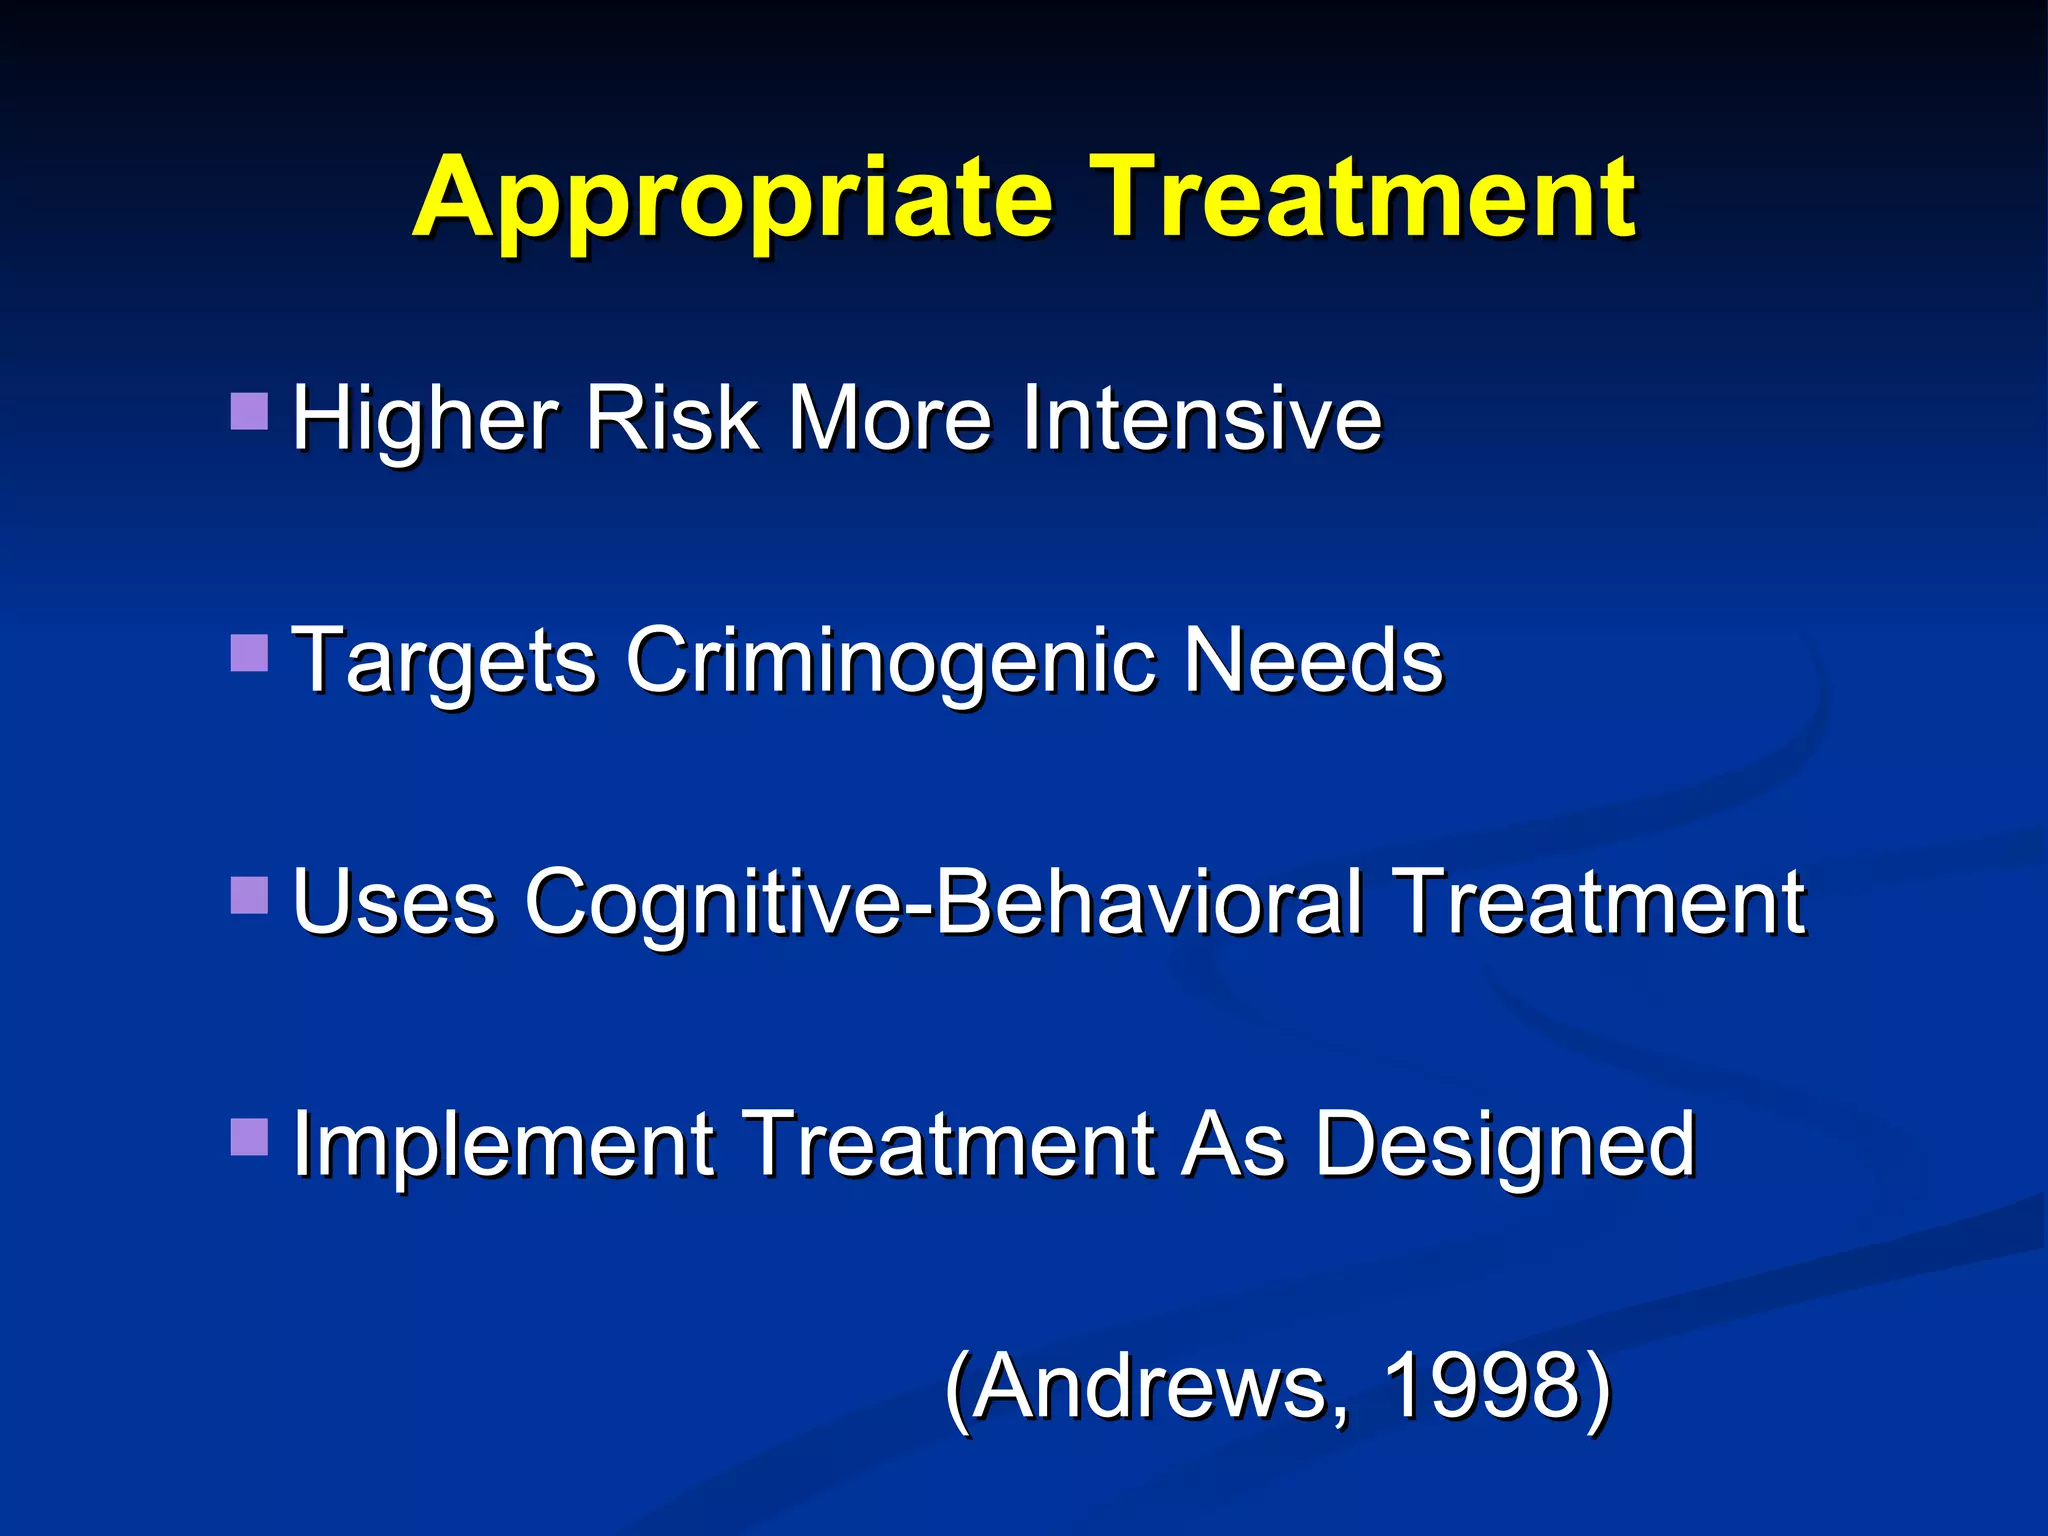
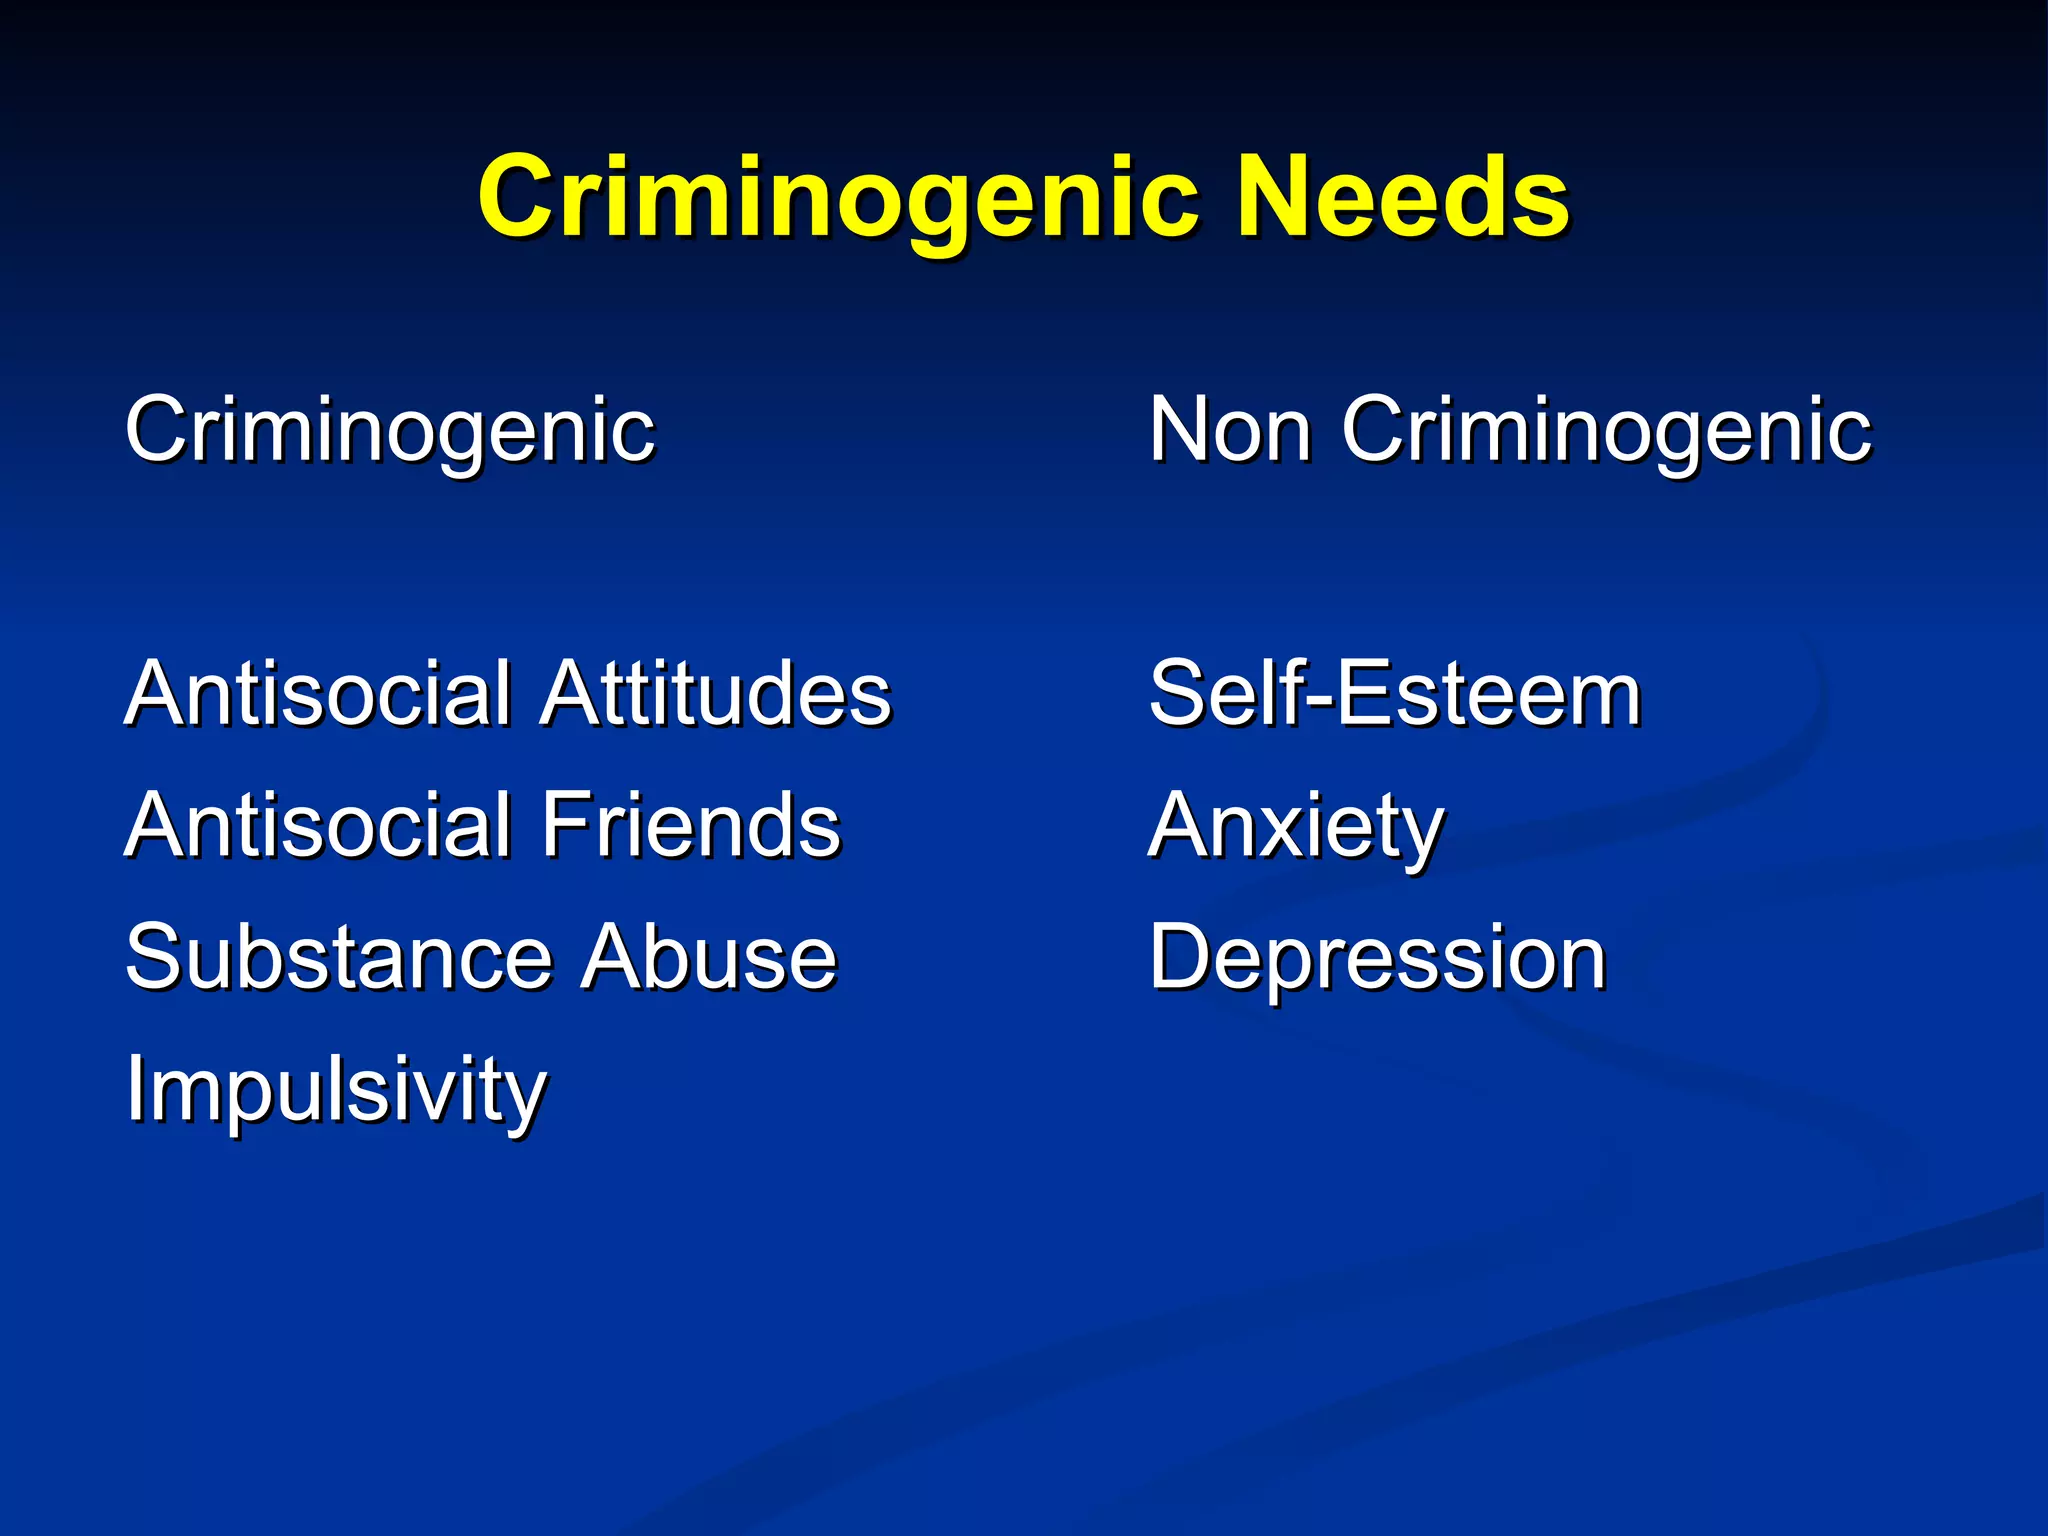
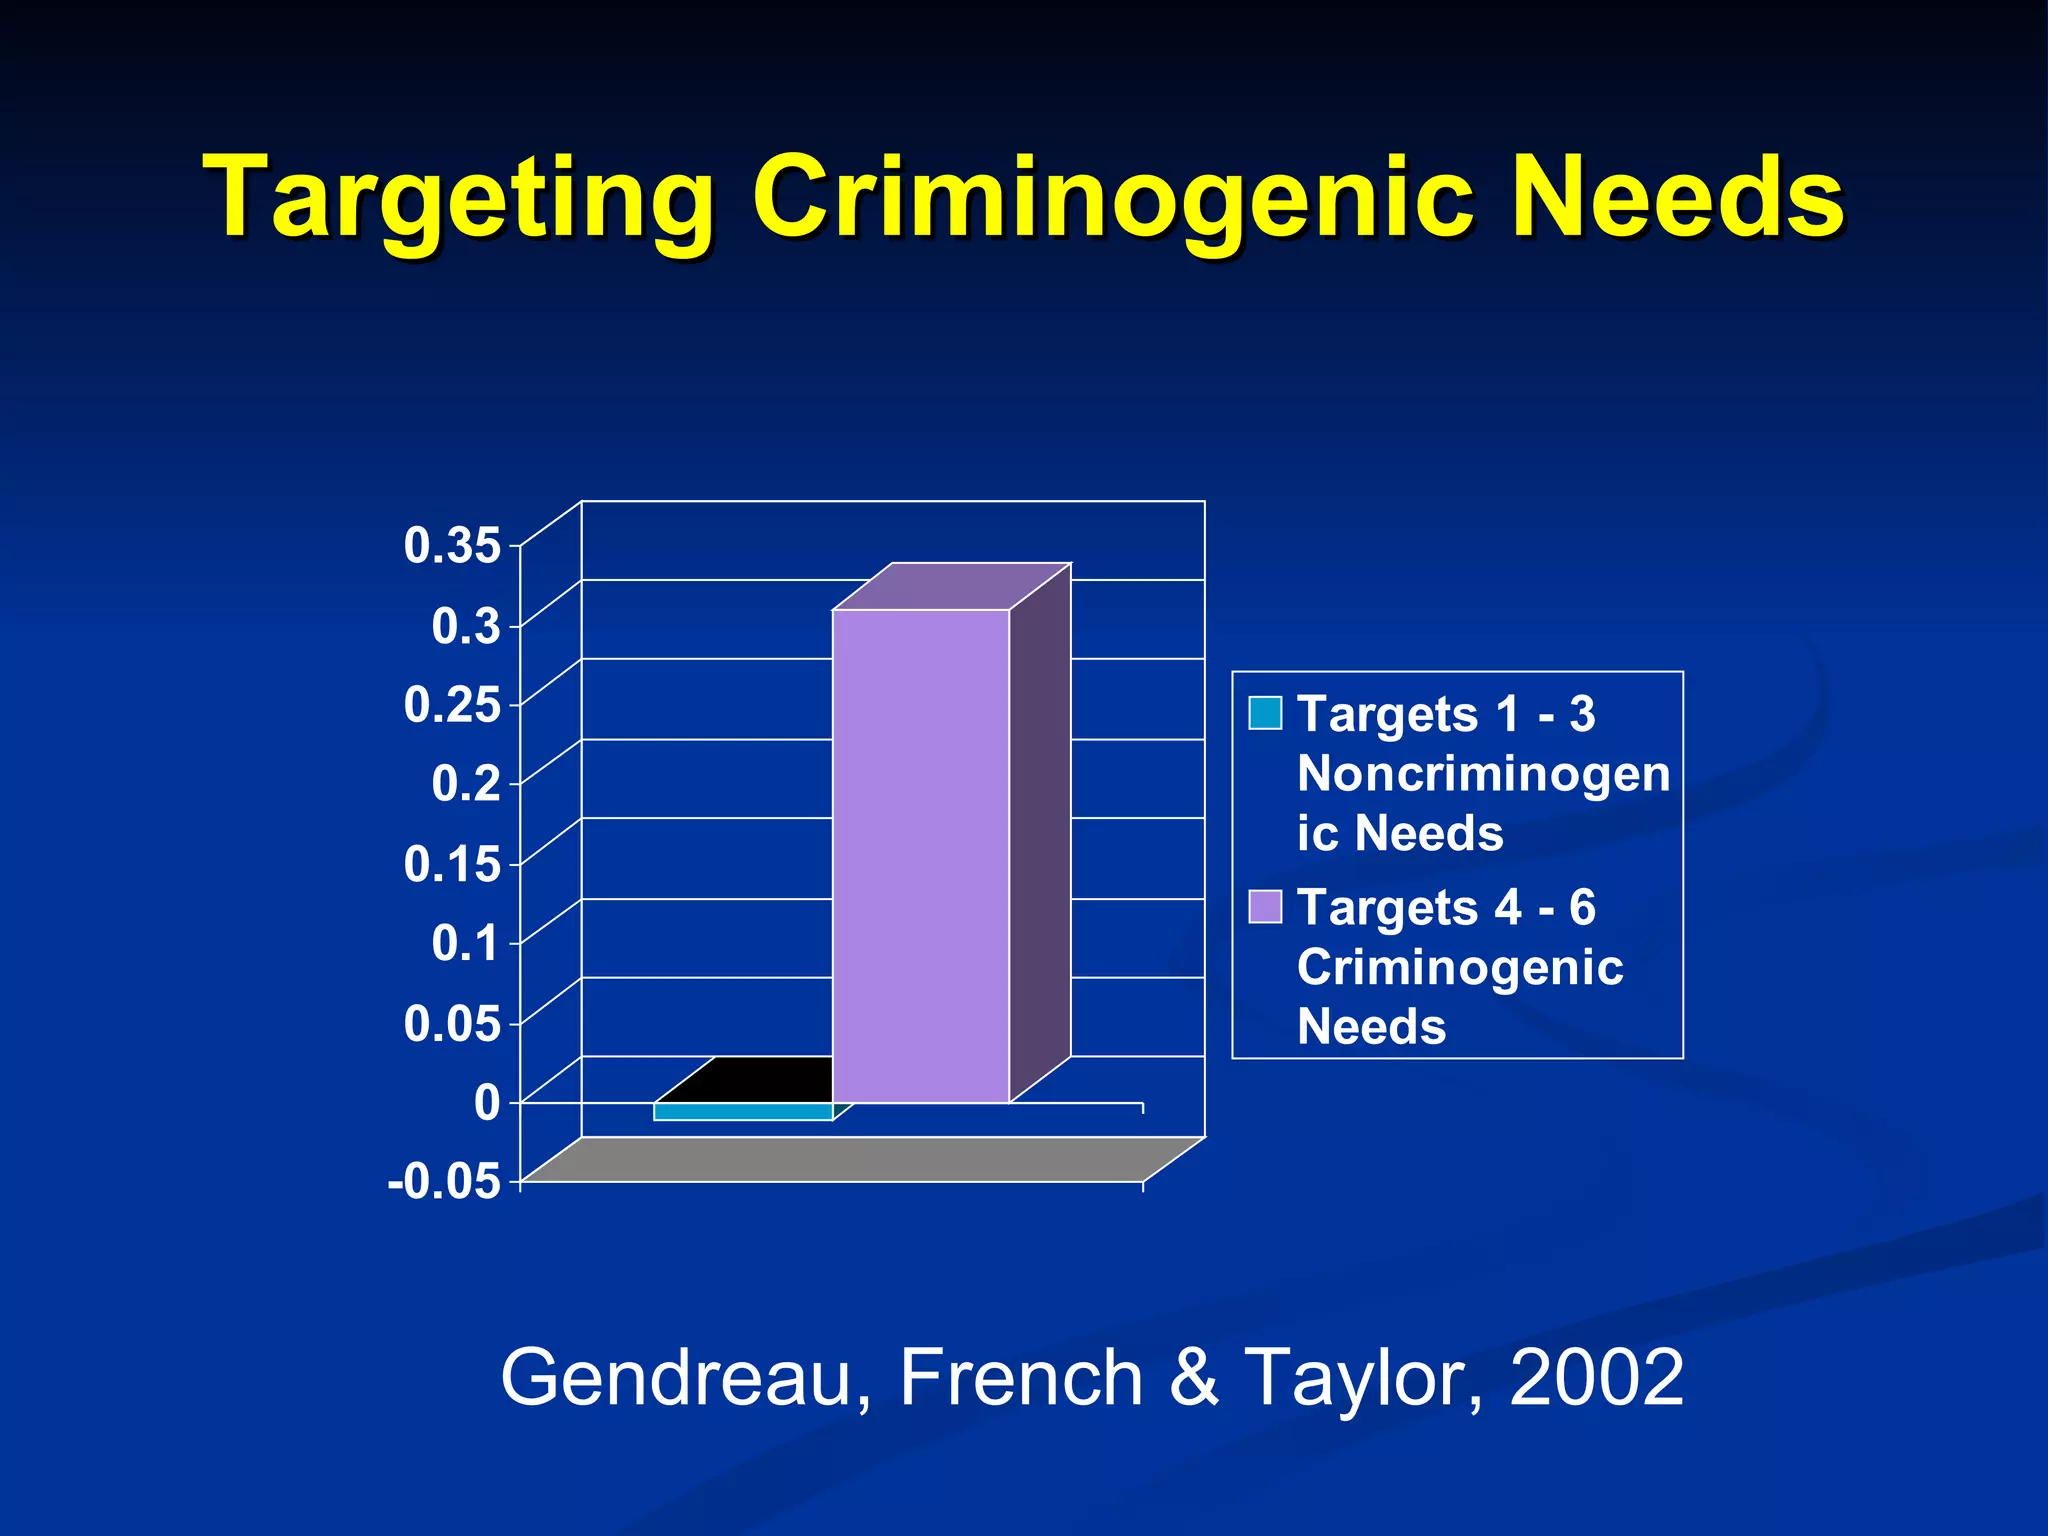
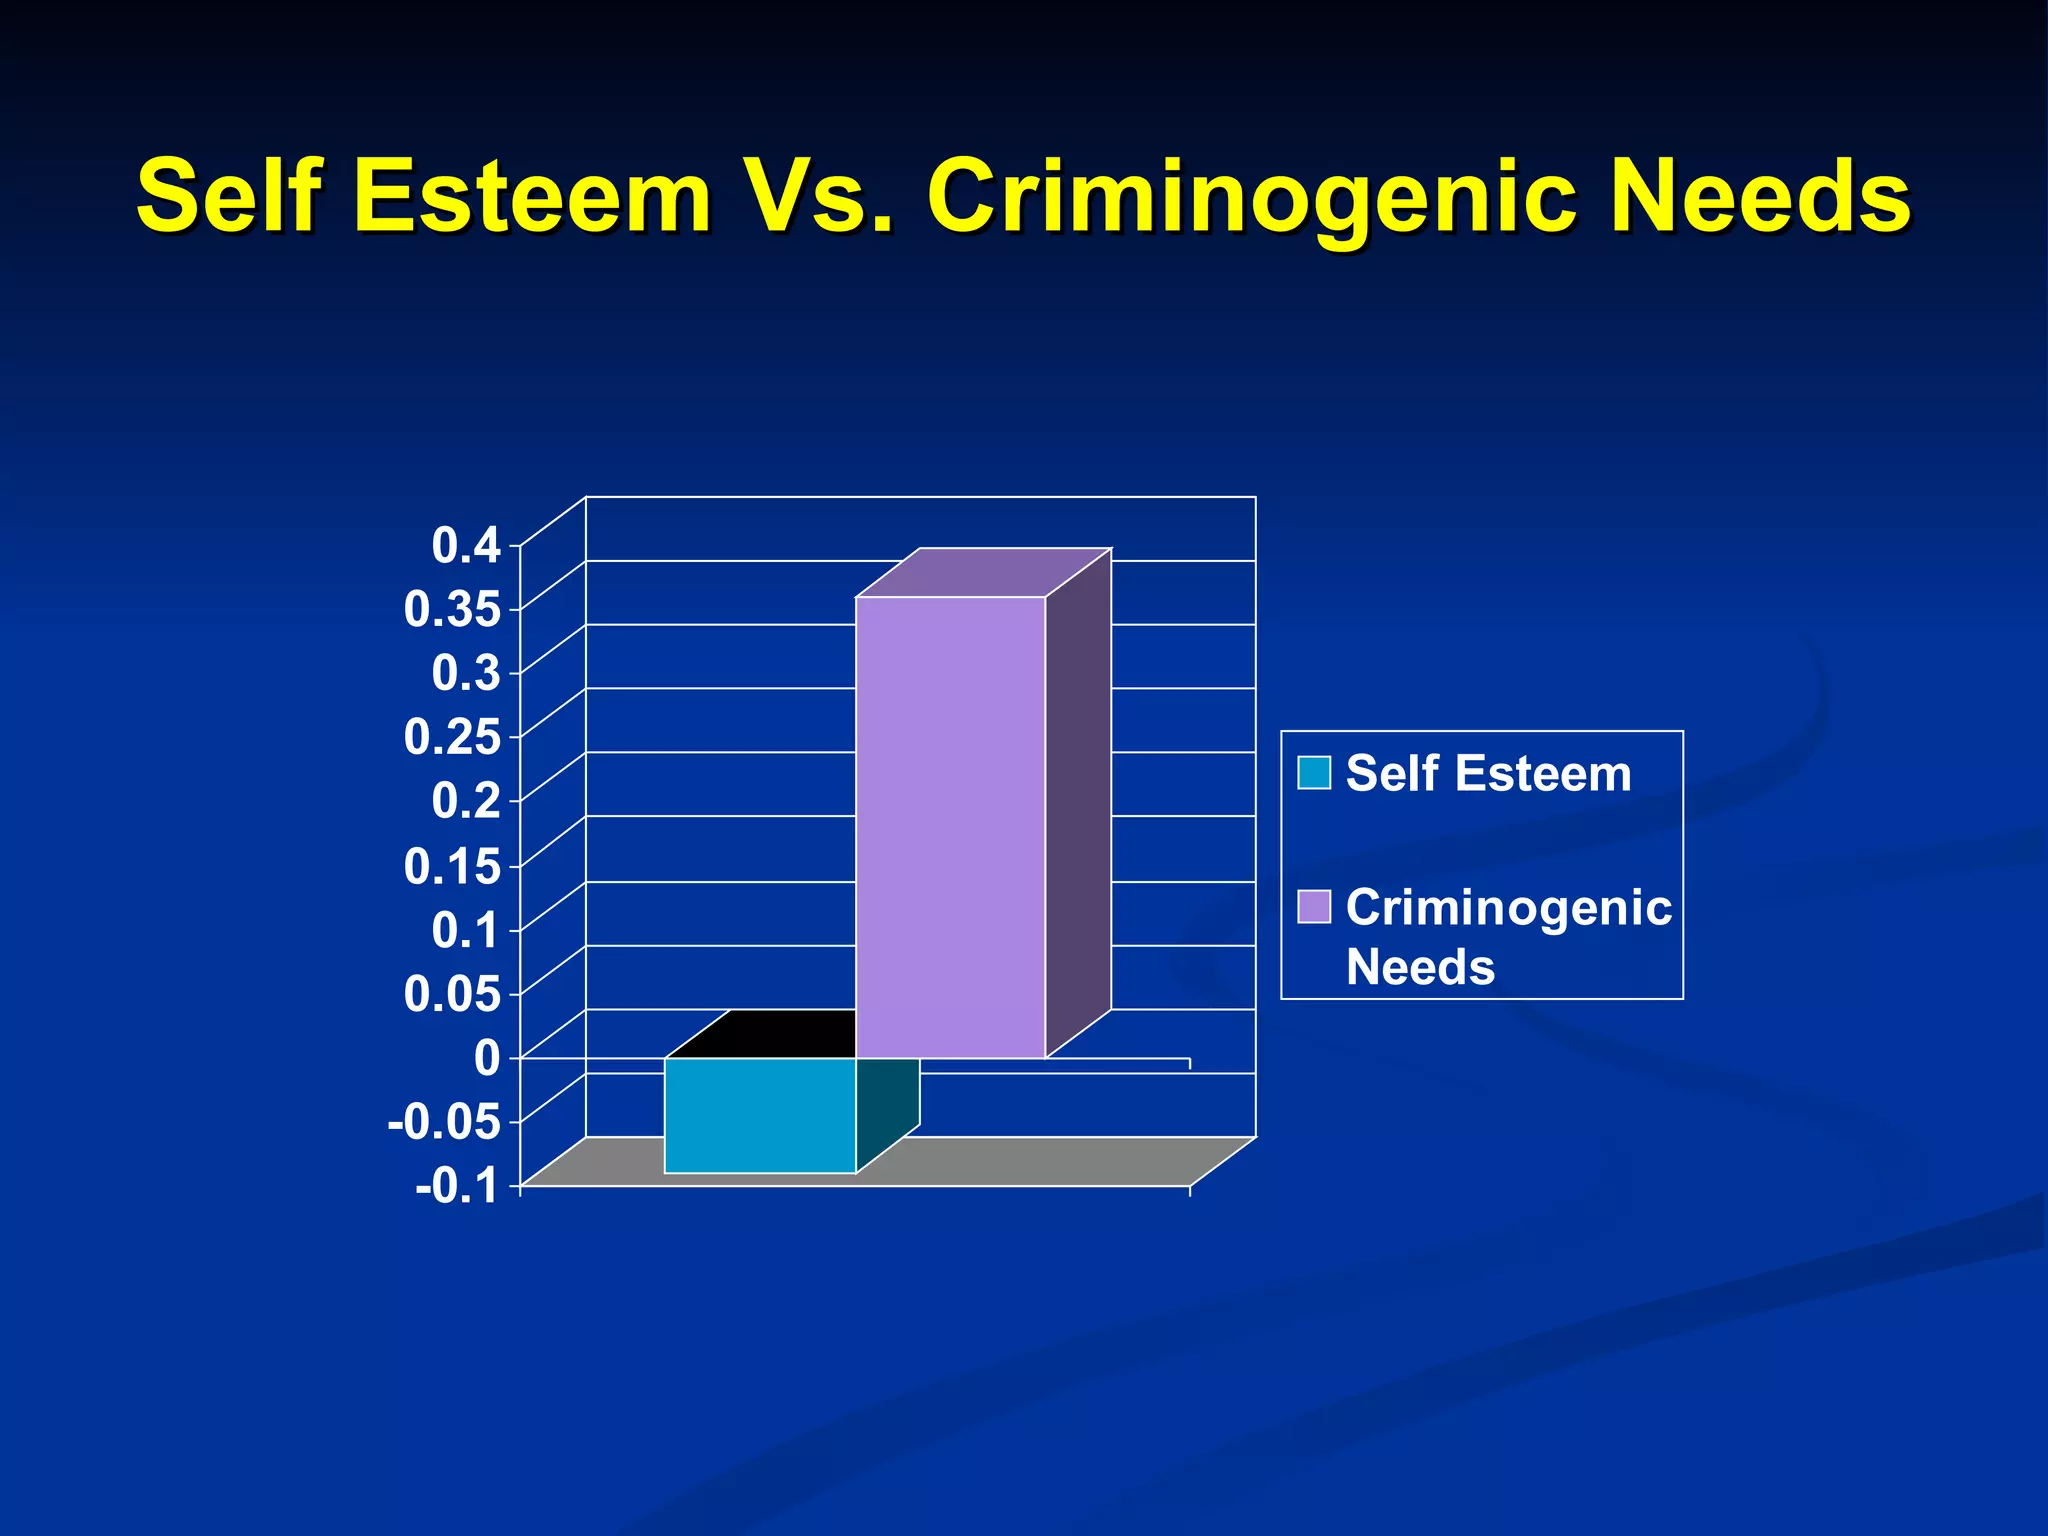
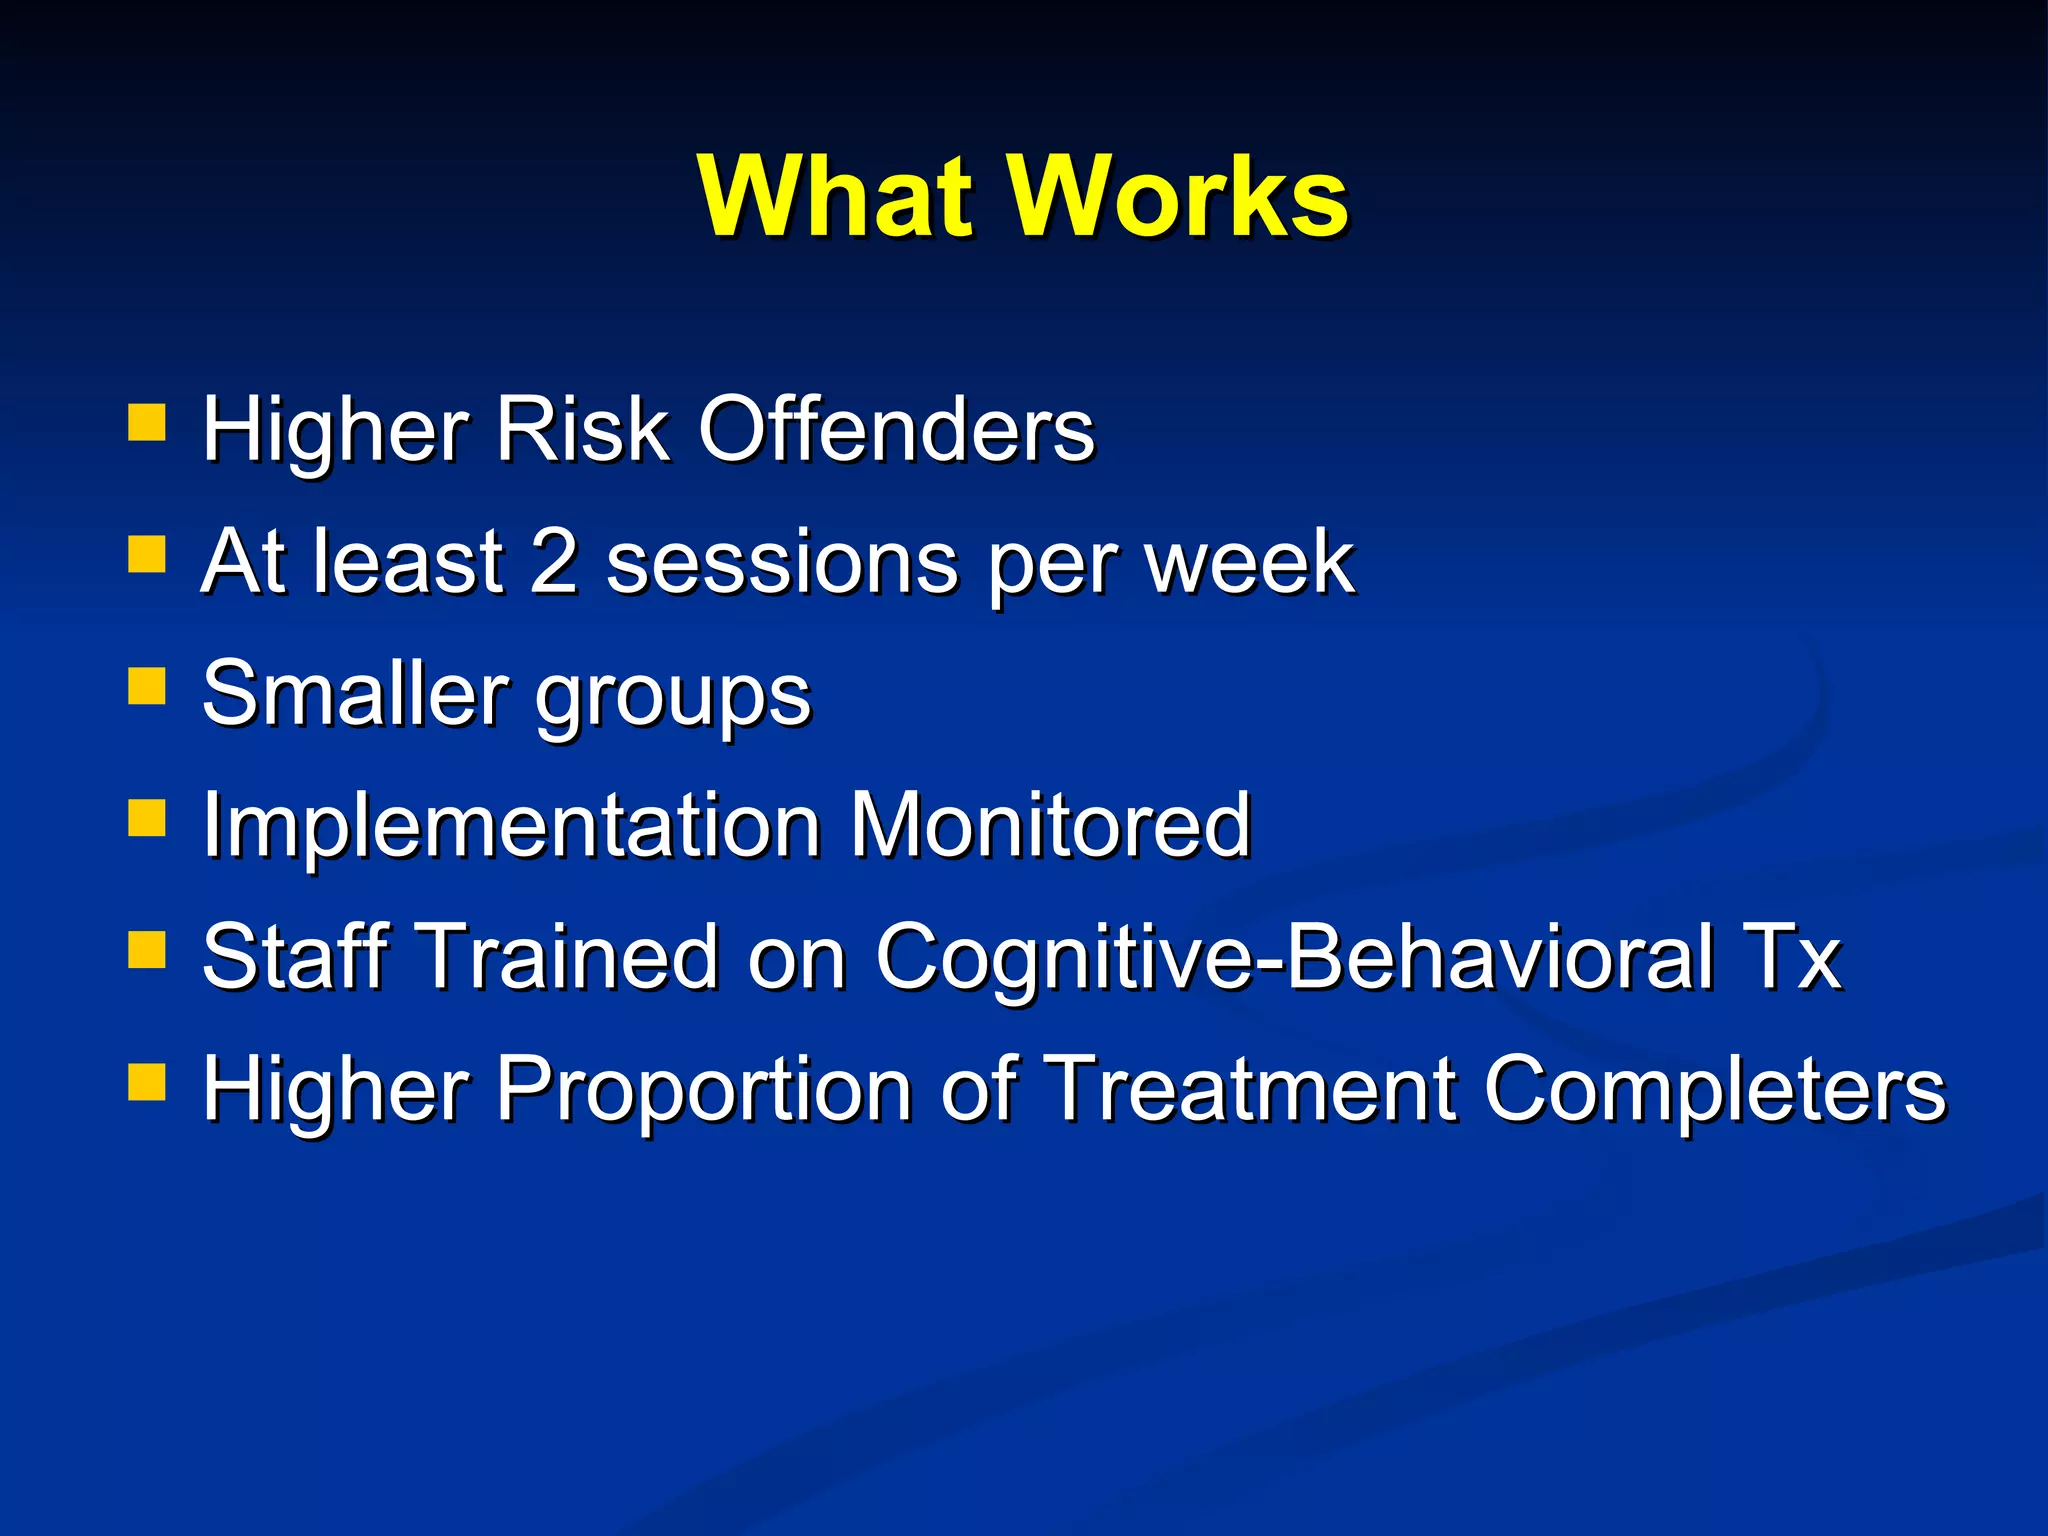
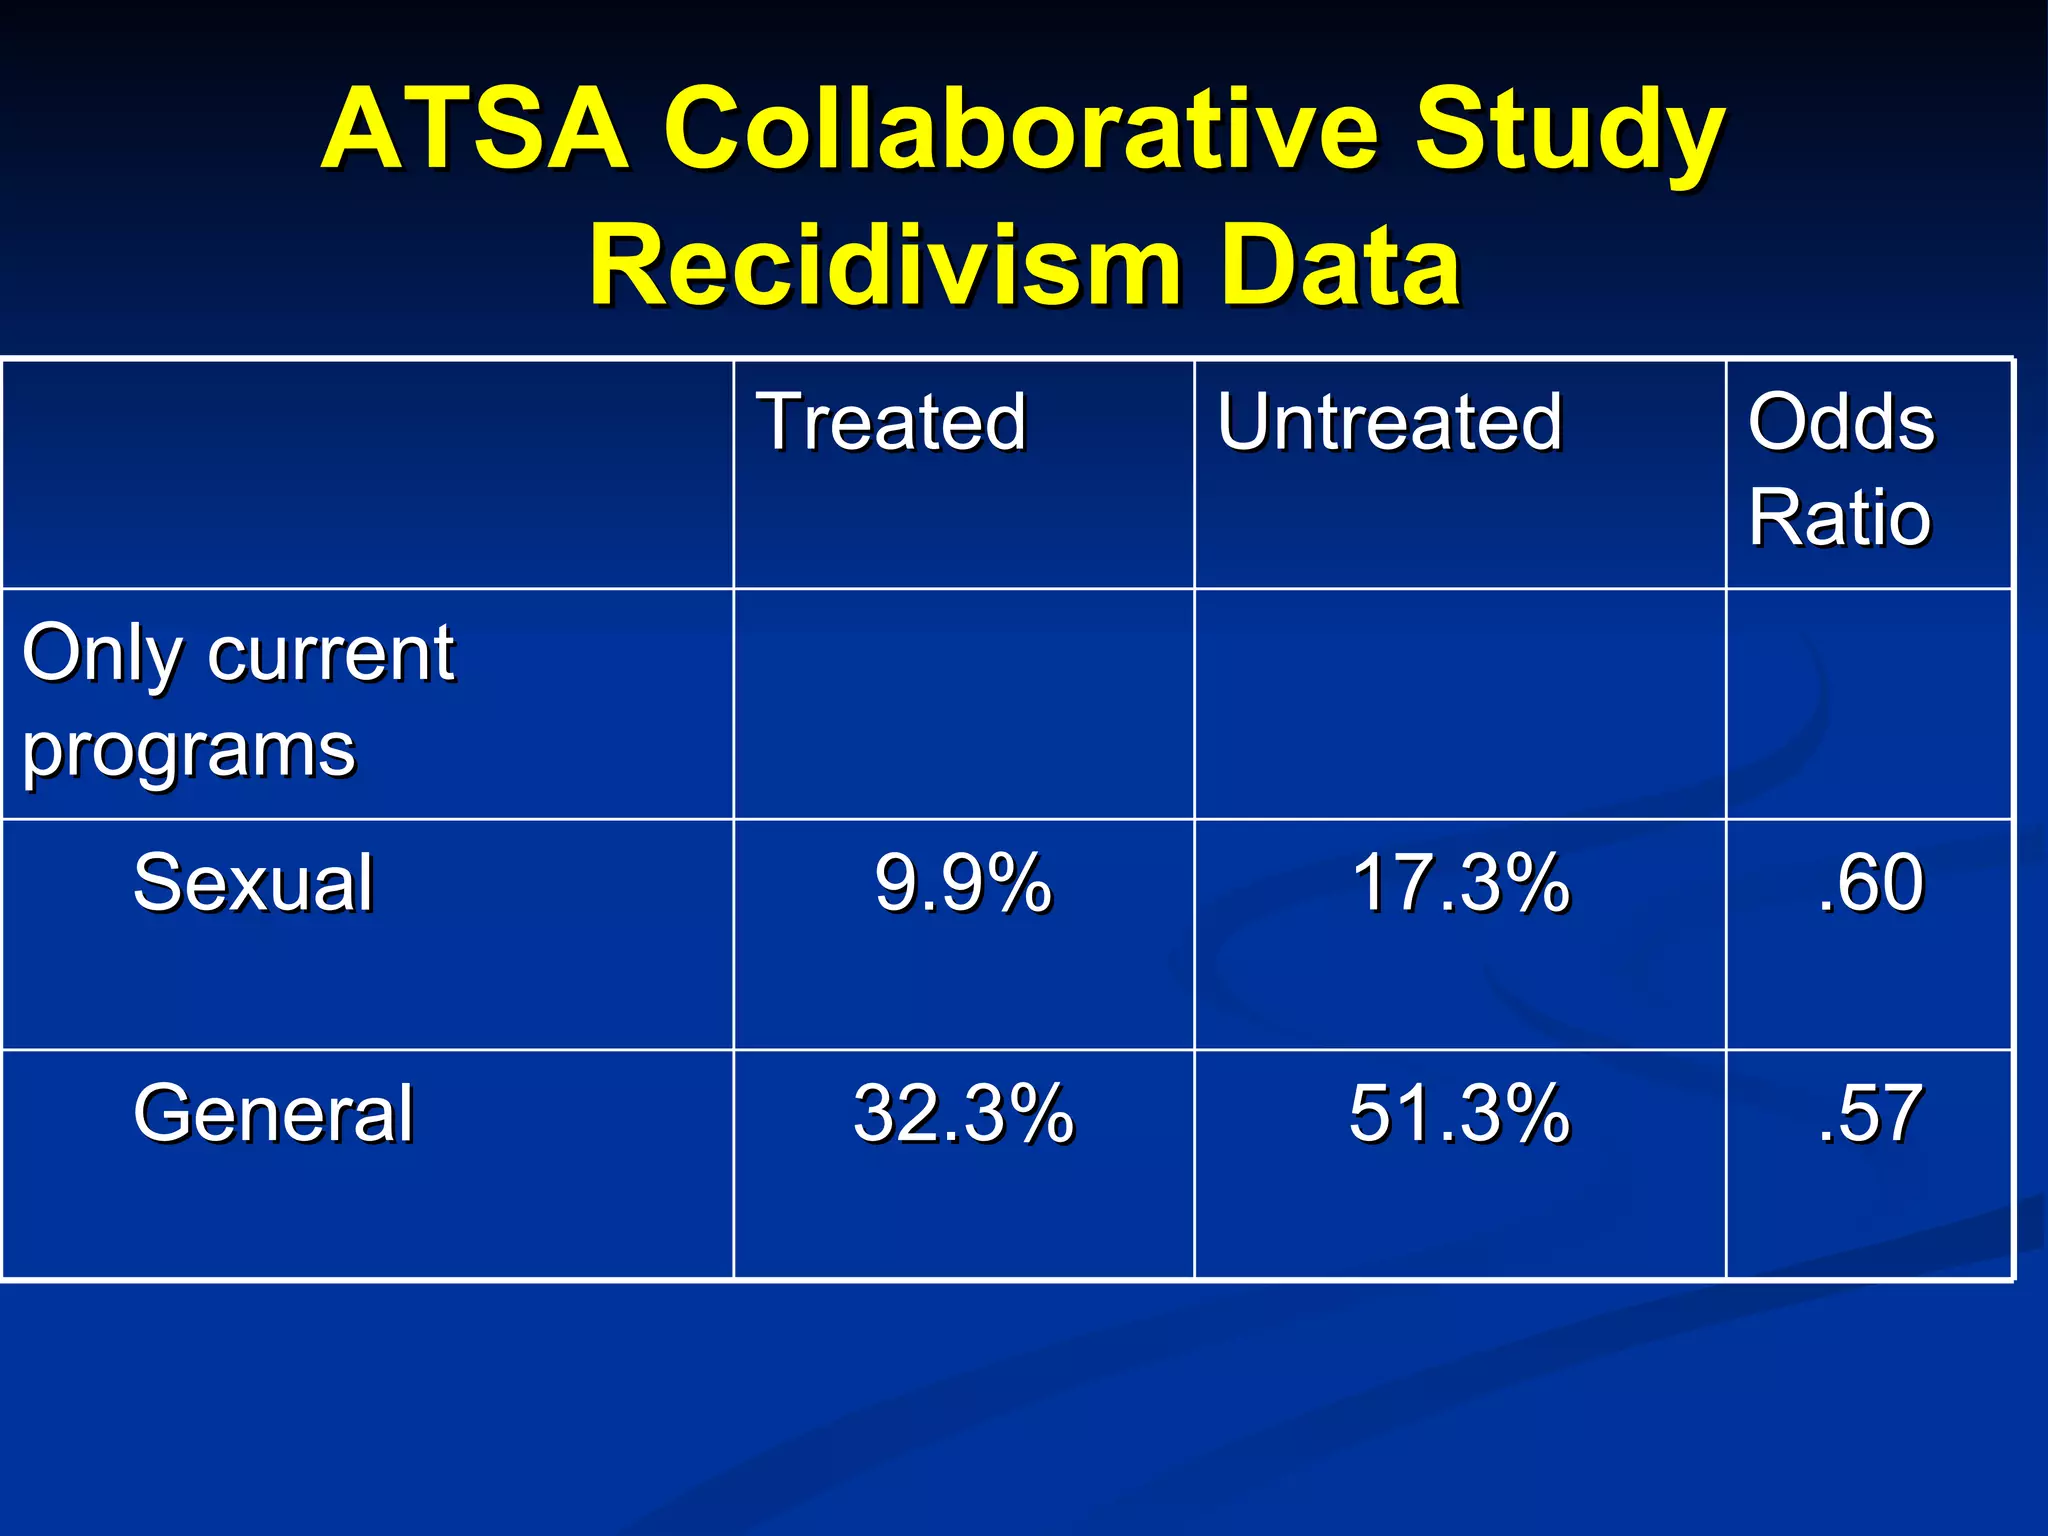
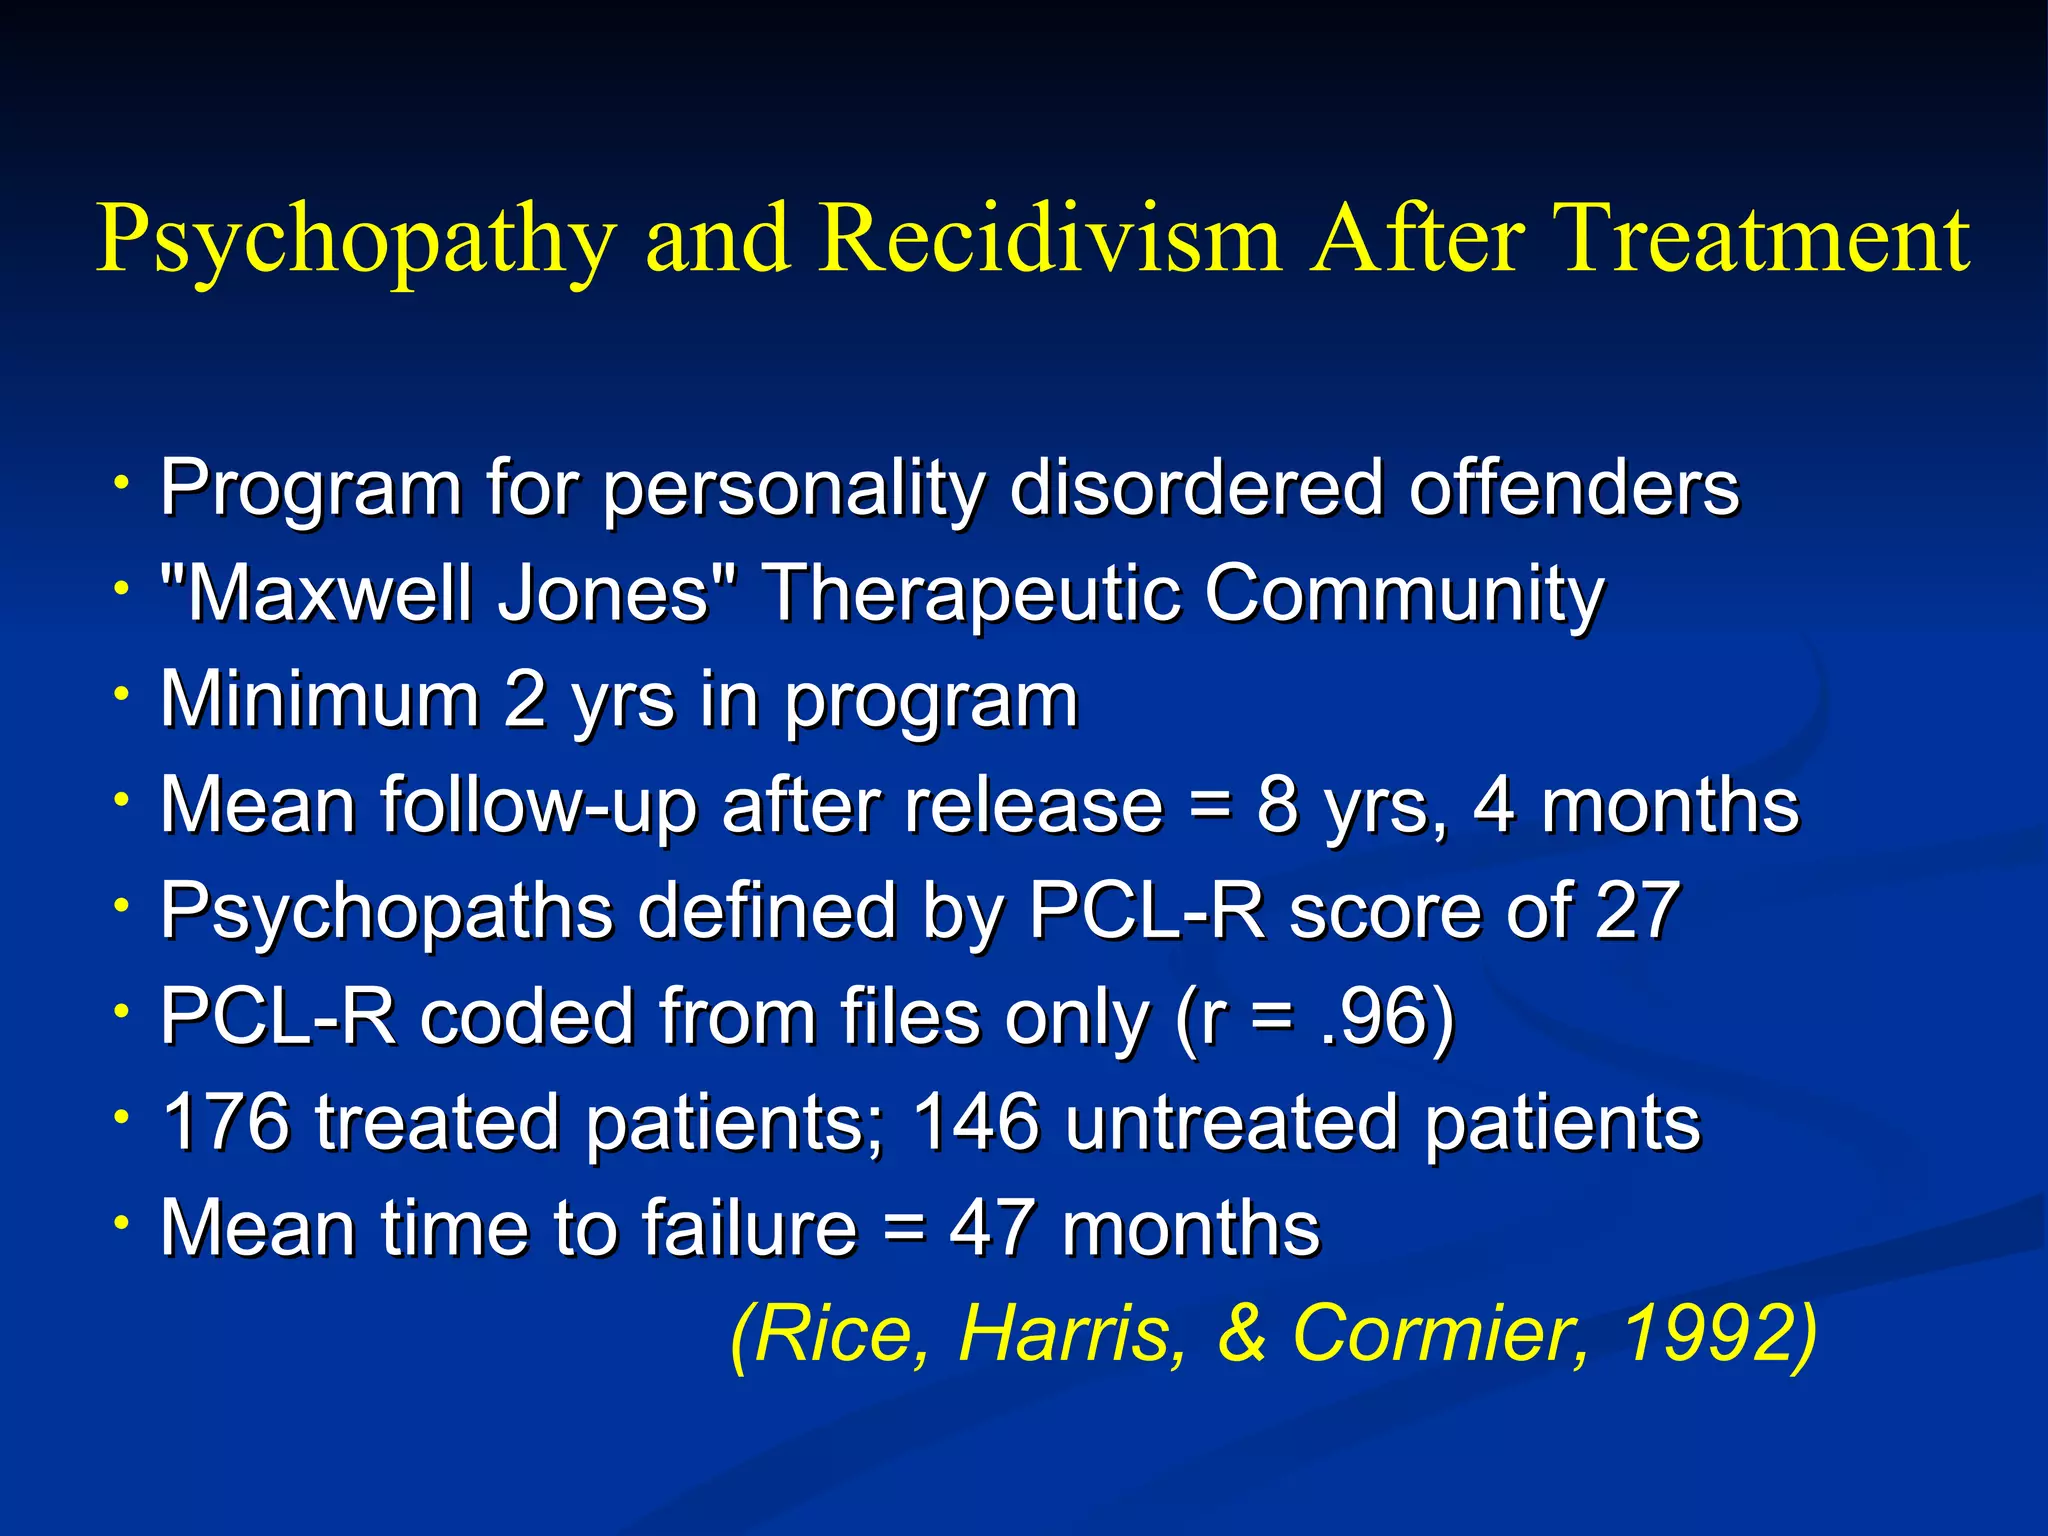
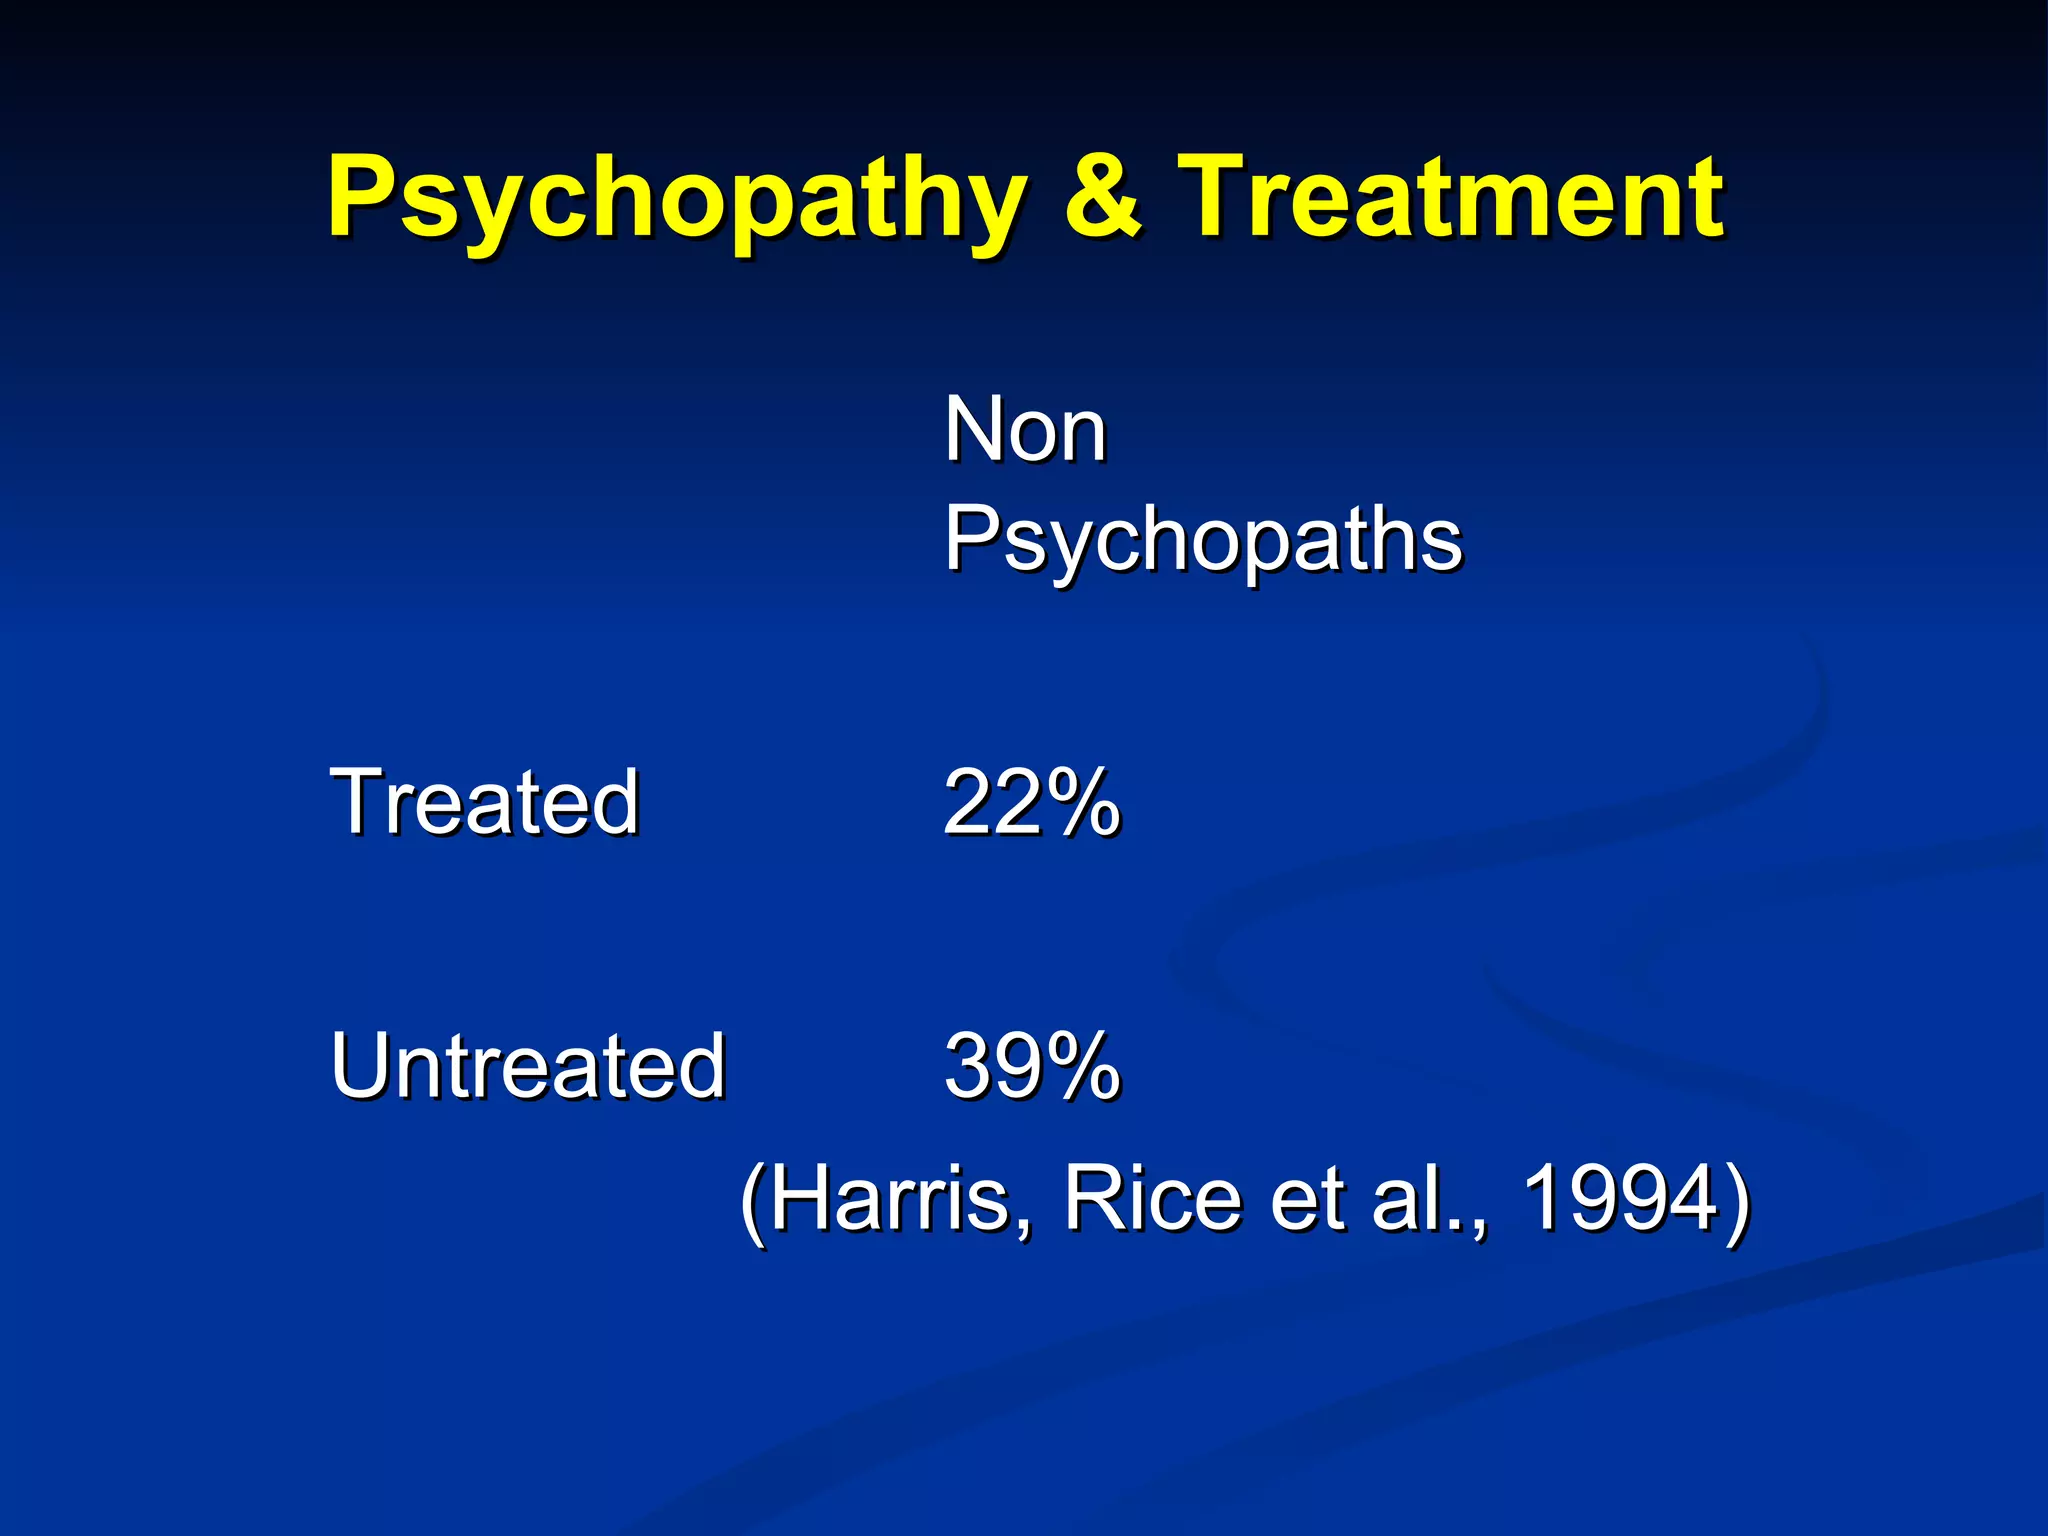
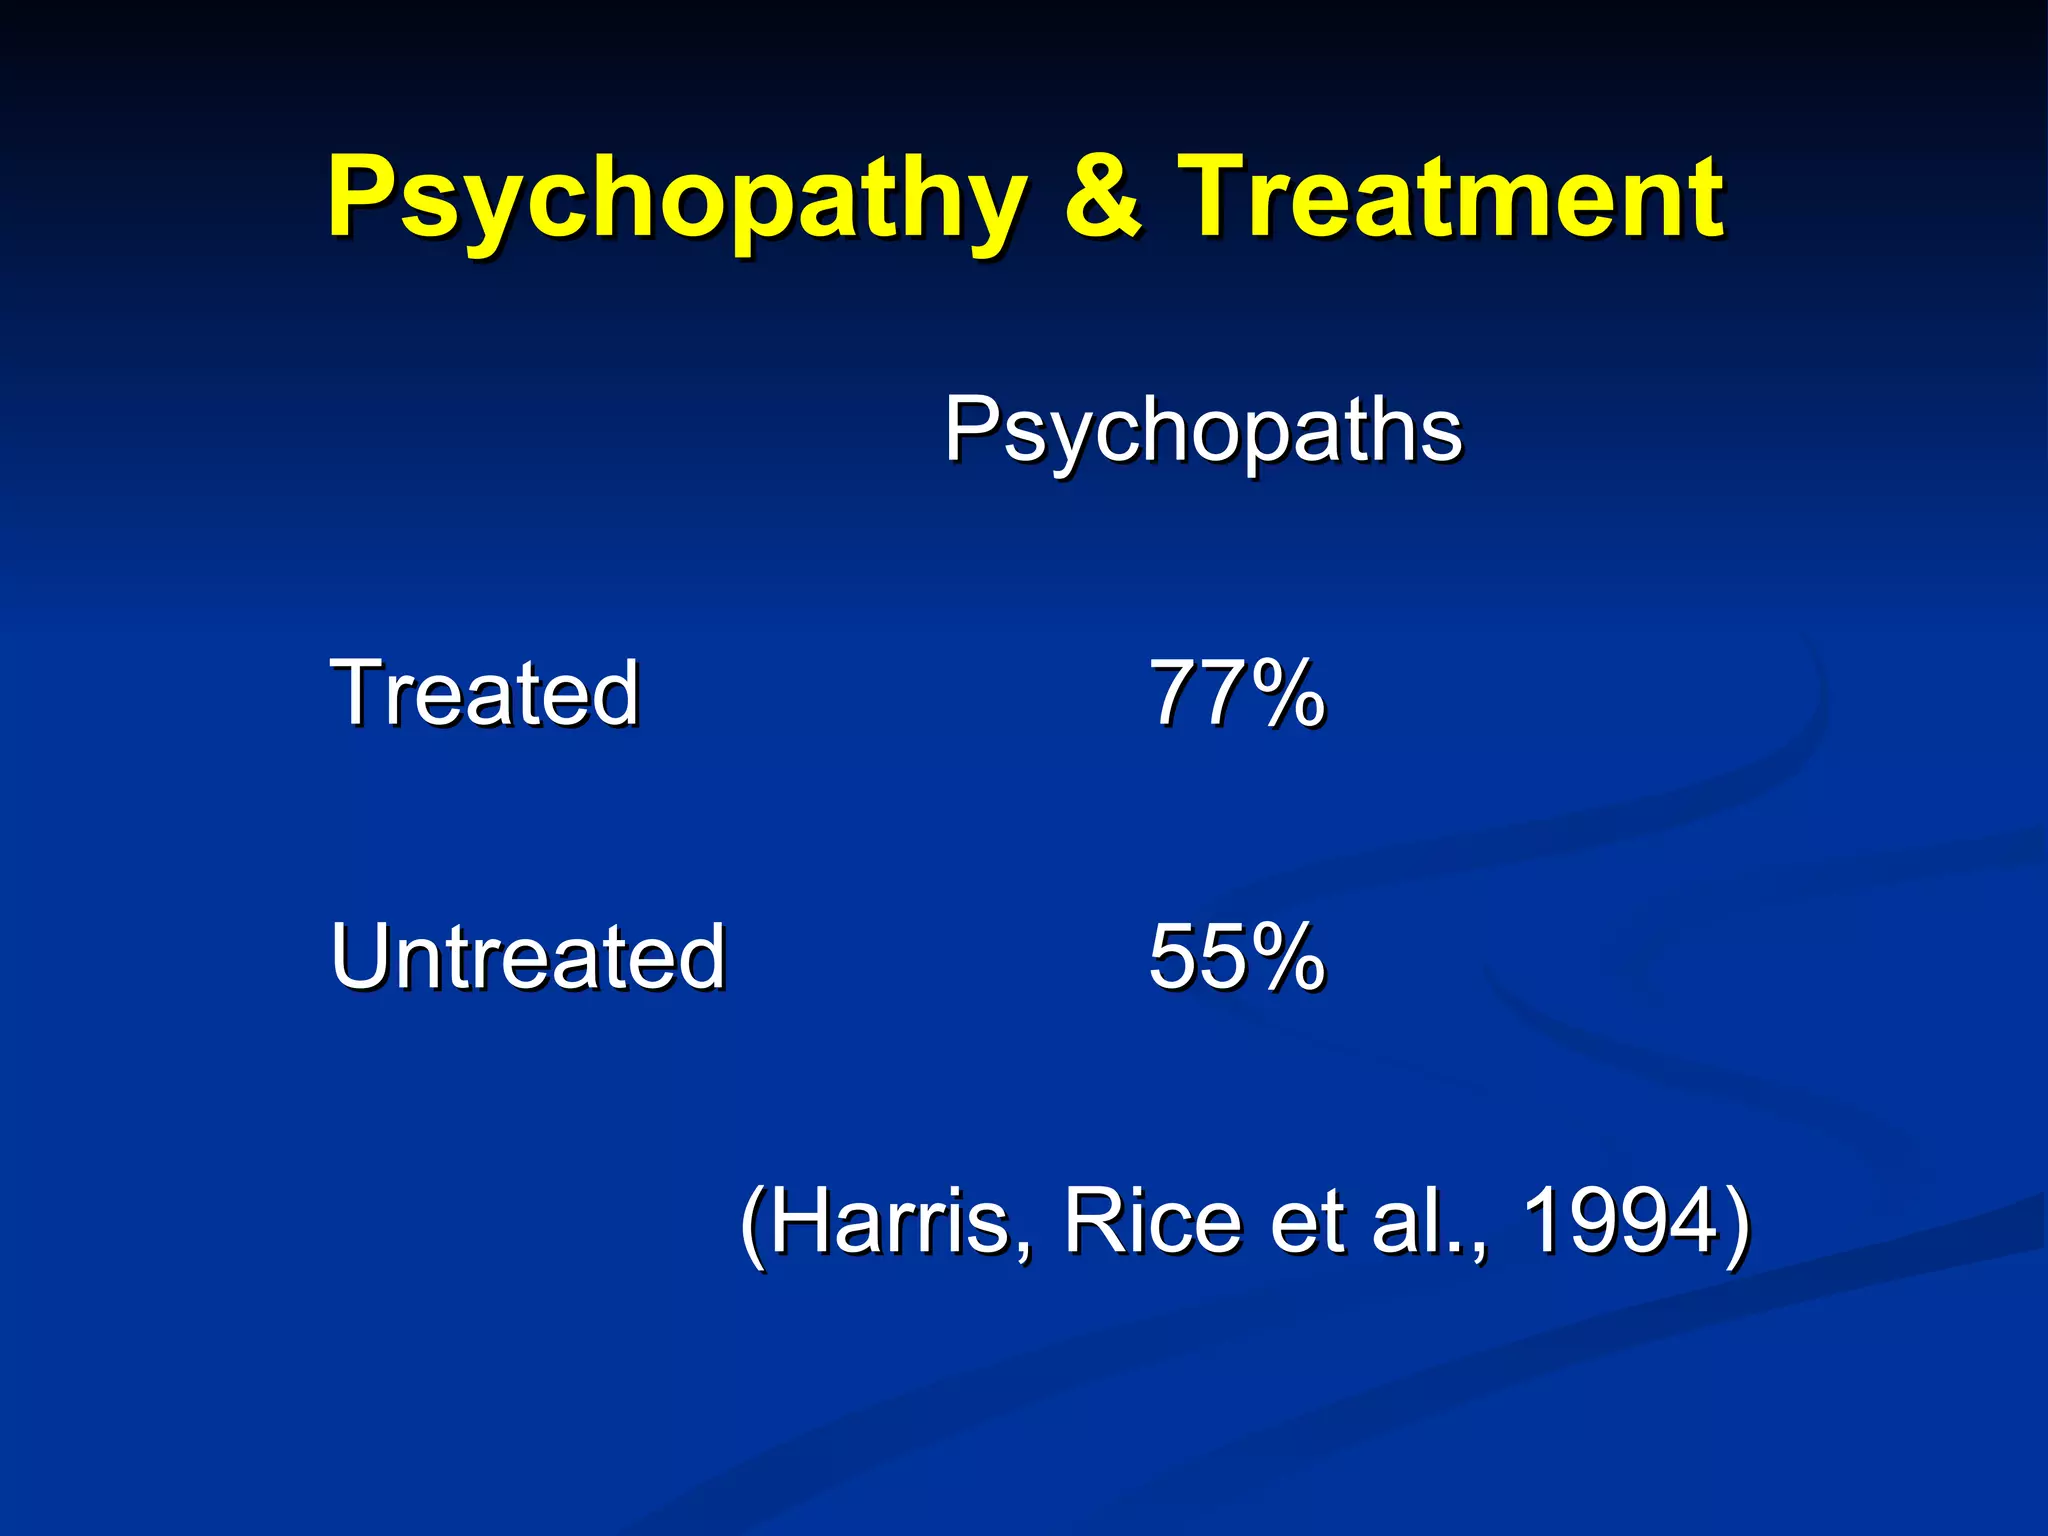
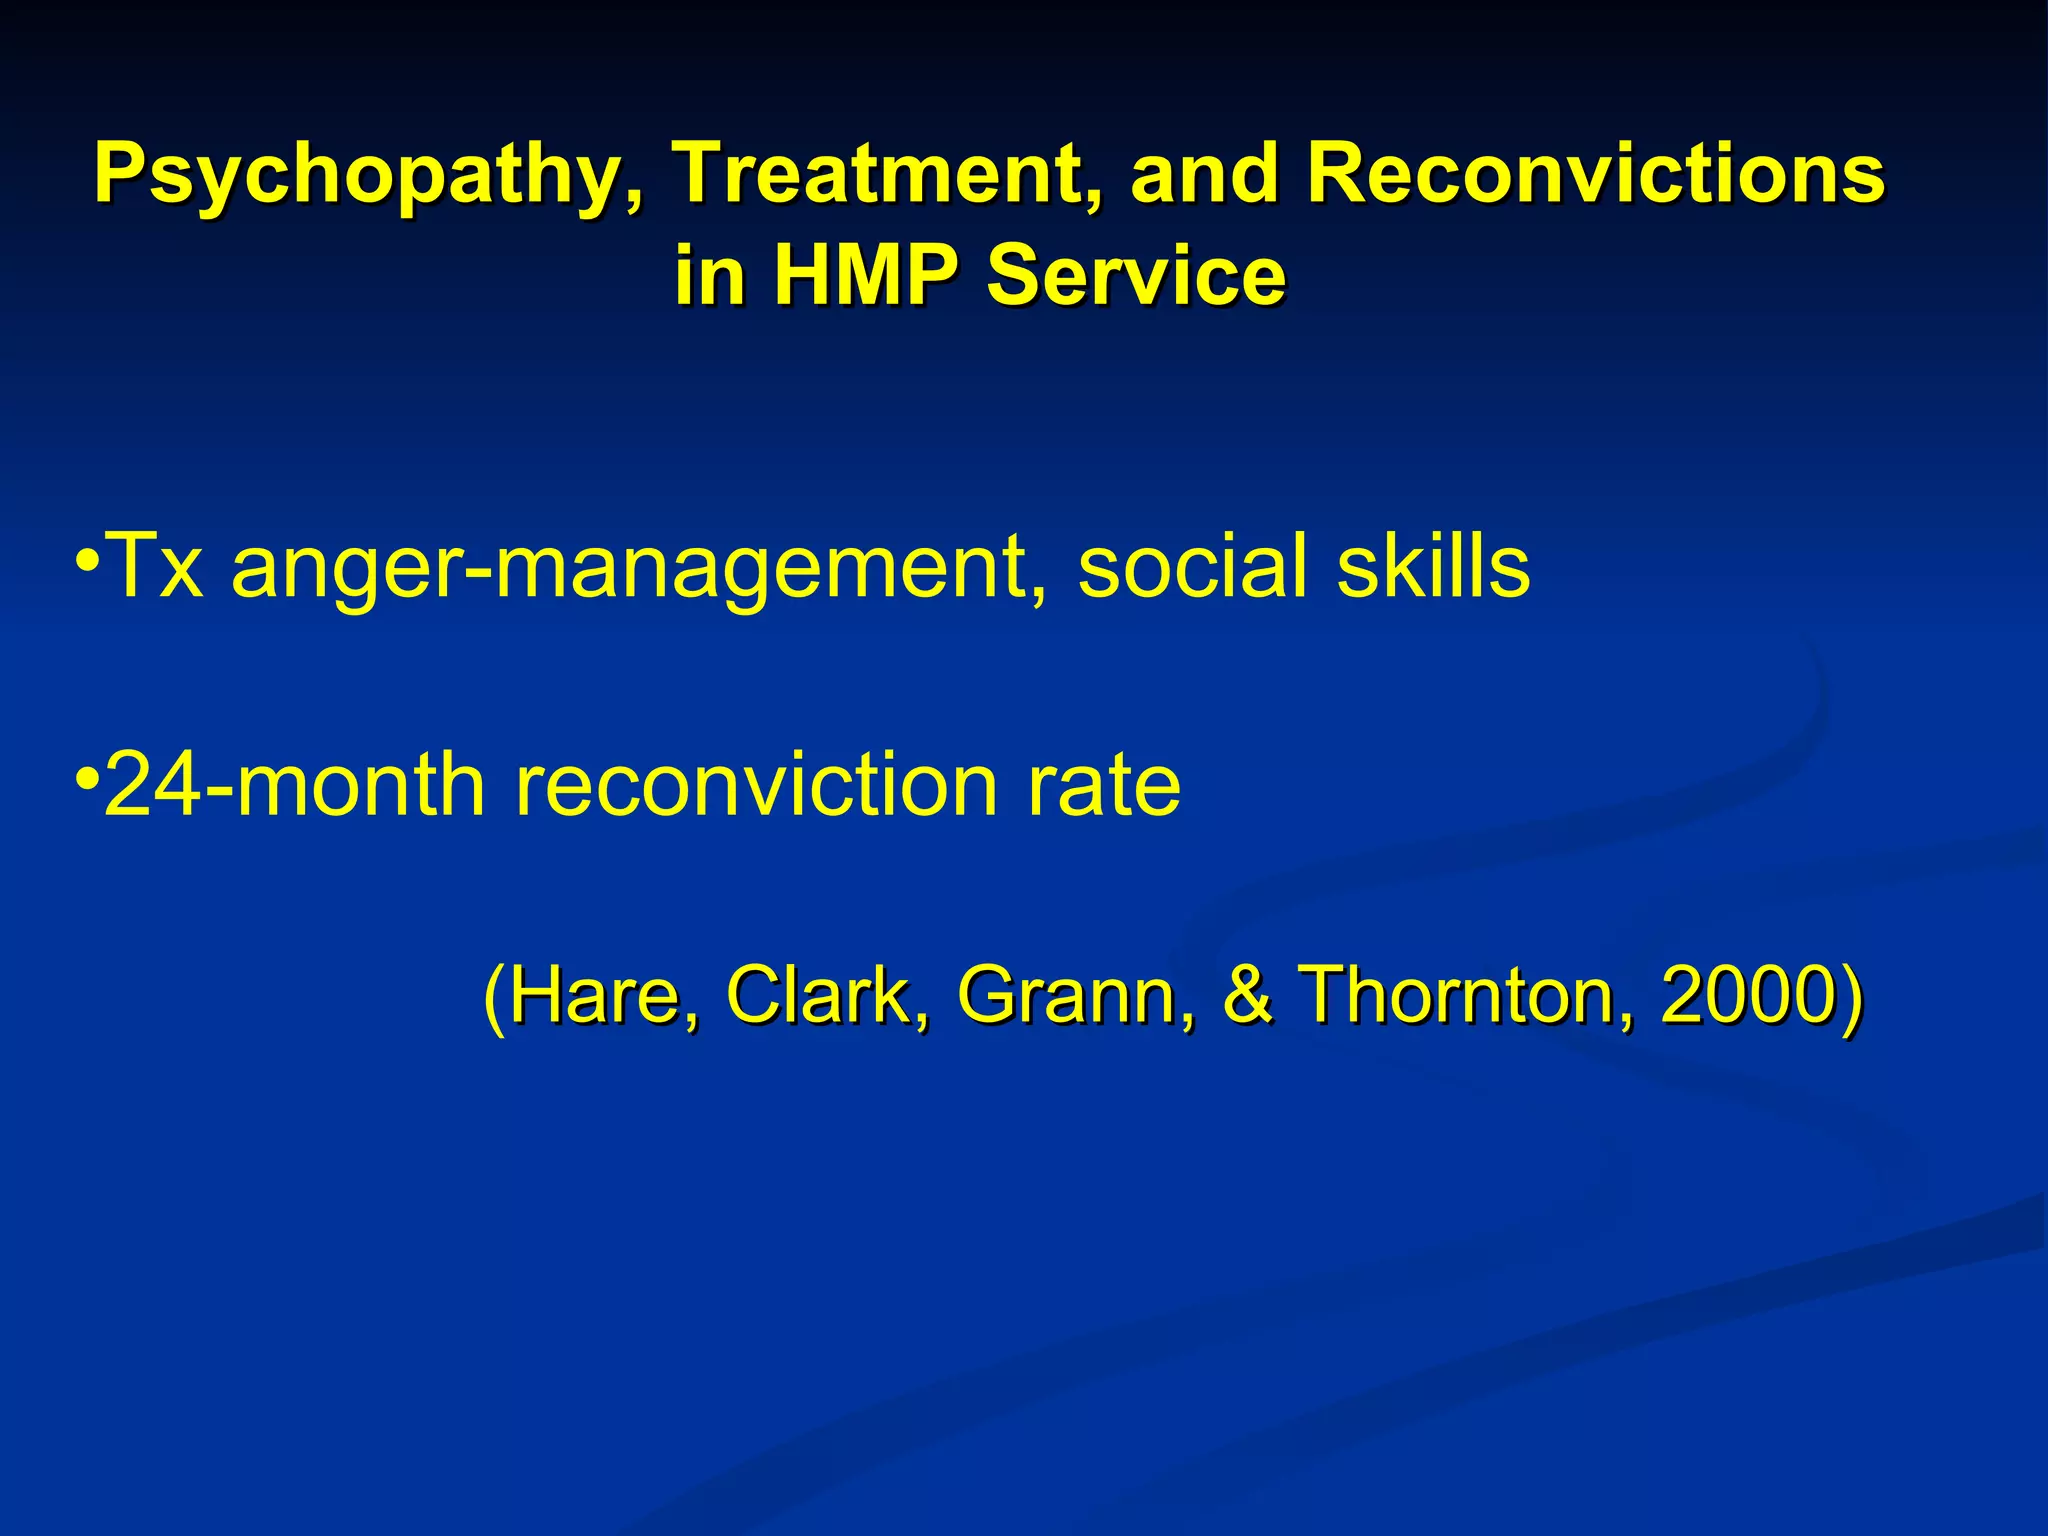
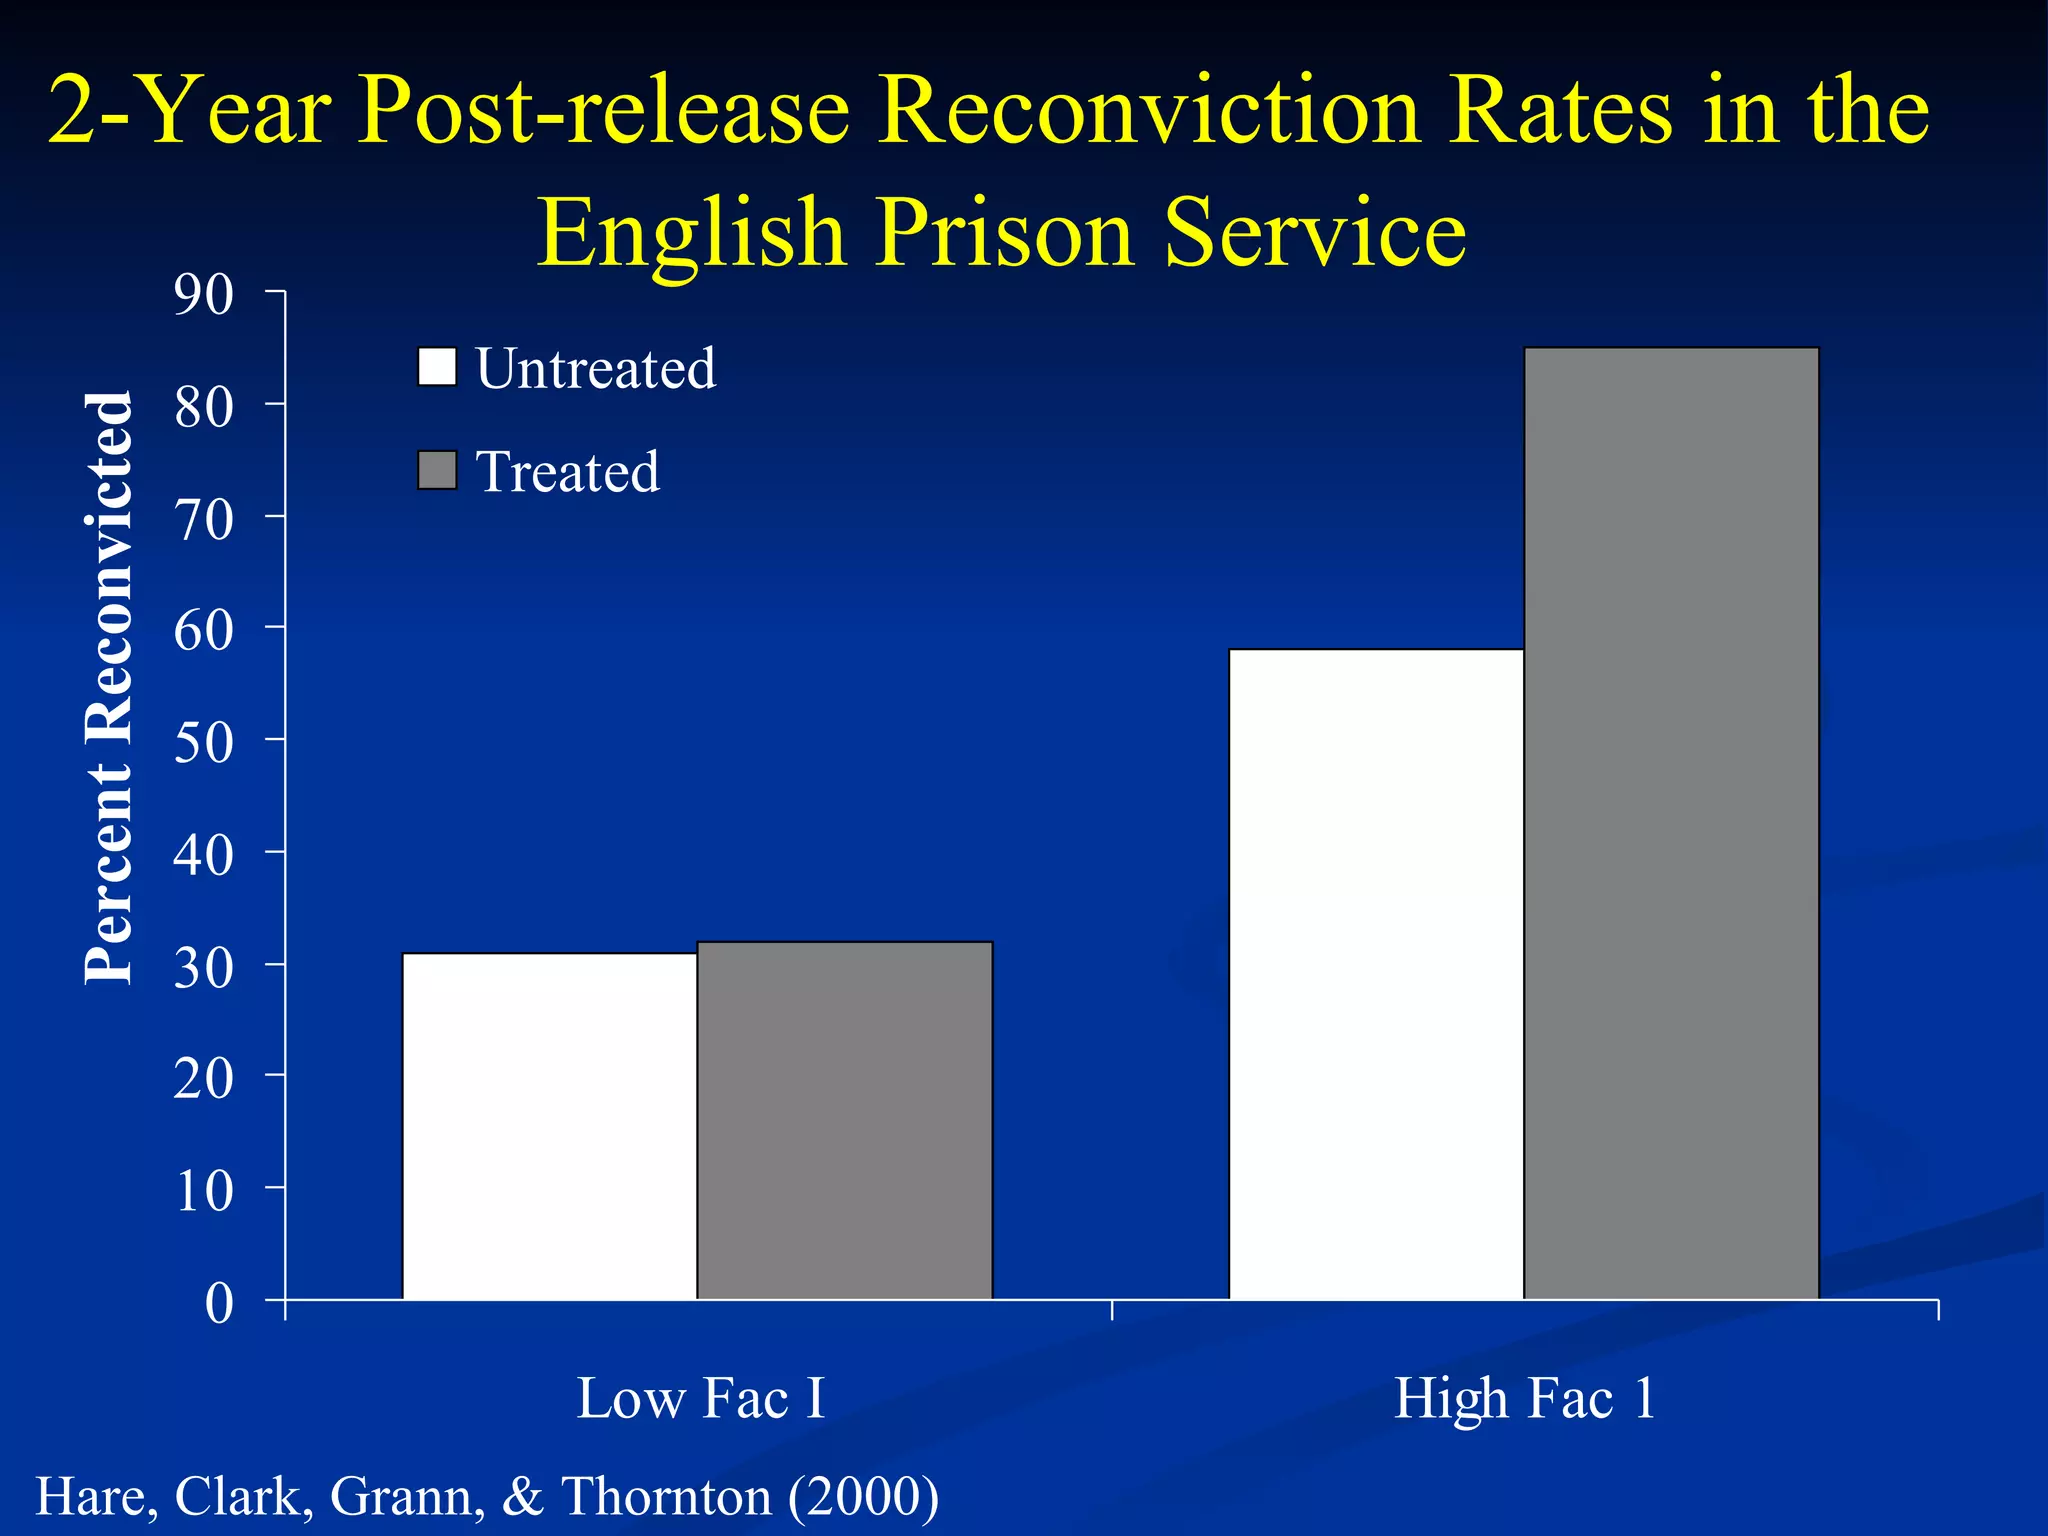
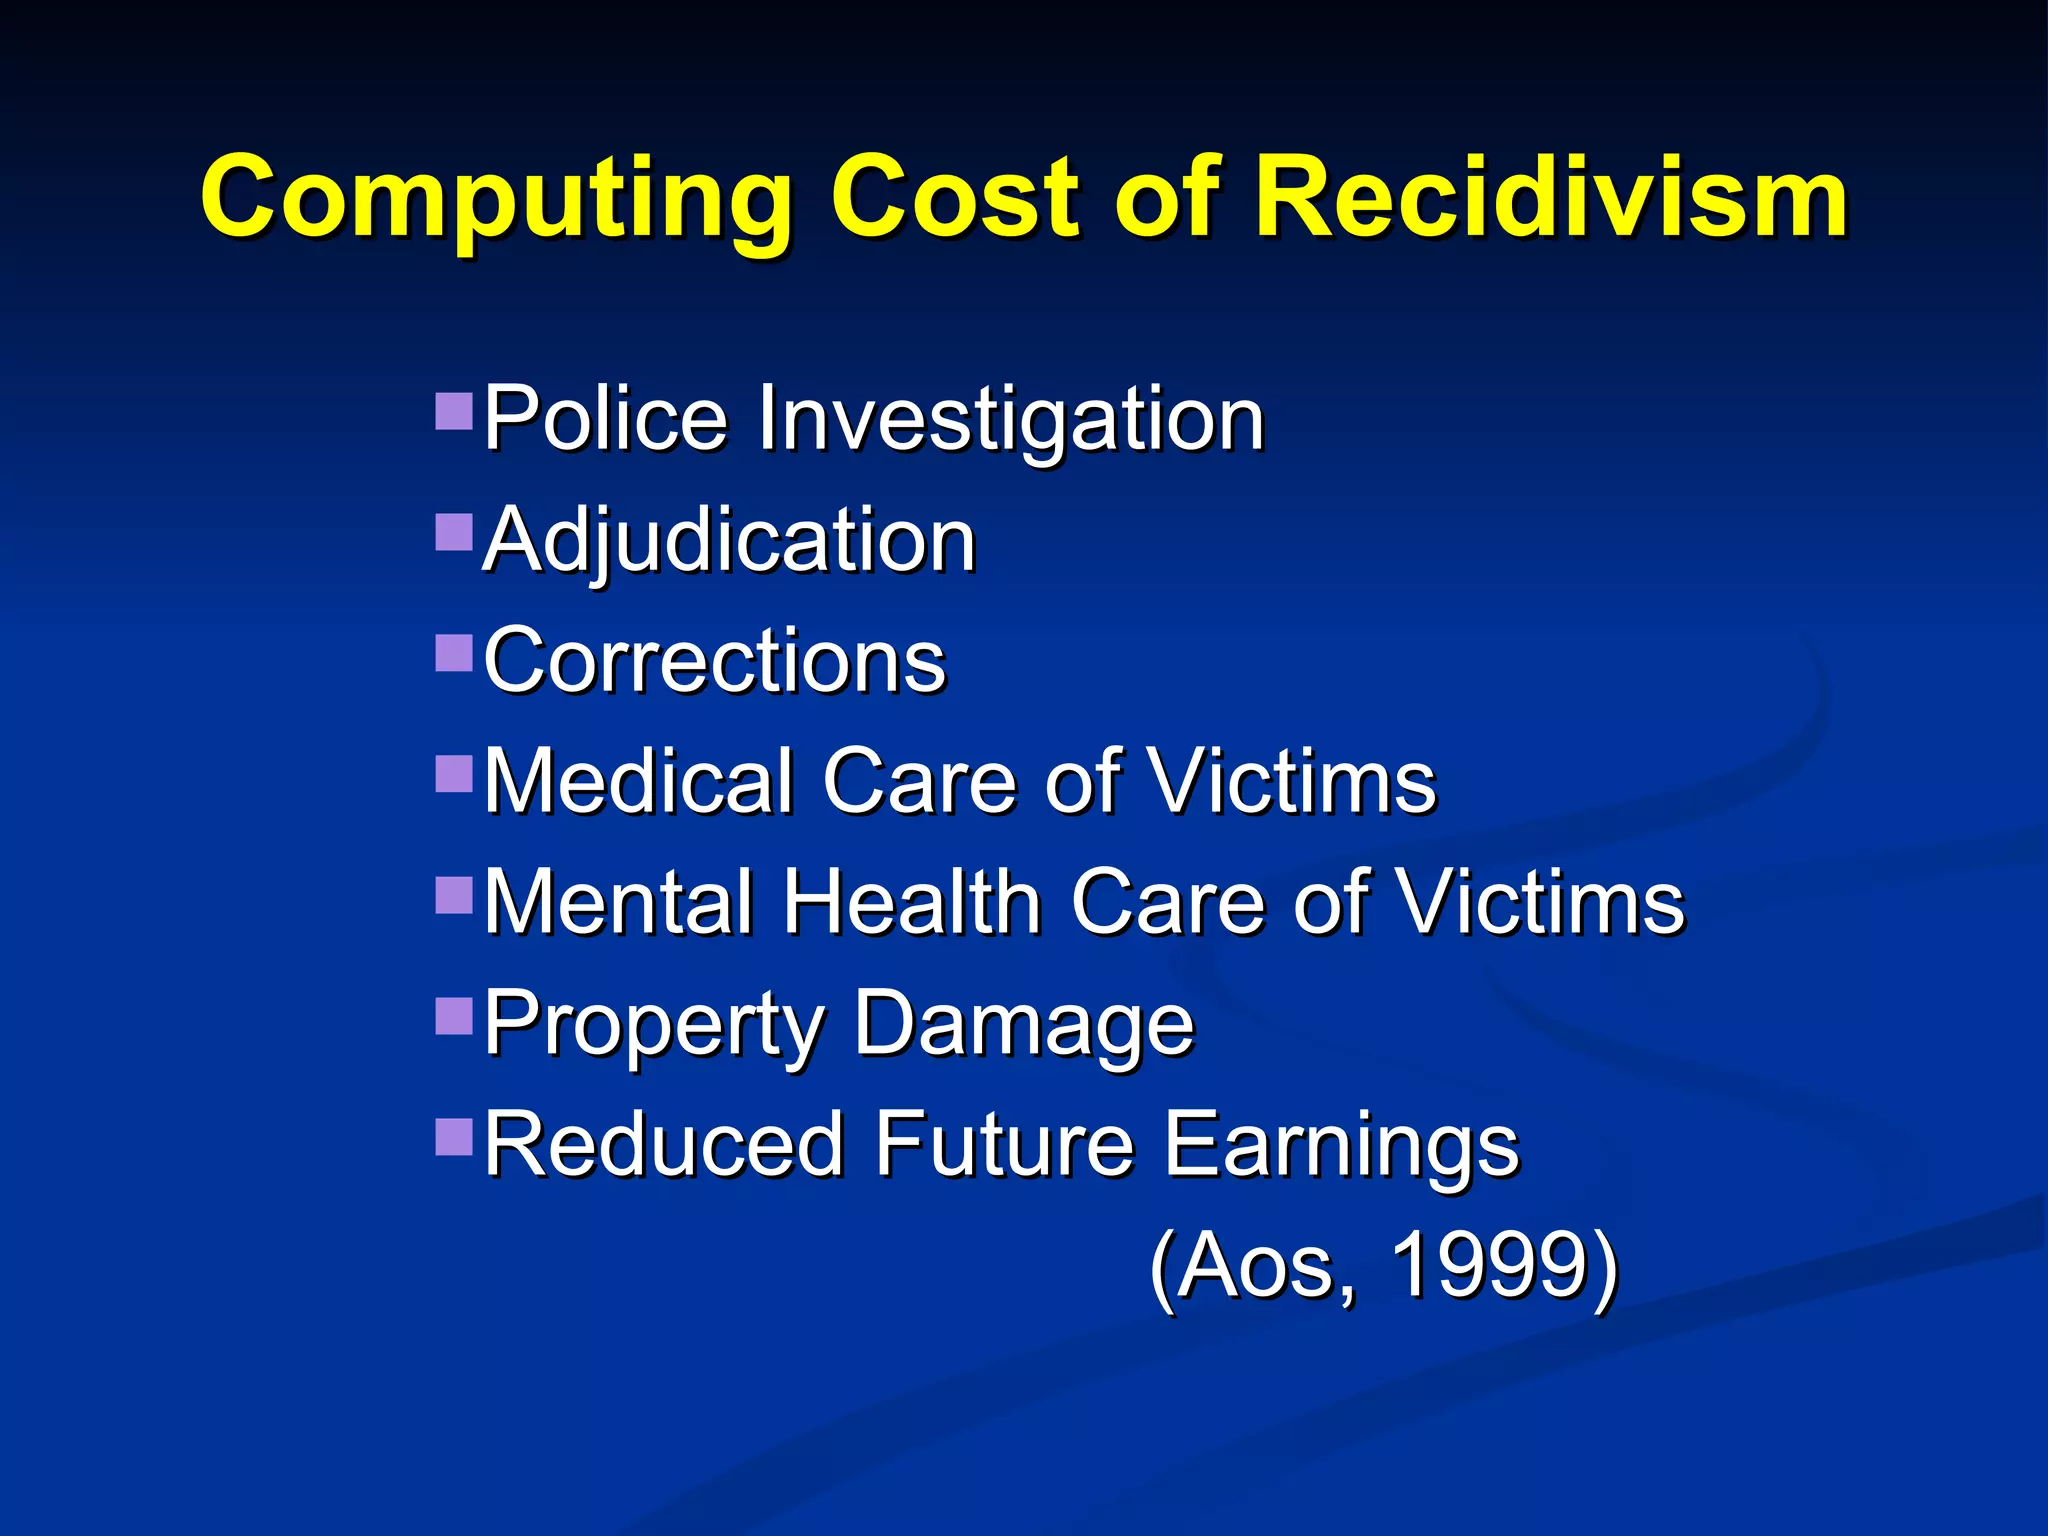
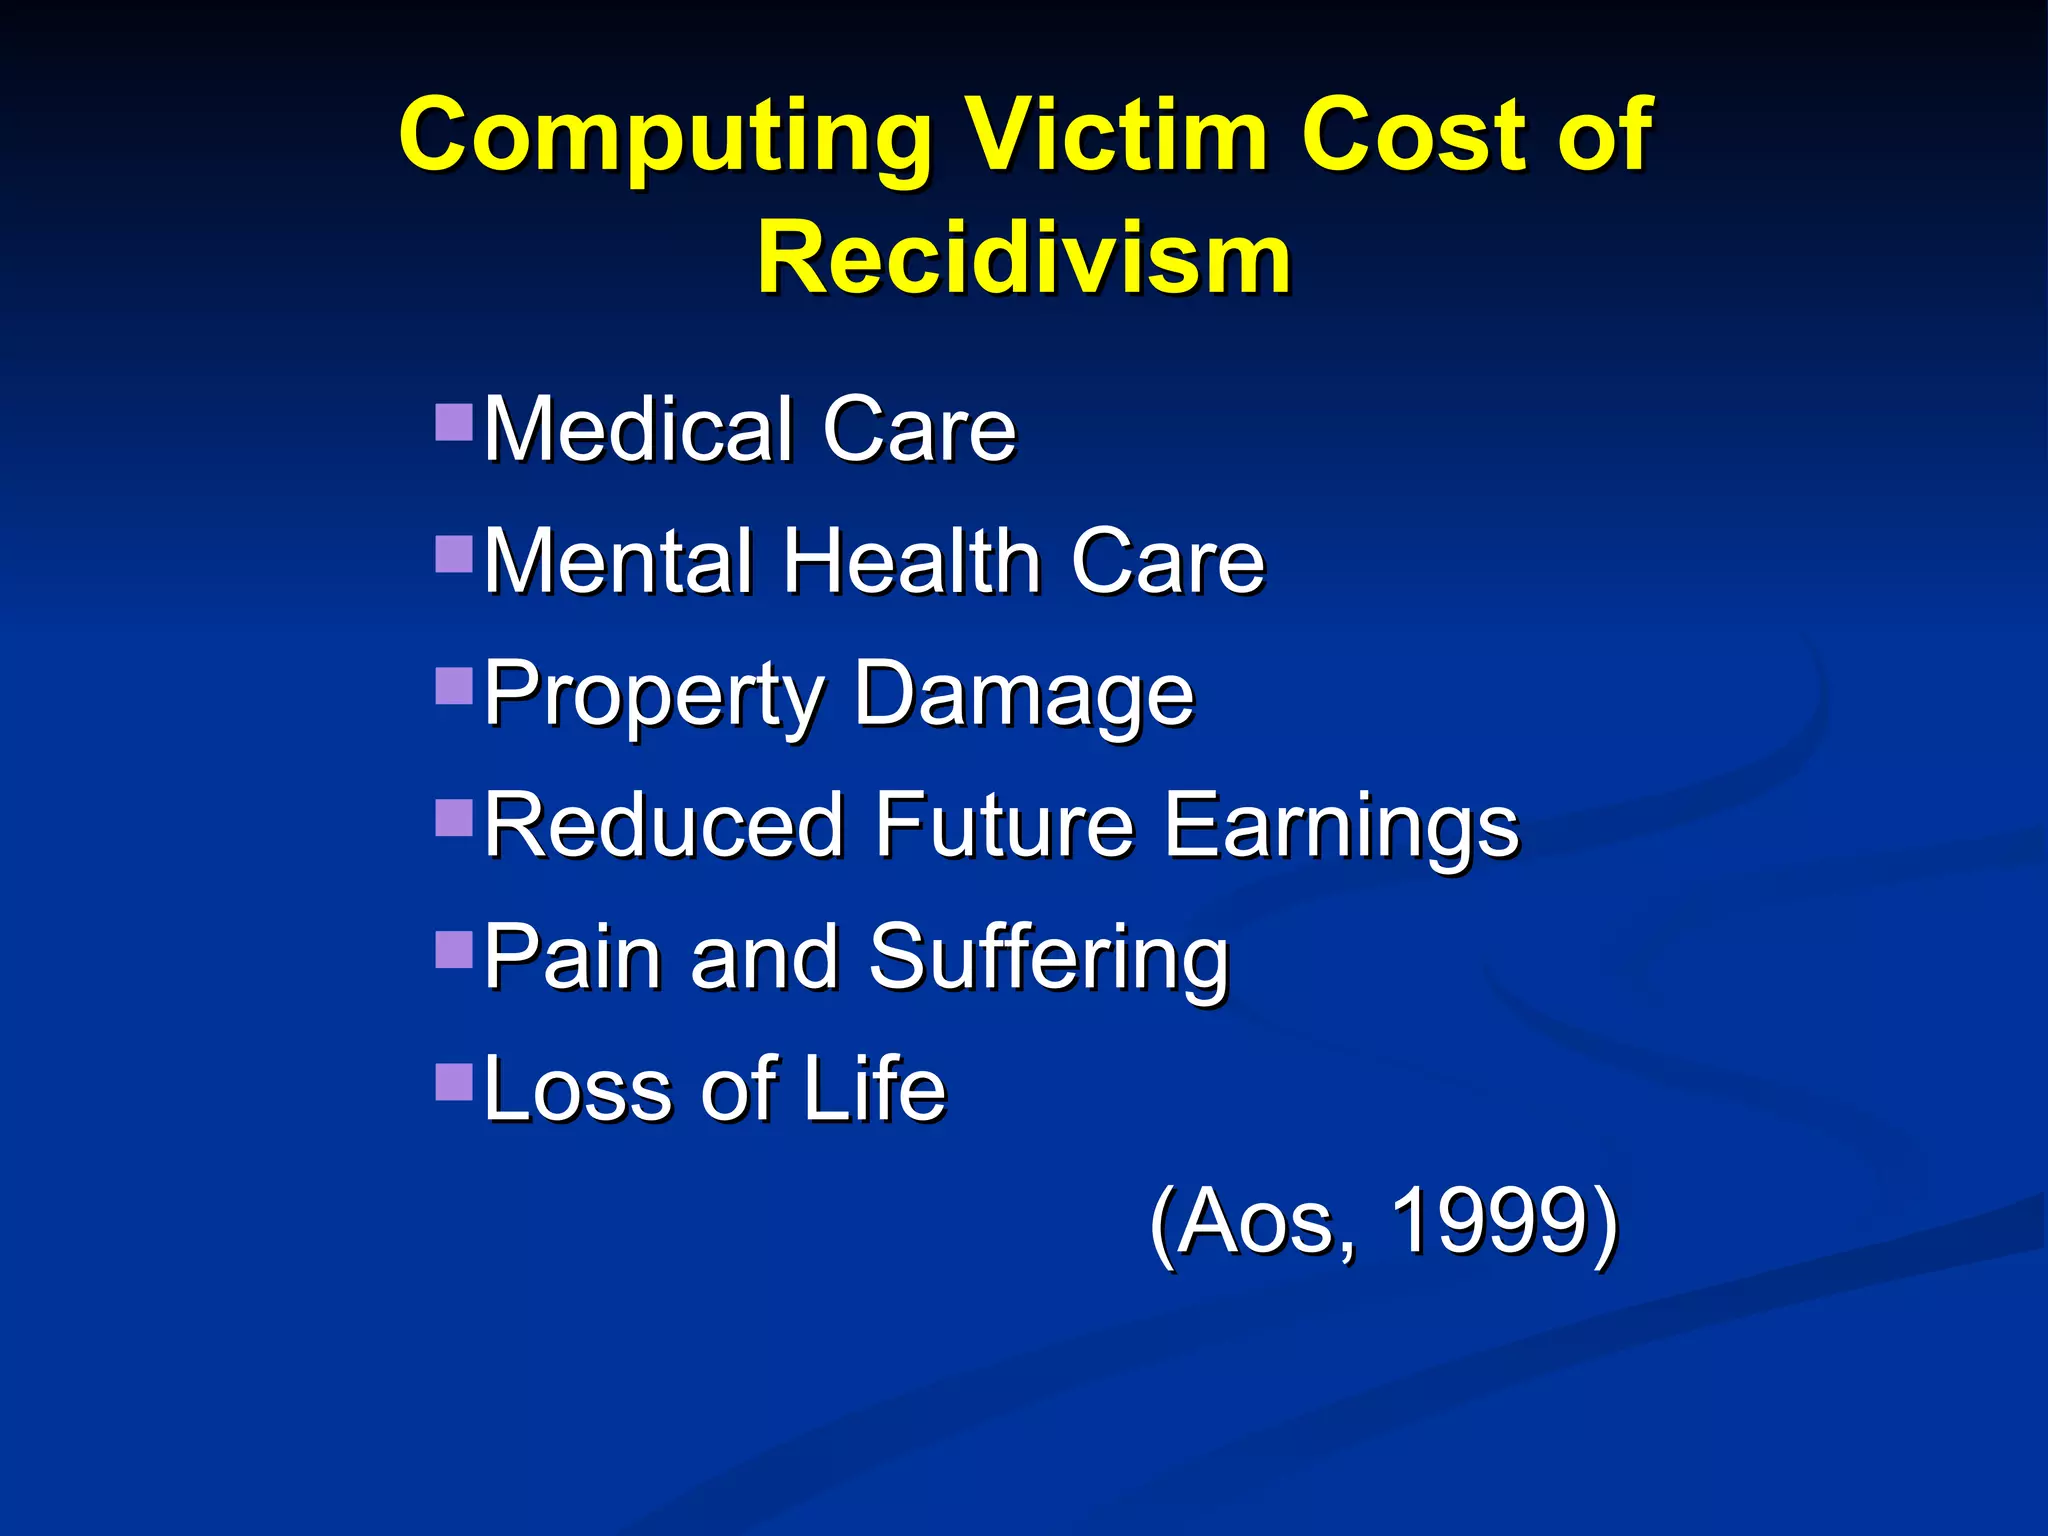
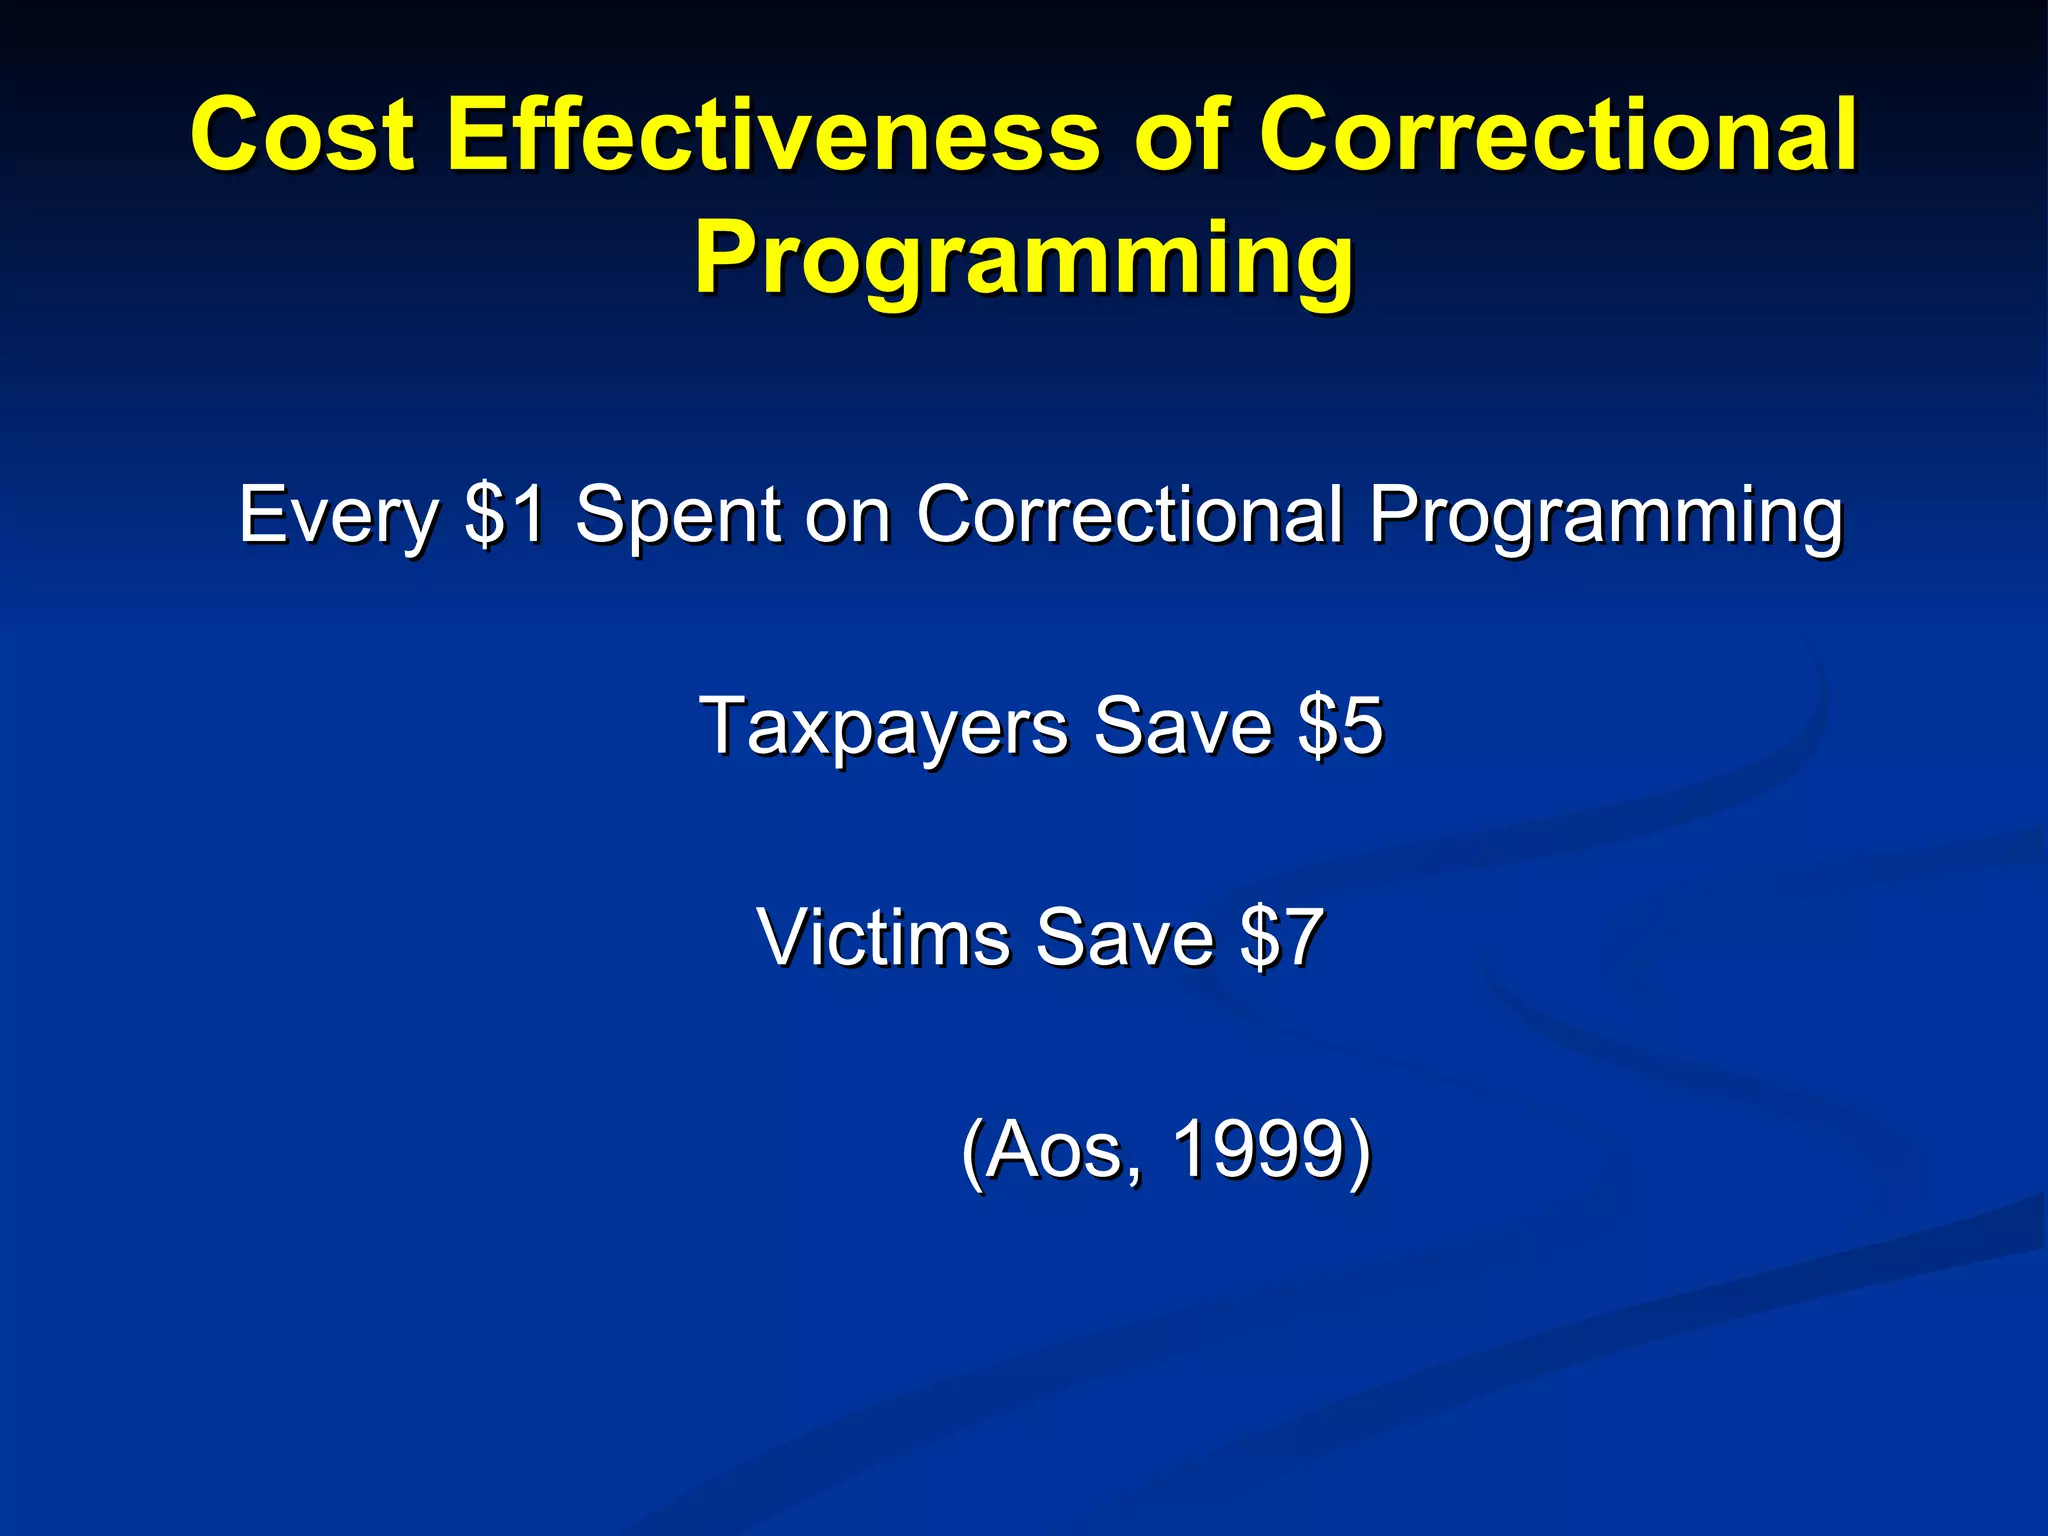
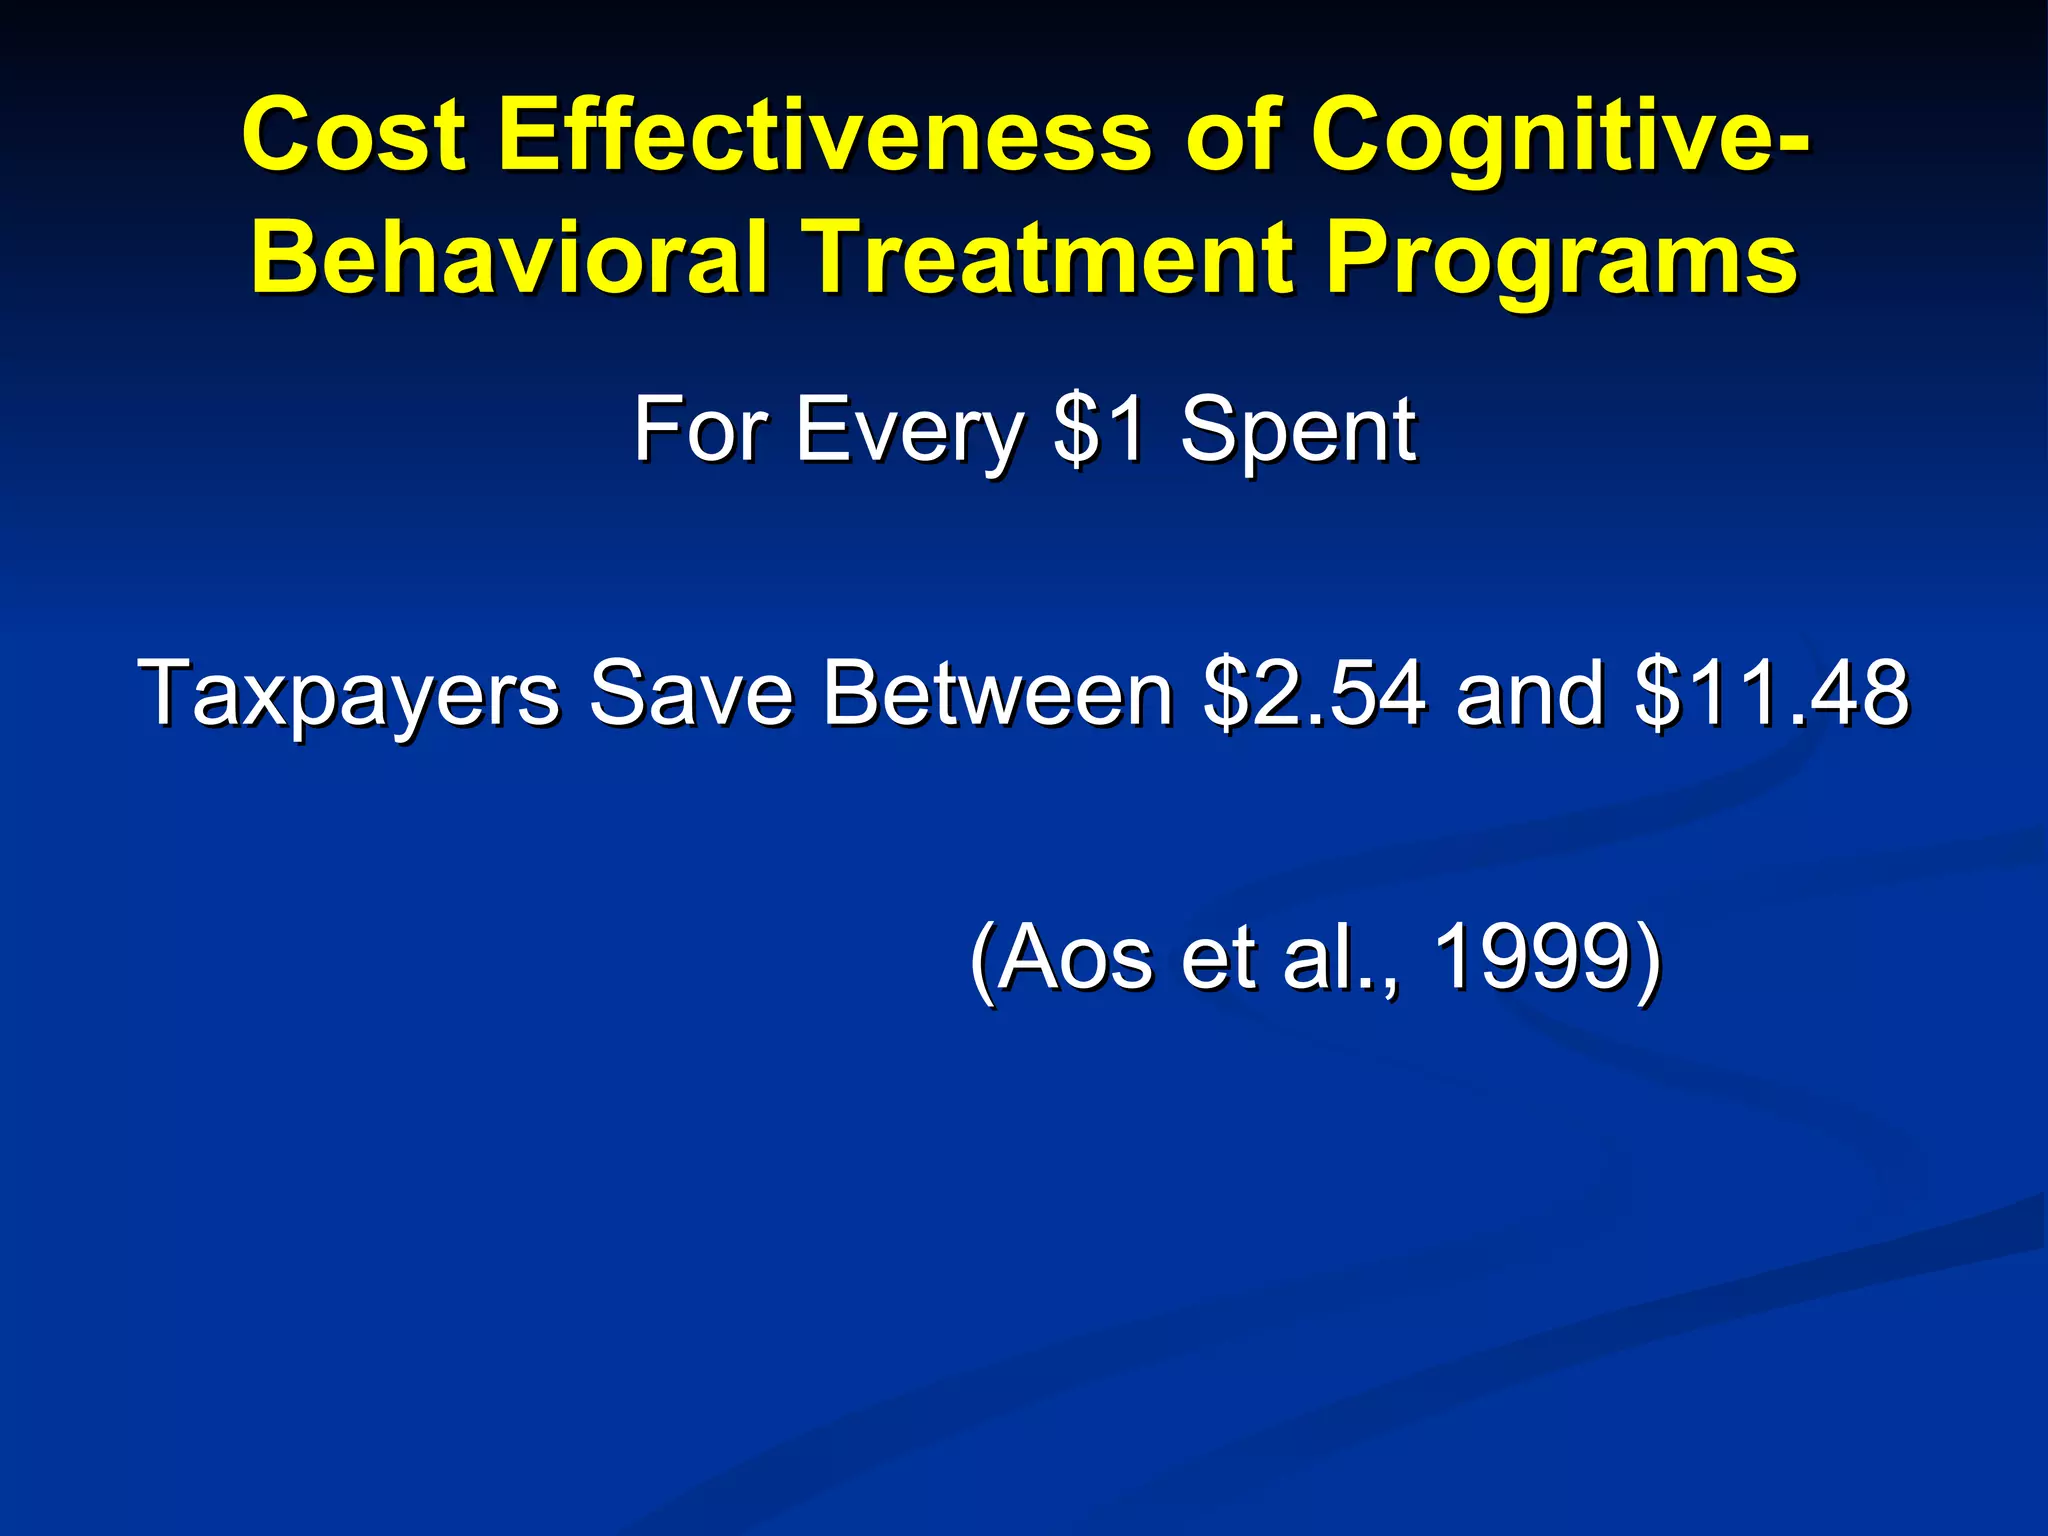
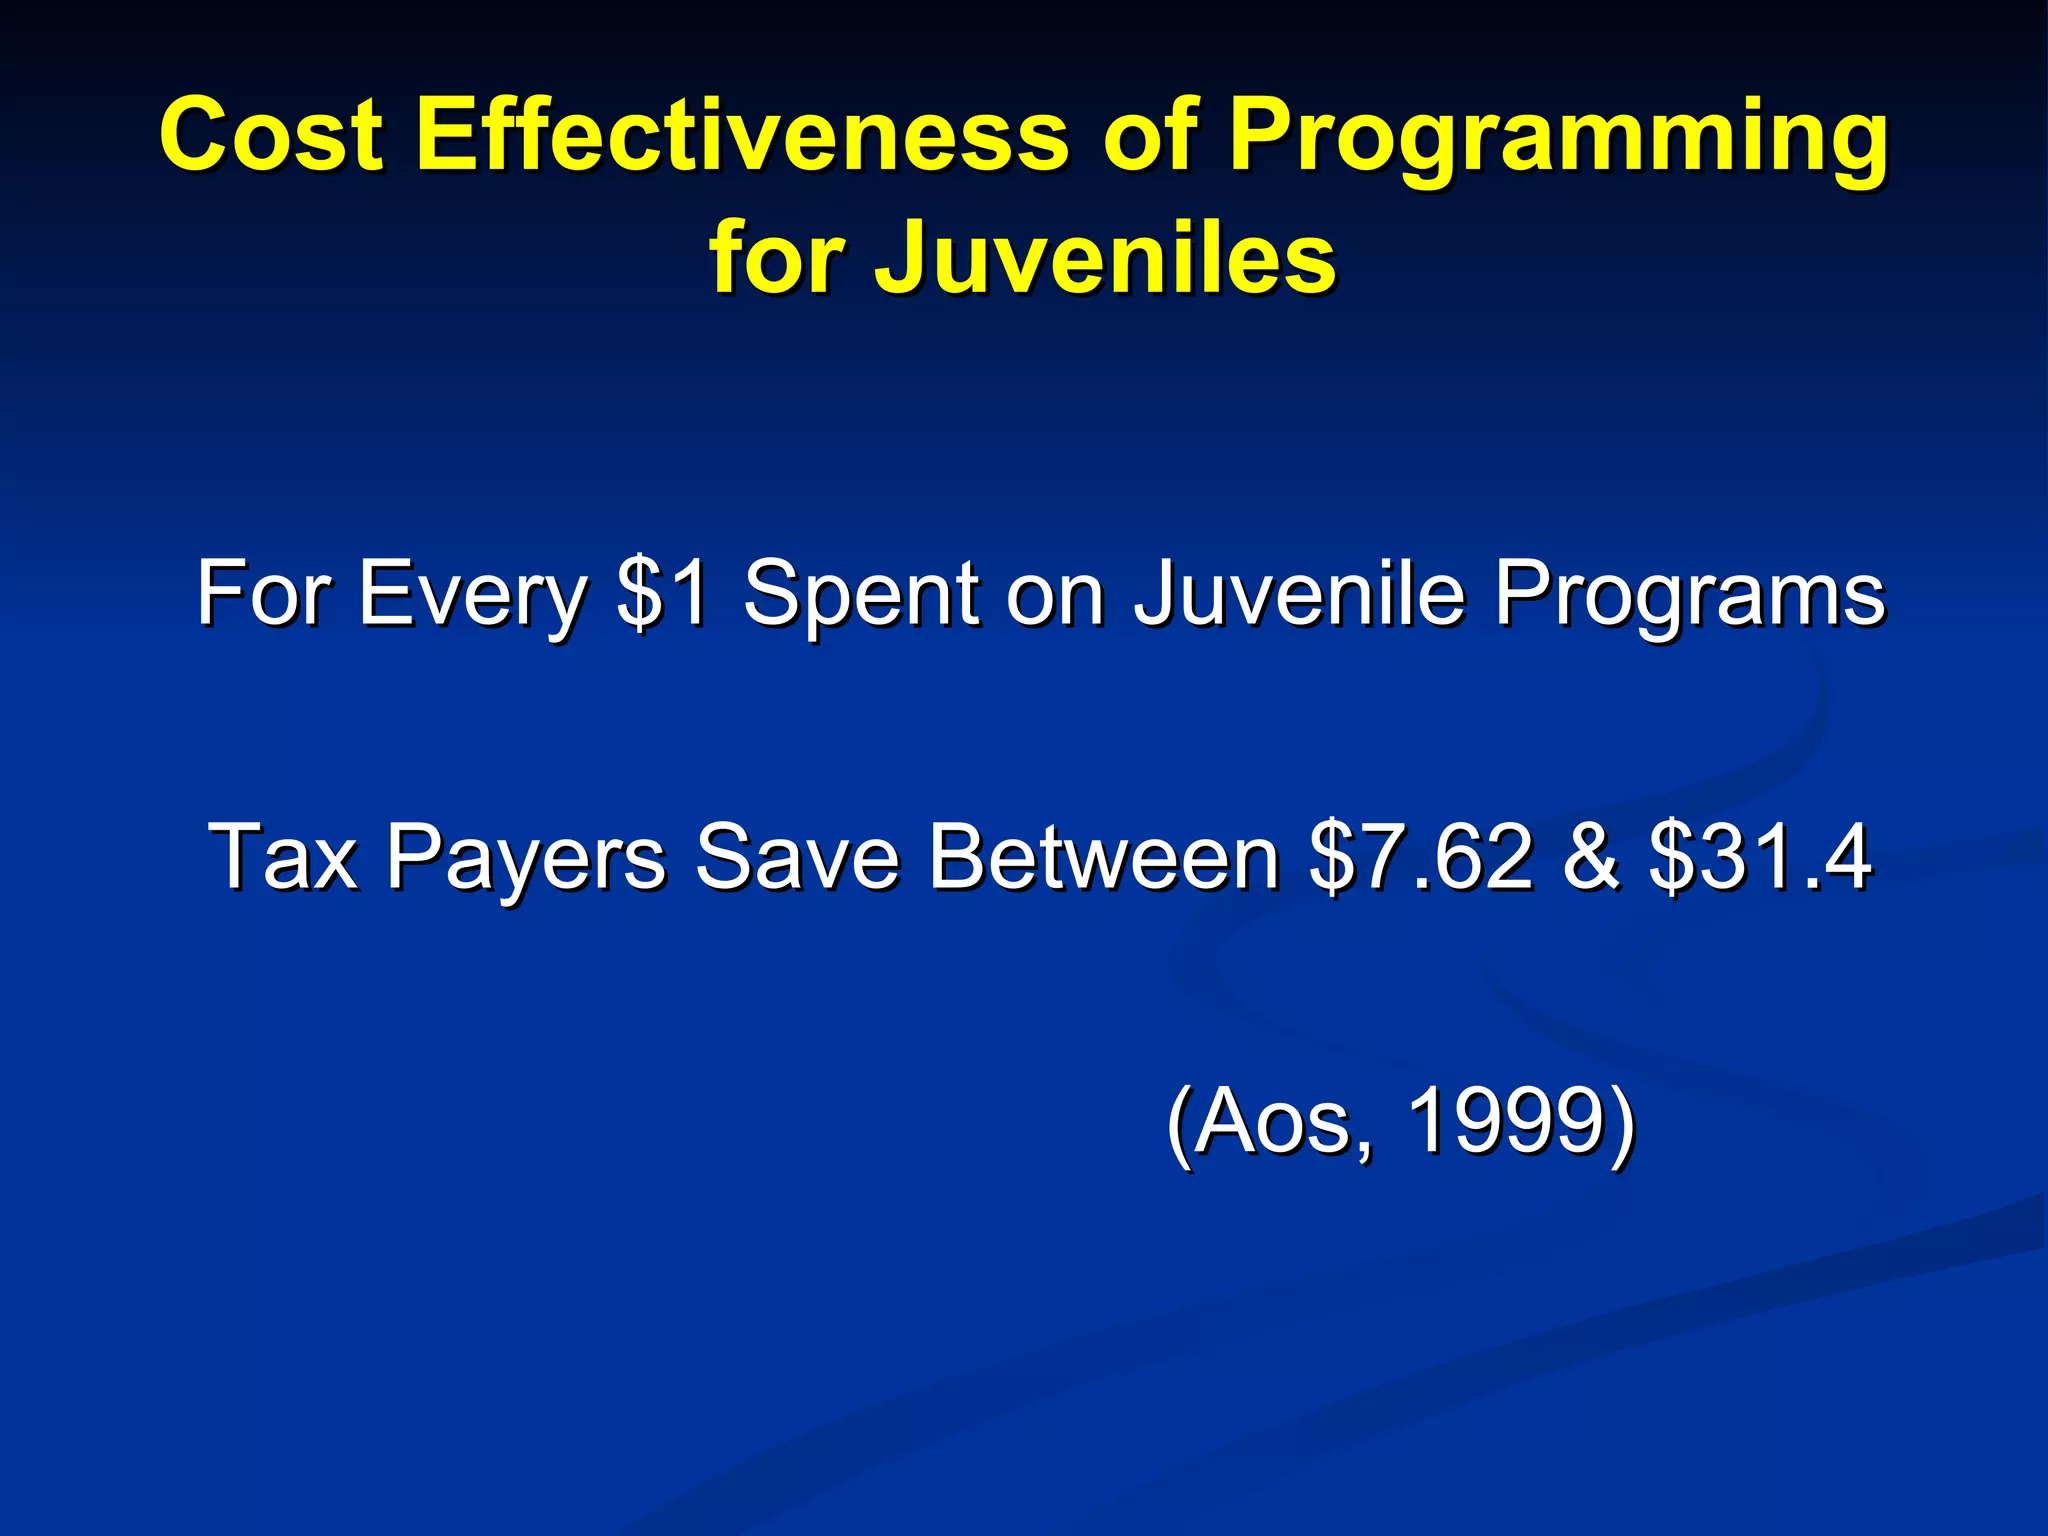
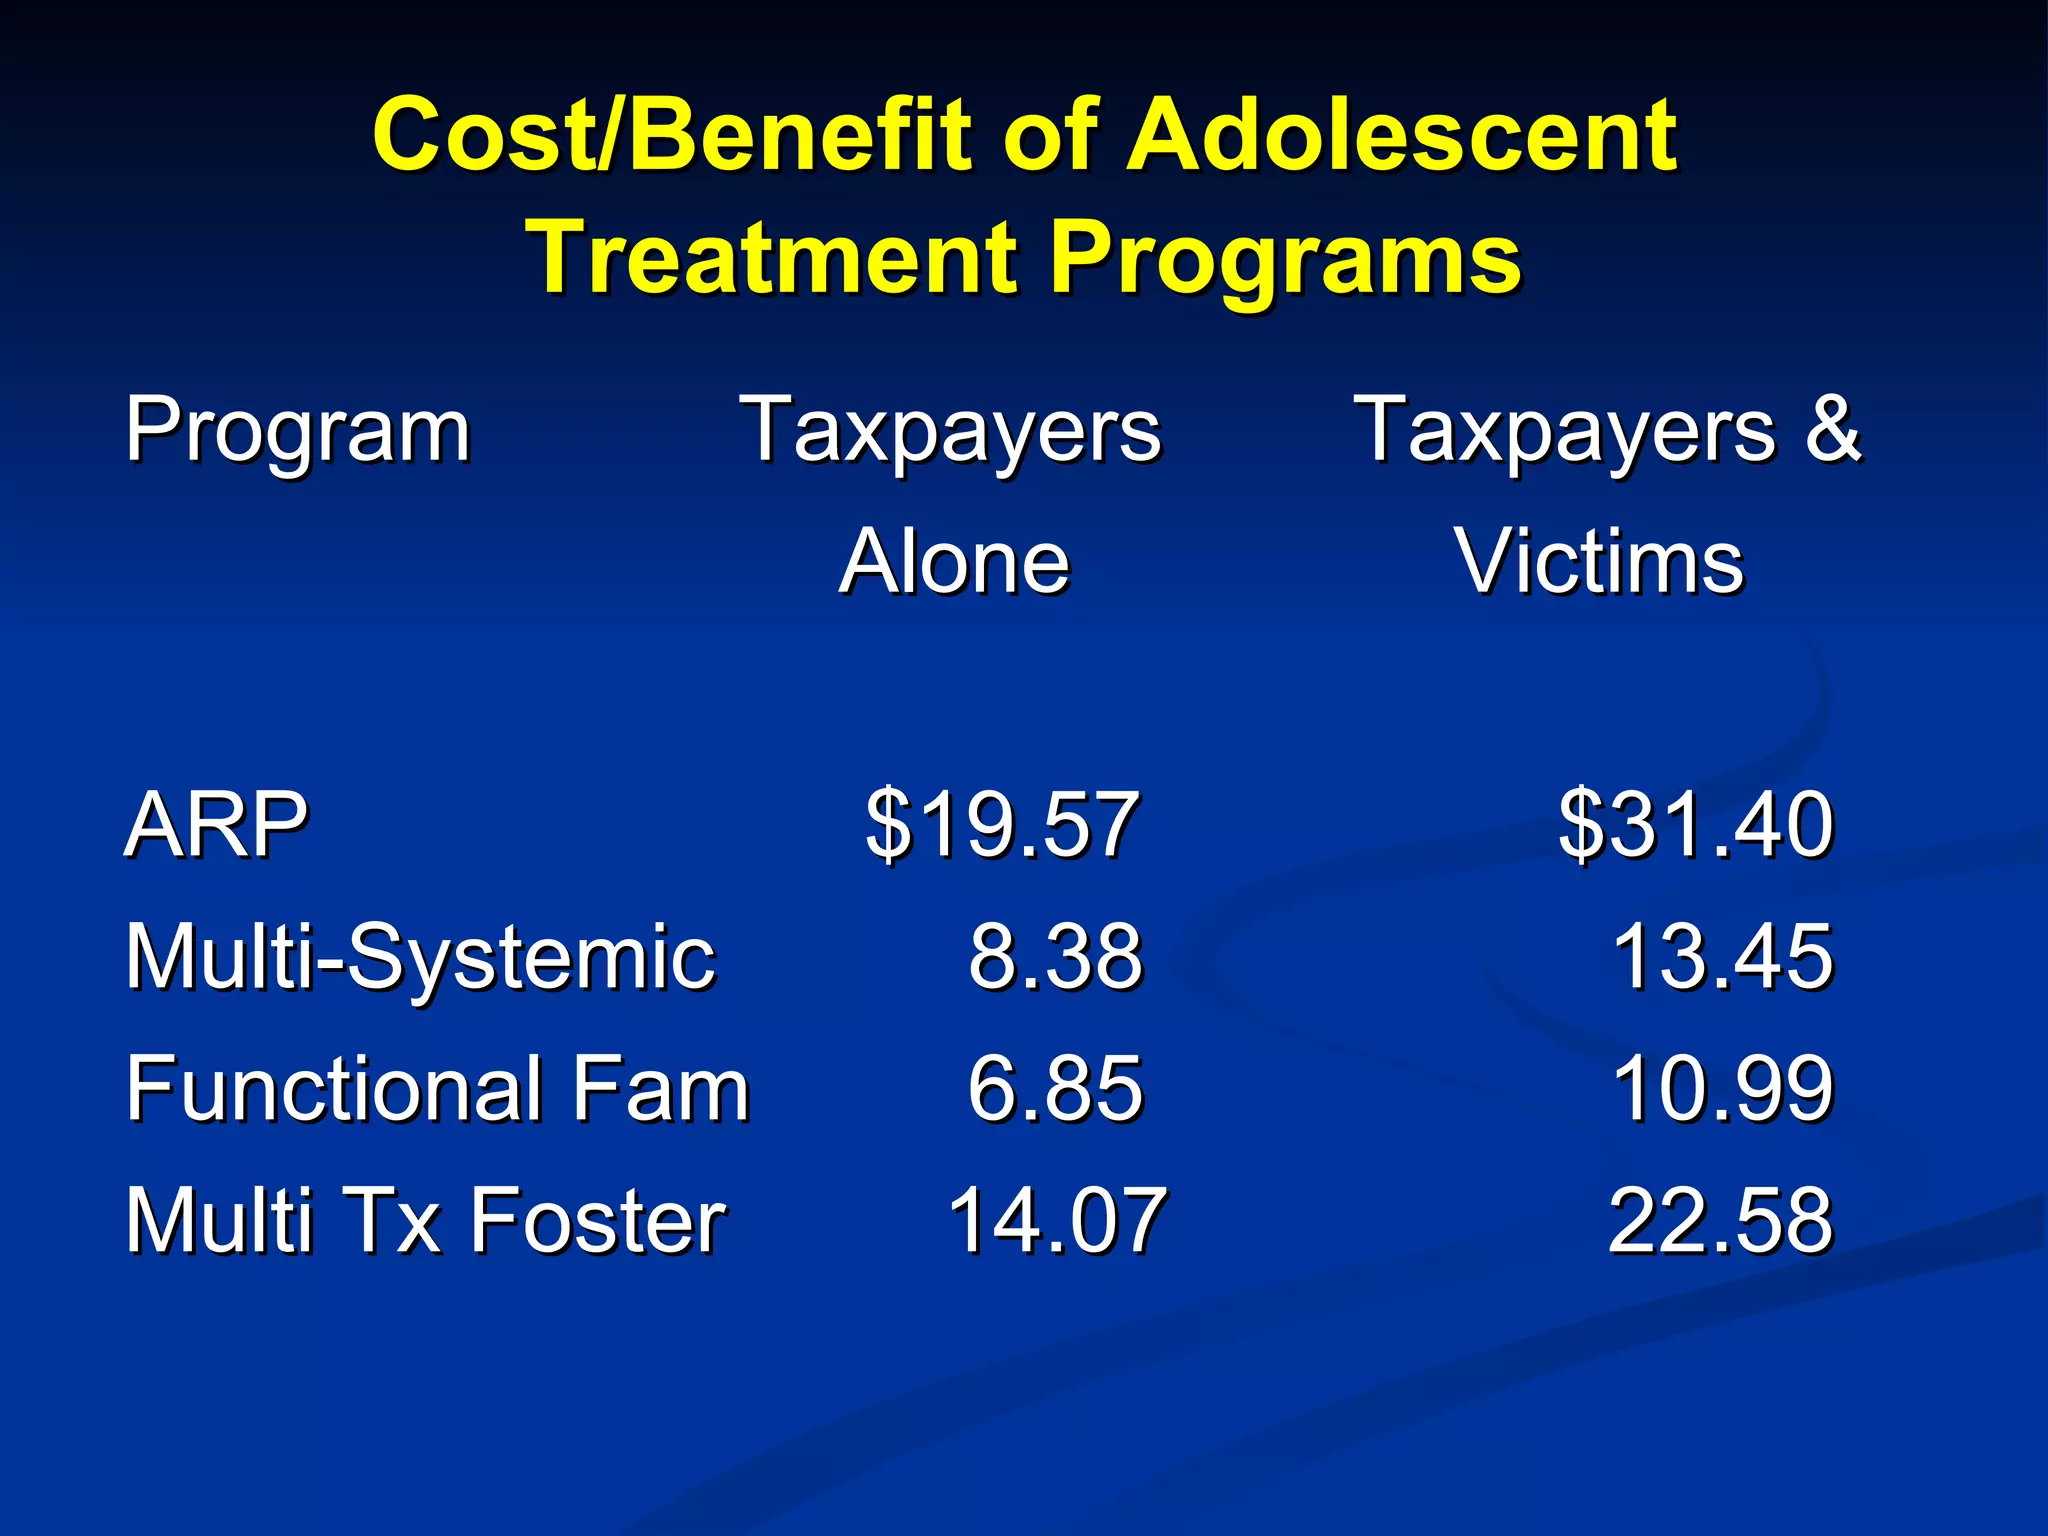
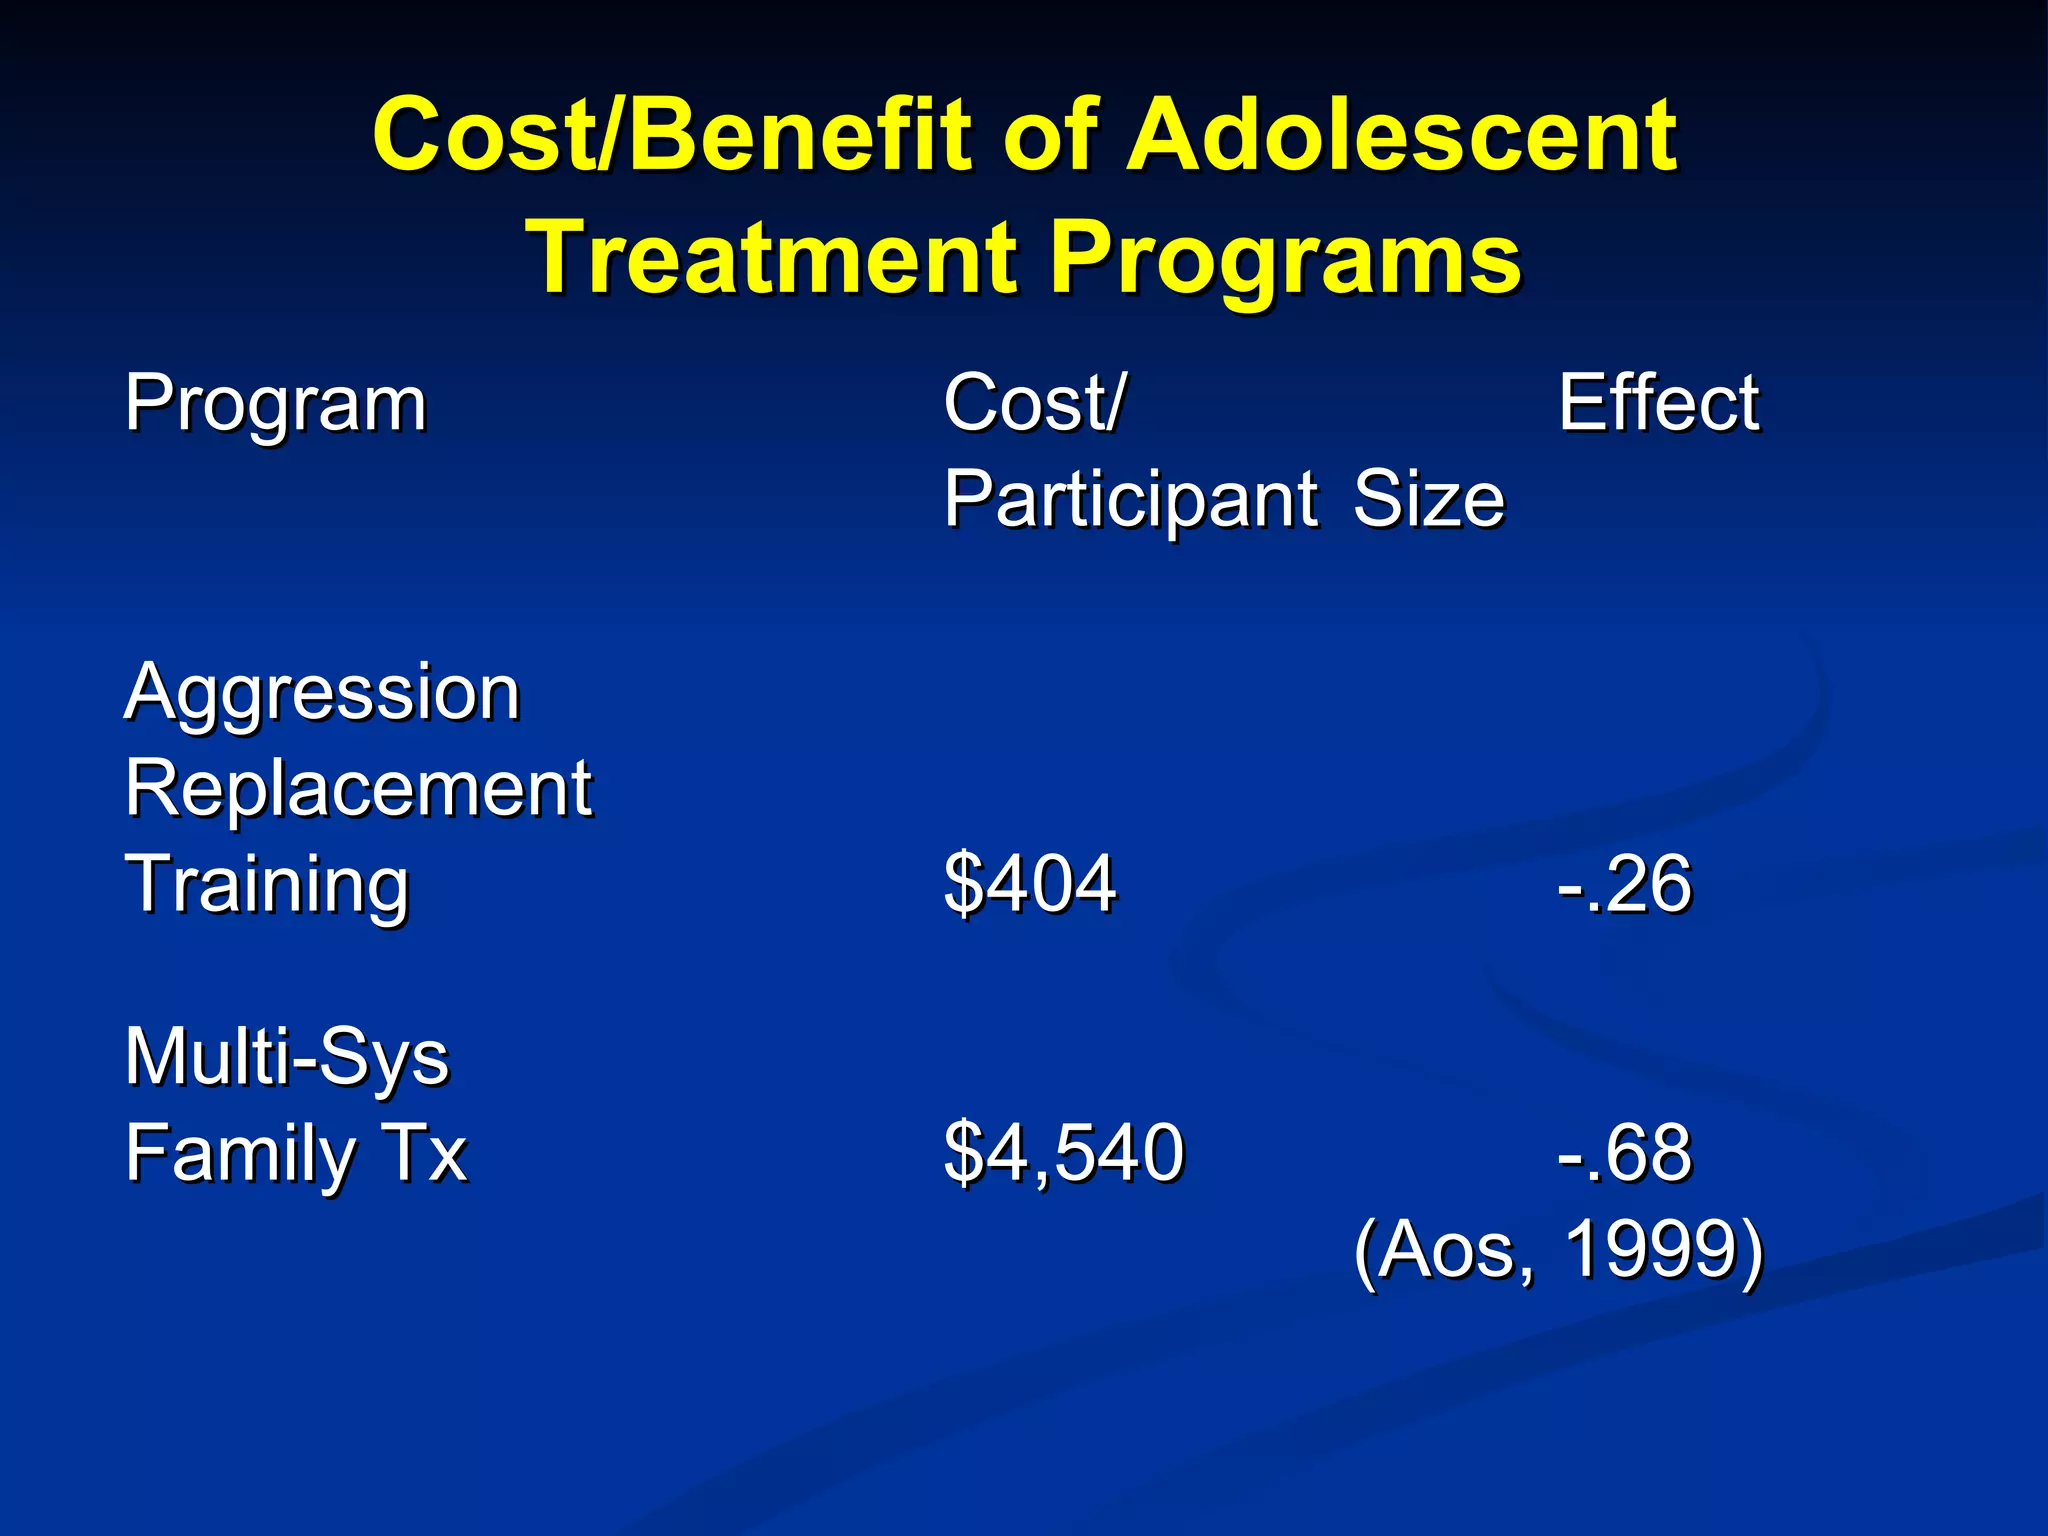
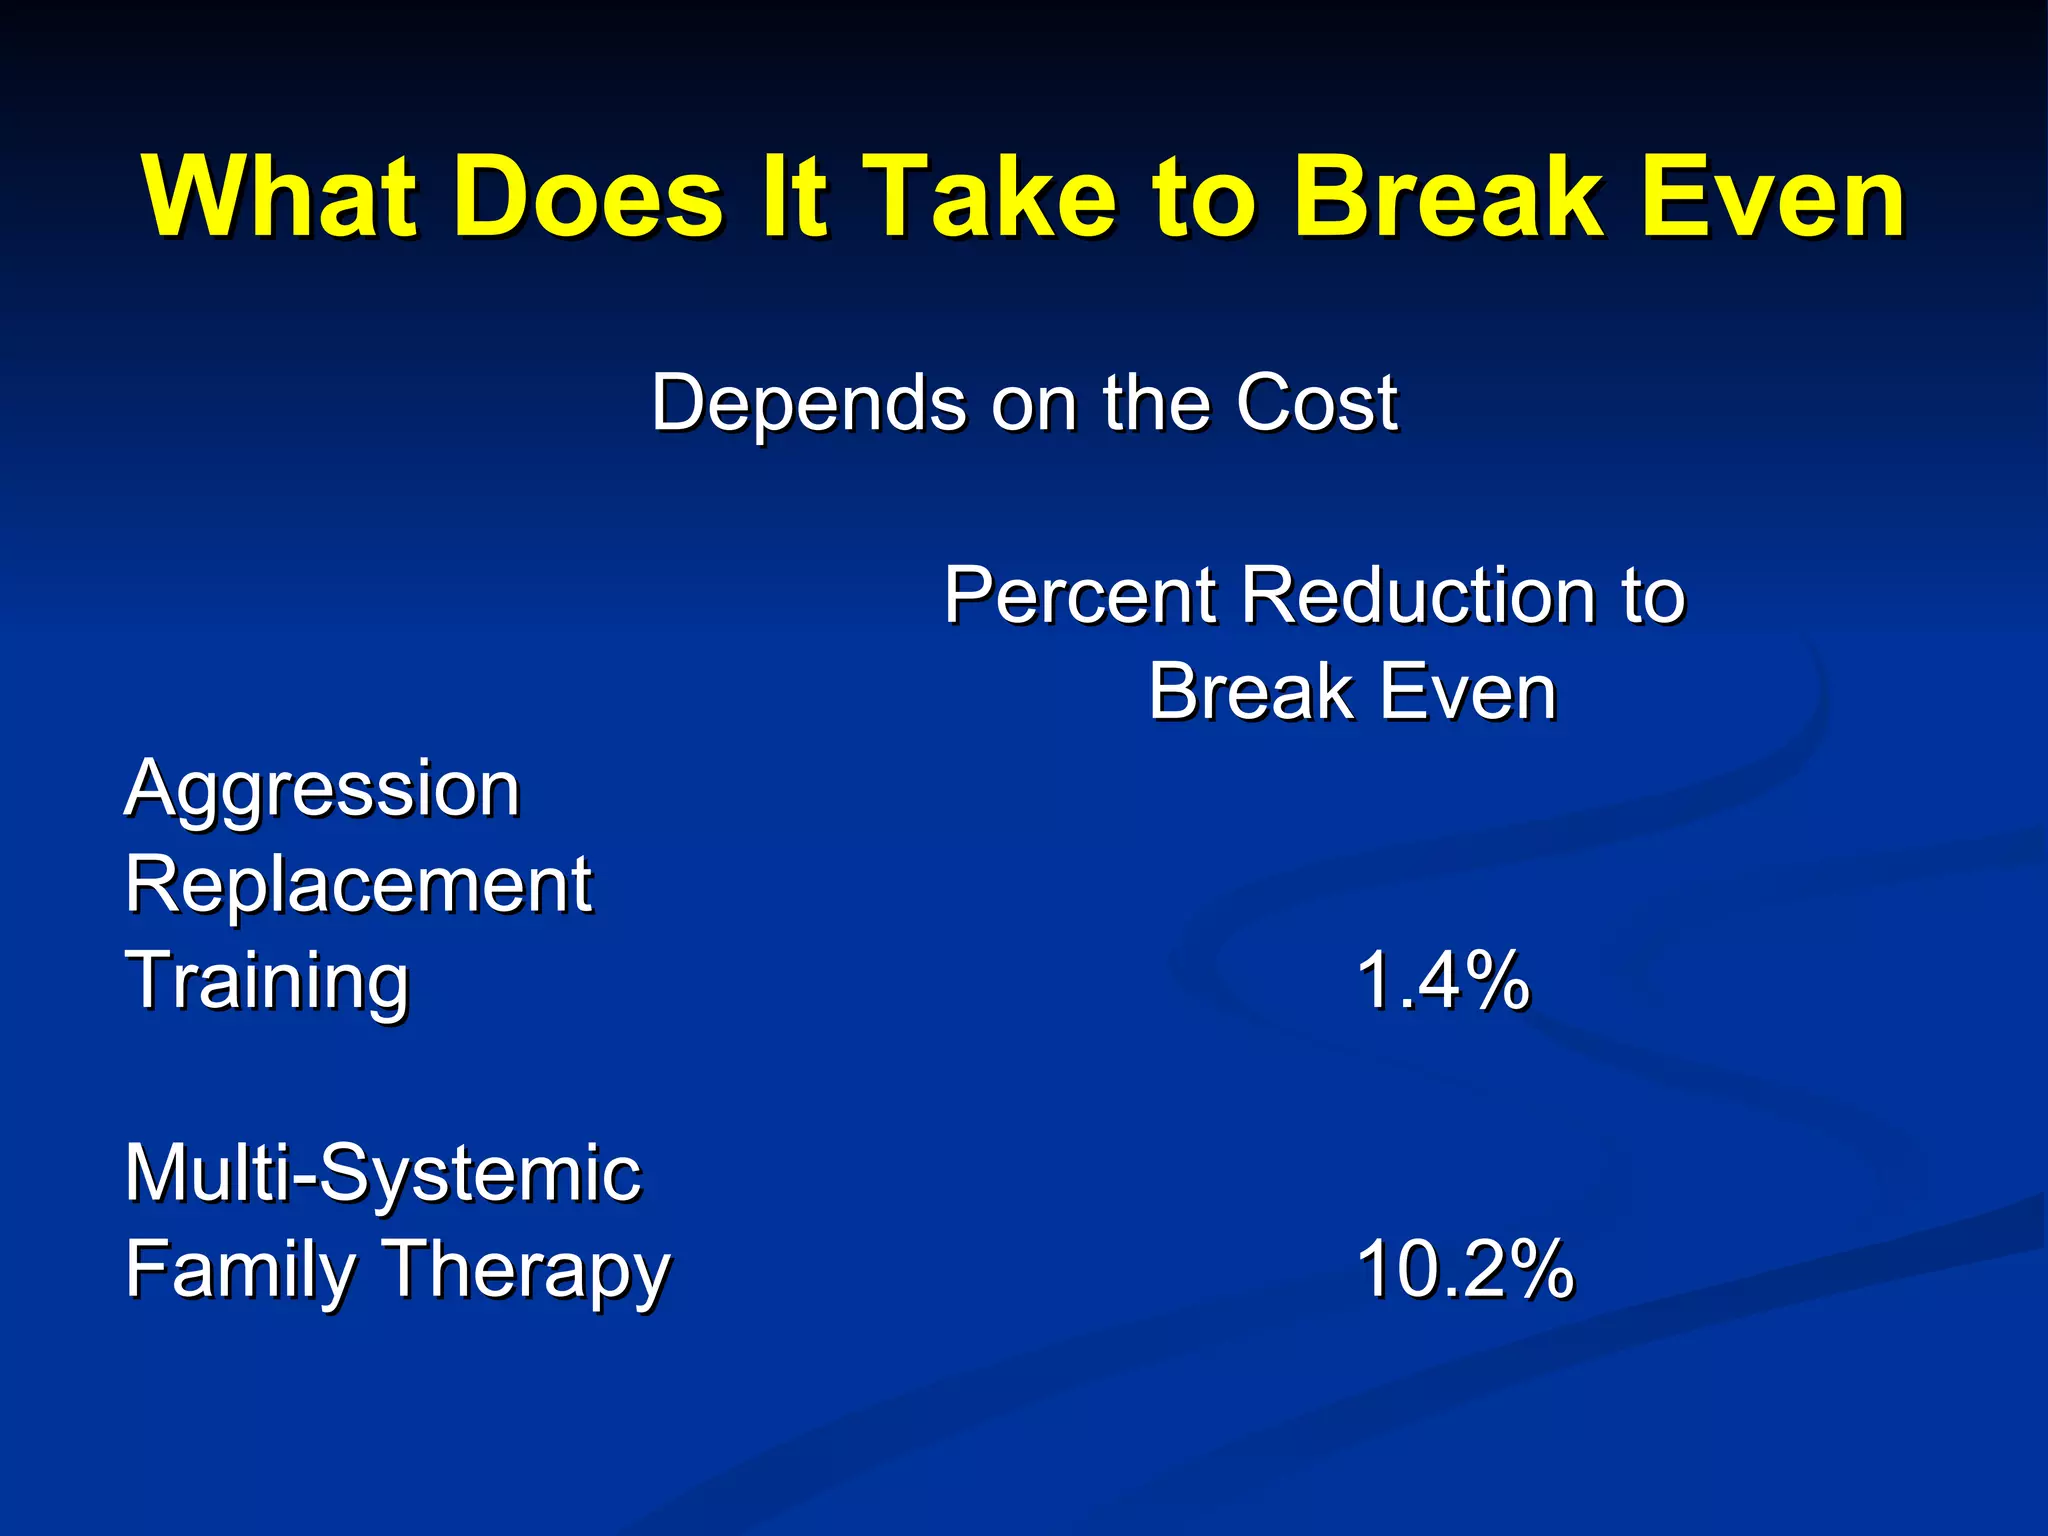
What Works? Reducing Criminal Offending
Reasons for Incarceration Punishment Justice for Victim Incapacitation Impact on Potential Offenders Reduction of Recidivism
Impact of More Severe Sanctions on Recidivism Incarceration vs. Probation Intermediate Sanctions vs. Standard Supervision   (Smith, 2002)
Characteristics of Studies 117 Studies N = 442,471 (Smith, 2002)
Impact of Incarceration on Recidivism N = 268,806 68% American Studies No Change in Recidivism or Slight Increase in Recidivism (Smith, 2002)
High Quality vs. Low Quality Studies High Quality Random Assignment Comparison Group Designs Age Criminal History Antisocial Values (Smith, 2002)
Random Assignment Studies 2 Studies Incarceration Vs Community Slight increases in recidivism    (Smith, 2002)
Intermediate Sanctions Electronic Monitoring Fines Restitution Intensive Surveillance Scared Straight Drug Testing Boot camp (Smith, 2002)
Intermediate Sanctions vs. Standard Supervision N = 66,500  American Studies 80% Slight Decrease in Recidivism  Or No Difference
Boot Camps Vs. Restitution Scared Straight No Impact Boot camps No Impact Restitution  5% Decrease (Latimer et al., 2001;  MacKenzie et al., 2001)
Same Findings Juveniles vs. Adults Men or Women (maybe) White or Minority Race (few studies) Low and High Risk Offenders (Smith, 2002)
Women More Severe Punishment  May Increase Recidivism in  Women More than Men   (Smith, 2002)
Exception Intensive Supervision plus treatment Slight decrease in recidivism (10%) (Smith, 2002)
Impact of Treatment Vs. Sanctions (Andrews, 1998)
Impact of Treatment Vs. Sanctions Young Offenders Dowden & Andrews, 1999
Impact of Appropriate Vs. Inappropriate Treatment (Andrews, 1998)
Type of Treatment Andrew, 1994
Type of Treatment & Young Offenders Dowden & Andrews, 1999
“ All meta-analyses on offender treatment have a positive mean effect size.” (Losel, 1995)
Appropriate Treatment Higher Risk More Intensive Targets Criminogenic Needs Uses Cognitive-Behavioral Treatment Implement Treatment As Designed  (Andrews, 1998)
Targeting Criminogenic Needs
Criminogenic Needs Criminogenic Non Criminogenic Antisocial Attitudes Self-Esteem Antisocial Friends Anxiety Substance Abuse Depression Impulsivity
Targeting Criminogenic Needs Gendreau, French & Taylor, 2002
Self Esteem Vs. Criminogenic Needs
What Works Higher Risk Offenders At least 2 sessions per week Smaller groups Implementation Monitored Staff Trained on Cognitive-Behavioral Tx Higher Proportion of Treatment Completers
Programming That Doesn’t Work Psychodynamic Non-directive/Client-centered Disease Model (Andrews, 1998)
Impact of Cognitive Self-Change Program Length New Accusations After Years Of Time (Mo.) 1 2 3 No treatment 49% 71% 77% 1 – 6 54% 67% 80% 7 + 25% 42% 46% (Bush, 1995)
Impact of Cognitive Self-Change Program (Bush, 1995)
How Many Programs Are Appropriate? Correctional Program Assessment Inventory Scores (CPAI) 50 correctional programs  (Latessa & Holsinger, 1998)
How Many Programs Are Appropriate? (Latessa & Holsinger, 1998)
ATSA Collaborative Study N = 43 studies All treated between 1965 – 1999 80% treated after 1980 9,316 subjects 23 Institutional programs 16 Community programs 3 both
ATSA Collaborative Study Recidivism Data Treated N = 5018 Untreated N = 4298 Odds Ratio All programs Sexual 12.3% 17.7% .81 General 28.7% 41.7% .56
Current vs Noncurrent Current means 1) Treatment still offered in 1999 2) All Cognitive Behavioral since 1980 Noncurrent had no impact on sexual or general recidivism
ATSA Collaborative Study Recidivism Data Treated Untreated Odds Ratio Only current programs Sexual 9.9% 17.3% .60 General 32.3% 51.3% .57
Psychopathy:  Treatment
Program for personality disordered offenders "Maxwell Jones" Therapeutic Community Minimum 2 yrs in program Mean follow-up after release = 8 yrs, 4 months Psychopaths defined by PCL-R score of 27 PCL-R coded from files only (r = .96) 176 treated patients; 146 untreated patients Mean time to failure = 47 months (Rice, Harris, & Cormier, 1992) Psychopathy and Recidivism After Treatment
Psychopathy & Treatment Non    Psychopaths Treated 22% Untreated 39% (Harris, Rice et al., 1994)
Psychopathy & Treatment Psychopaths Treated 77% Untreated 55% (Harris, Rice et al., 1994)
Psychopathy, Treatment, and Reconvictions in HMP Service   Tx anger-management, social skills 24-month reconviction rate ( Hare, Clark, Grann, & Thornton, 2000)
Percent Reconvicted 2-Year Post-release Reconviction Rates in the  English Prison Service Hare, Clark, Grann, & Thornton (2000)
Cost of Recidivism To Taxpayers To Victims
Computing Cost of Recidivism Police Investigation Adjudication Corrections Medical Care of Victims Mental Health Care of Victims Property Damage Reduced Future Earnings (Aos, 1999)
Computing Victim Cost of Recidivism Medical Care Mental Health Care Property Damage Reduced Future Earnings Pain and Suffering Loss of Life (Aos, 1999)
Cost Effectiveness of Correctional Programming Every $1 Spent on Correctional Programming Taxpayers Save $5 Victims Save $7 (Aos, 1999)
Cost Effectiveness of Vocational and Basic Education Programs For Every $1 Spent Taxpayers save between $1.71 & $3.23 (Aos et al., 1999)
Cost Effectiveness of Cognitive-Behavioral Treatment Programs For Every $1 Spent Taxpayers Save Between $2.54 and $11.48   (Aos et al., 1999)
“ We found the largest and most consistent returns are for programs designed for juvenile offenders.” (Aos et al., 1999, p. 6)
Cost Effectiveness of Programming for Juveniles For Every $1 Spent on Juvenile Programs Tax Payers Save Between $7.62 & $31.4 (Aos, 1999)
Cost/Benefit of Adolescent Non Offender Programs Program Taxpayers Taxpayers &   Alone   Victims Quantum $.09 $.13 Big Brothers $1.30 $2.12 (Aos, 1999)
Cost/Benefit of Adolescent Non Offender Programs Program Cost/  Effect Participant Size Quantum $18,292 -.42 Big Brothers $1,009 -.05 (Aos, 1999)
Cost/Benefit of Adolescent Supervision Programs Program Taxpayers Taxpayers &   Alone   Victims Diversion $7.62 $13.61 Intensive  Probation   .90     1.49 Boot Camp   .42       .26 (Aos, 1999)
Cost/Benefit of Adolescent Treatment Programs Program Taxpayers Taxpayers &   Alone   Victims ARP     $19.57 $31.40 Multi-Systemic  8.38   13.45 Functional Fam  6.85   10.99 Multi Tx Foster 14.07   22.58
Cost/Benefit of Adolescent Treatment Programs Program Cost/  Effect Participant Size Aggression Replacement Training $404 -.26 Multi-Sys Family Tx $4,540 -.68 (Aos, 1999)
What Does It Take to Break Even Depends on the Cost Percent Reduction to  Break Even Aggression Replacement  Training 1.4% Multi-Systemic Family Therapy 10.2%

2 what works

  • 1.
    What Works? ReducingCriminal Offending
  • 2.
    Reasons for IncarcerationPunishment Justice for Victim Incapacitation Impact on Potential Offenders Reduction of Recidivism
  • 3.
    Impact of MoreSevere Sanctions on Recidivism Incarceration vs. Probation Intermediate Sanctions vs. Standard Supervision (Smith, 2002)
  • 4.
    Characteristics of Studies117 Studies N = 442,471 (Smith, 2002)
  • 5.
    Impact of Incarcerationon Recidivism N = 268,806 68% American Studies No Change in Recidivism or Slight Increase in Recidivism (Smith, 2002)
  • 6.
    High Quality vs.Low Quality Studies High Quality Random Assignment Comparison Group Designs Age Criminal History Antisocial Values (Smith, 2002)
  • 7.
    Random Assignment Studies2 Studies Incarceration Vs Community Slight increases in recidivism (Smith, 2002)
  • 8.
    Intermediate Sanctions ElectronicMonitoring Fines Restitution Intensive Surveillance Scared Straight Drug Testing Boot camp (Smith, 2002)
  • 9.
    Intermediate Sanctions vs.Standard Supervision N = 66,500 American Studies 80% Slight Decrease in Recidivism Or No Difference
  • 10.
    Boot Camps Vs.Restitution Scared Straight No Impact Boot camps No Impact Restitution 5% Decrease (Latimer et al., 2001; MacKenzie et al., 2001)
  • 11.
    Same Findings Juvenilesvs. Adults Men or Women (maybe) White or Minority Race (few studies) Low and High Risk Offenders (Smith, 2002)
  • 12.
    Women More SeverePunishment May Increase Recidivism in Women More than Men (Smith, 2002)
  • 13.
    Exception Intensive Supervisionplus treatment Slight decrease in recidivism (10%) (Smith, 2002)
  • 14.
    Impact of TreatmentVs. Sanctions (Andrews, 1998)
  • 15.
    Impact of TreatmentVs. Sanctions Young Offenders Dowden & Andrews, 1999
  • 16.
    Impact of AppropriateVs. Inappropriate Treatment (Andrews, 1998)
  • 17.
    Type of TreatmentAndrew, 1994
  • 18.
    Type of Treatment& Young Offenders Dowden & Andrews, 1999
  • 19.
    “ All meta-analyseson offender treatment have a positive mean effect size.” (Losel, 1995)
  • 20.
    Appropriate Treatment HigherRisk More Intensive Targets Criminogenic Needs Uses Cognitive-Behavioral Treatment Implement Treatment As Designed (Andrews, 1998)
  • 21.
  • 22.
    Criminogenic Needs CriminogenicNon Criminogenic Antisocial Attitudes Self-Esteem Antisocial Friends Anxiety Substance Abuse Depression Impulsivity
  • 23.
    Targeting Criminogenic NeedsGendreau, French & Taylor, 2002
  • 24.
    Self Esteem Vs.Criminogenic Needs
  • 25.
    What Works HigherRisk Offenders At least 2 sessions per week Smaller groups Implementation Monitored Staff Trained on Cognitive-Behavioral Tx Higher Proportion of Treatment Completers
  • 26.
    Programming That Doesn’tWork Psychodynamic Non-directive/Client-centered Disease Model (Andrews, 1998)
  • 27.
    Impact of CognitiveSelf-Change Program Length New Accusations After Years Of Time (Mo.) 1 2 3 No treatment 49% 71% 77% 1 – 6 54% 67% 80% 7 + 25% 42% 46% (Bush, 1995)
  • 28.
    Impact of CognitiveSelf-Change Program (Bush, 1995)
  • 29.
    How Many ProgramsAre Appropriate? Correctional Program Assessment Inventory Scores (CPAI) 50 correctional programs (Latessa & Holsinger, 1998)
  • 30.
    How Many ProgramsAre Appropriate? (Latessa & Holsinger, 1998)
  • 31.
    ATSA Collaborative StudyN = 43 studies All treated between 1965 – 1999 80% treated after 1980 9,316 subjects 23 Institutional programs 16 Community programs 3 both
  • 32.
    ATSA Collaborative StudyRecidivism Data Treated N = 5018 Untreated N = 4298 Odds Ratio All programs Sexual 12.3% 17.7% .81 General 28.7% 41.7% .56
  • 33.
    Current vs NoncurrentCurrent means 1) Treatment still offered in 1999 2) All Cognitive Behavioral since 1980 Noncurrent had no impact on sexual or general recidivism
  • 34.
    ATSA Collaborative StudyRecidivism Data Treated Untreated Odds Ratio Only current programs Sexual 9.9% 17.3% .60 General 32.3% 51.3% .57
  • 35.
  • 36.
    Program for personalitydisordered offenders "Maxwell Jones" Therapeutic Community Minimum 2 yrs in program Mean follow-up after release = 8 yrs, 4 months Psychopaths defined by PCL-R score of 27 PCL-R coded from files only (r = .96) 176 treated patients; 146 untreated patients Mean time to failure = 47 months (Rice, Harris, & Cormier, 1992) Psychopathy and Recidivism After Treatment
  • 37.
    Psychopathy & TreatmentNon Psychopaths Treated 22% Untreated 39% (Harris, Rice et al., 1994)
  • 38.
    Psychopathy & TreatmentPsychopaths Treated 77% Untreated 55% (Harris, Rice et al., 1994)
  • 39.
    Psychopathy, Treatment, andReconvictions in HMP Service Tx anger-management, social skills 24-month reconviction rate ( Hare, Clark, Grann, & Thornton, 2000)
  • 40.
    Percent Reconvicted 2-YearPost-release Reconviction Rates in the English Prison Service Hare, Clark, Grann, & Thornton (2000)
  • 41.
    Cost of RecidivismTo Taxpayers To Victims
  • 42.
    Computing Cost ofRecidivism Police Investigation Adjudication Corrections Medical Care of Victims Mental Health Care of Victims Property Damage Reduced Future Earnings (Aos, 1999)
  • 43.
    Computing Victim Costof Recidivism Medical Care Mental Health Care Property Damage Reduced Future Earnings Pain and Suffering Loss of Life (Aos, 1999)
  • 44.
    Cost Effectiveness ofCorrectional Programming Every $1 Spent on Correctional Programming Taxpayers Save $5 Victims Save $7 (Aos, 1999)
  • 45.
    Cost Effectiveness ofVocational and Basic Education Programs For Every $1 Spent Taxpayers save between $1.71 & $3.23 (Aos et al., 1999)
  • 46.
    Cost Effectiveness ofCognitive-Behavioral Treatment Programs For Every $1 Spent Taxpayers Save Between $2.54 and $11.48 (Aos et al., 1999)
  • 47.
    “ We foundthe largest and most consistent returns are for programs designed for juvenile offenders.” (Aos et al., 1999, p. 6)
  • 48.
    Cost Effectiveness ofProgramming for Juveniles For Every $1 Spent on Juvenile Programs Tax Payers Save Between $7.62 & $31.4 (Aos, 1999)
  • 49.
    Cost/Benefit of AdolescentNon Offender Programs Program Taxpayers Taxpayers & Alone Victims Quantum $.09 $.13 Big Brothers $1.30 $2.12 (Aos, 1999)
  • 50.
    Cost/Benefit of AdolescentNon Offender Programs Program Cost/ Effect Participant Size Quantum $18,292 -.42 Big Brothers $1,009 -.05 (Aos, 1999)
  • 51.
    Cost/Benefit of AdolescentSupervision Programs Program Taxpayers Taxpayers & Alone Victims Diversion $7.62 $13.61 Intensive Probation .90 1.49 Boot Camp .42 .26 (Aos, 1999)
  • 52.
    Cost/Benefit of AdolescentTreatment Programs Program Taxpayers Taxpayers & Alone Victims ARP $19.57 $31.40 Multi-Systemic 8.38 13.45 Functional Fam 6.85 10.99 Multi Tx Foster 14.07 22.58
  • 53.
    Cost/Benefit of AdolescentTreatment Programs Program Cost/ Effect Participant Size Aggression Replacement Training $404 -.26 Multi-Sys Family Tx $4,540 -.68 (Aos, 1999)
  • 54.
    What Does ItTake to Break Even Depends on the Cost Percent Reduction to Break Even Aggression Replacement Training 1.4% Multi-Systemic Family Therapy 10.2%