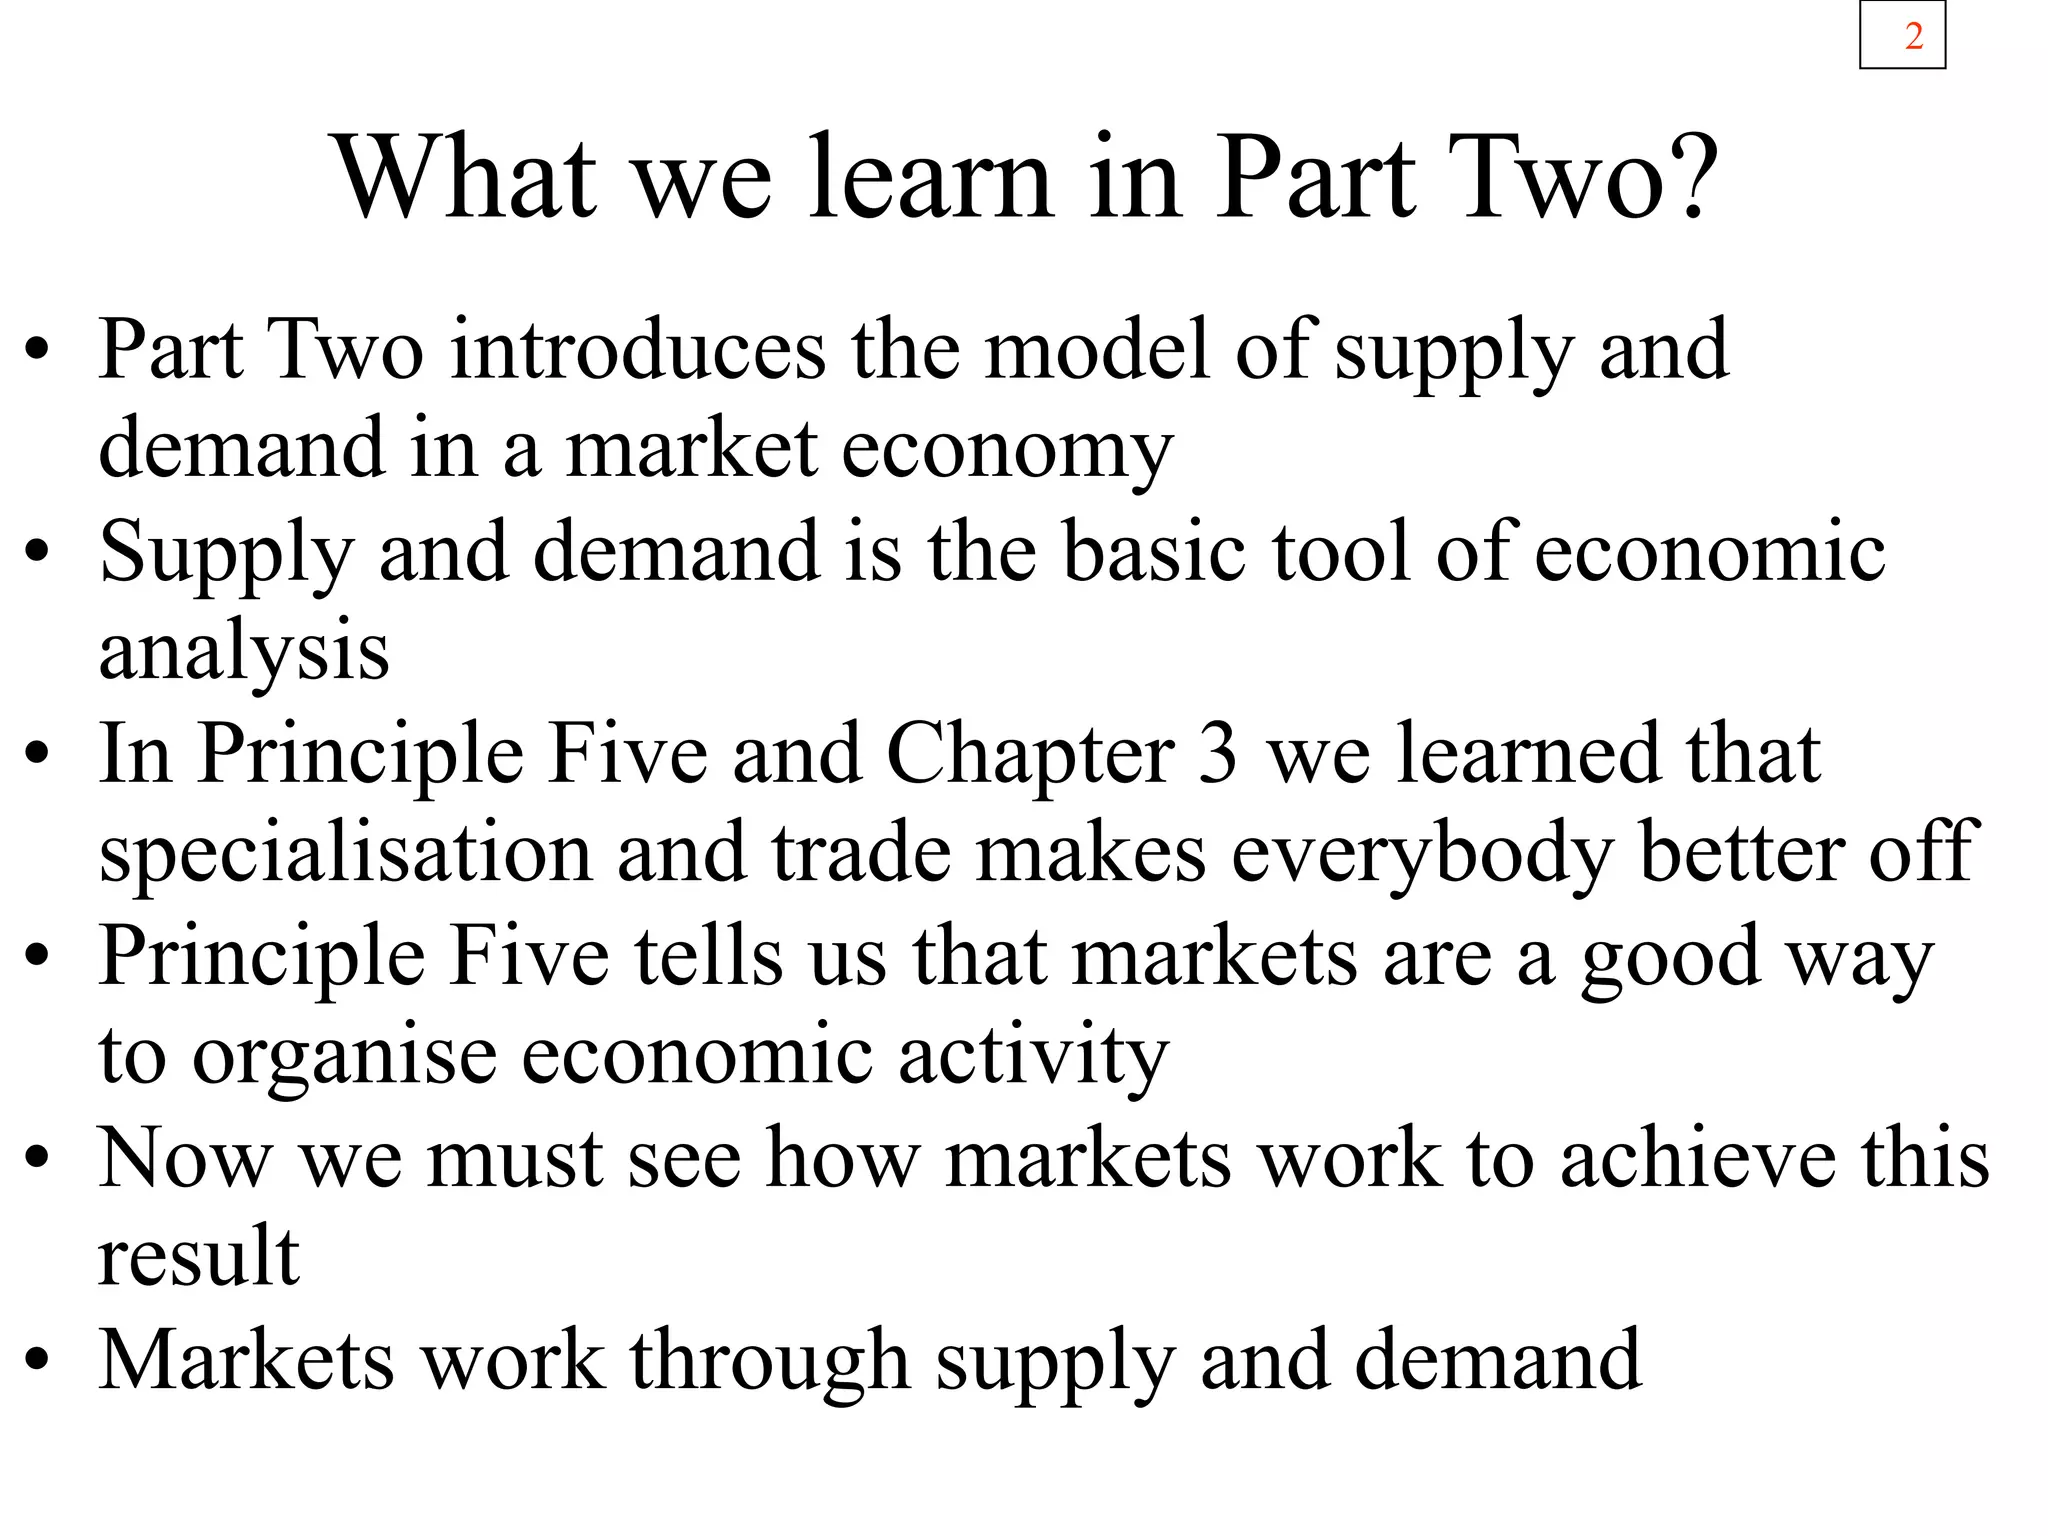
This document provides an overview of supply and demand concepts. It discusses key topics like:
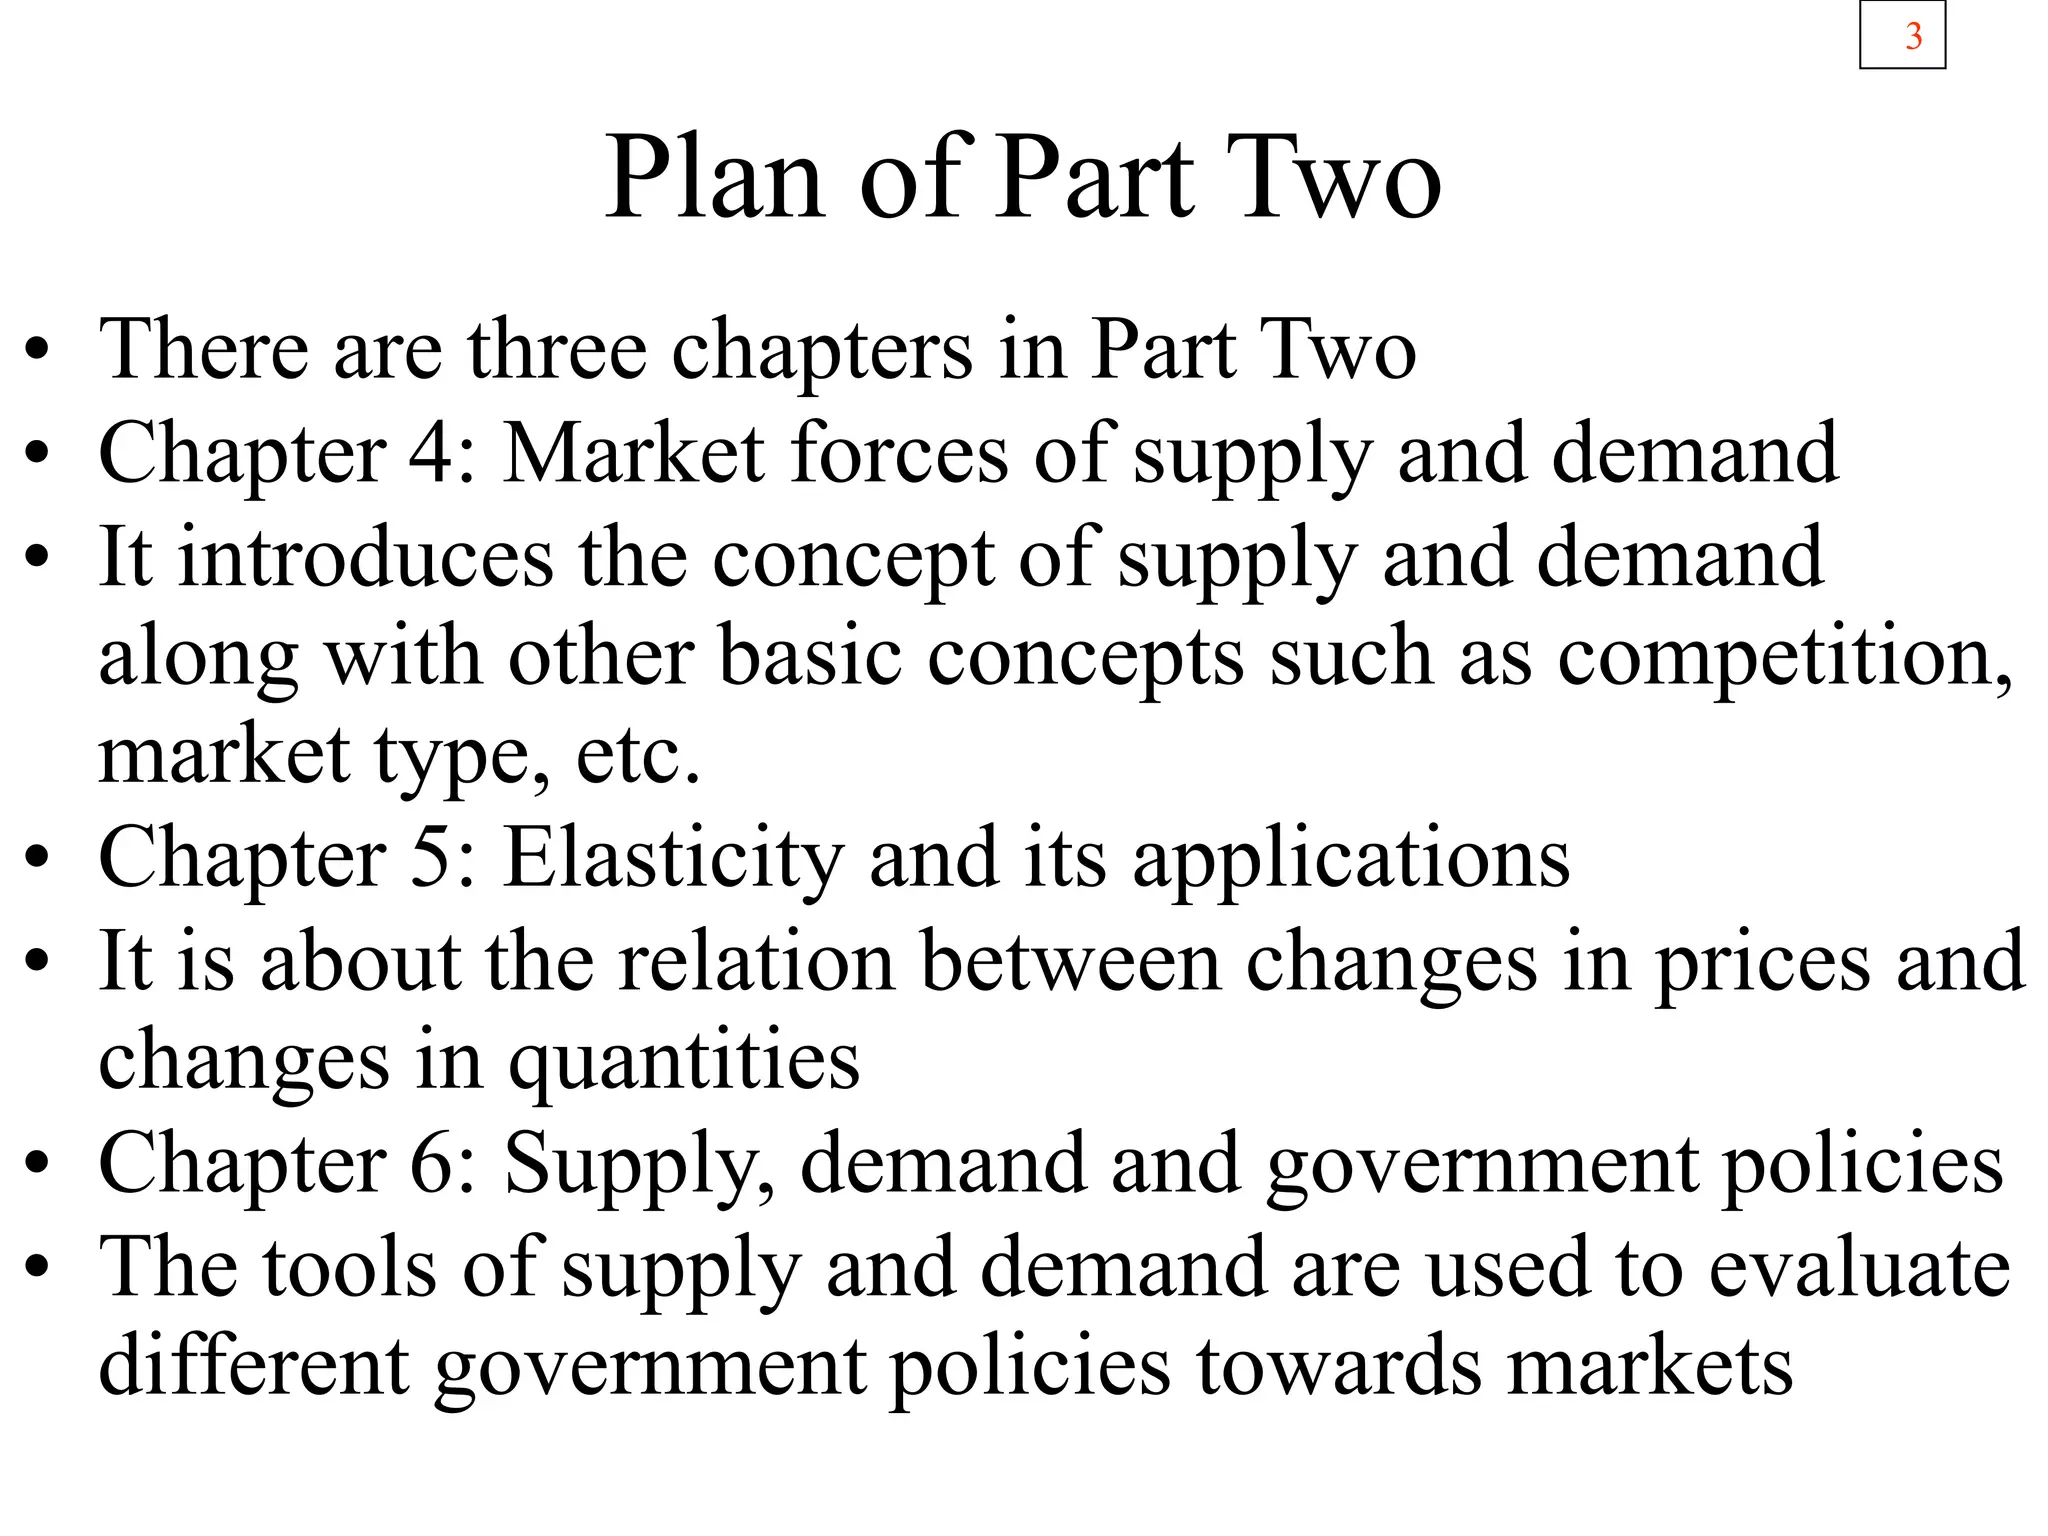
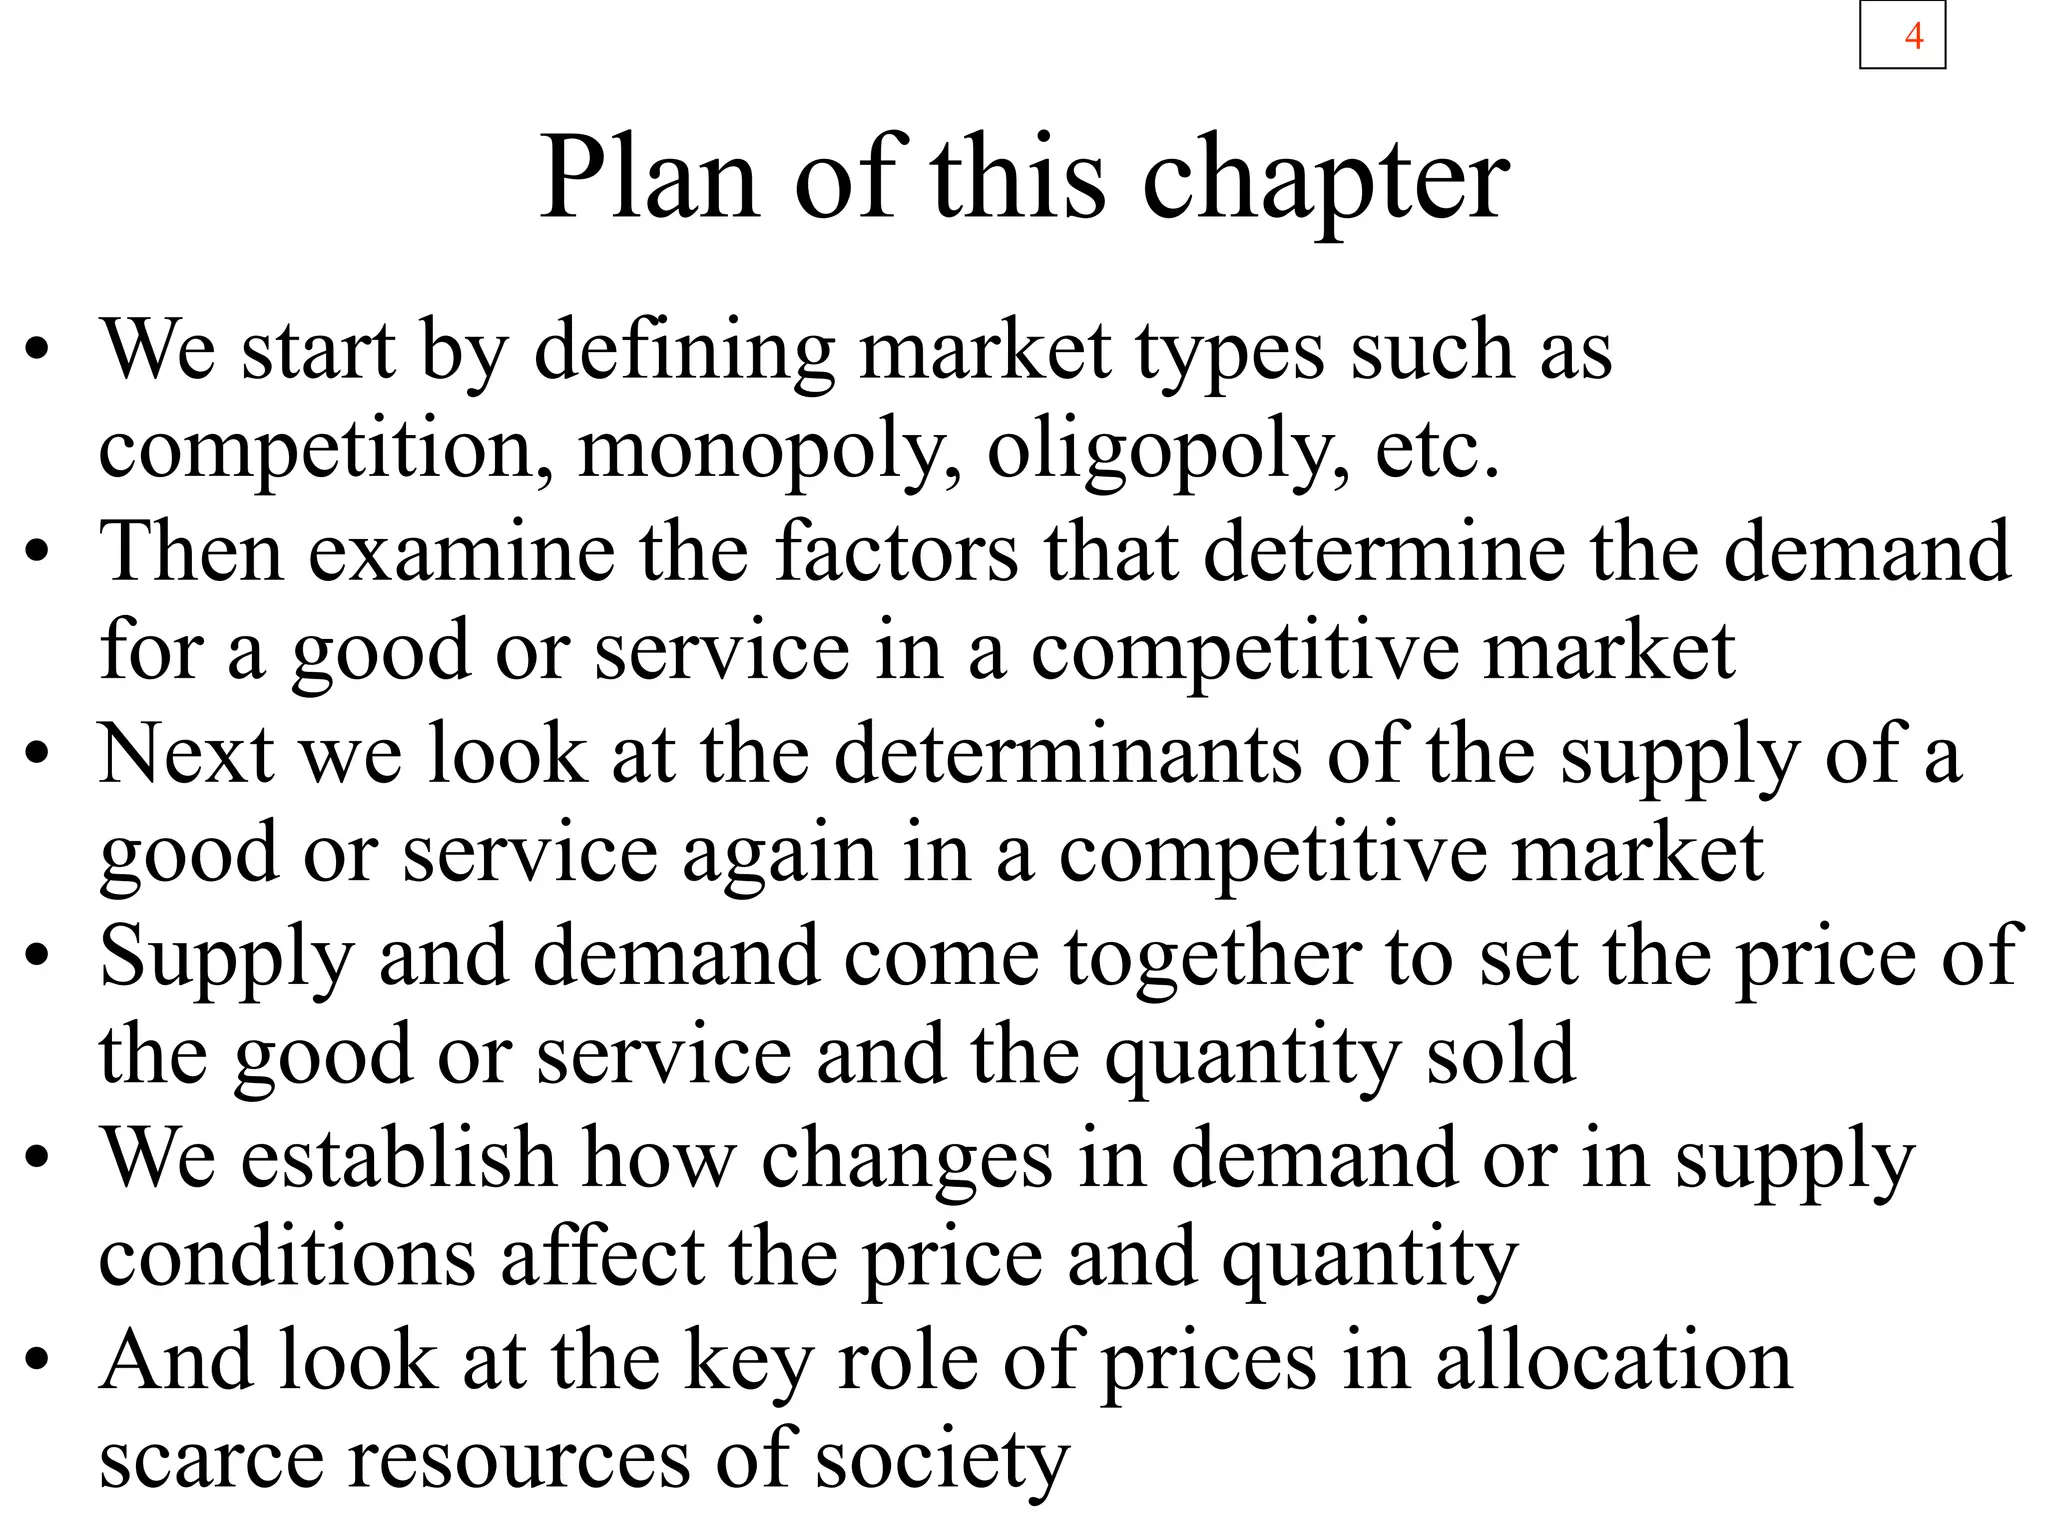
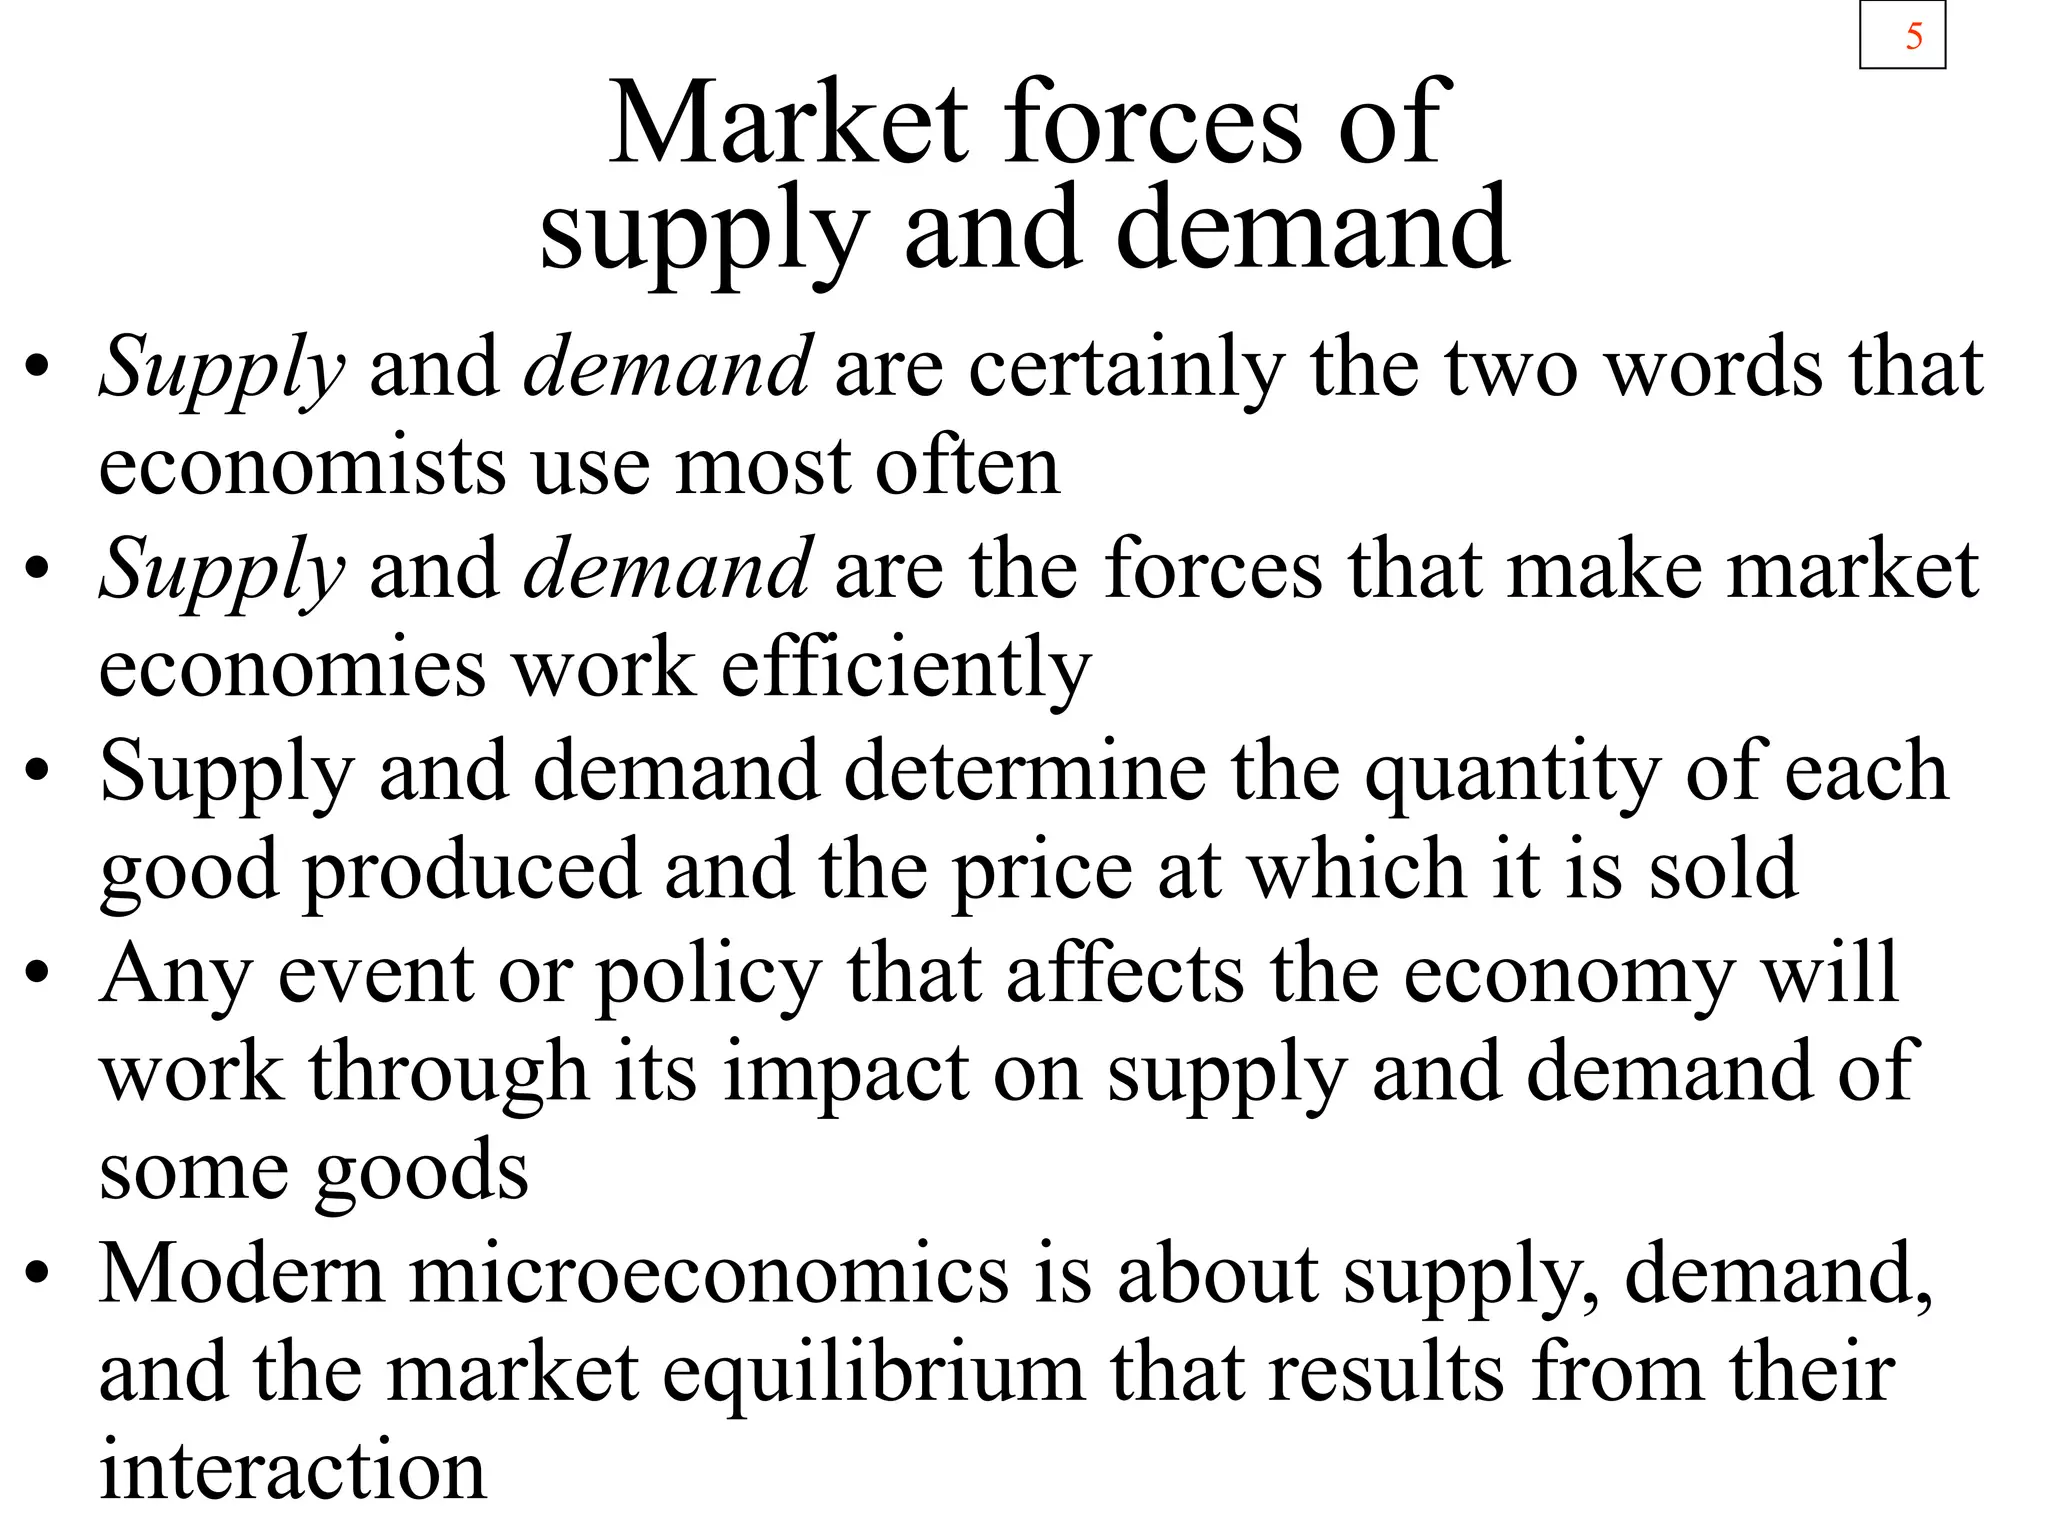
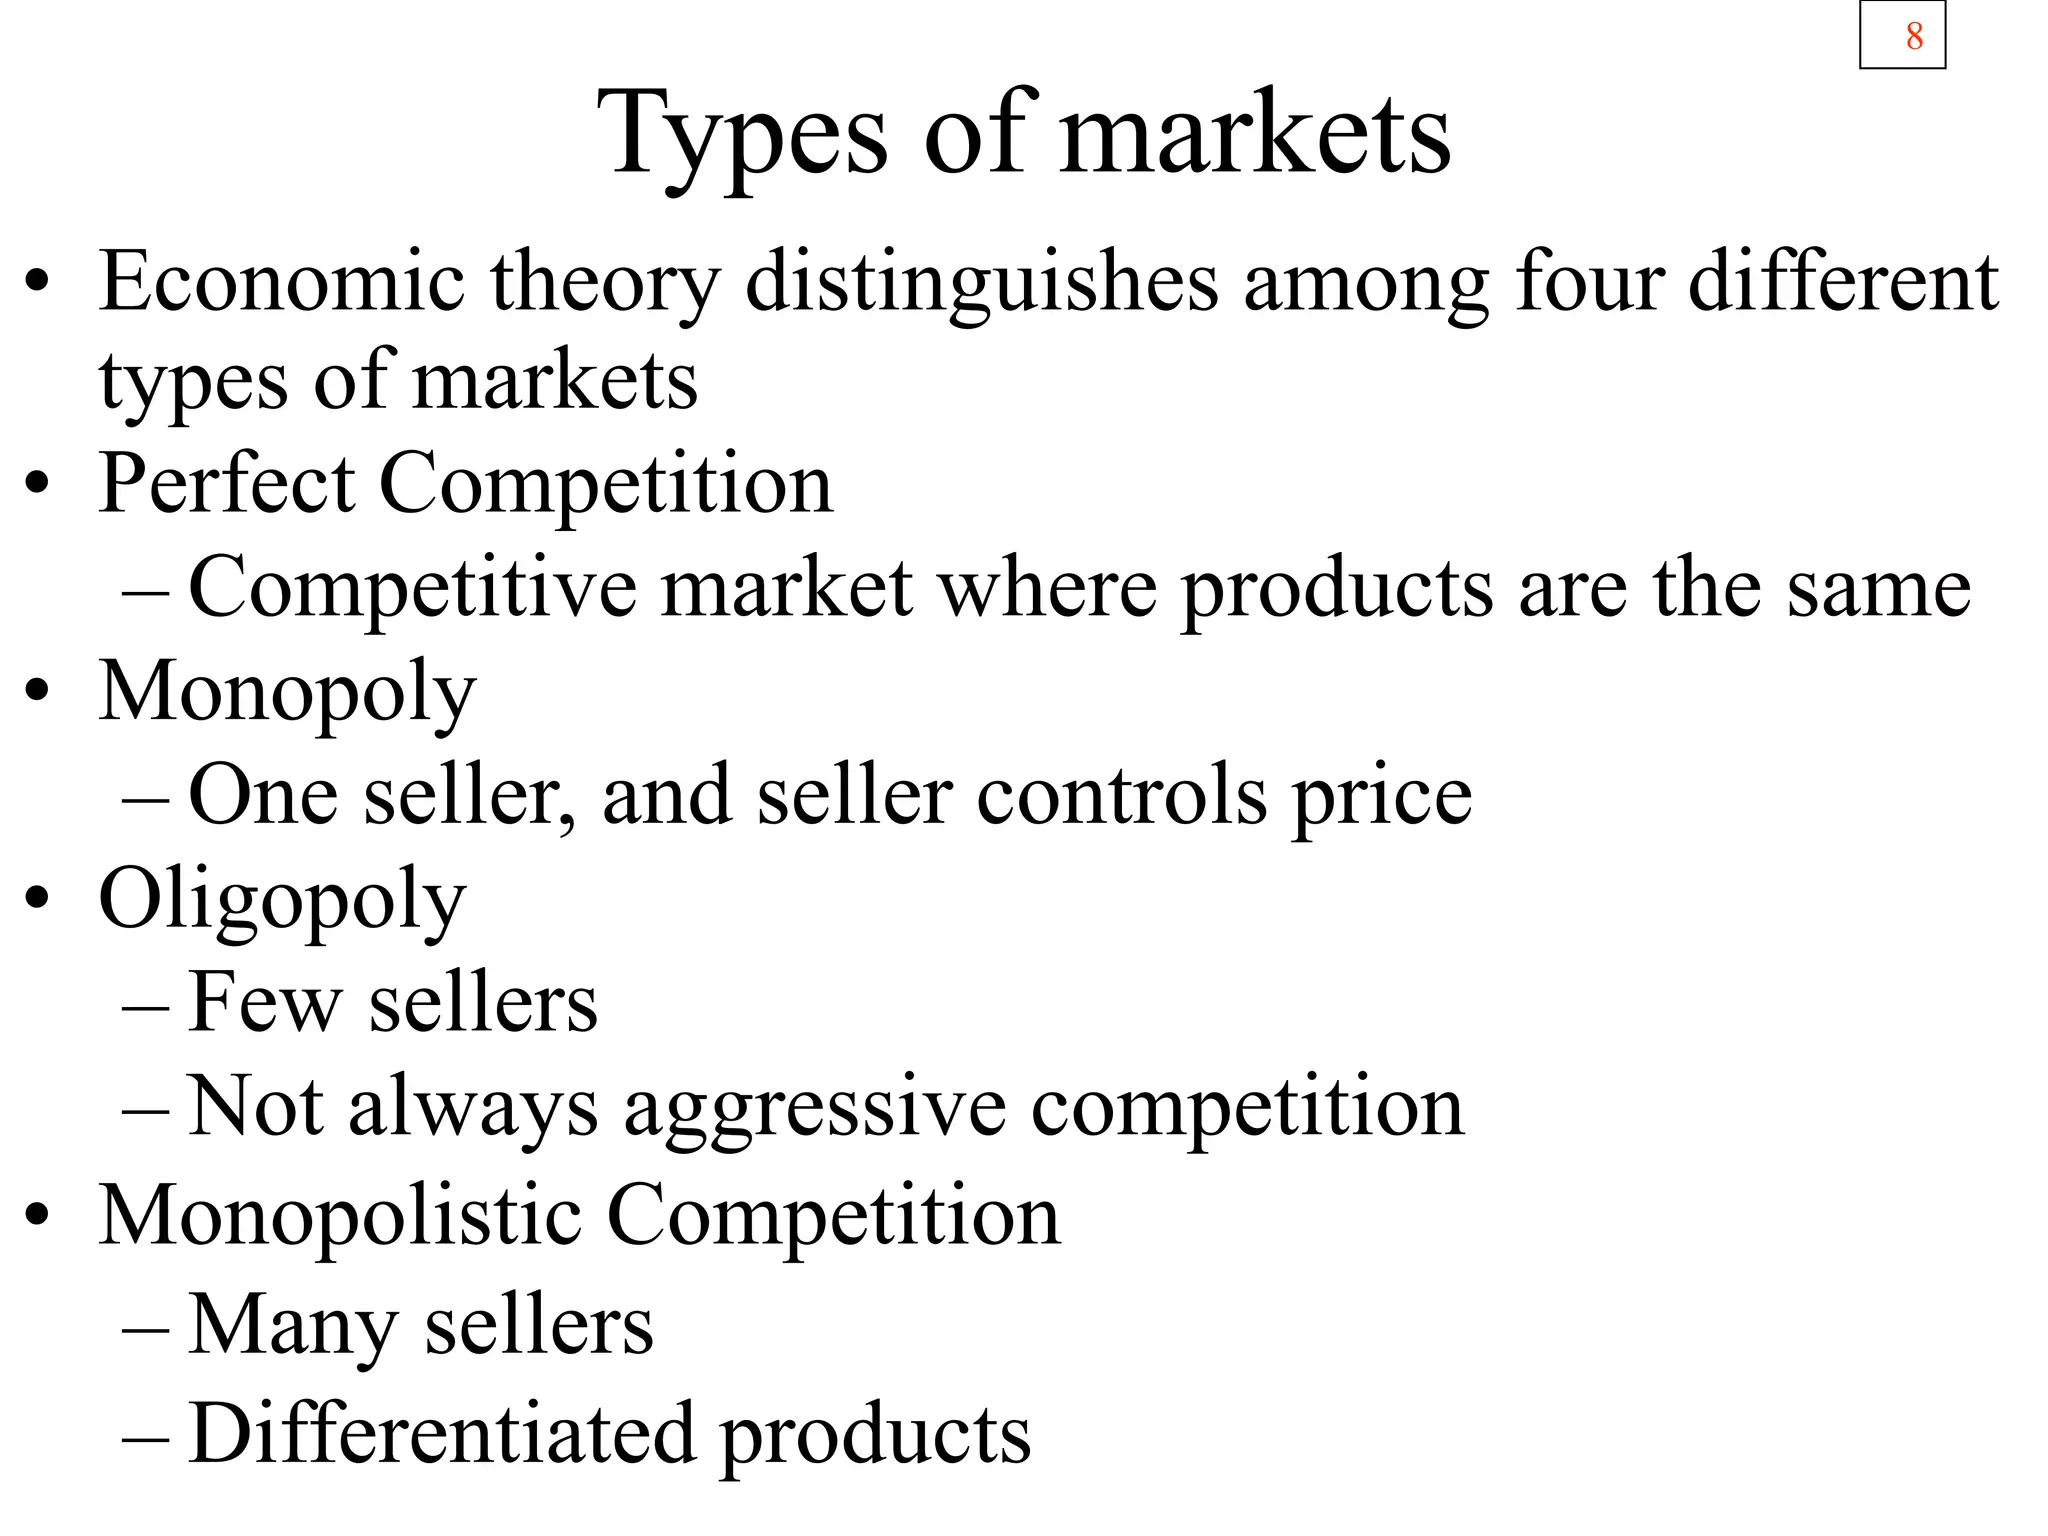
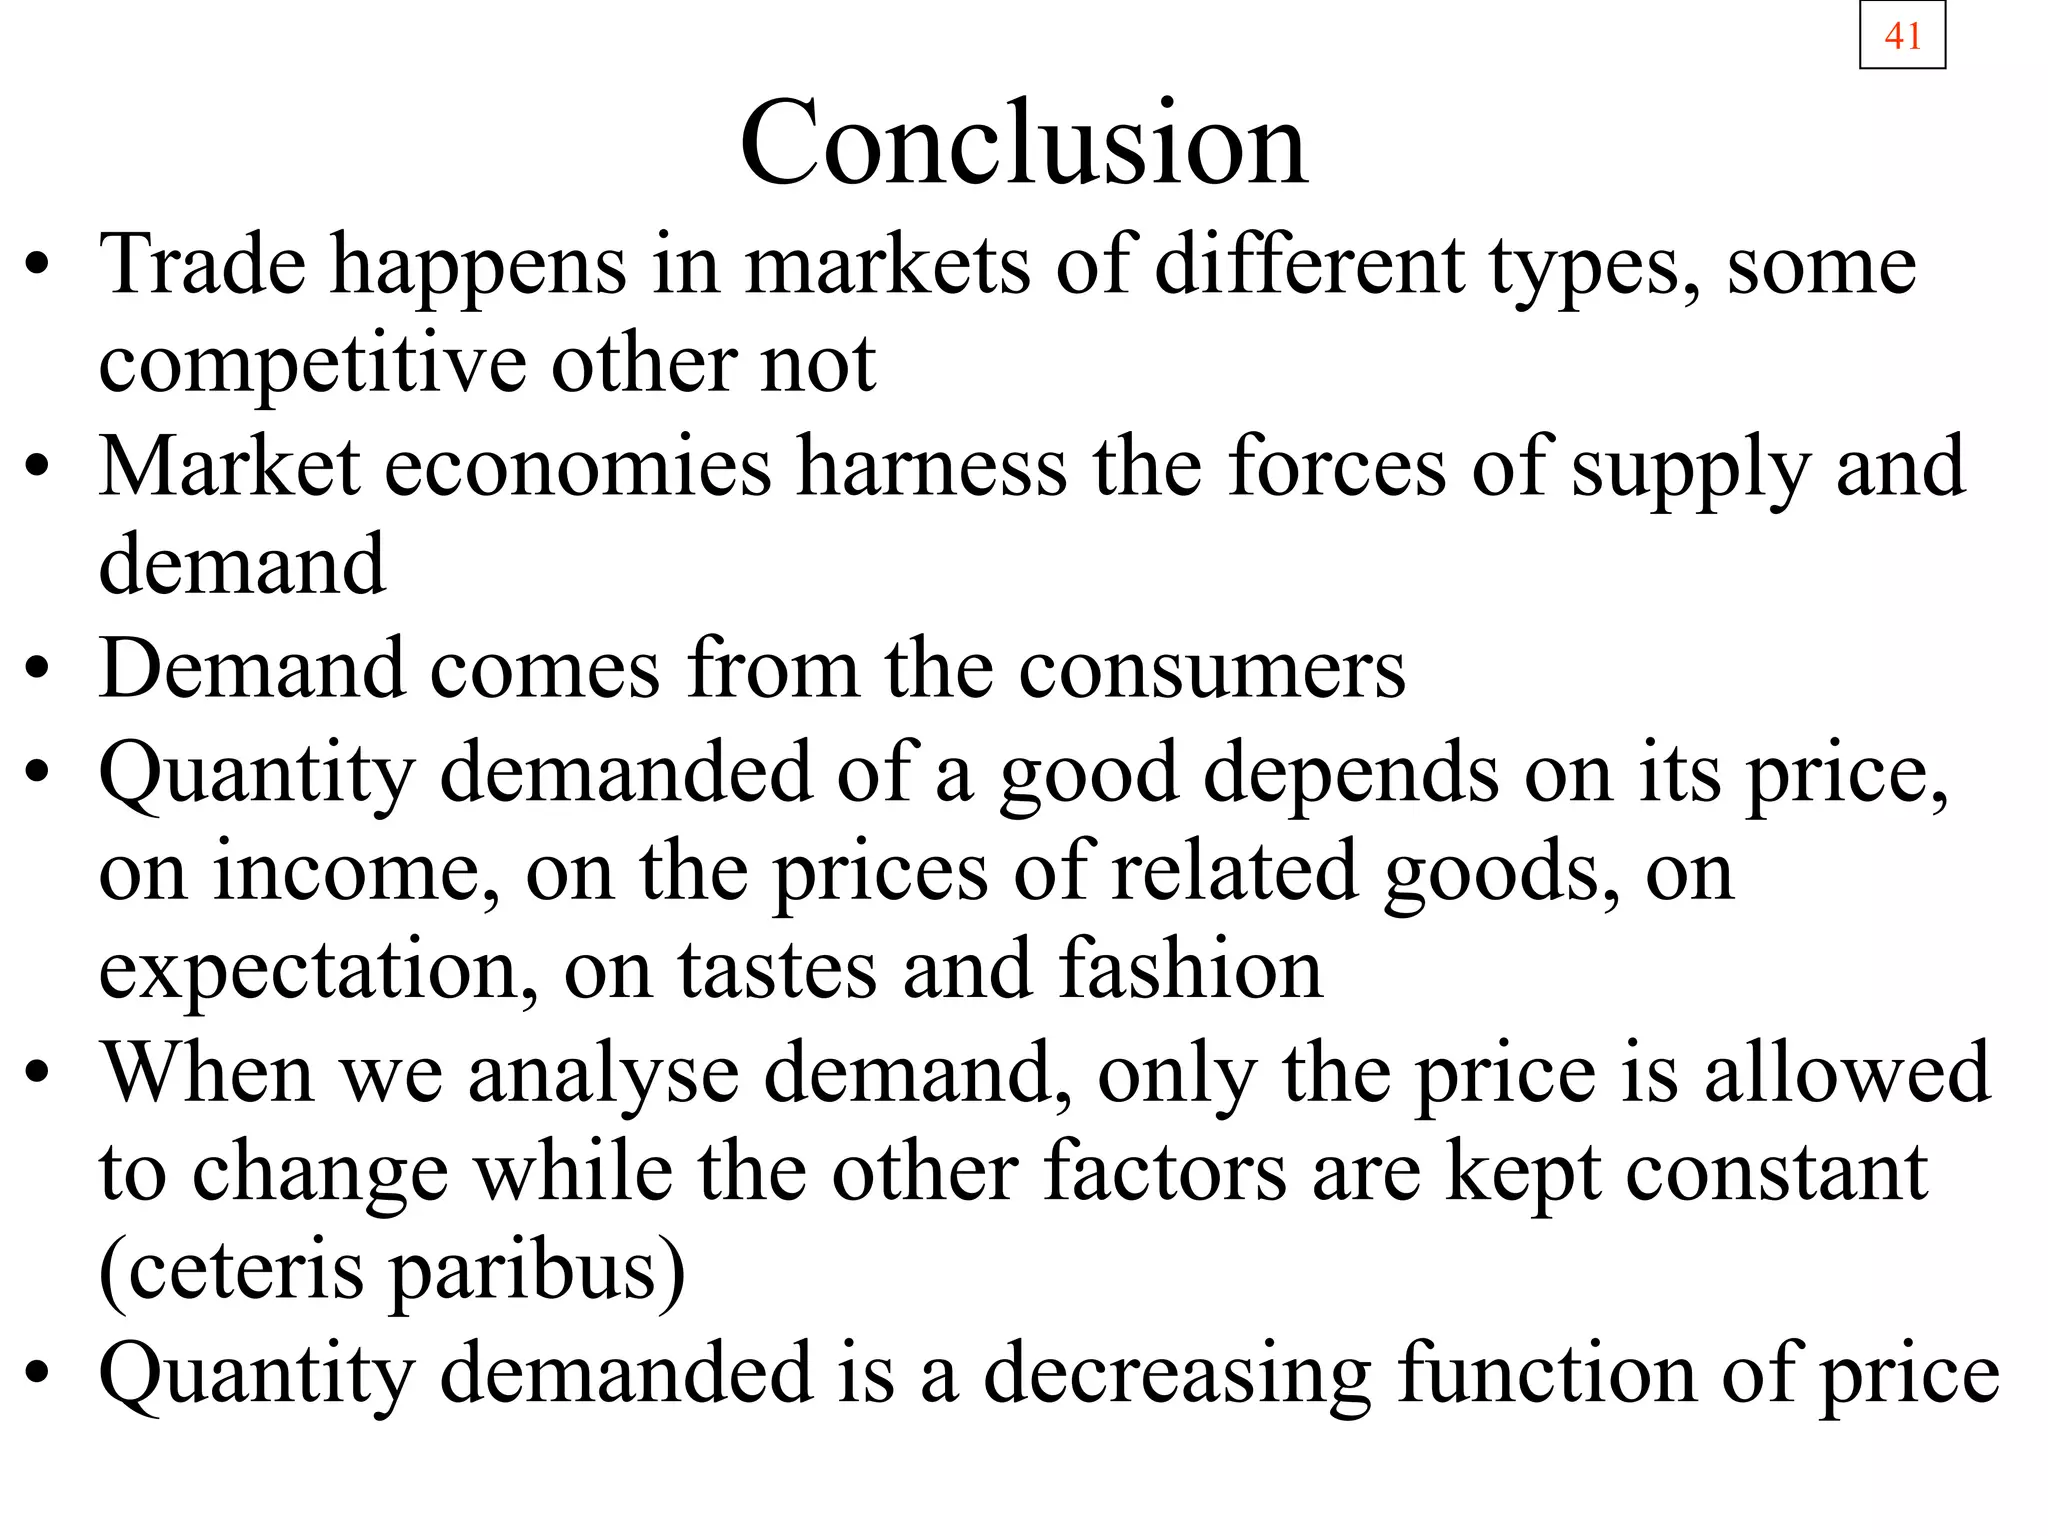
- The four types of markets and how supply and demand determine price and quantity in competitive markets.
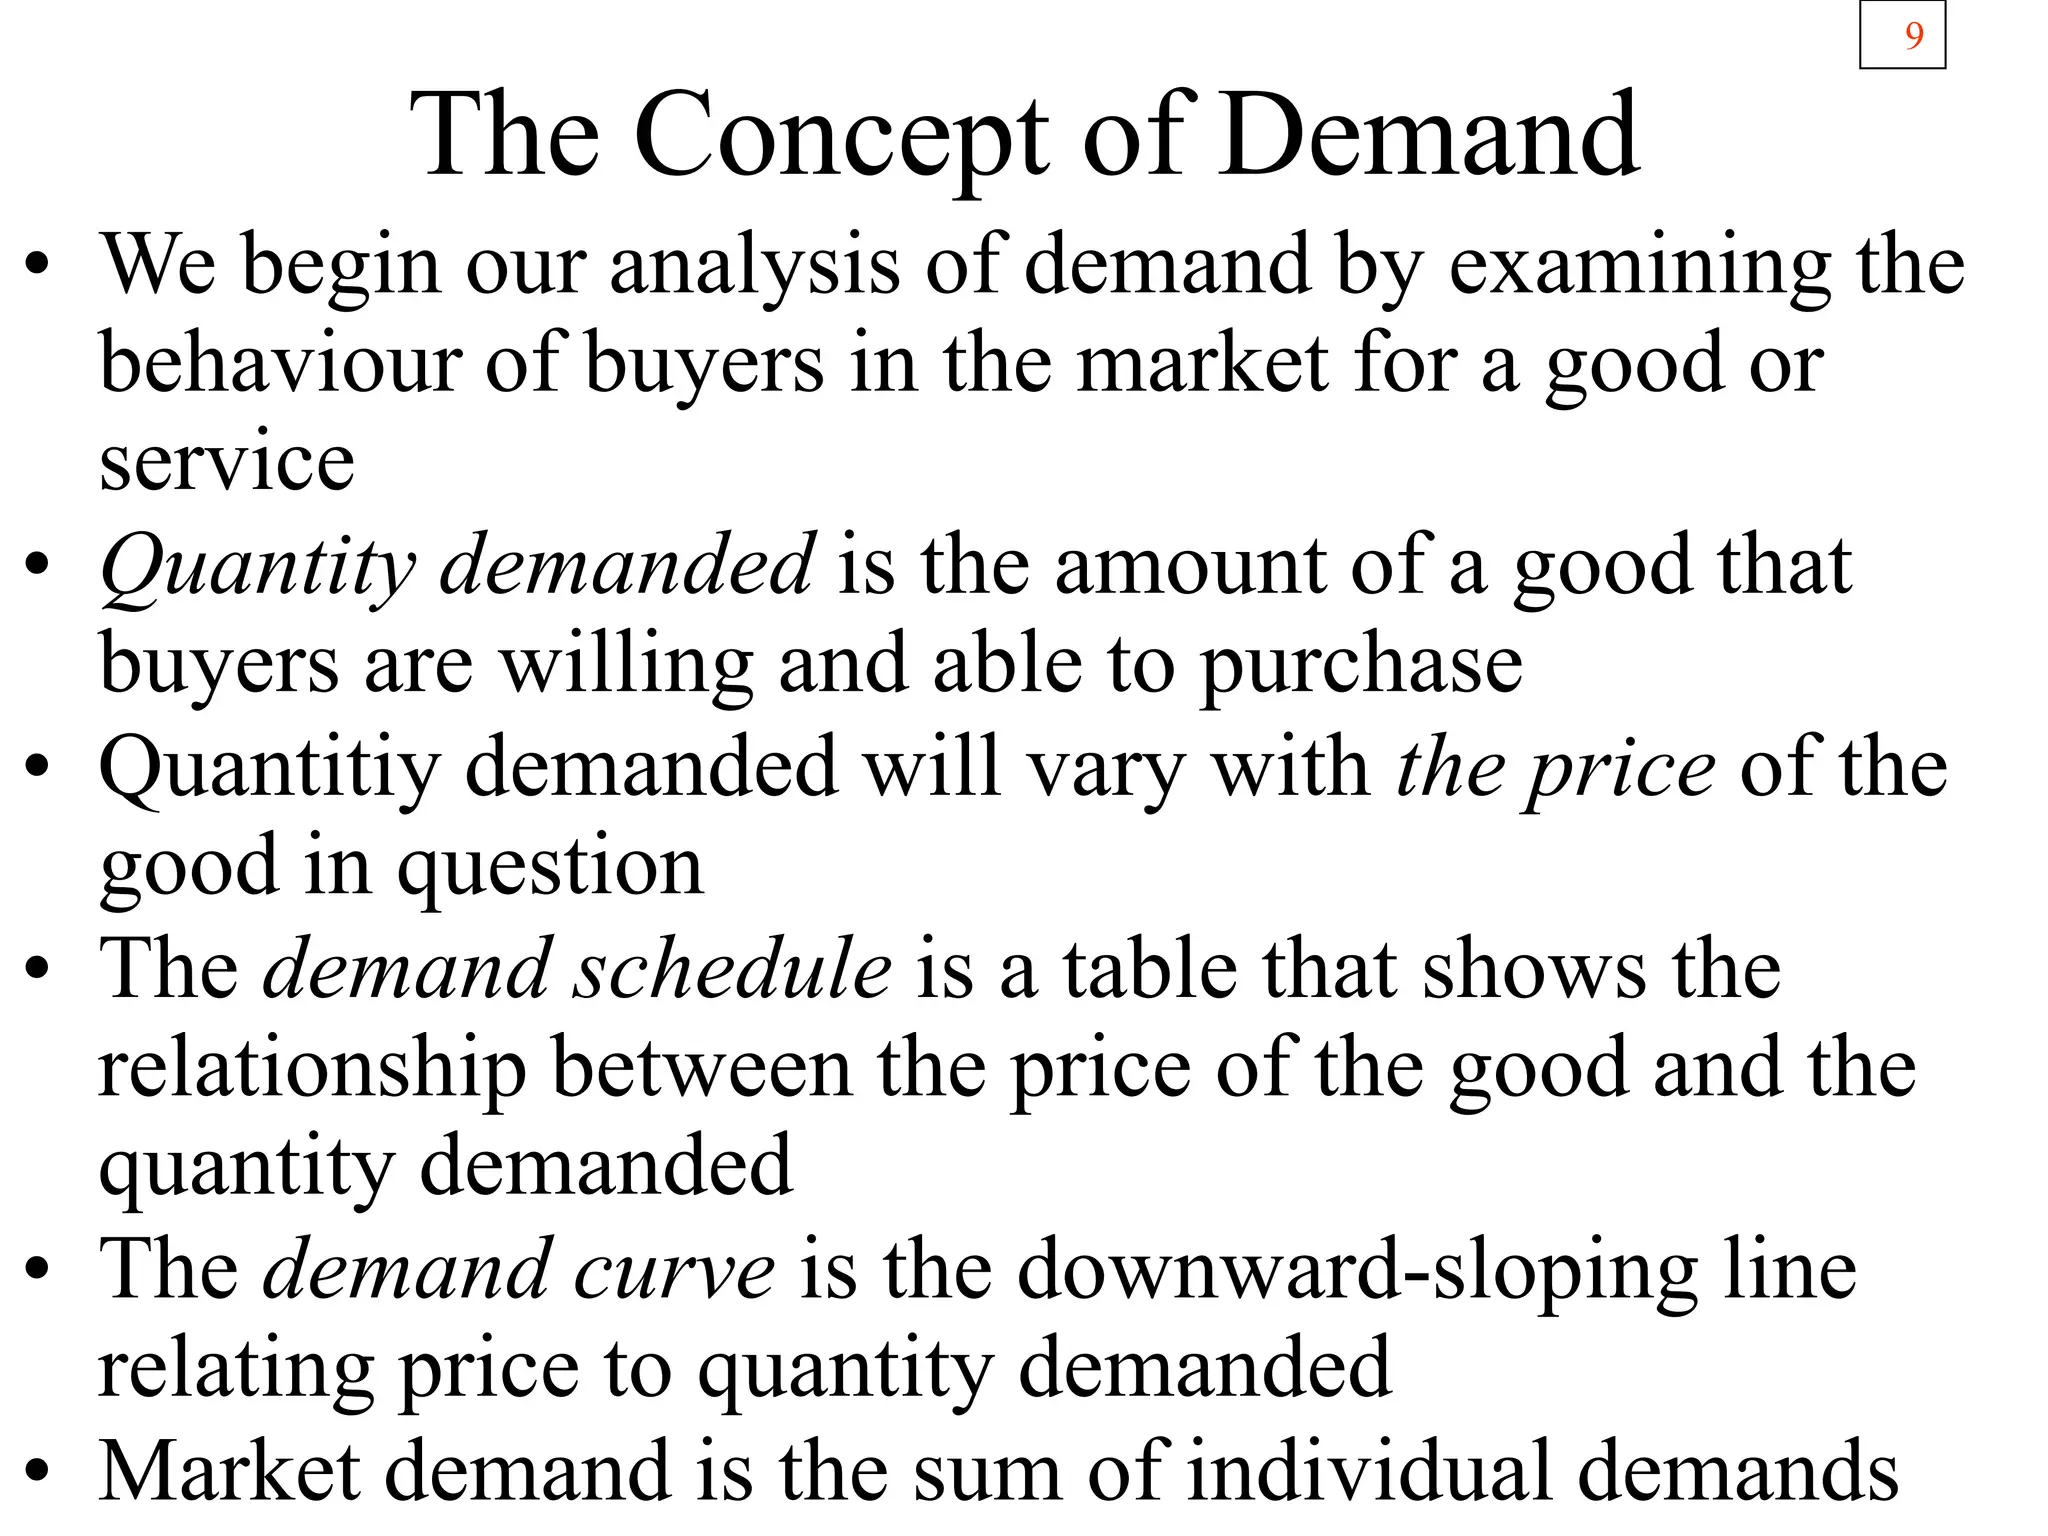
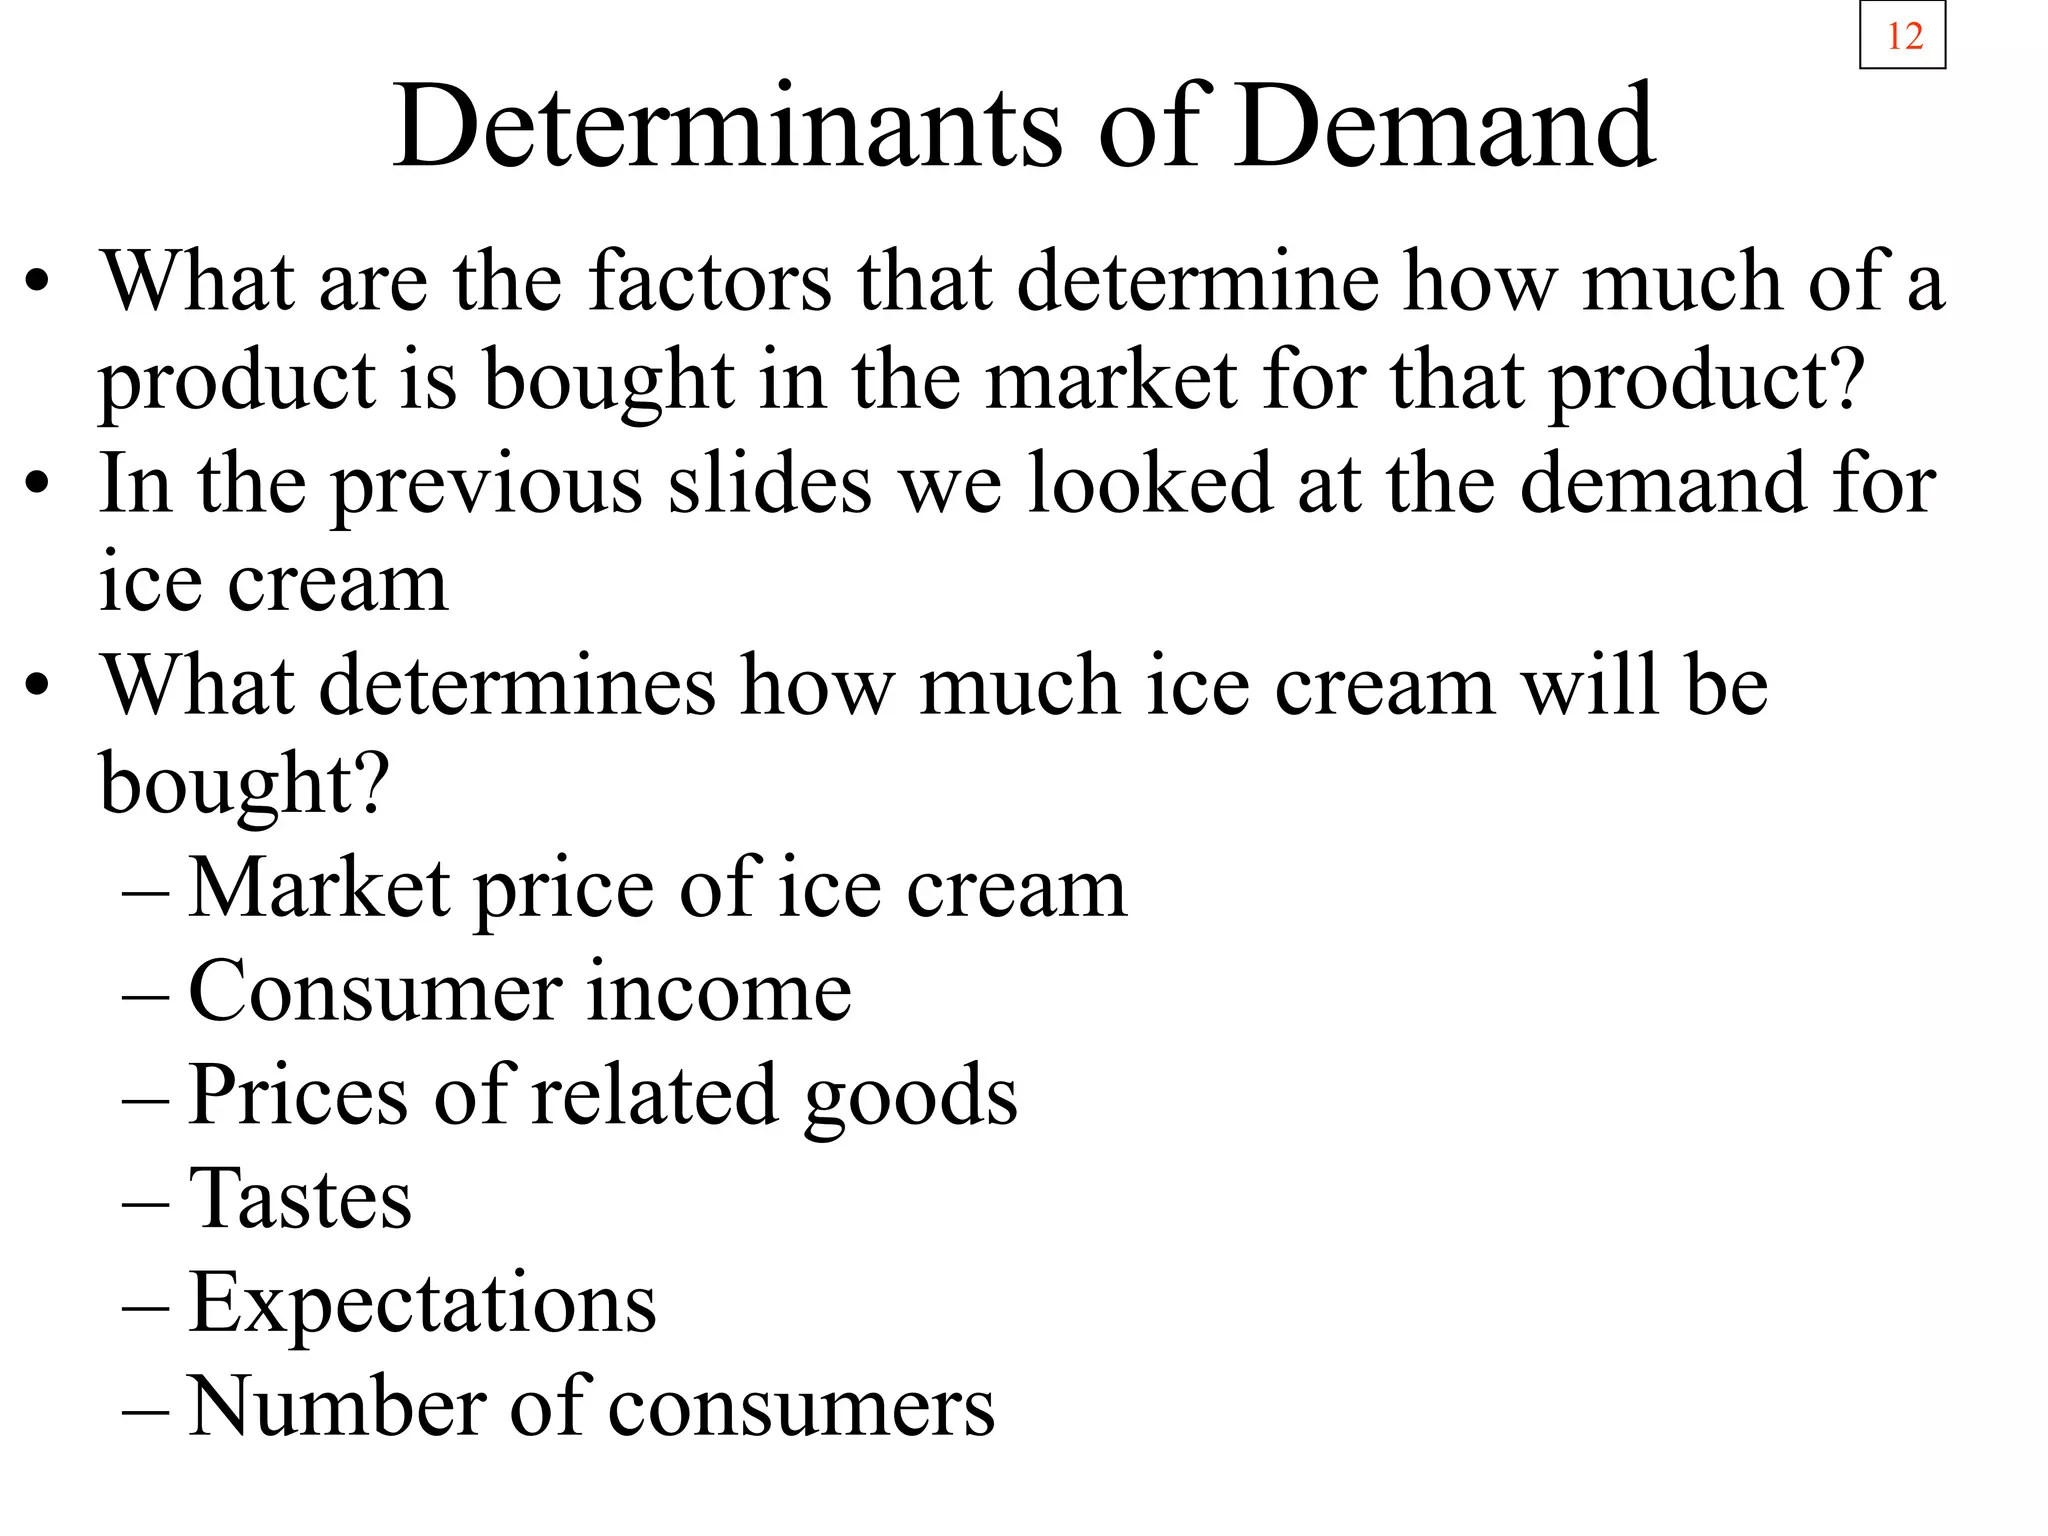
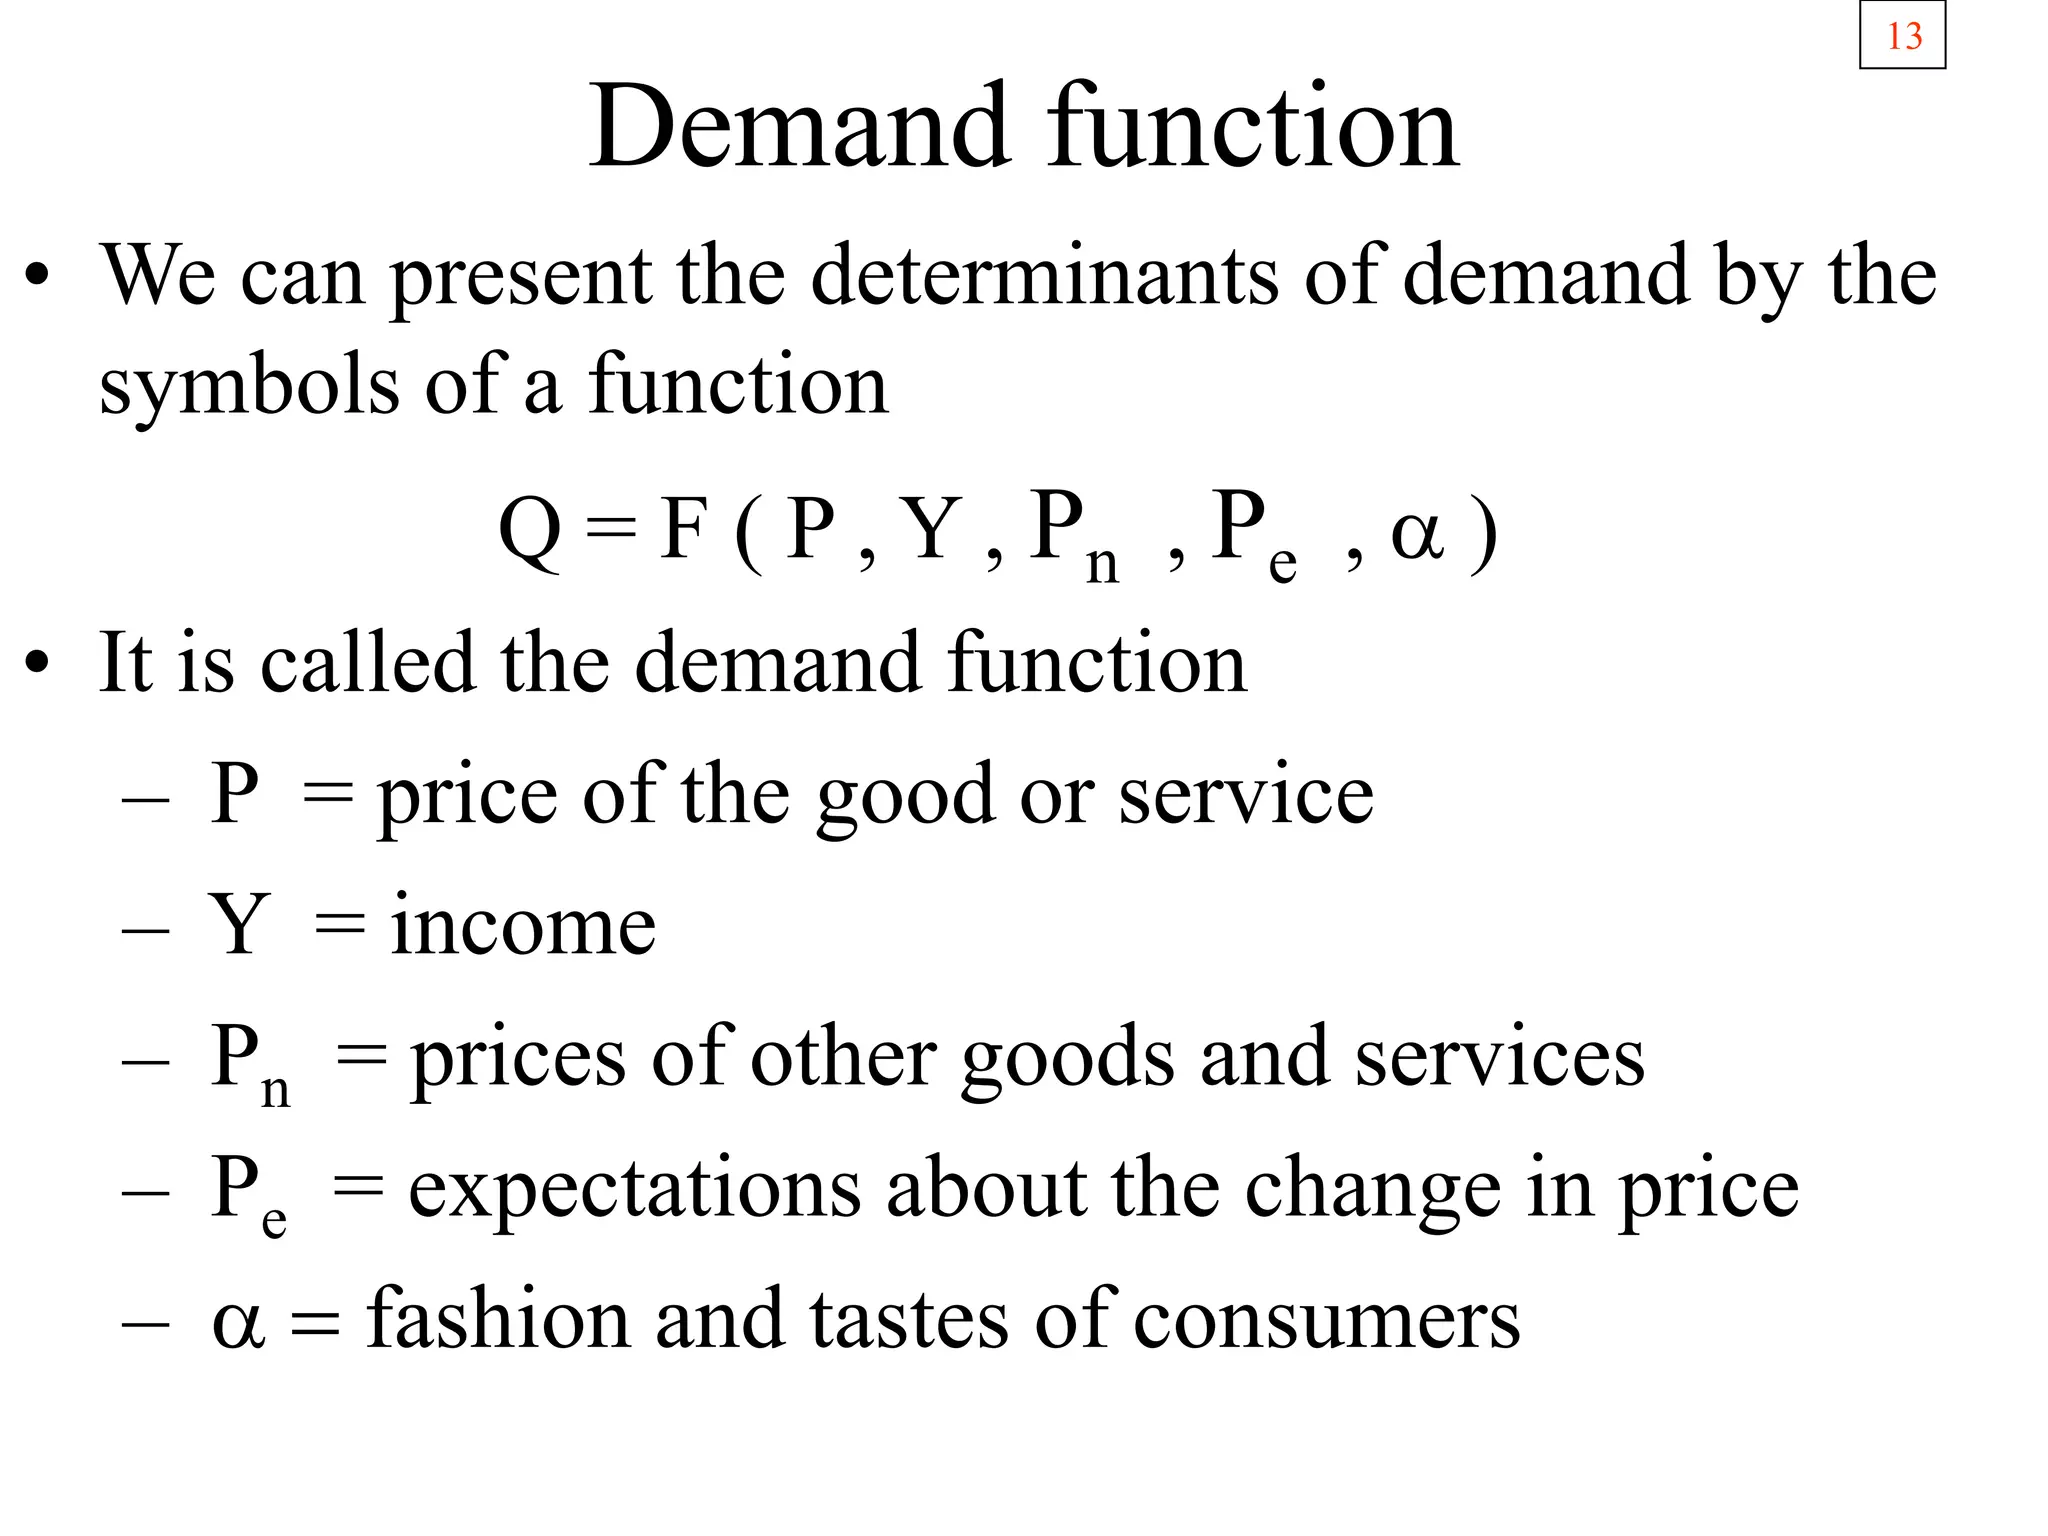
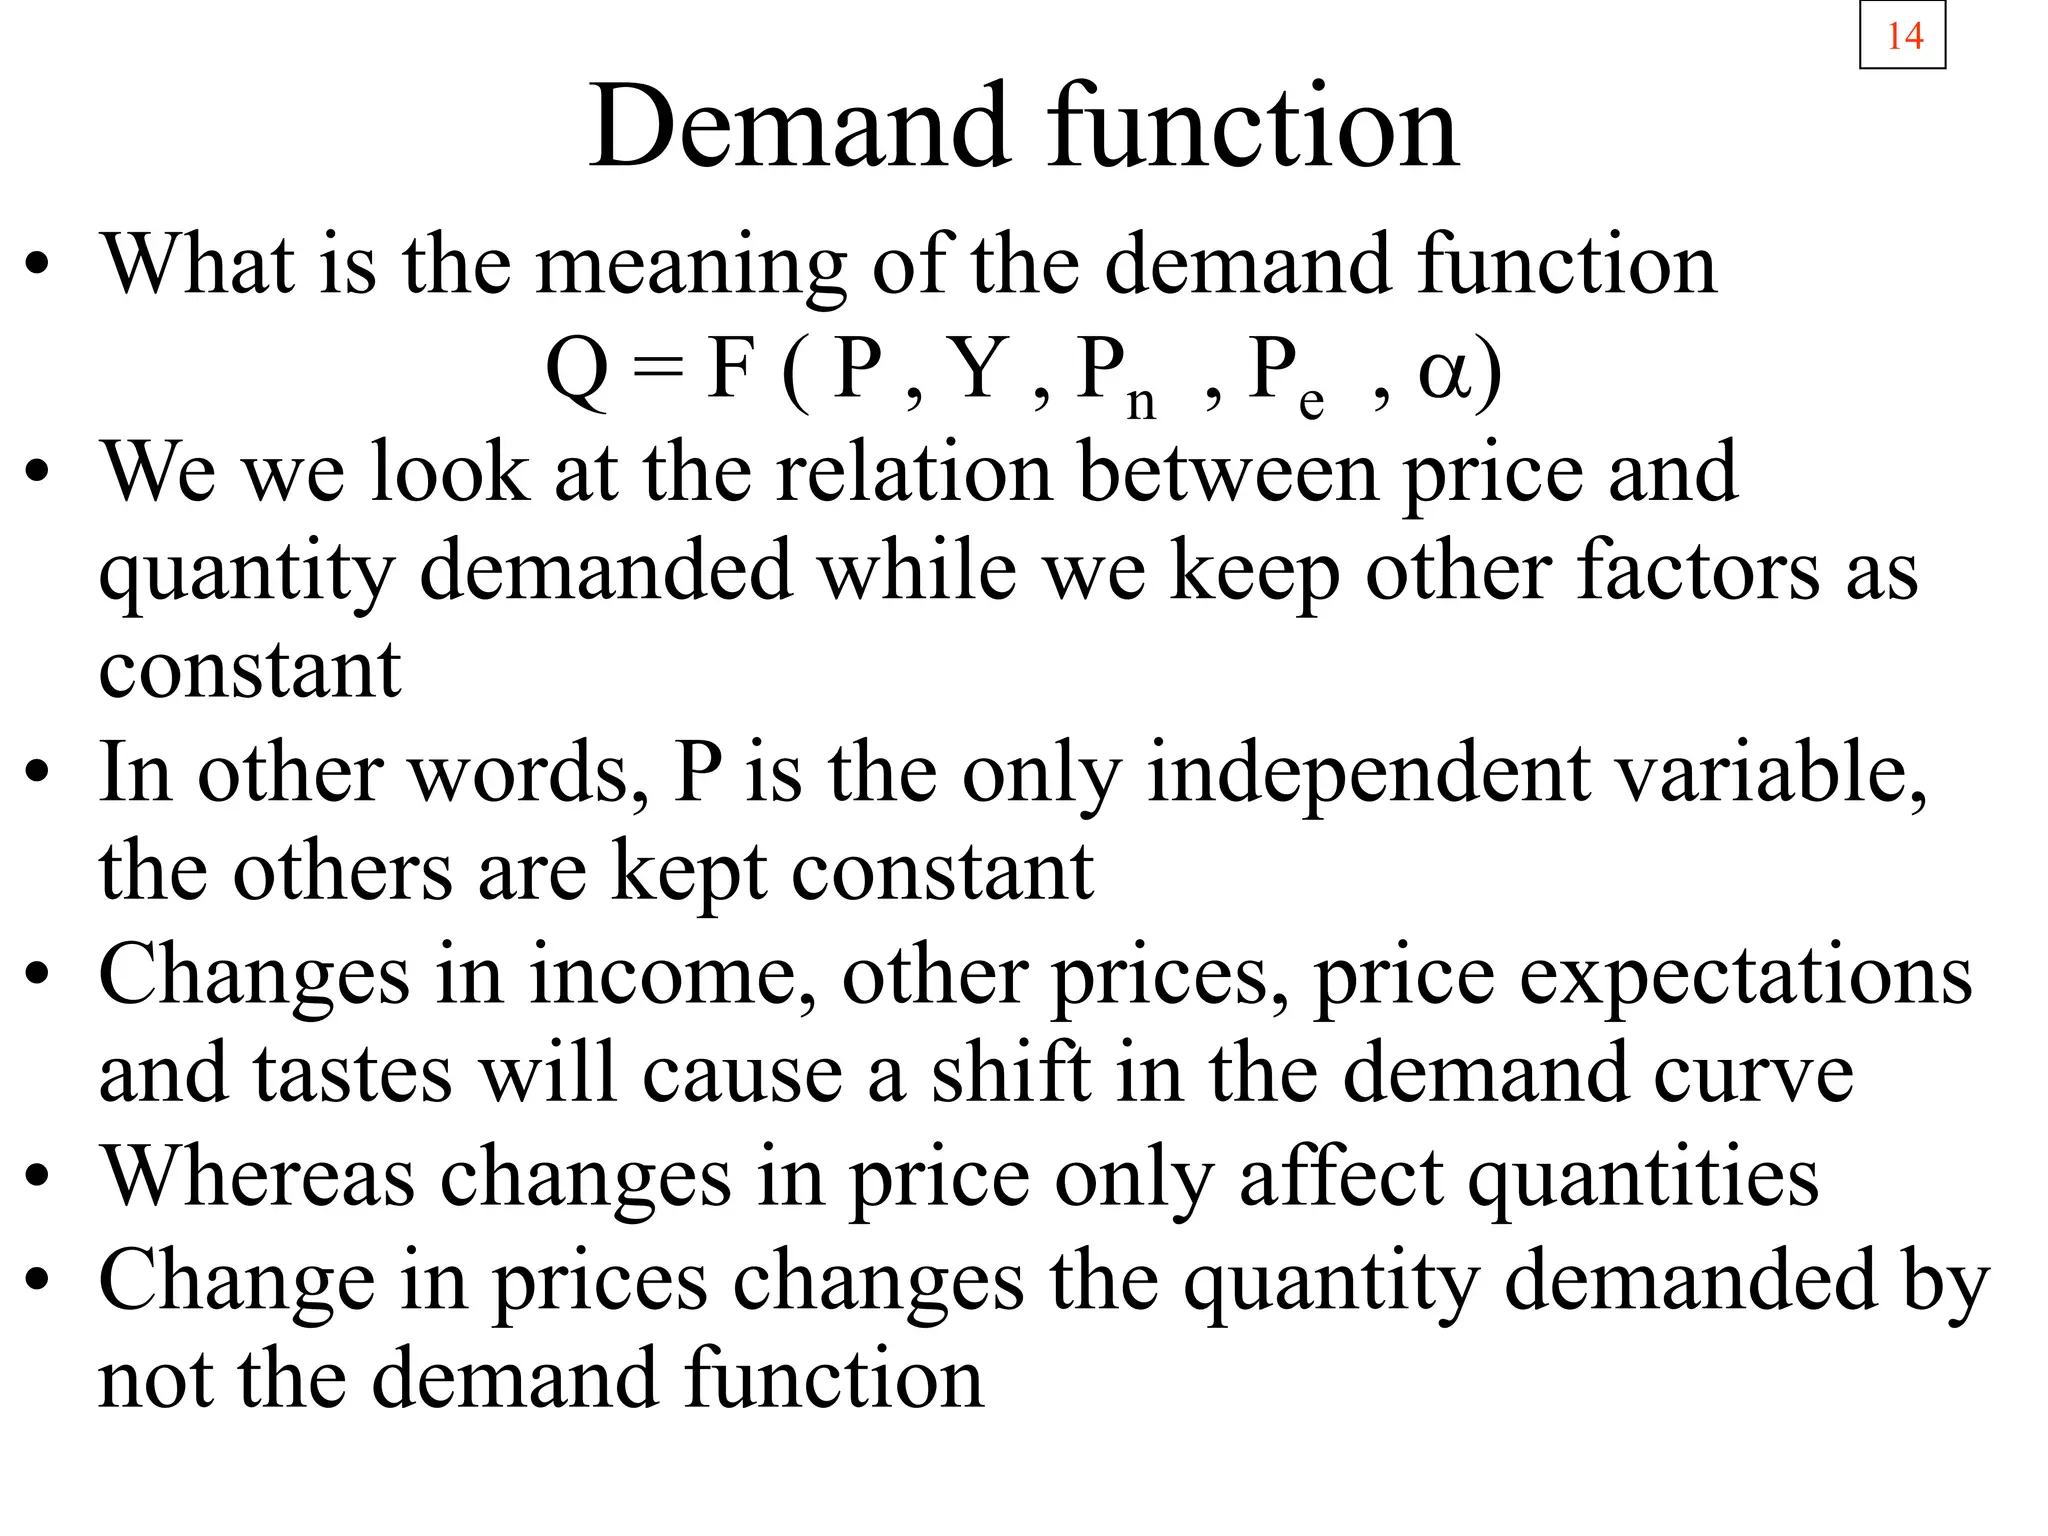
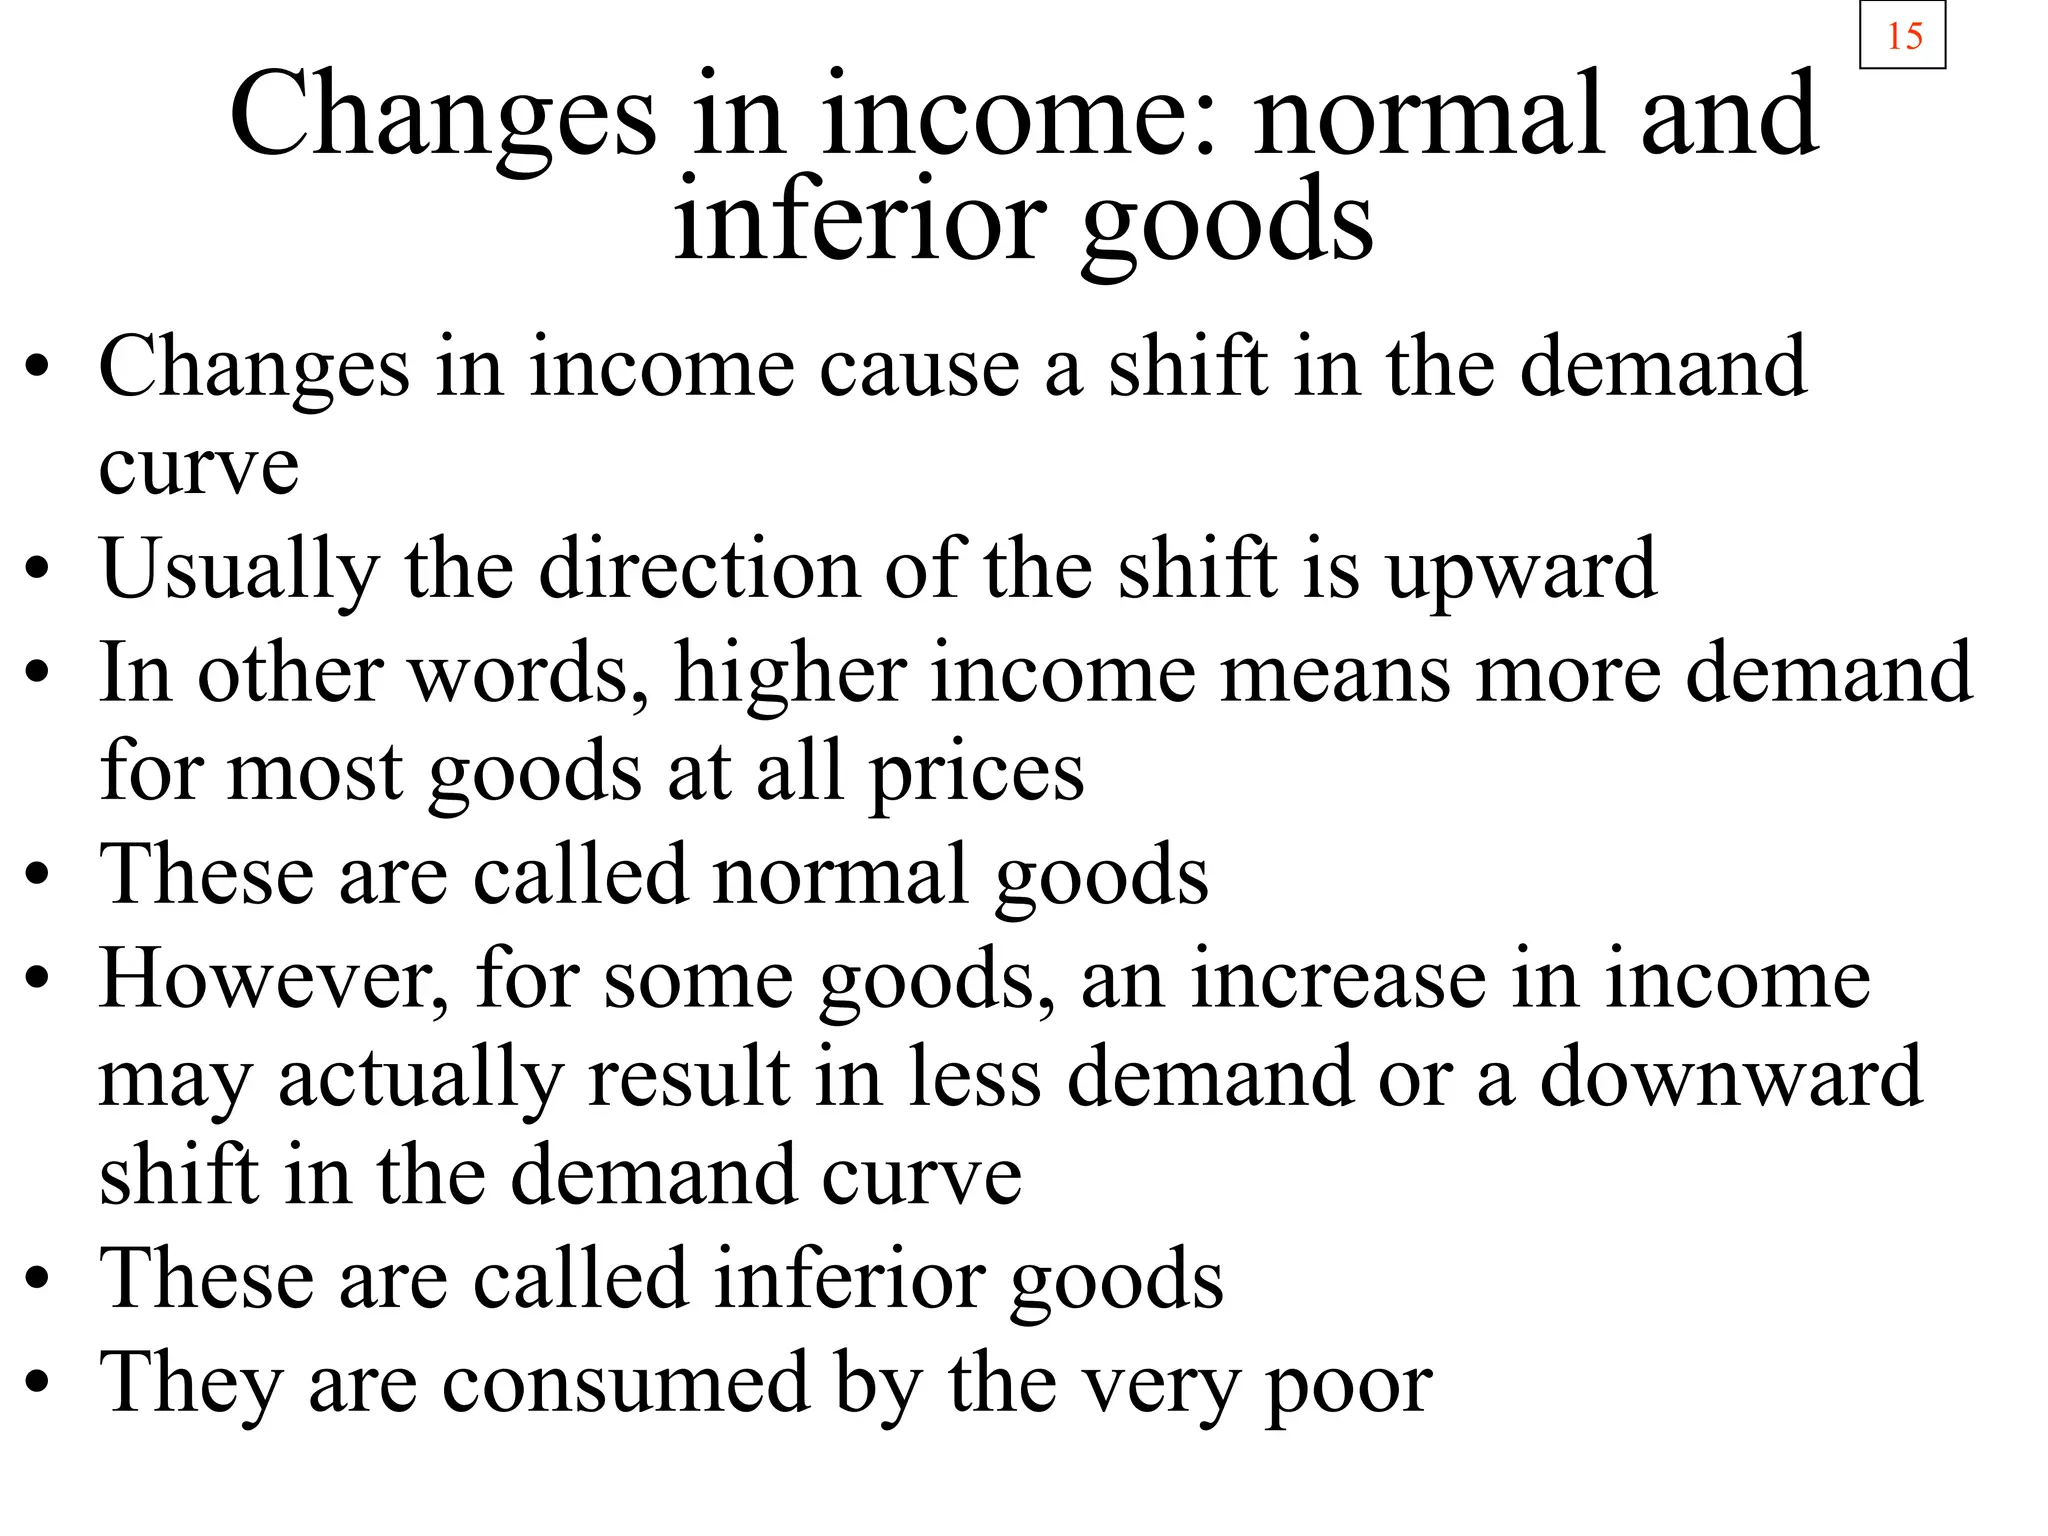
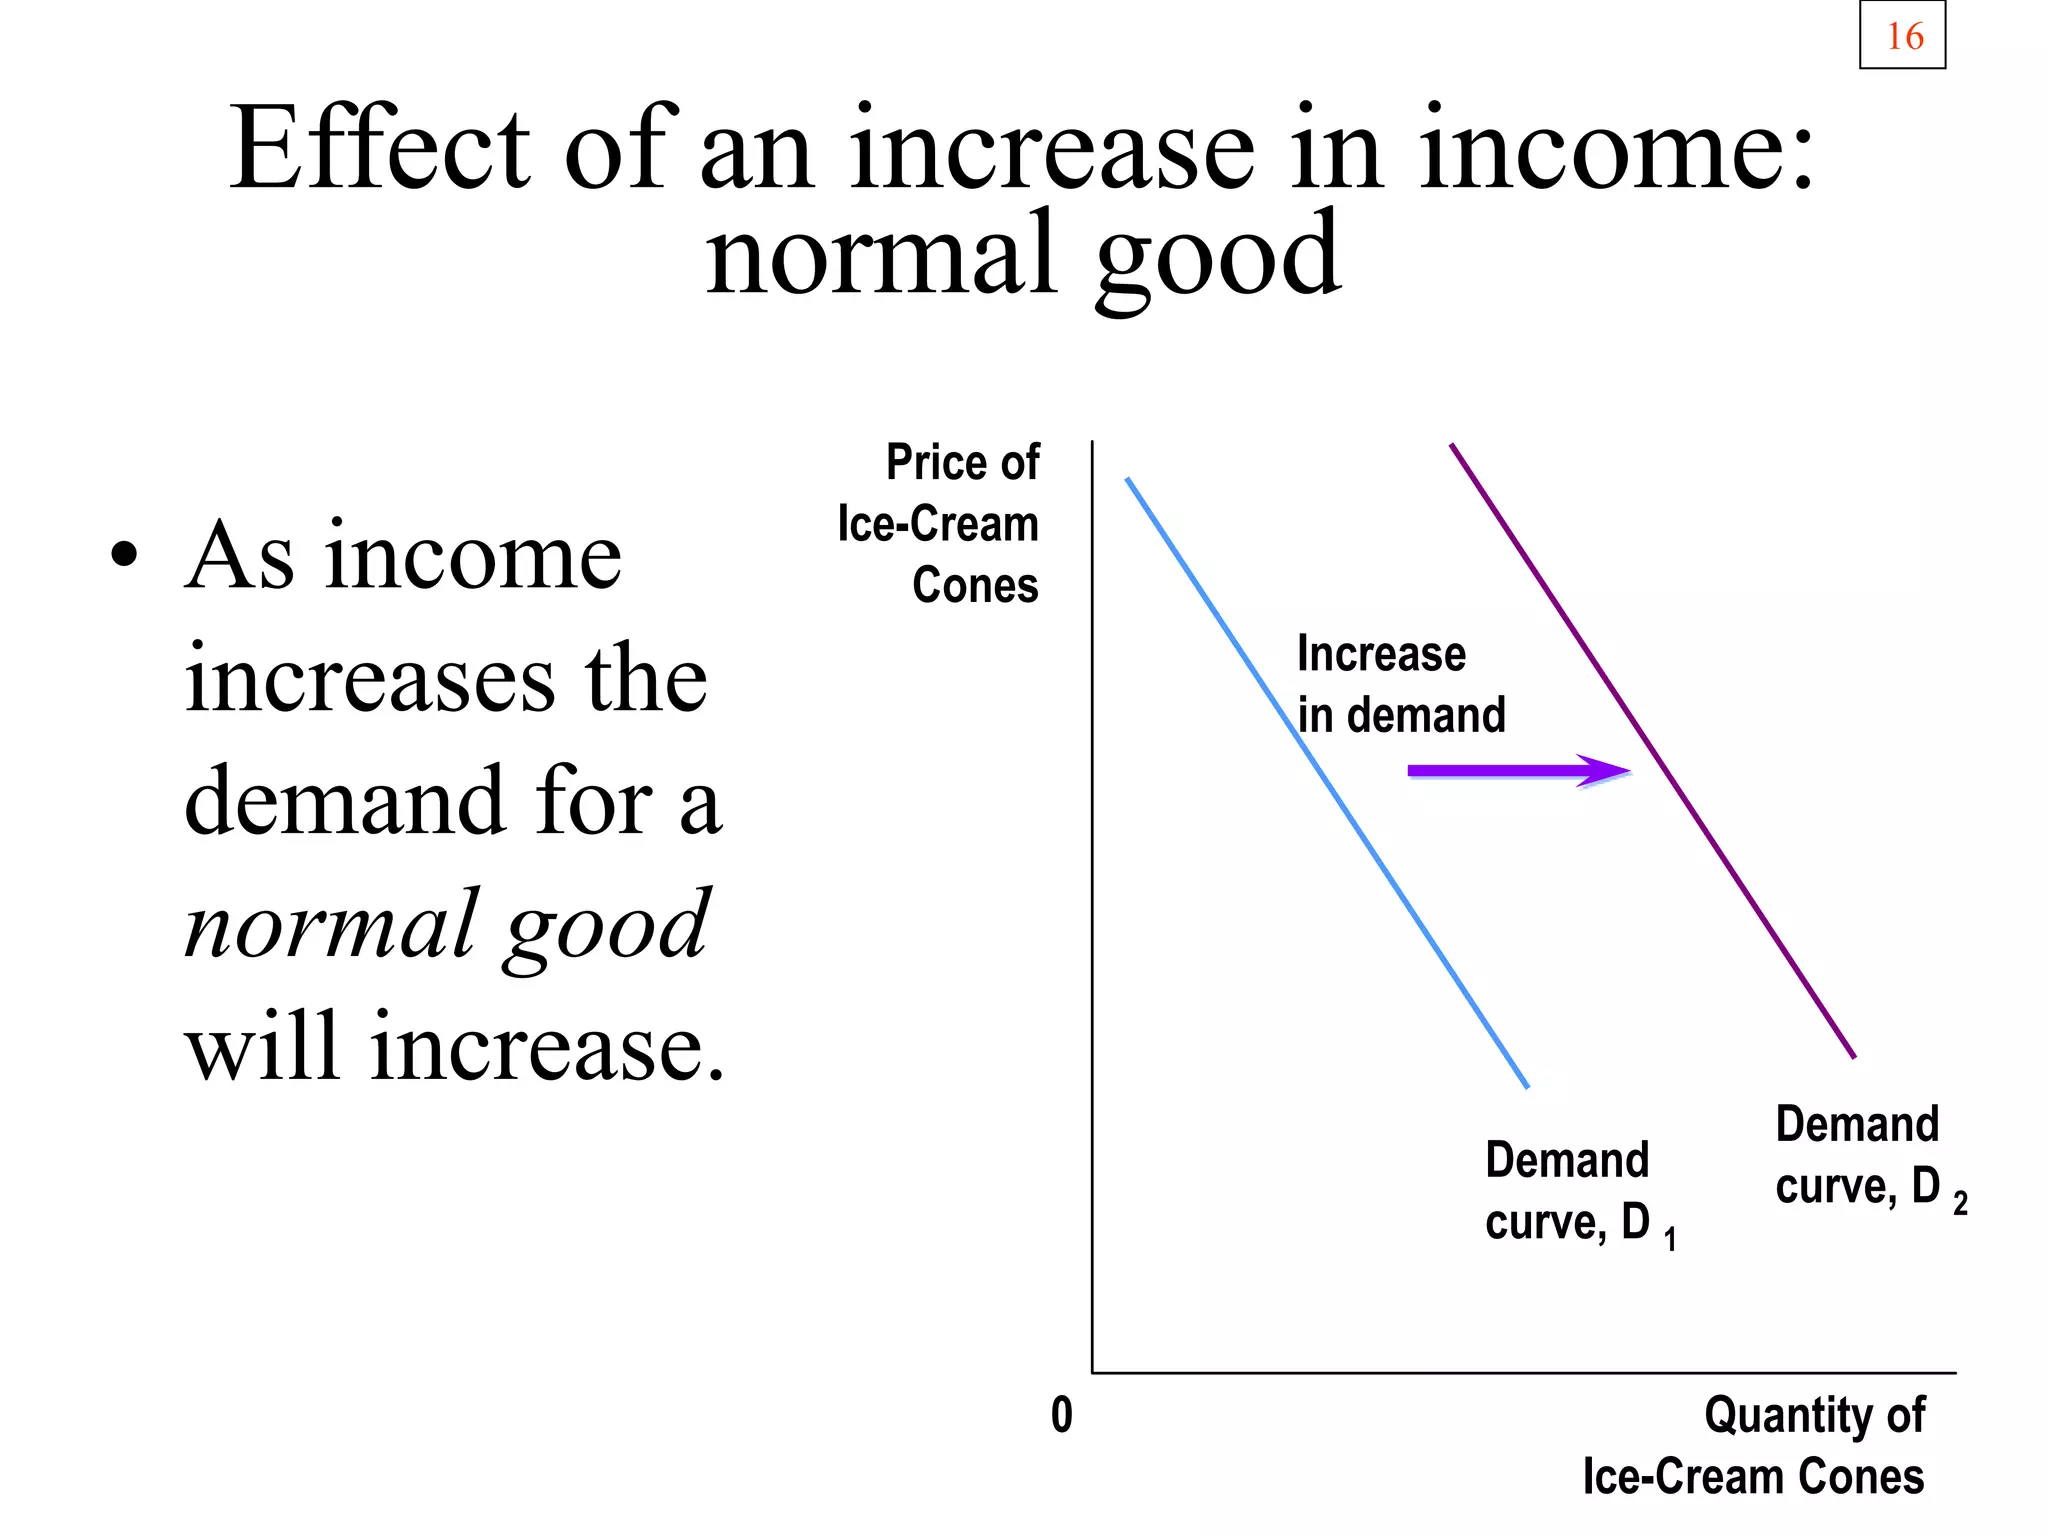
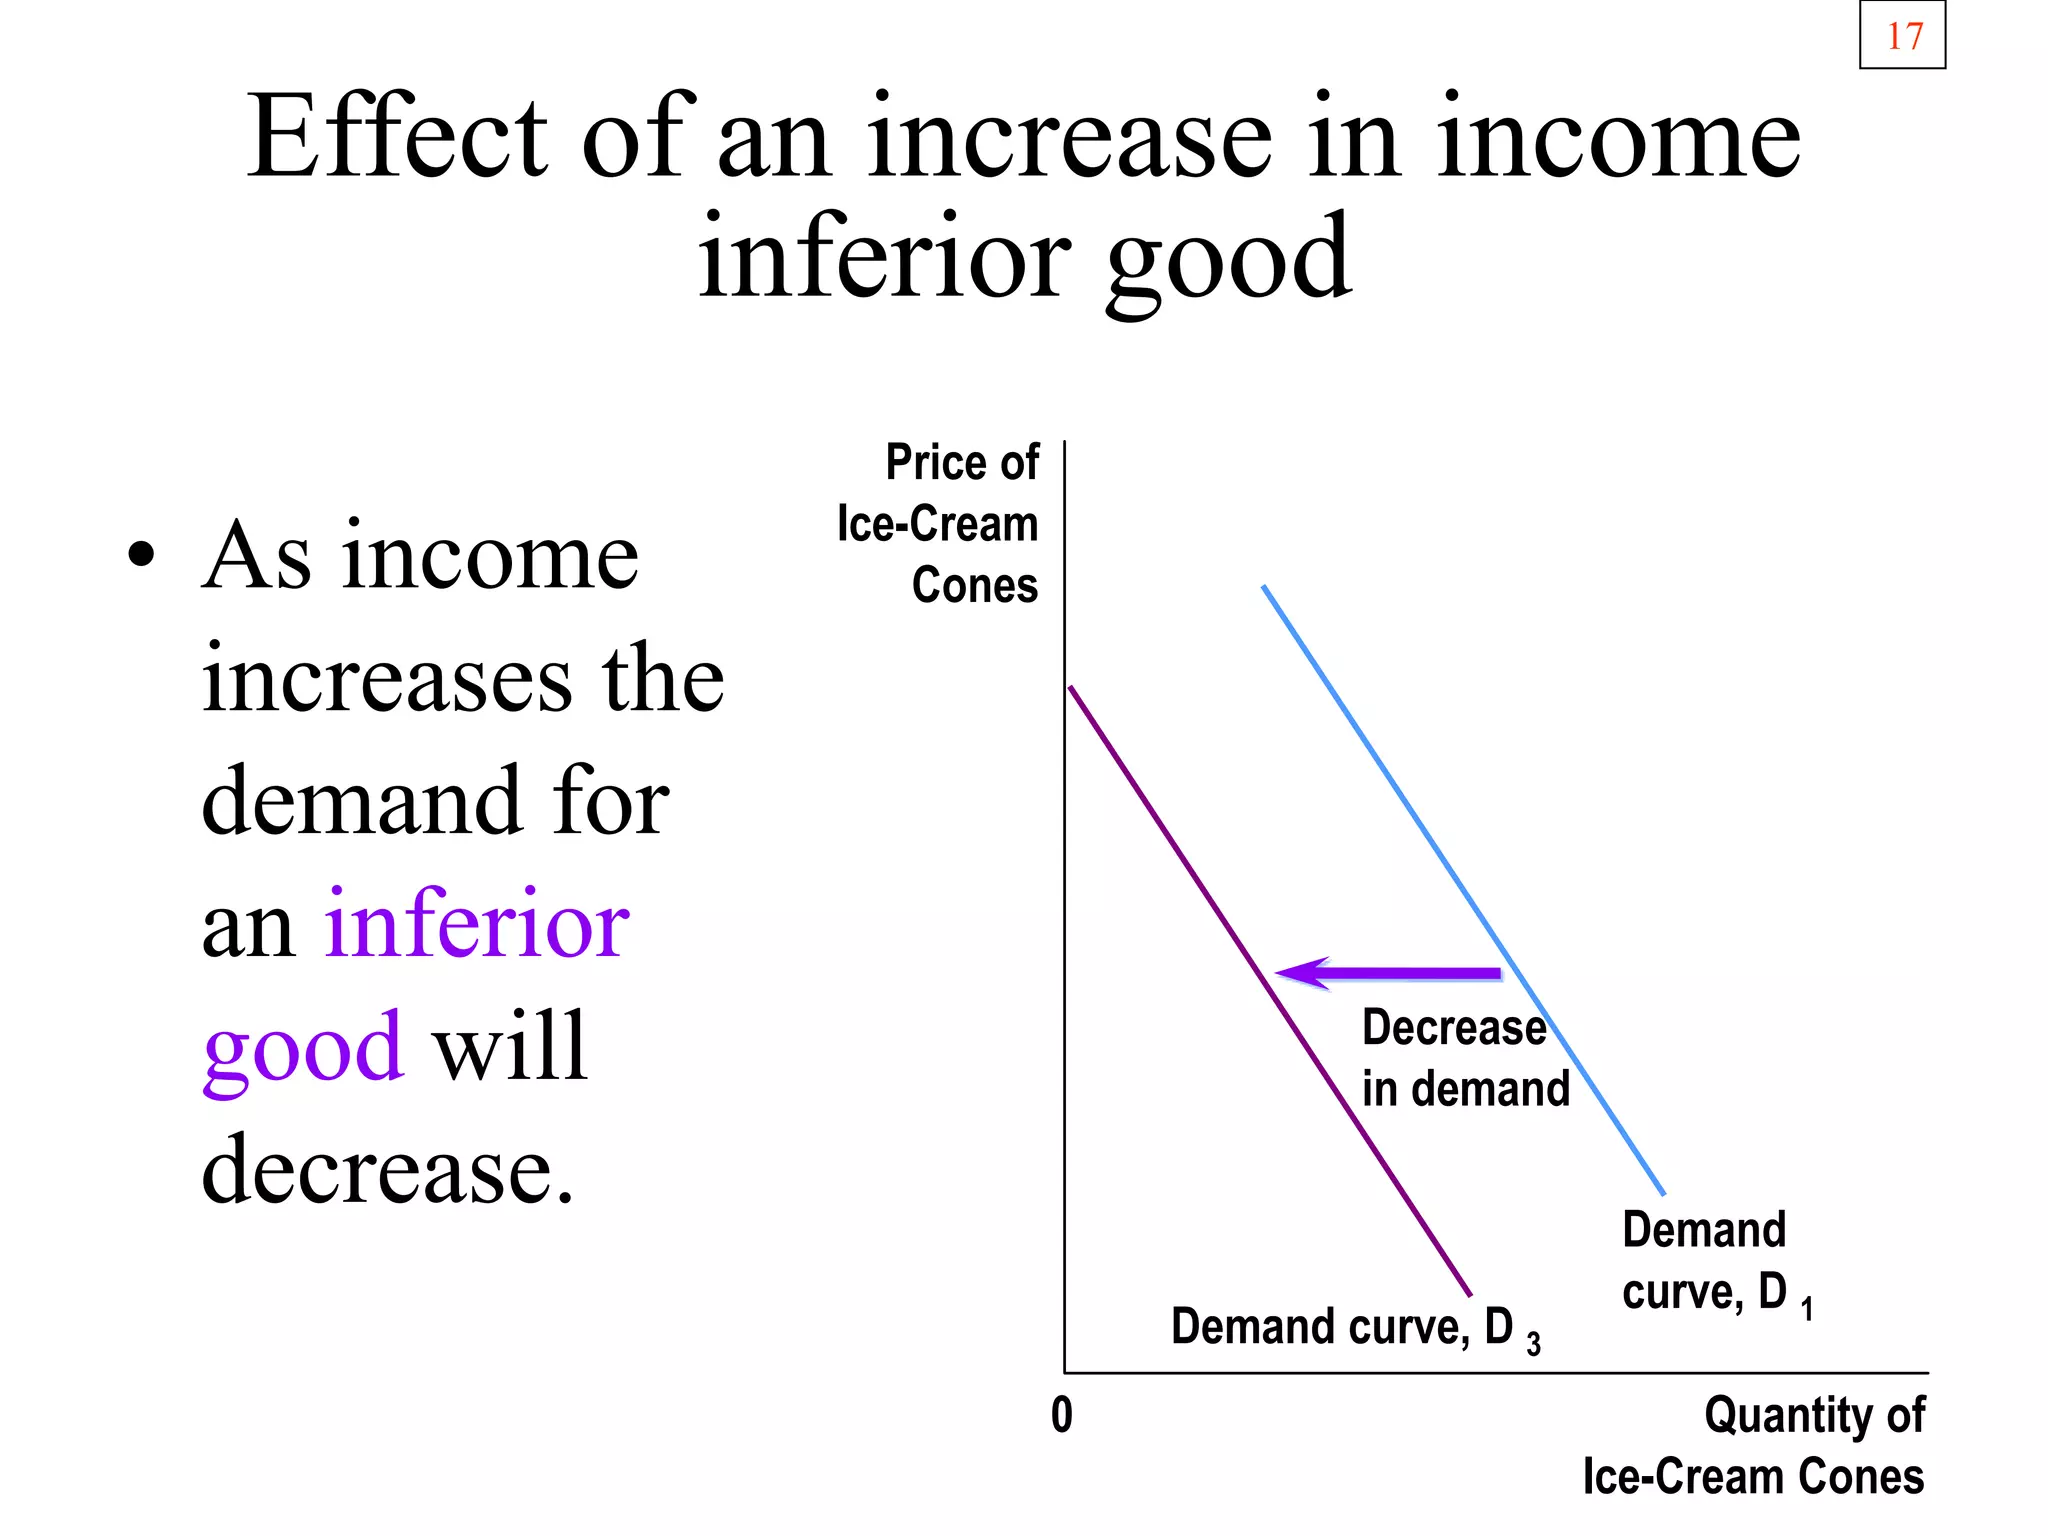
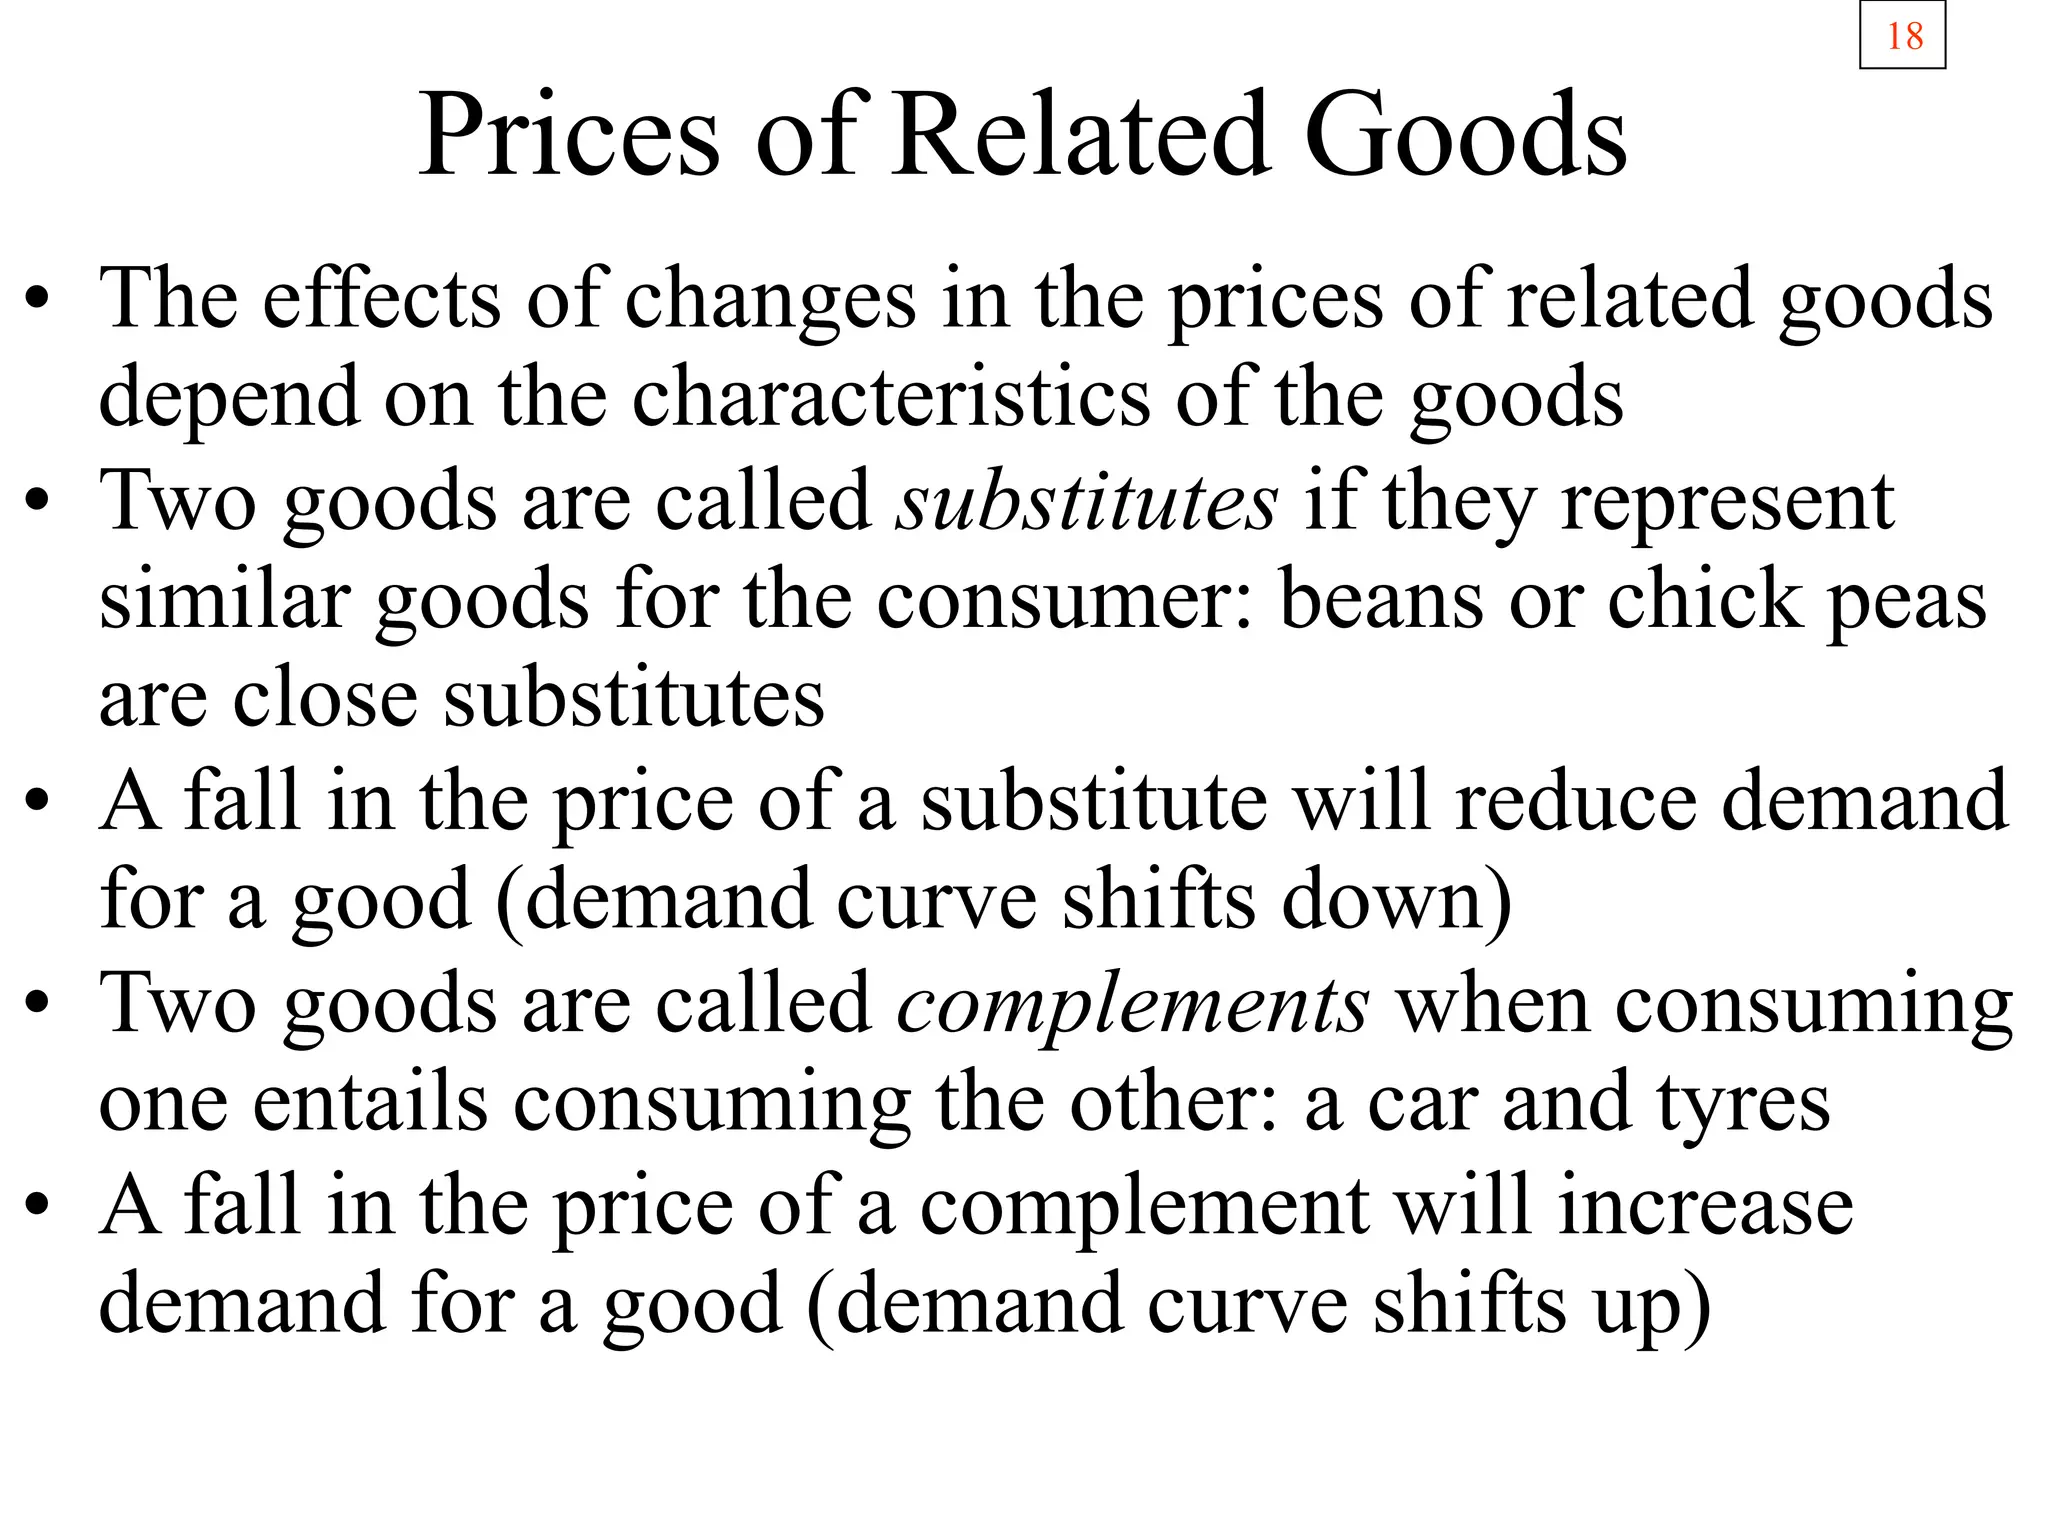
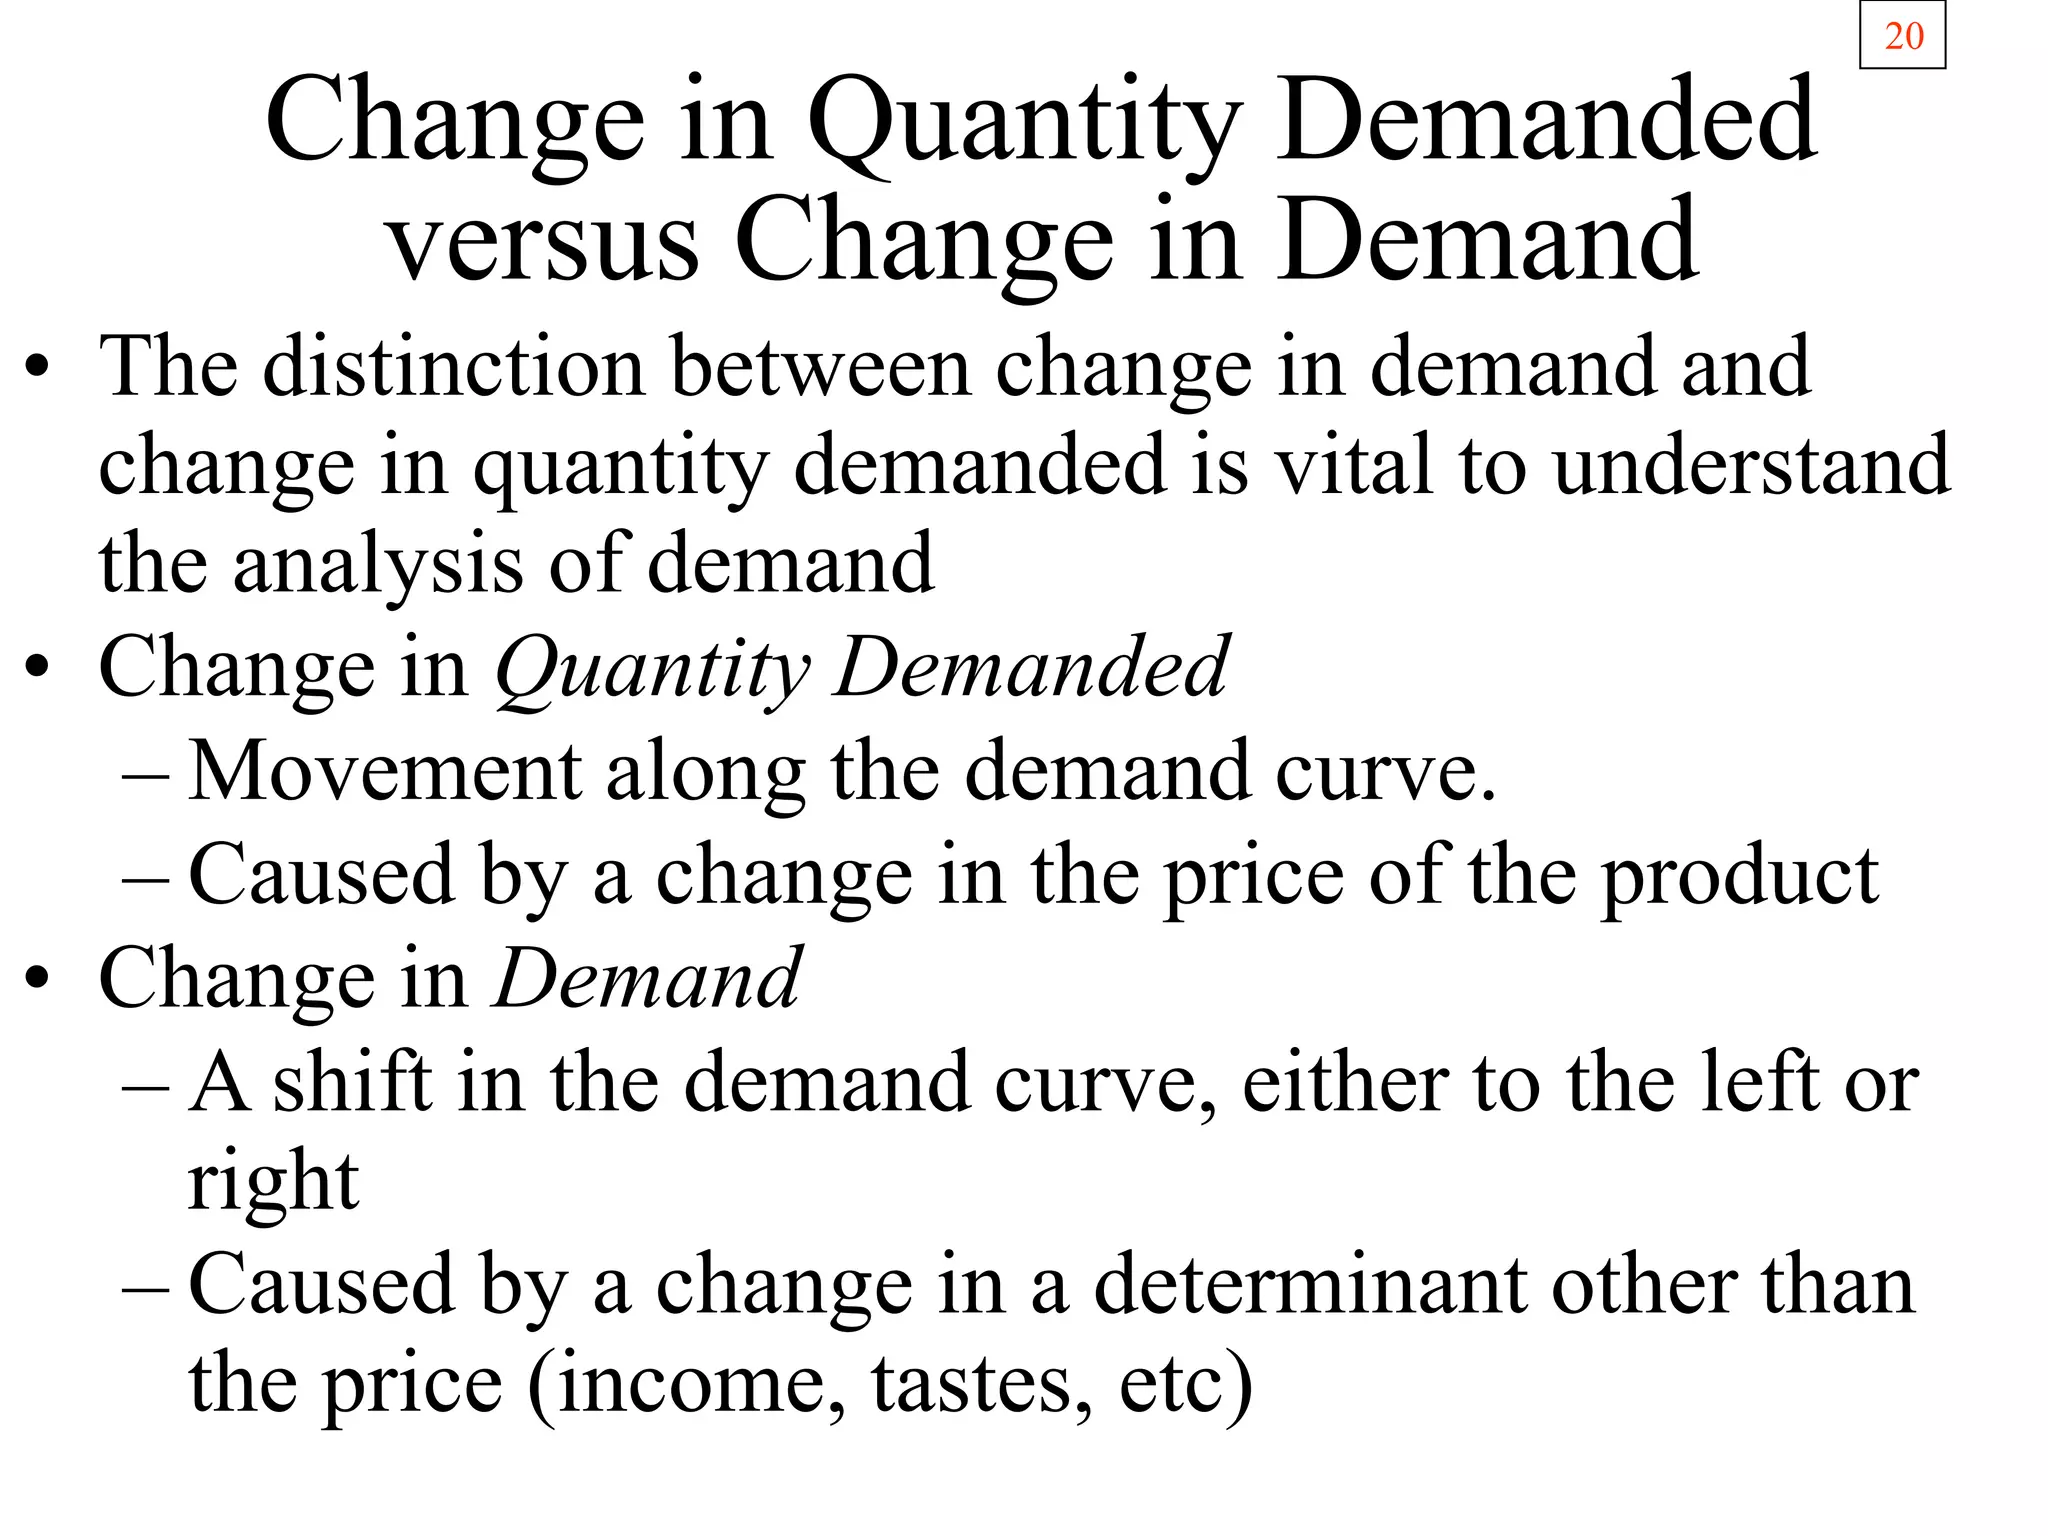
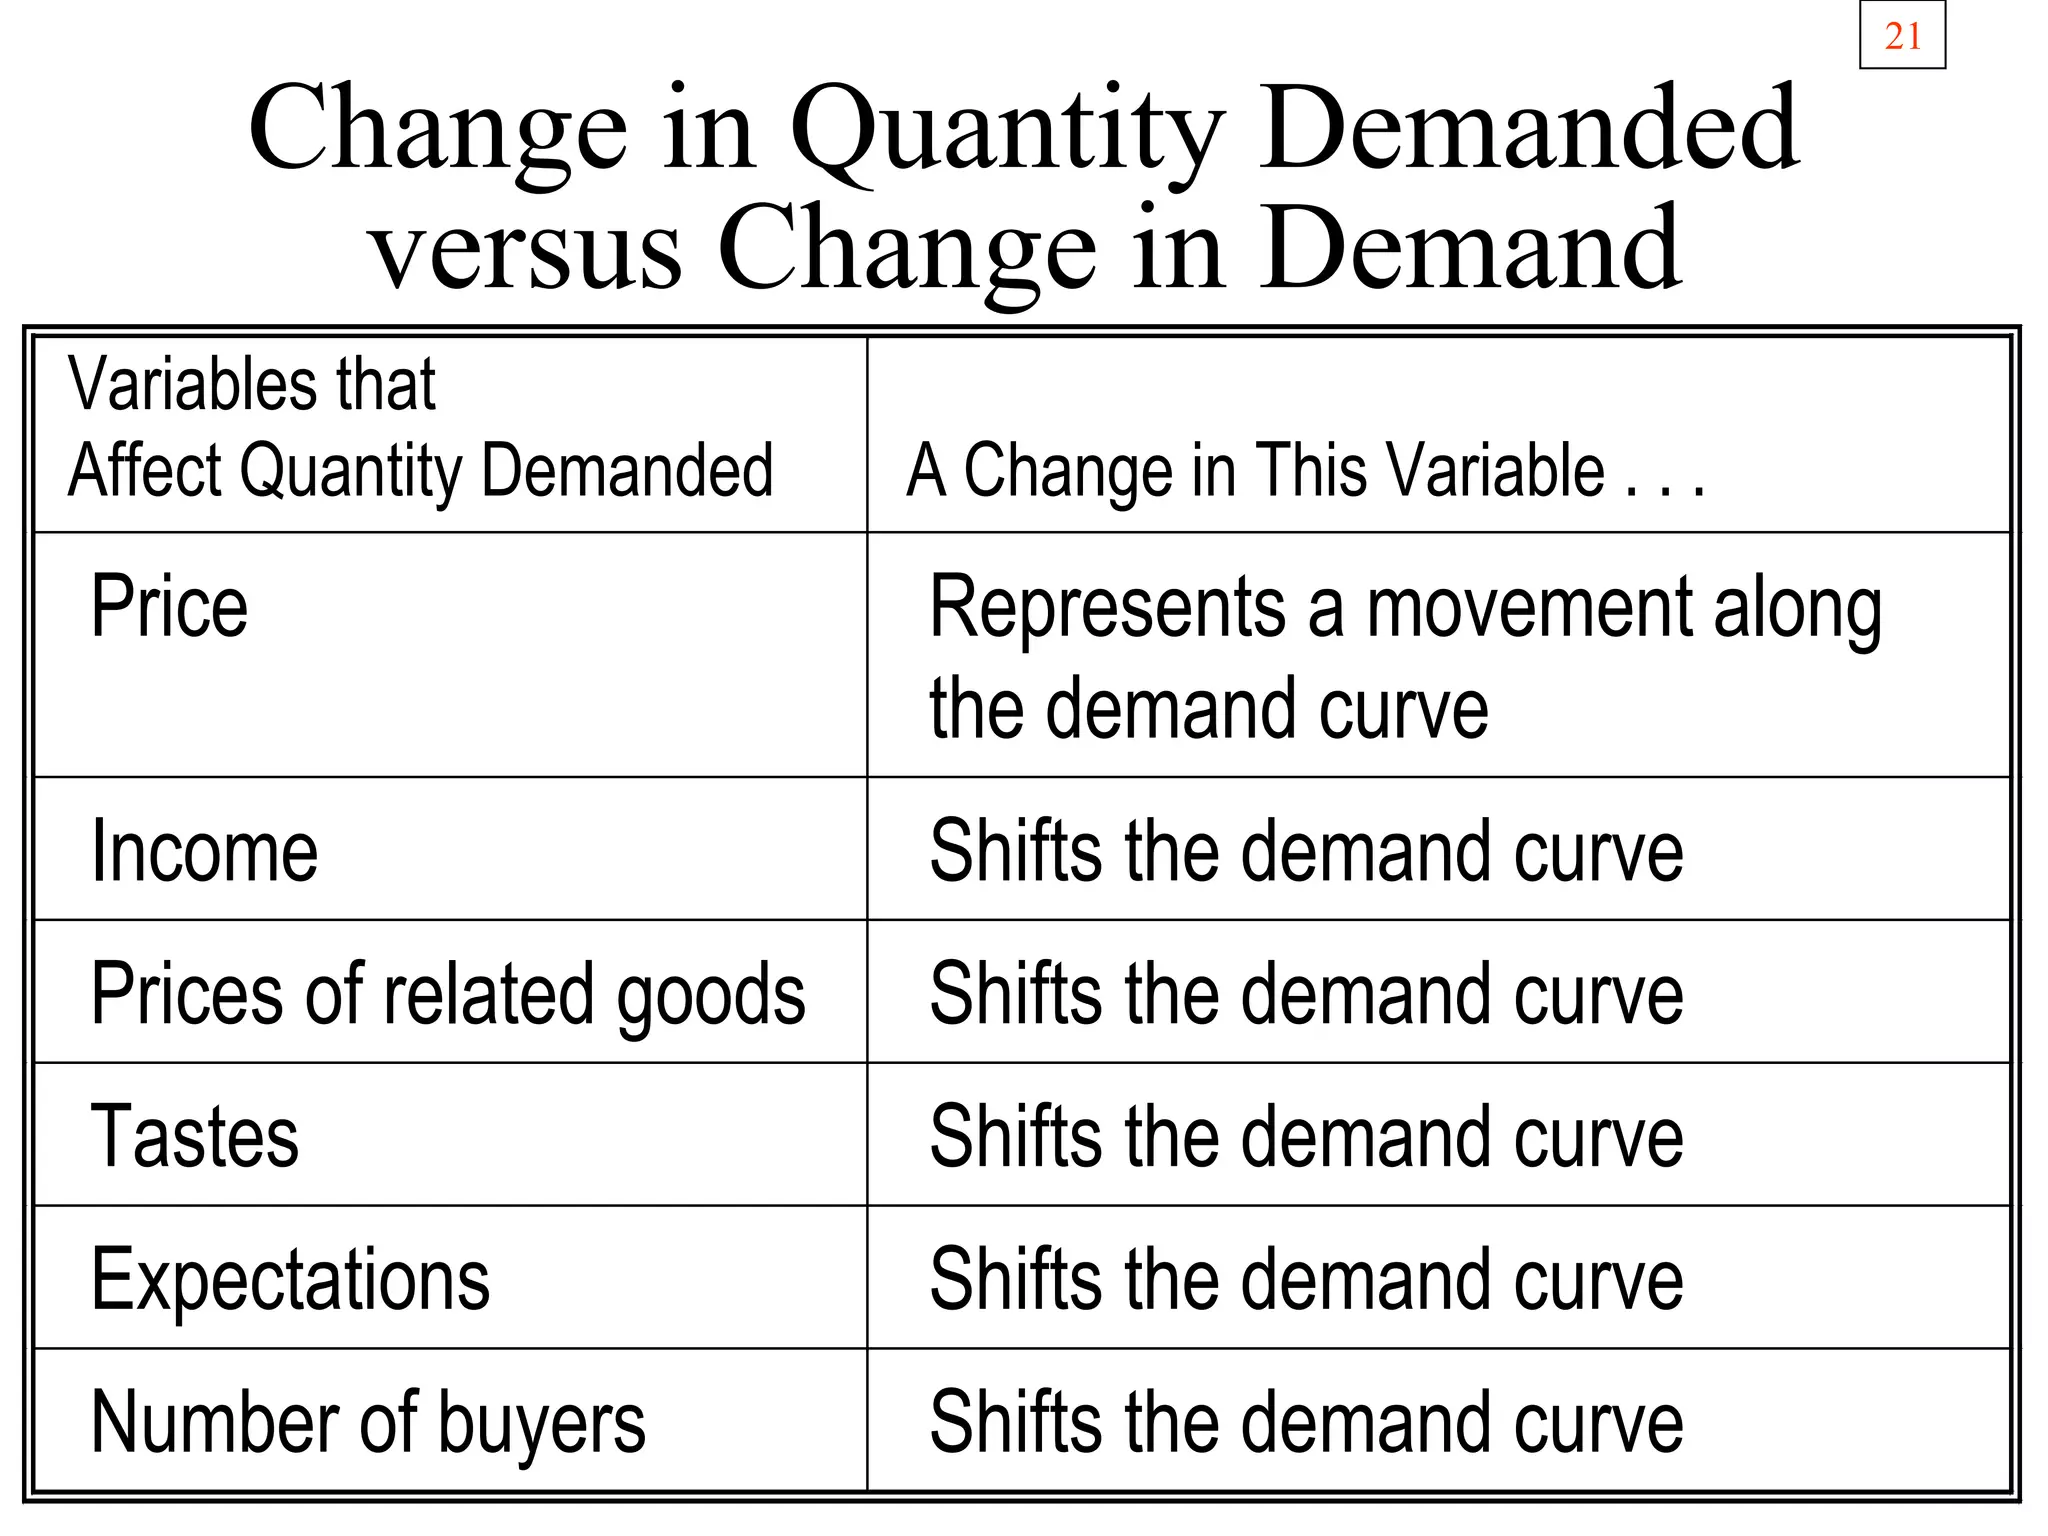
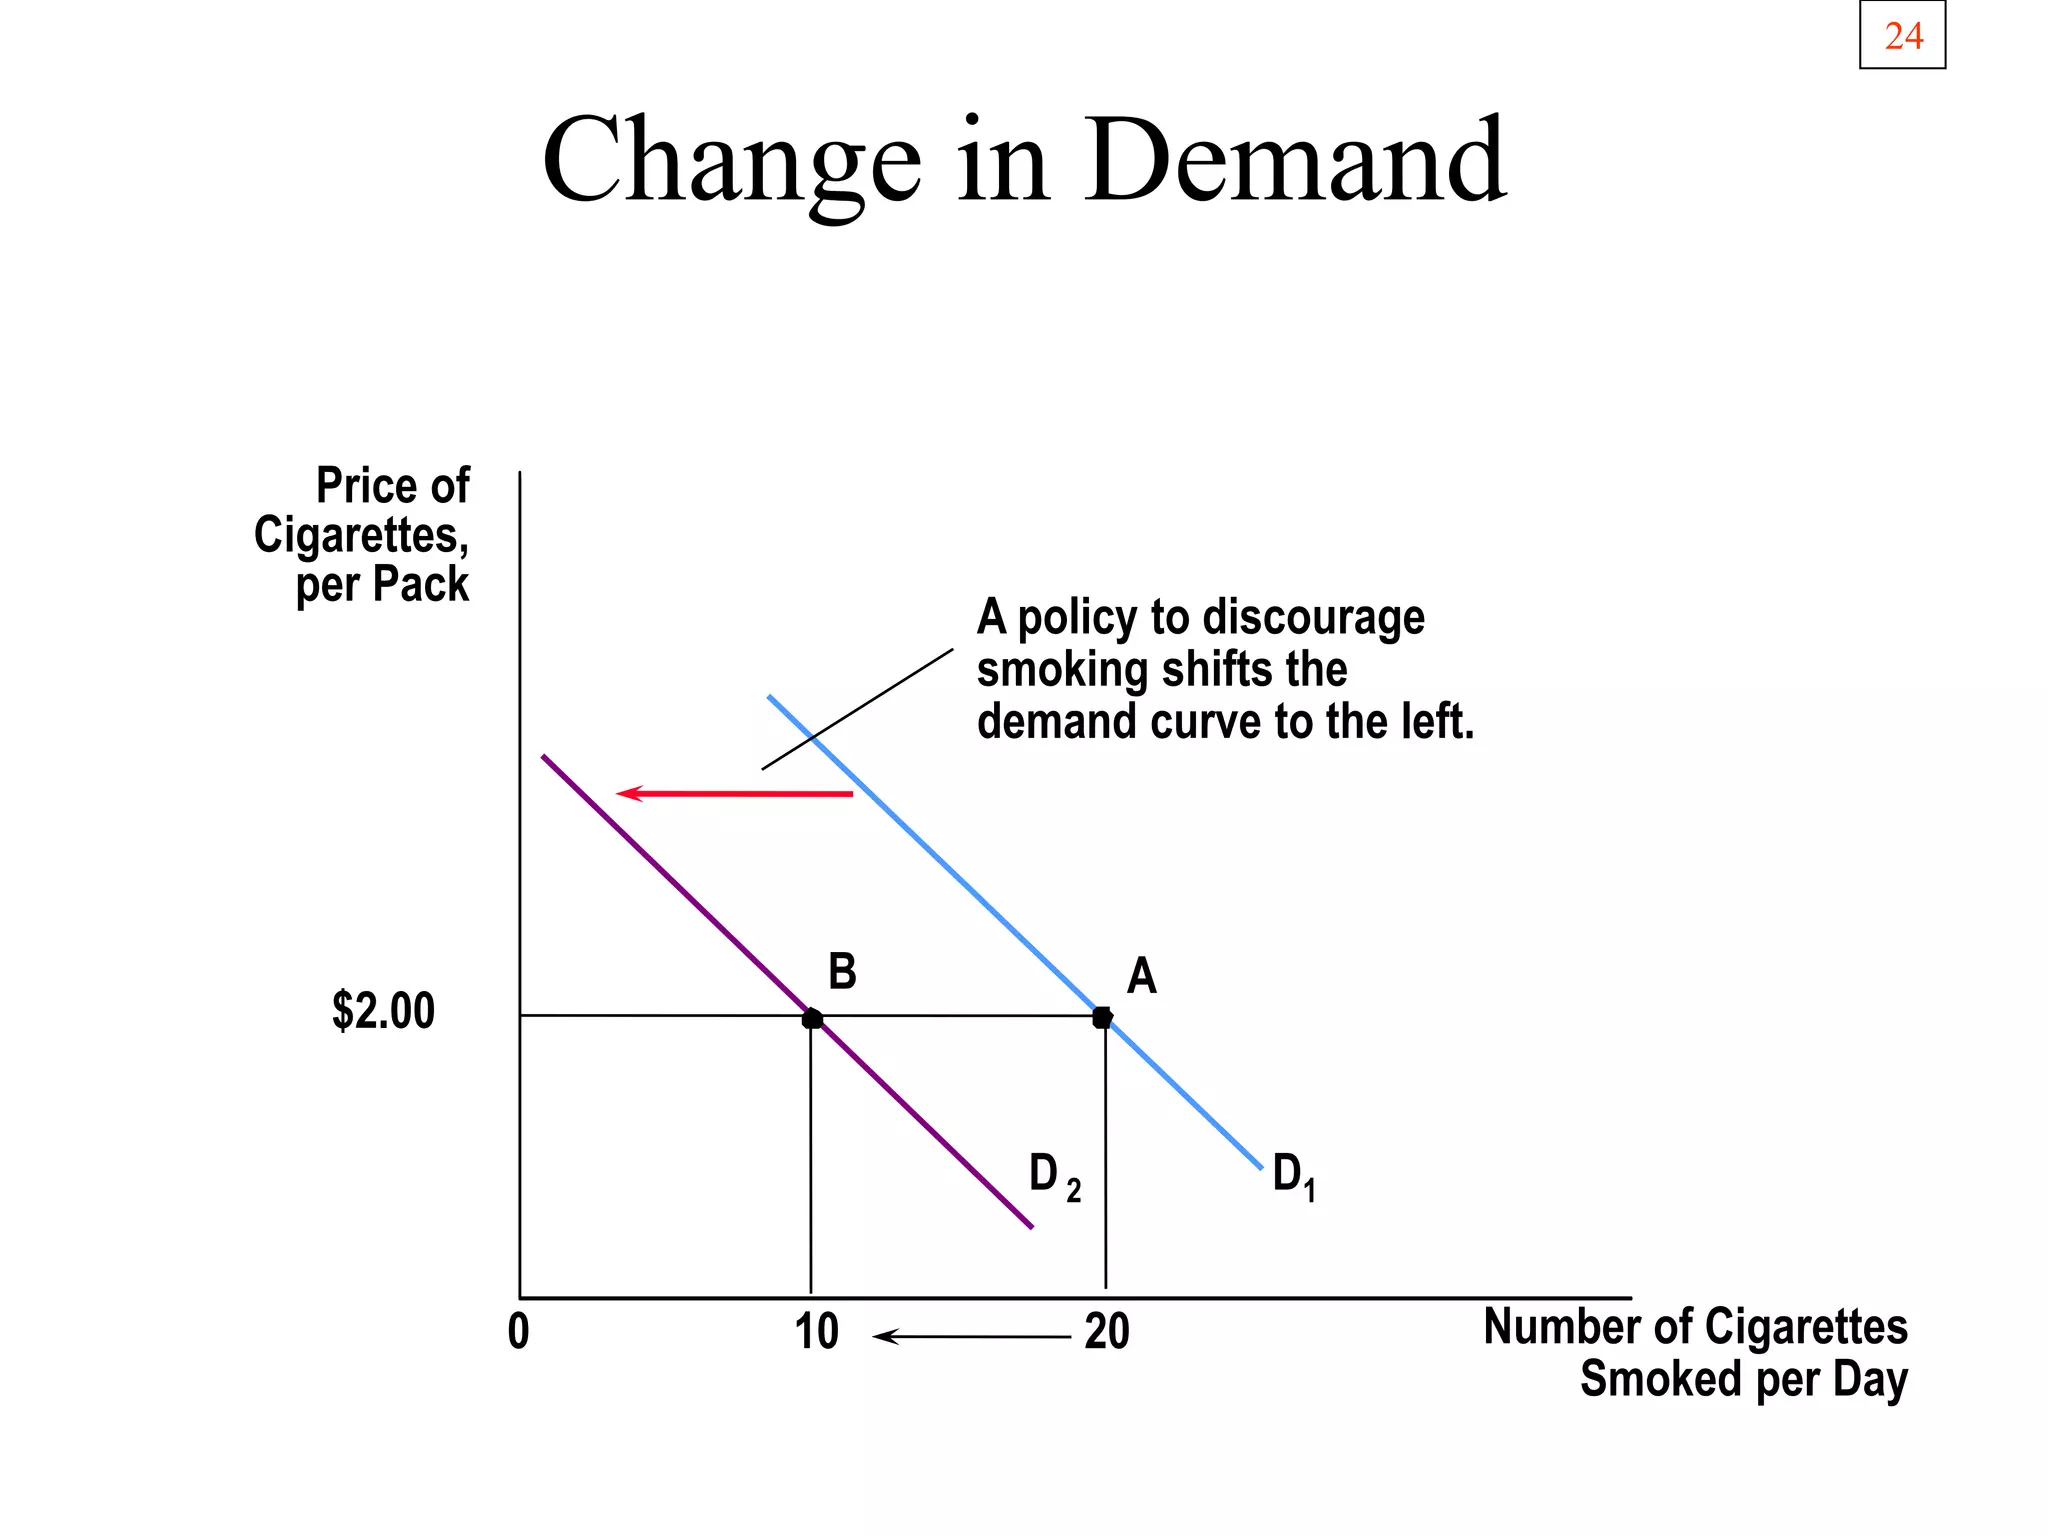
- The determinants of demand and how changes in factors like income, prices of related goods, and tastes can shift the demand curve.
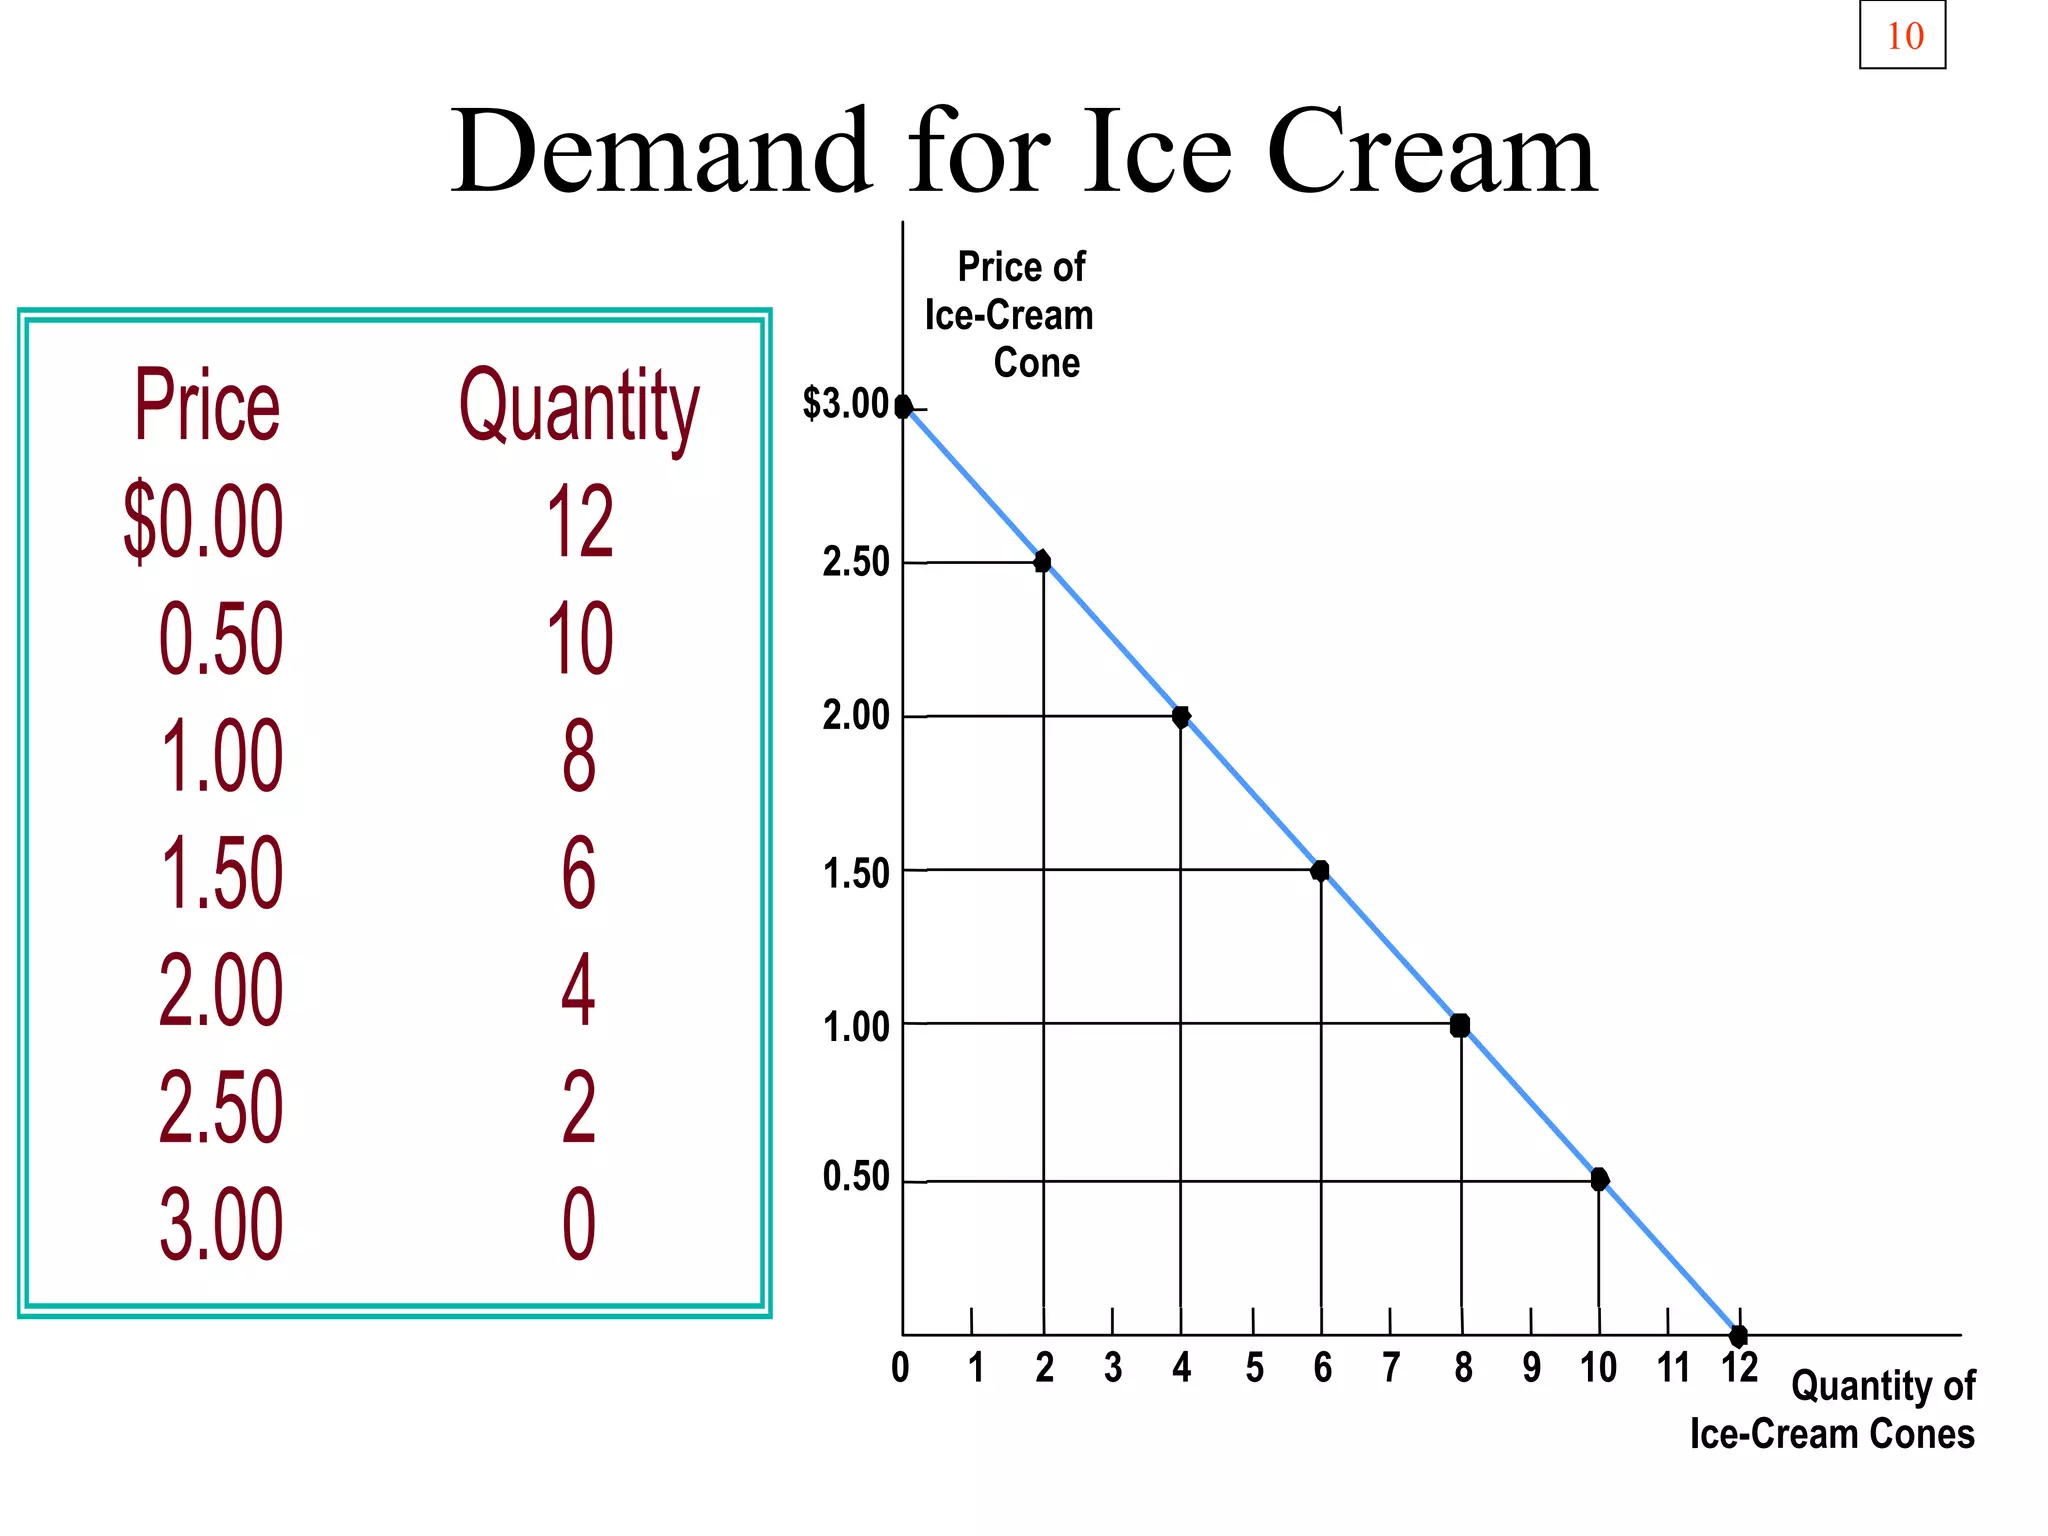
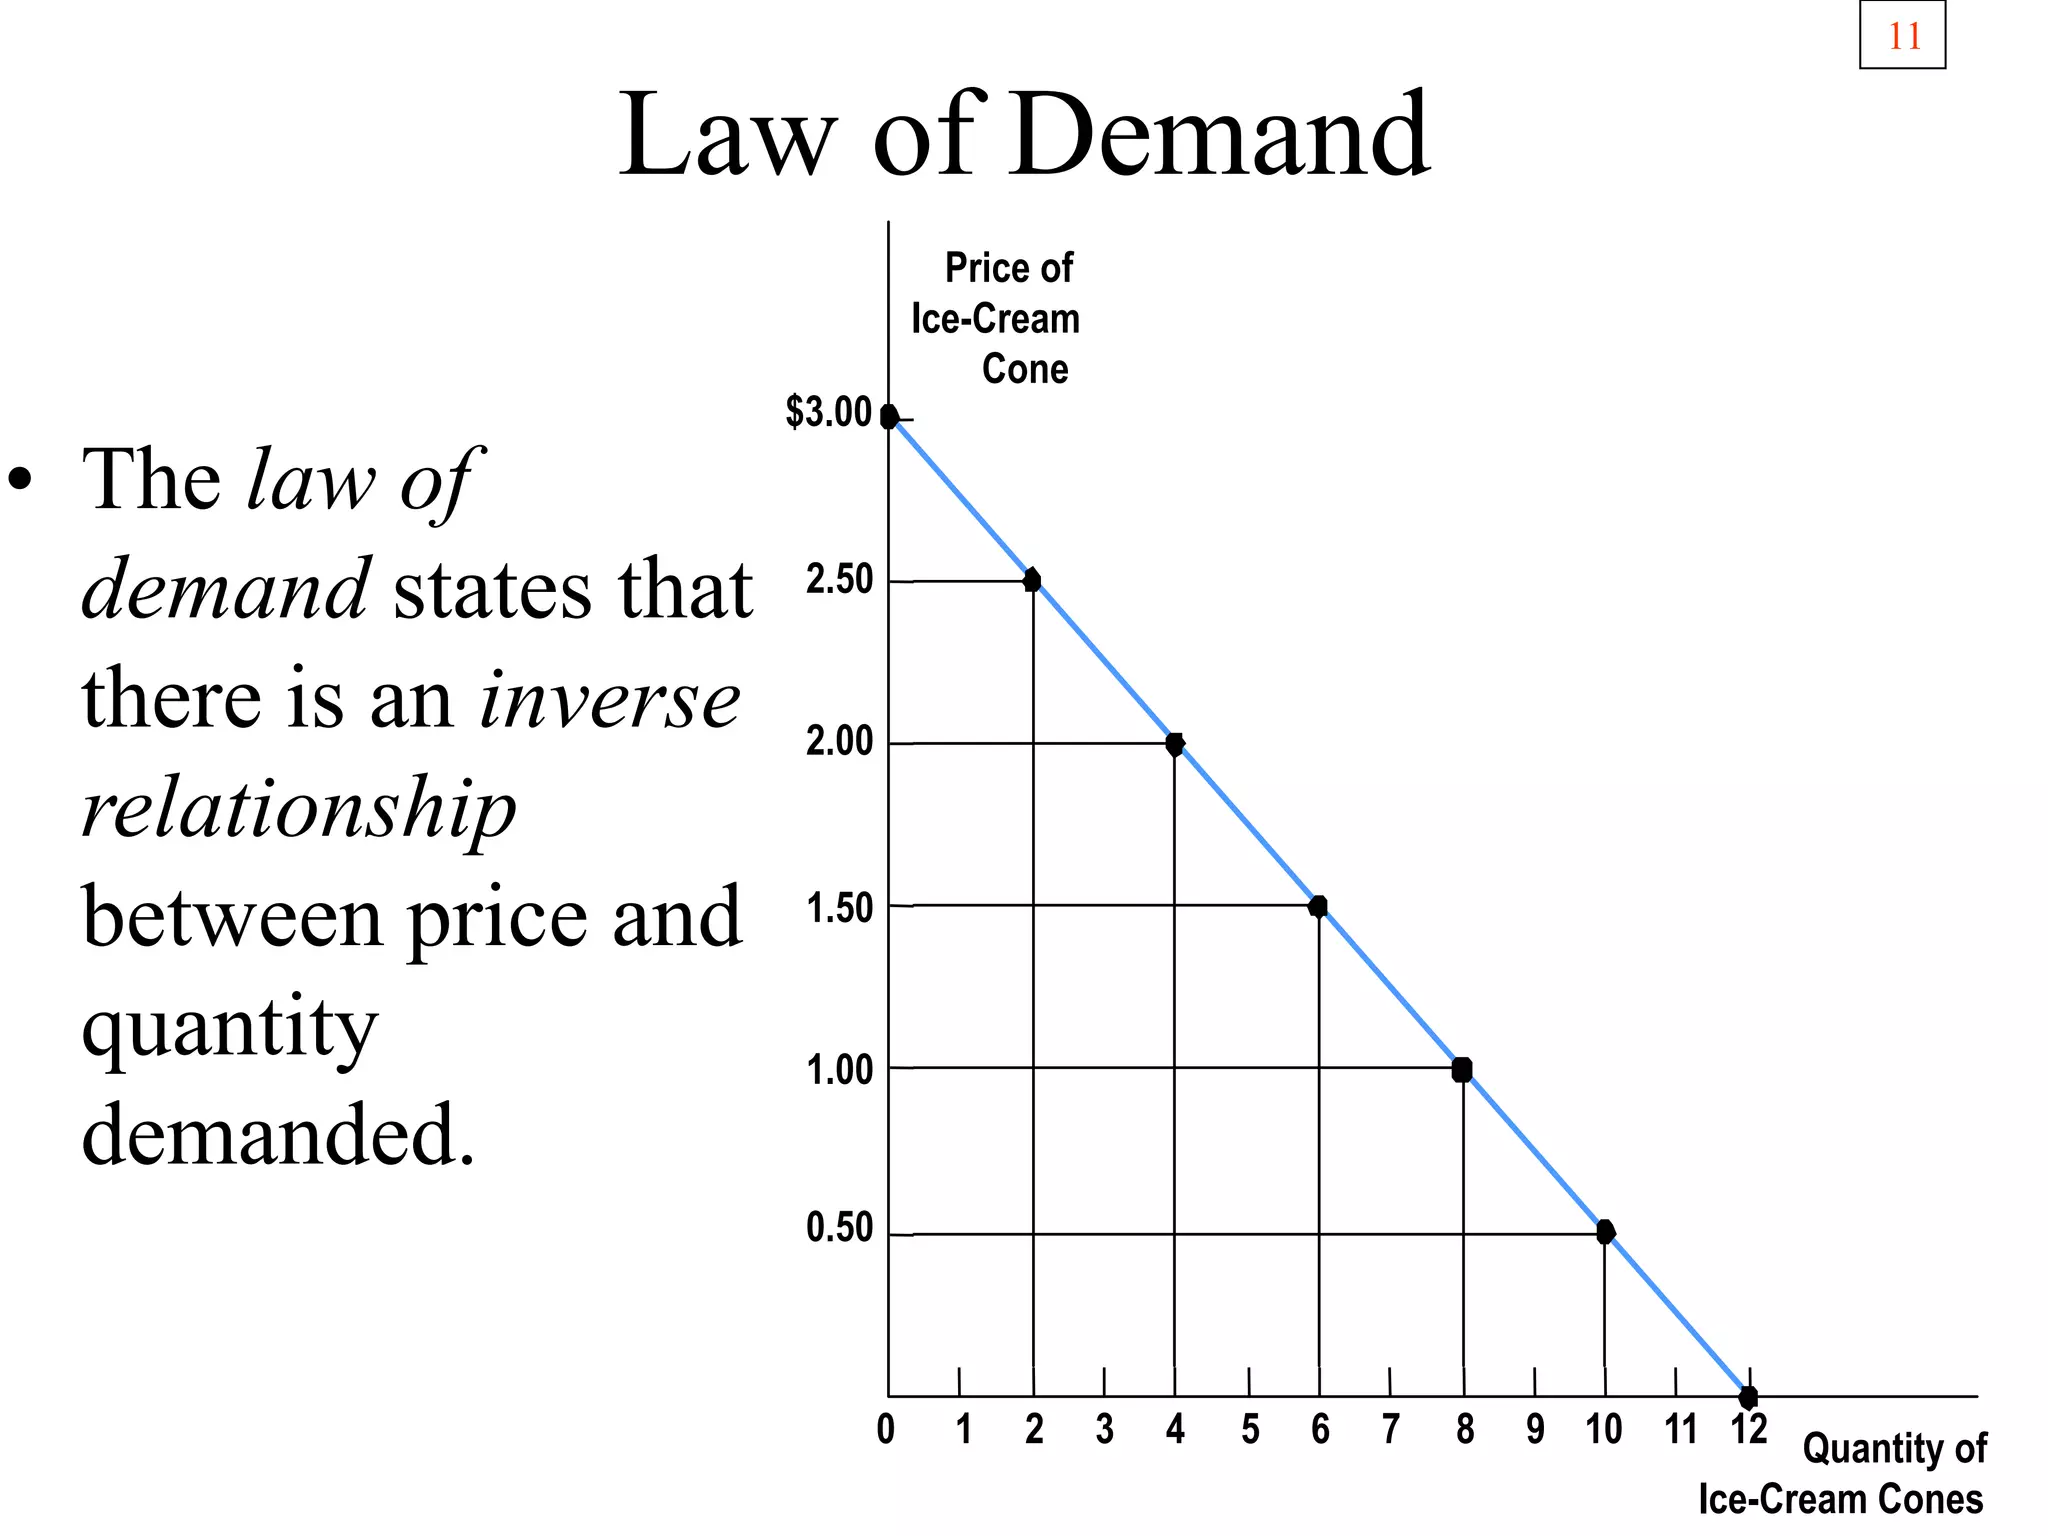
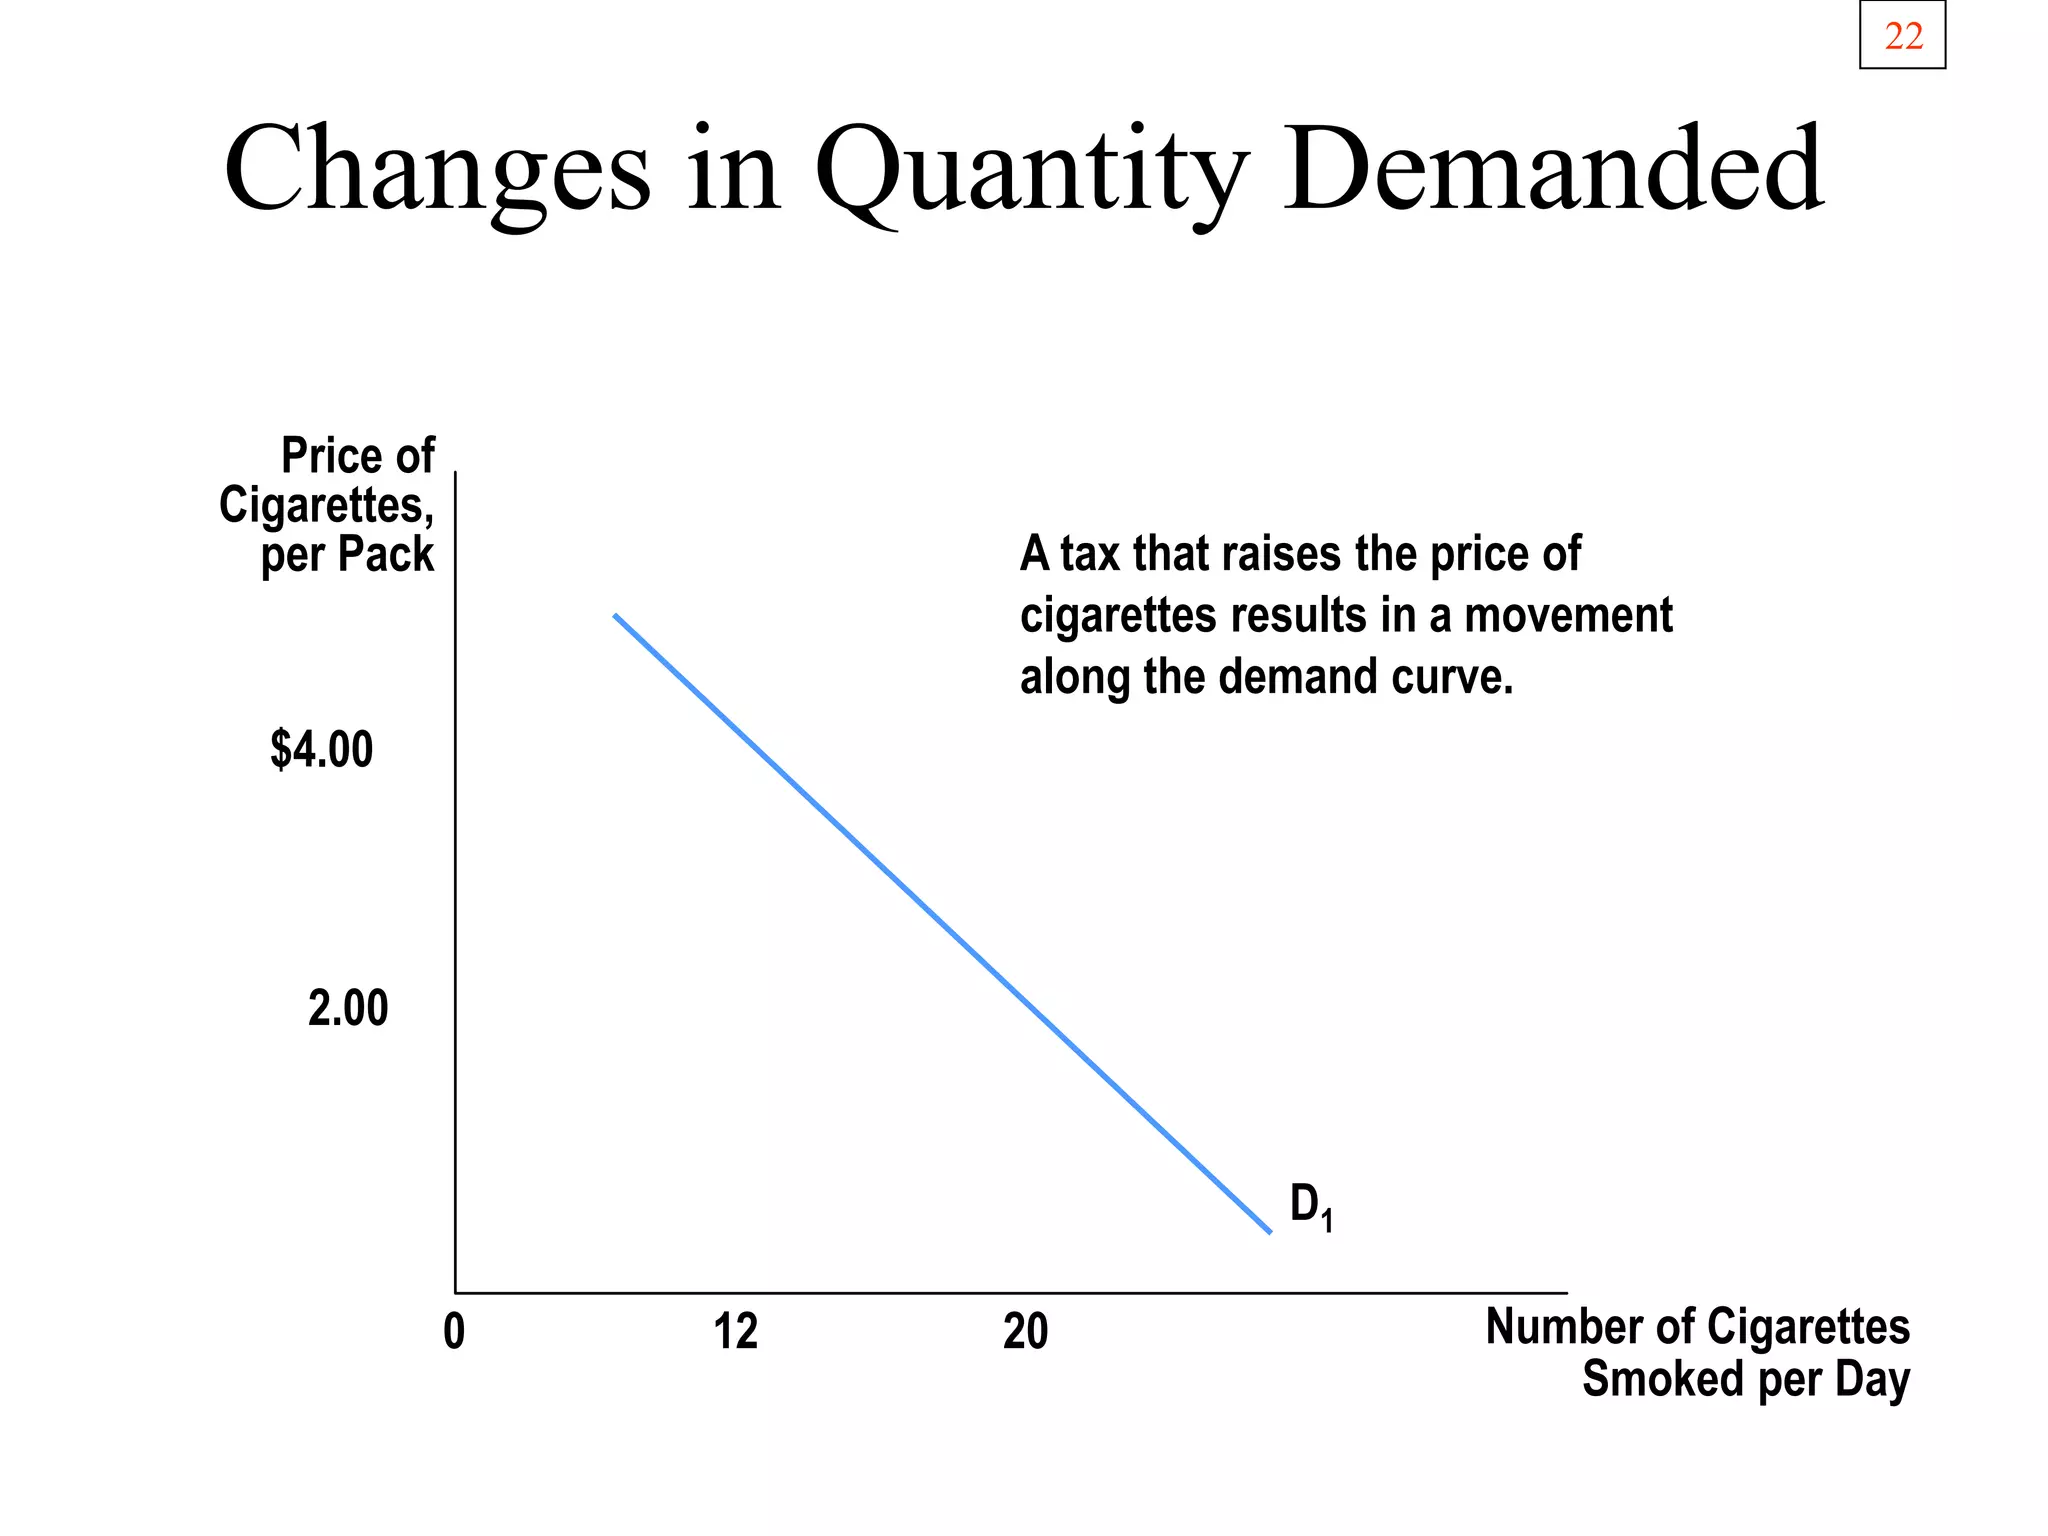
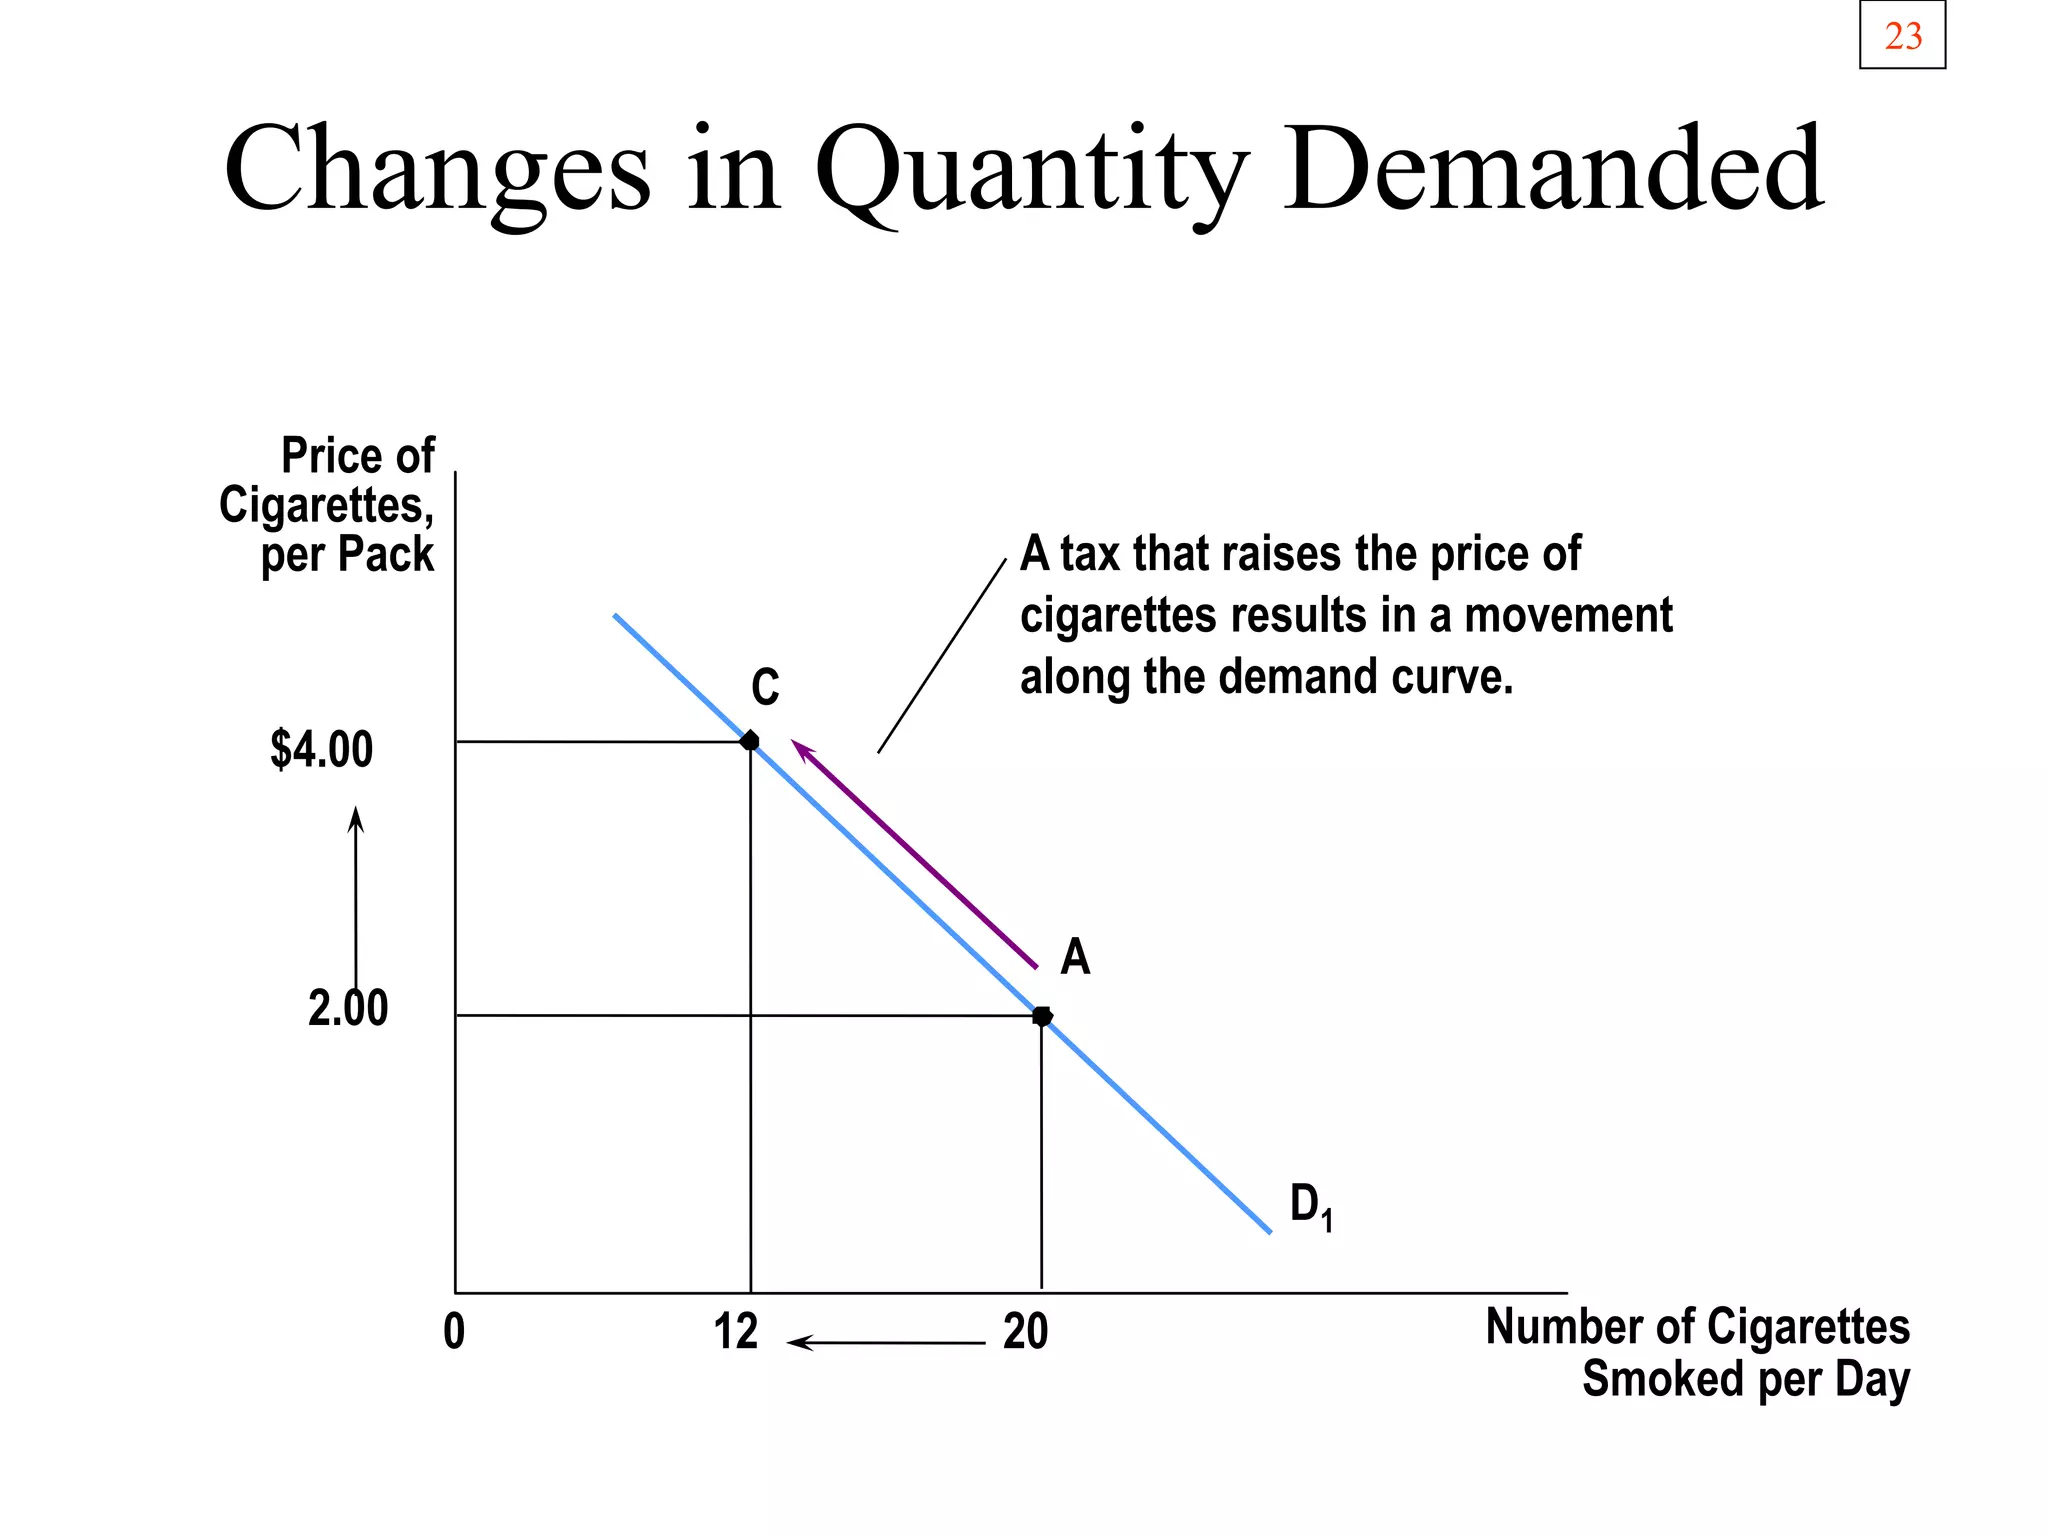
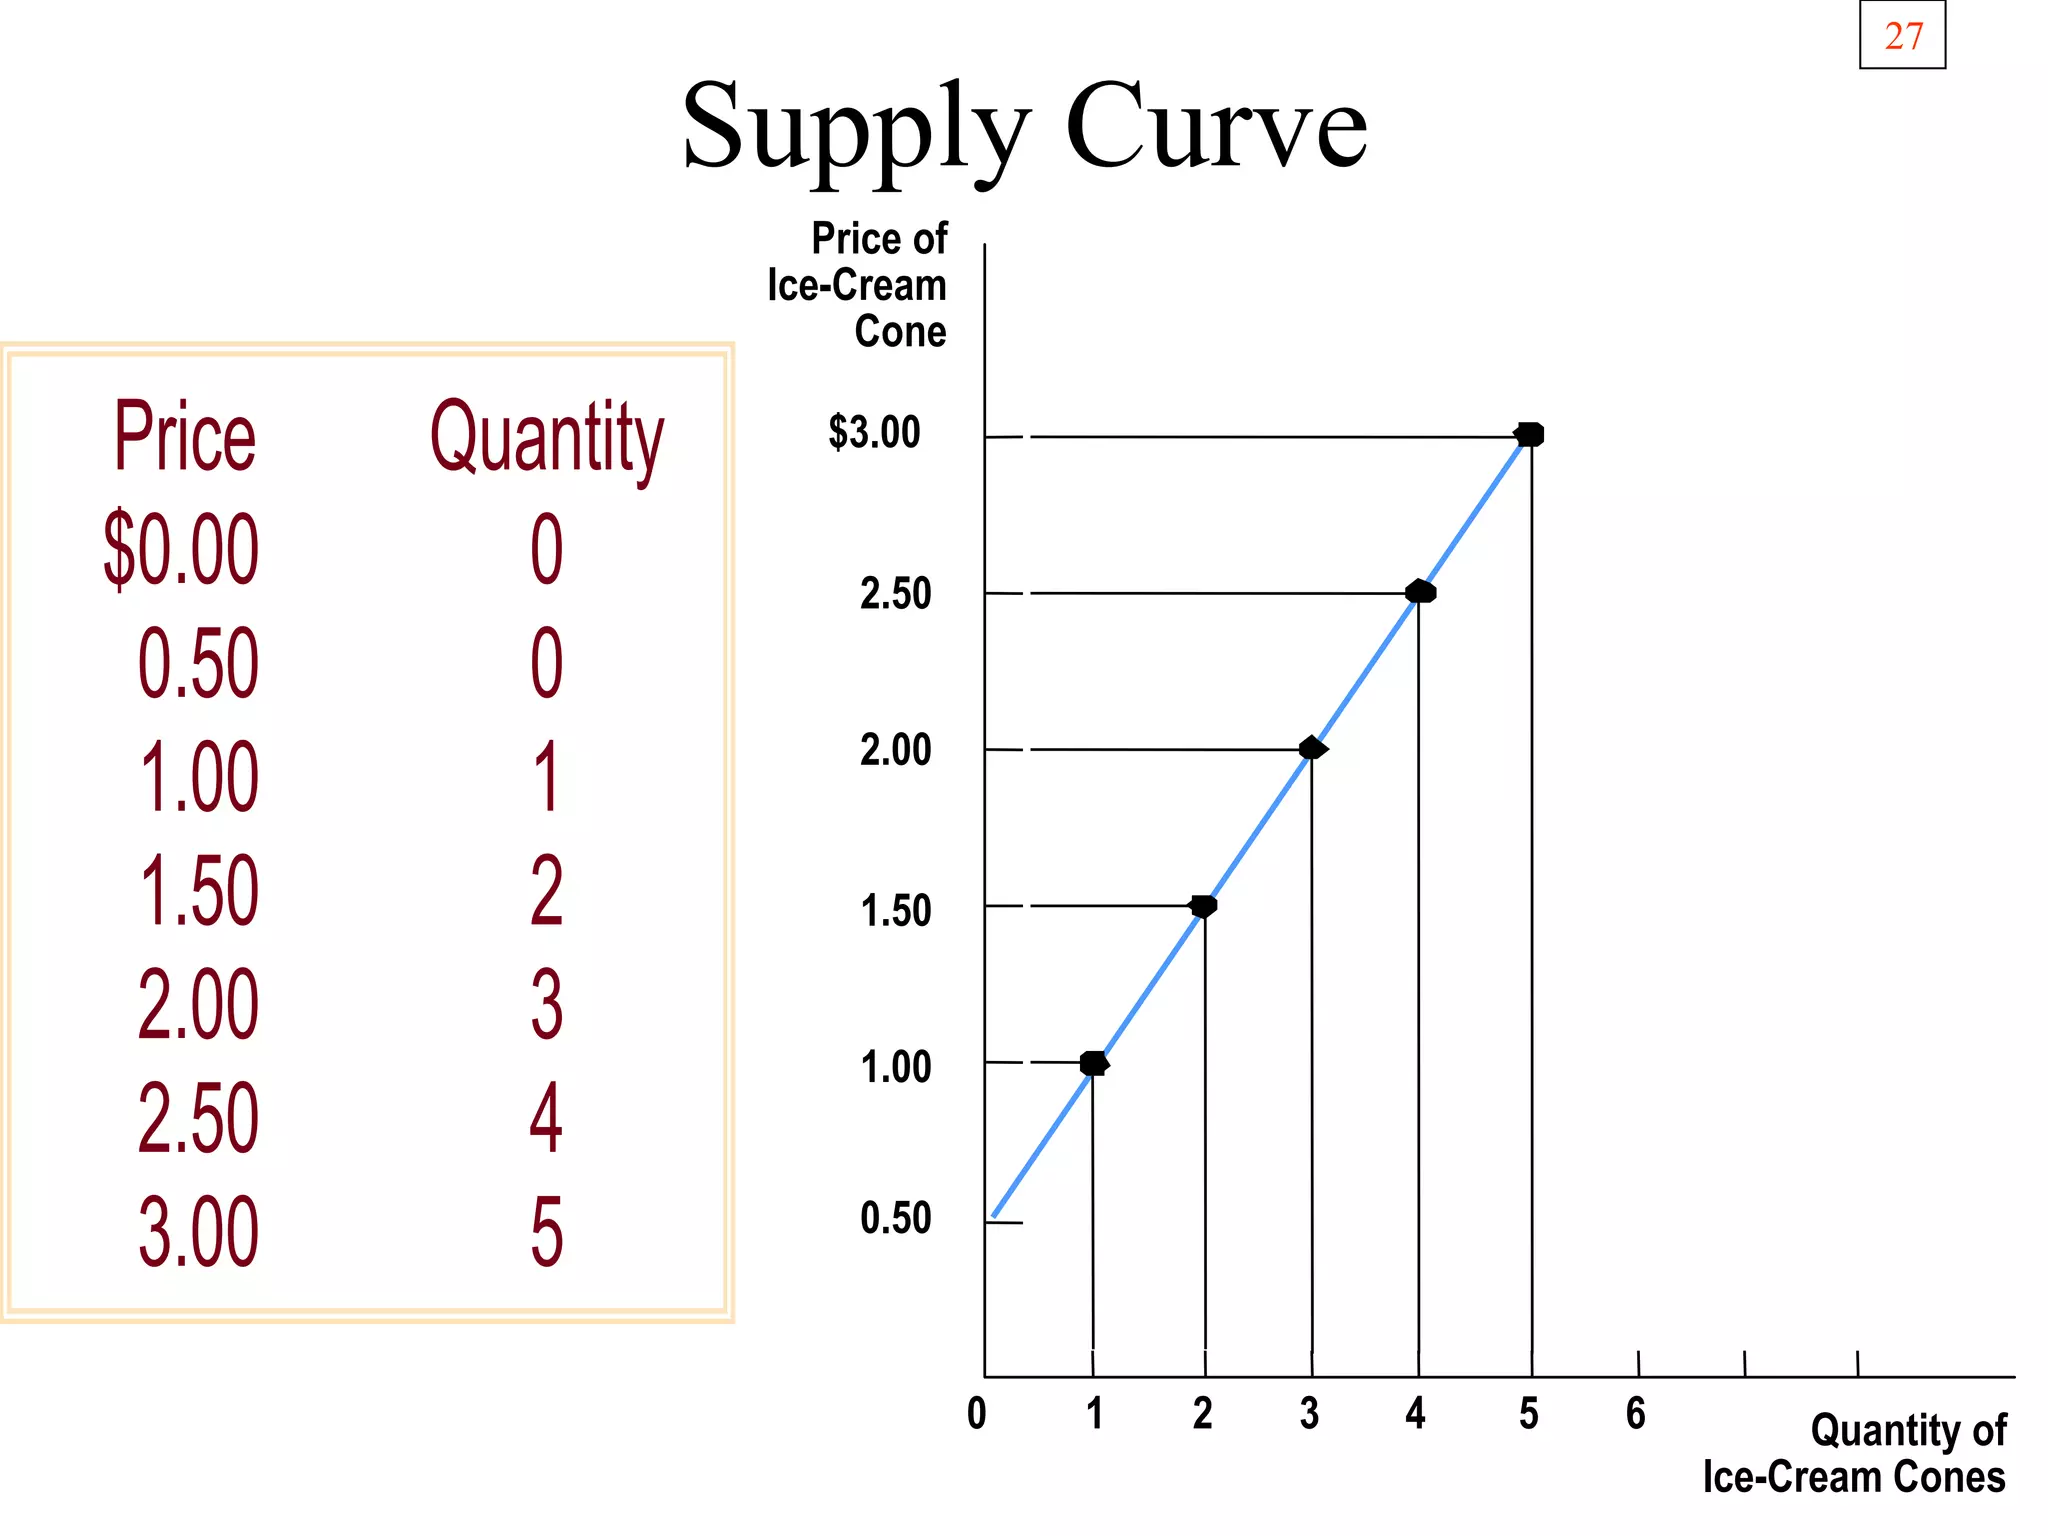
- The law of demand and how quantity demanded responds to price changes along the demand curve.
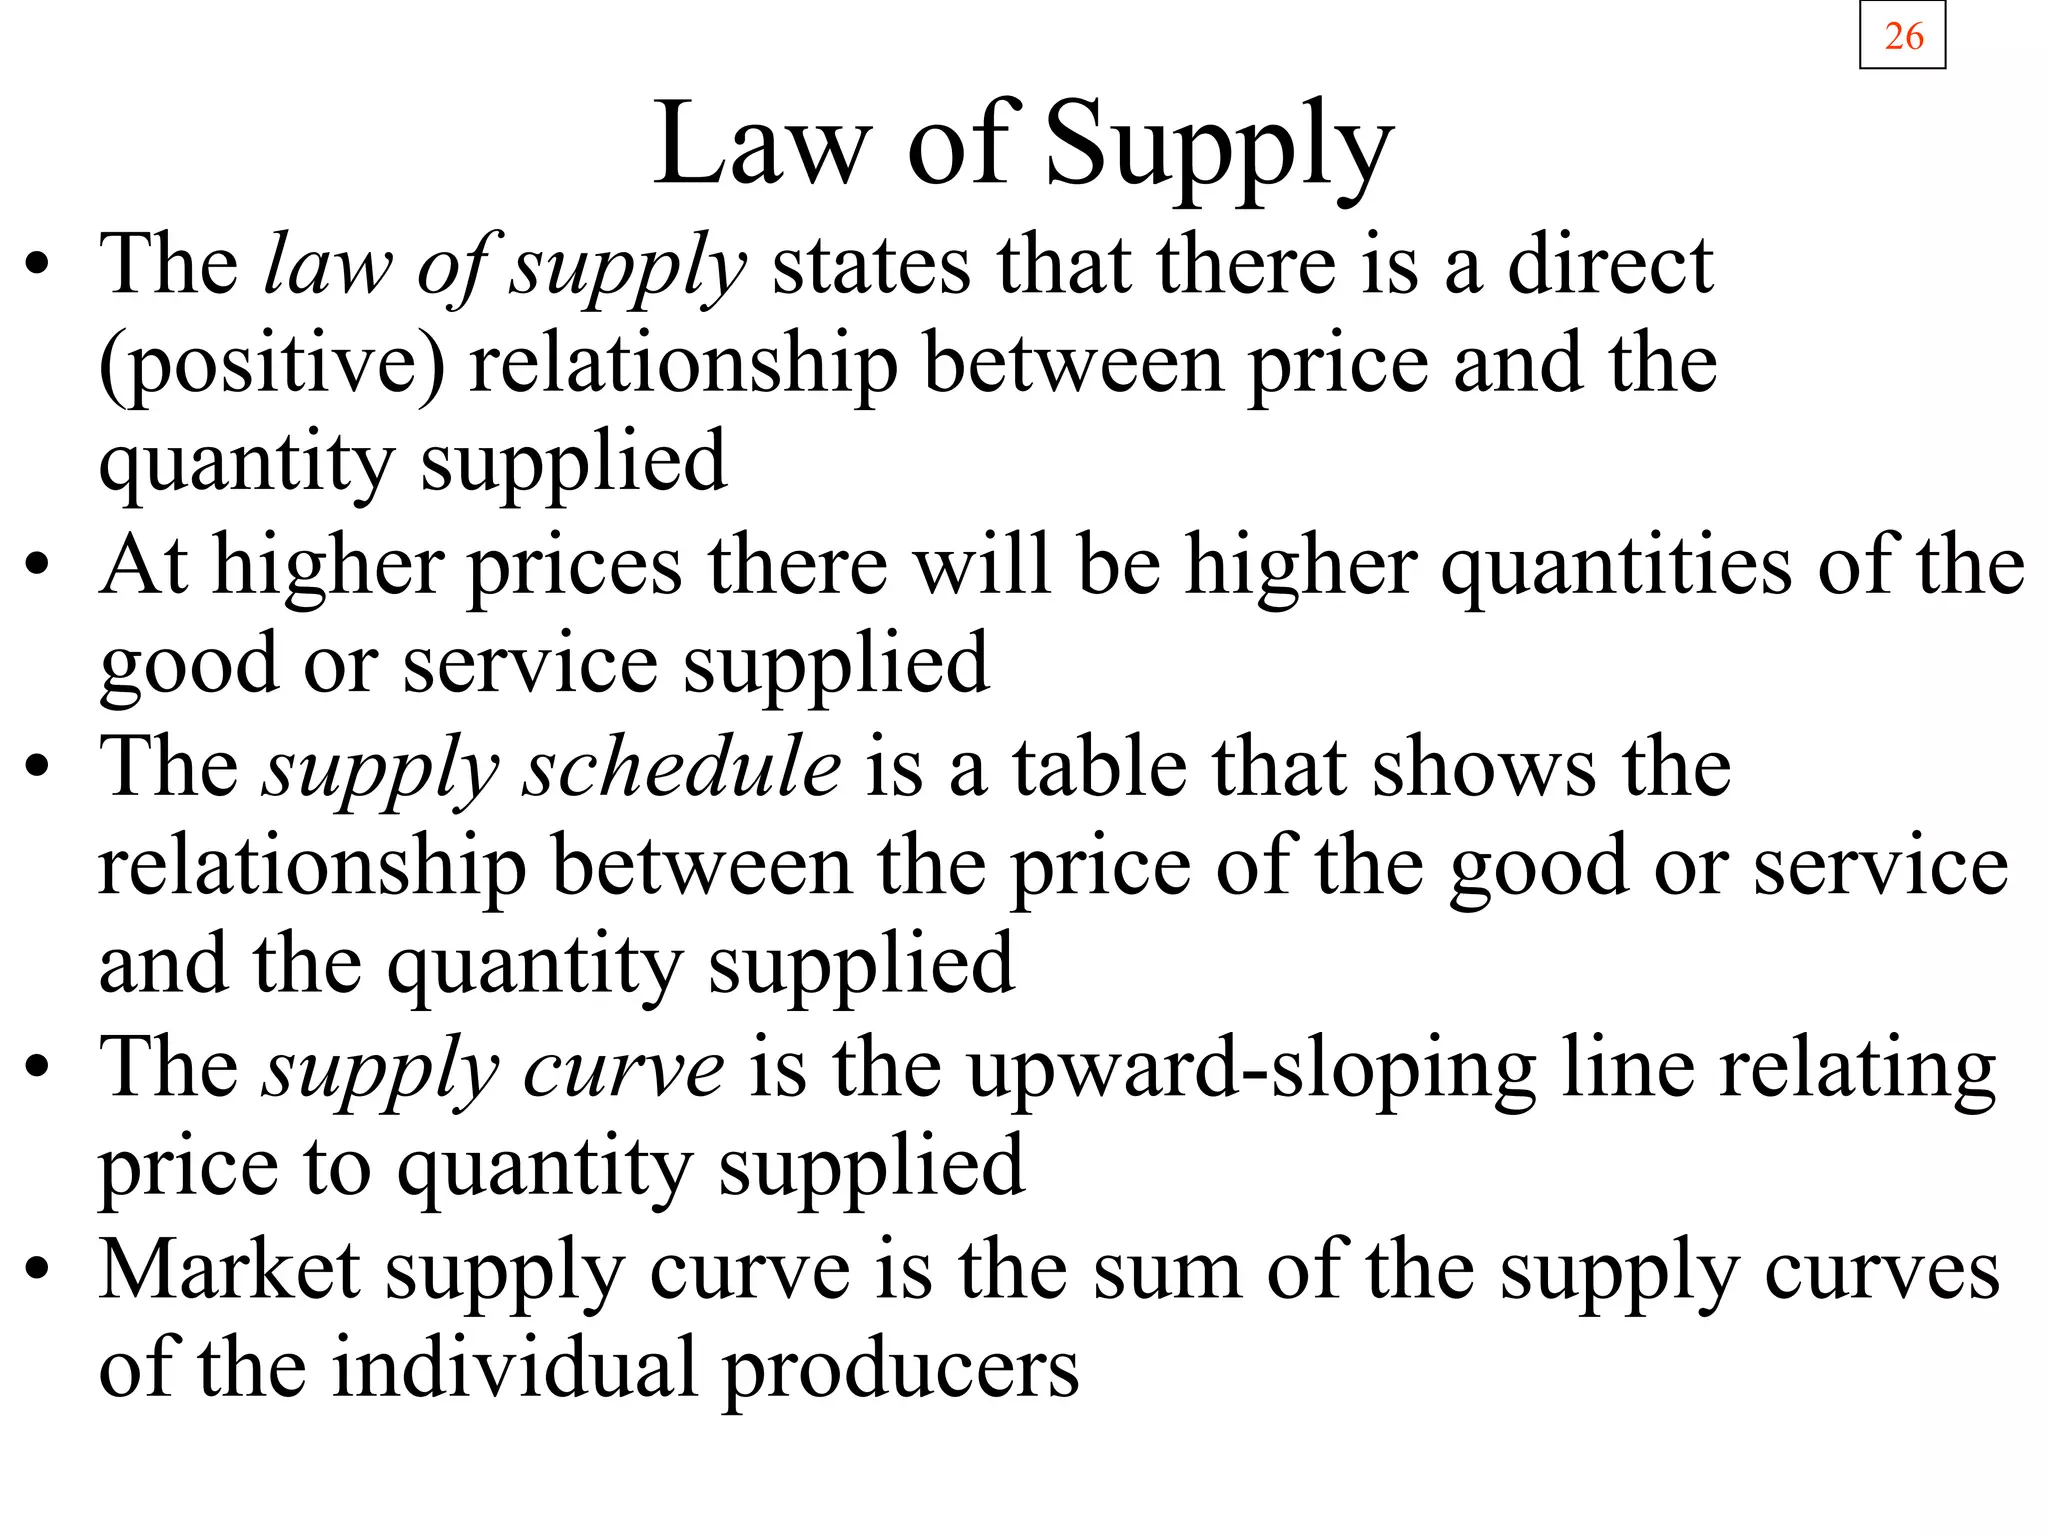
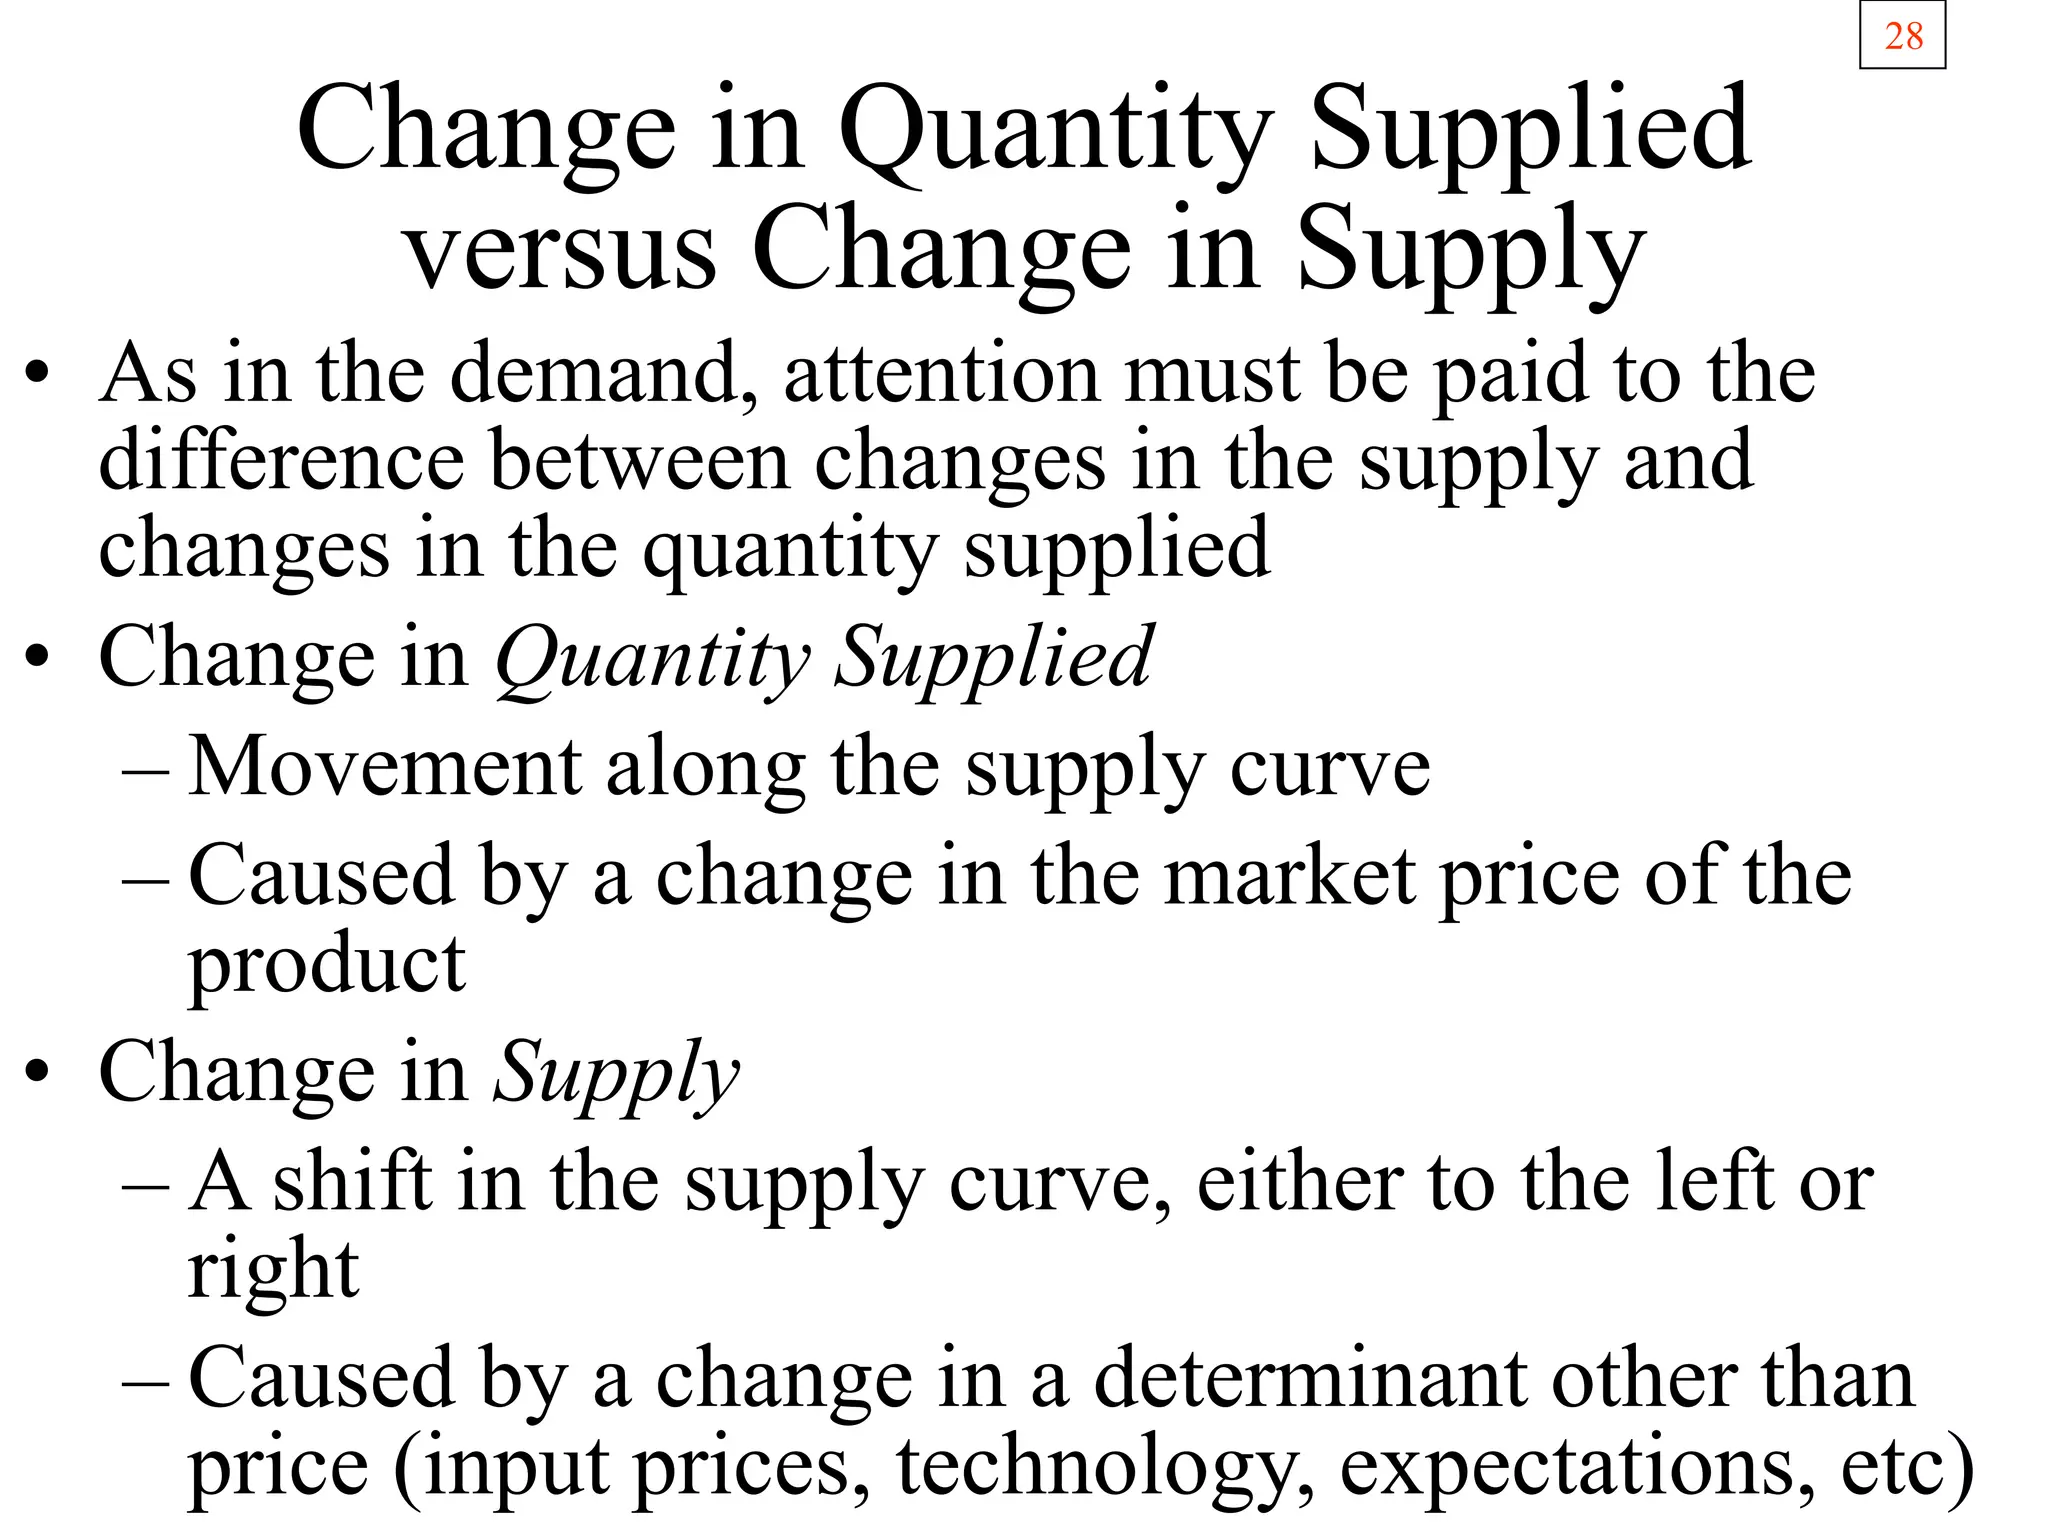
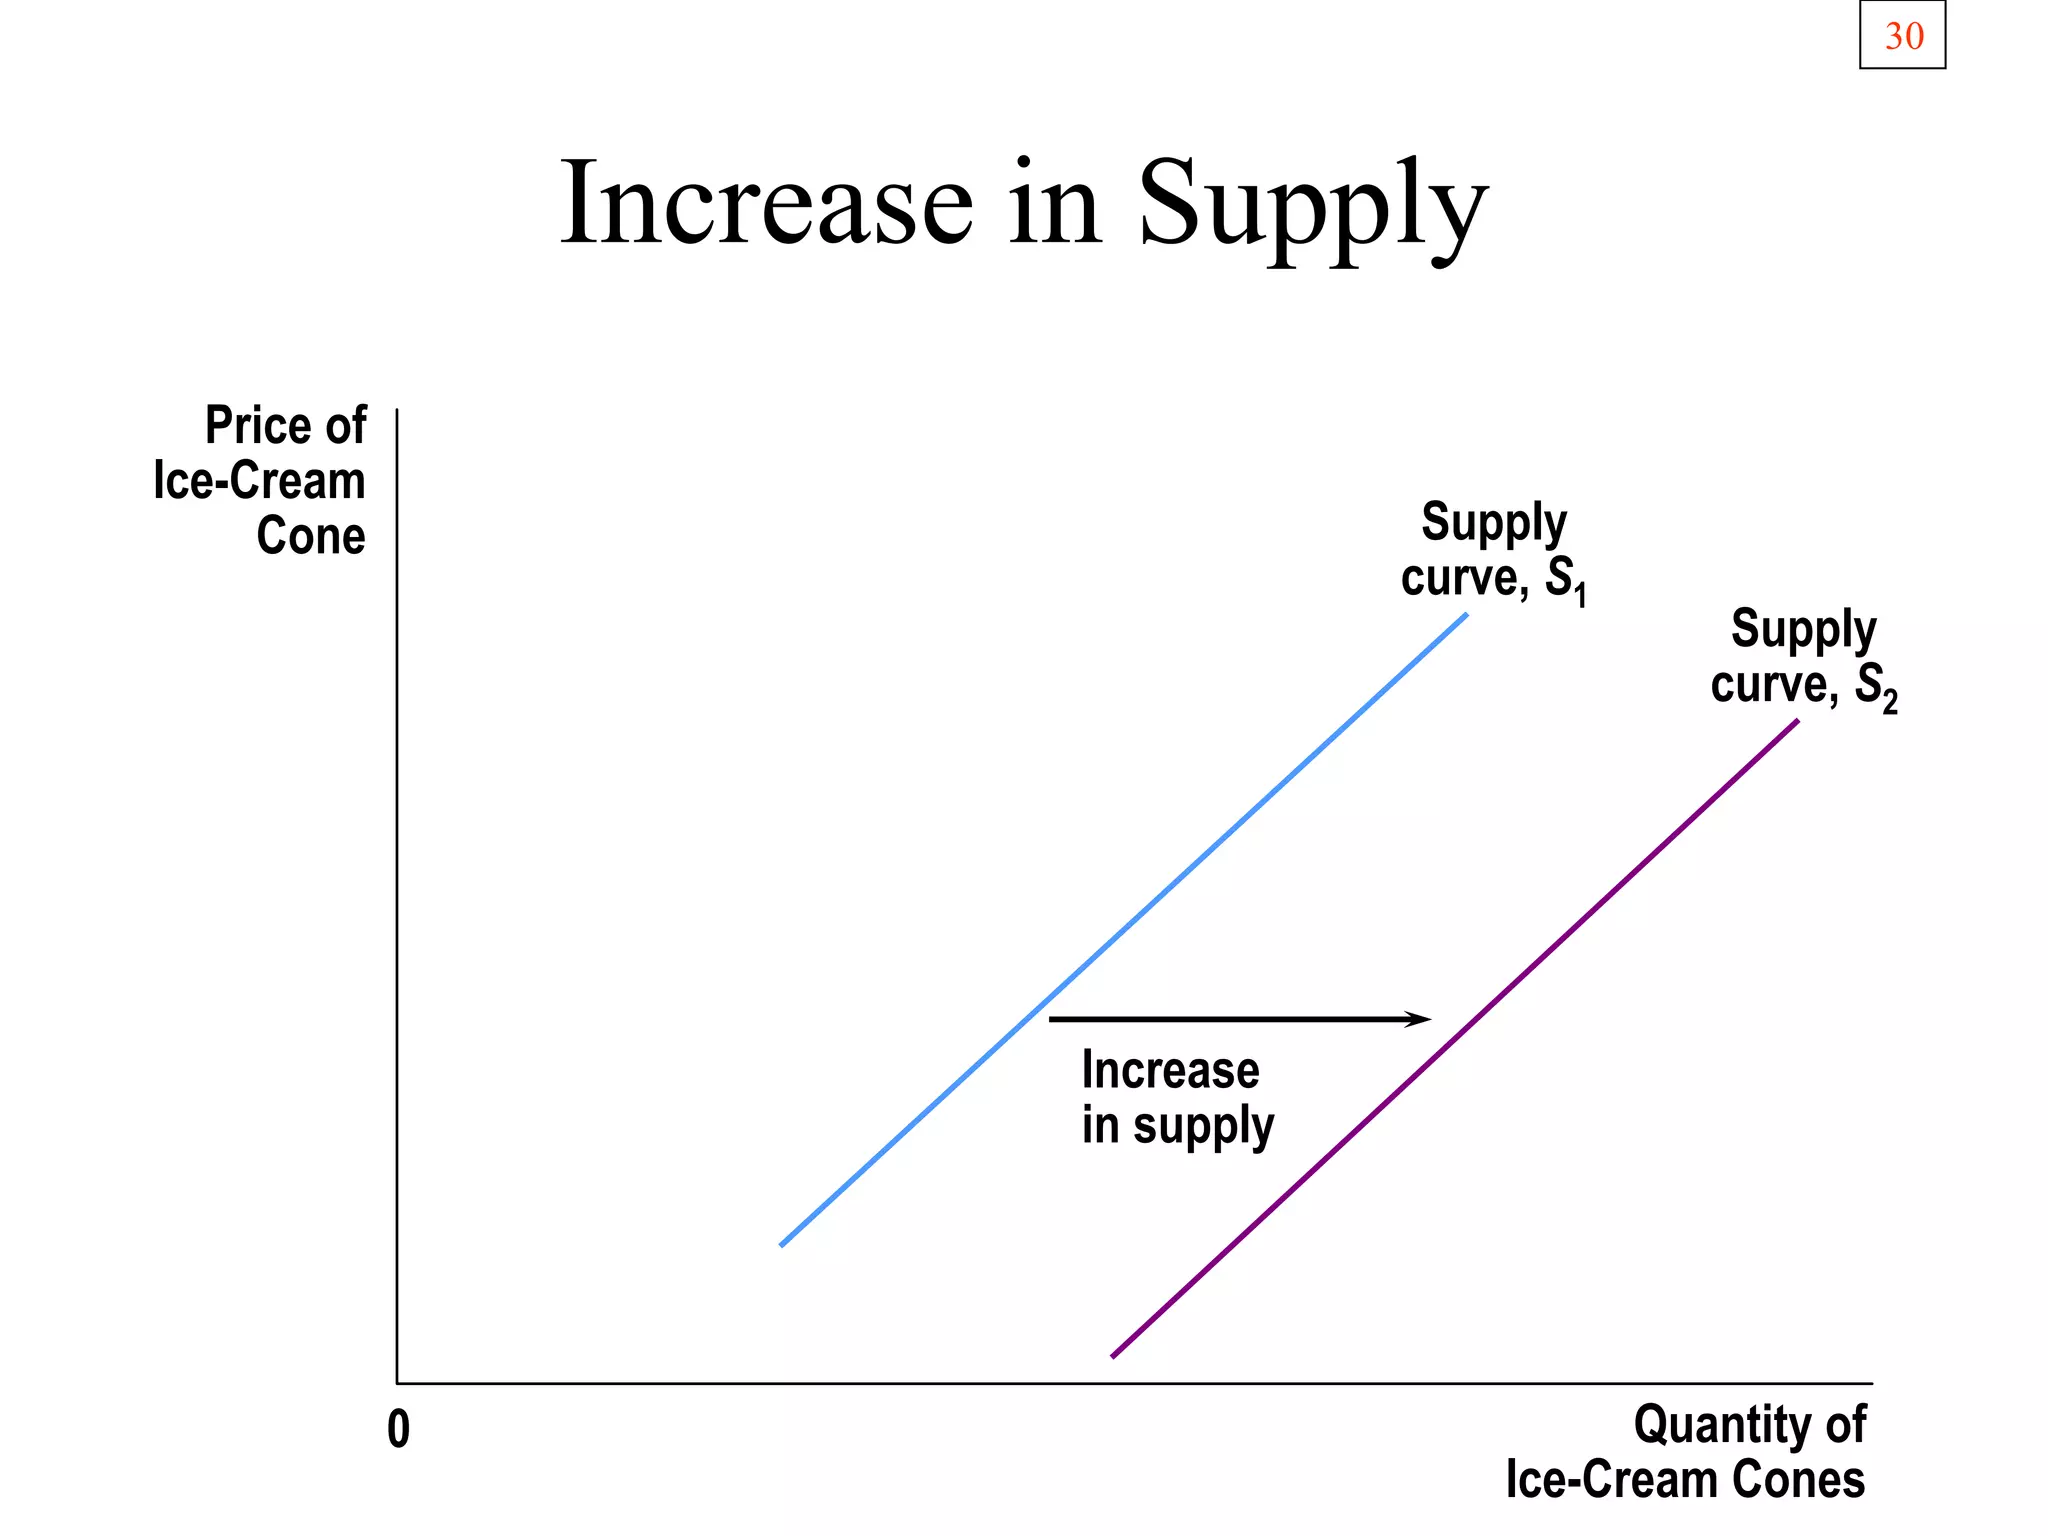
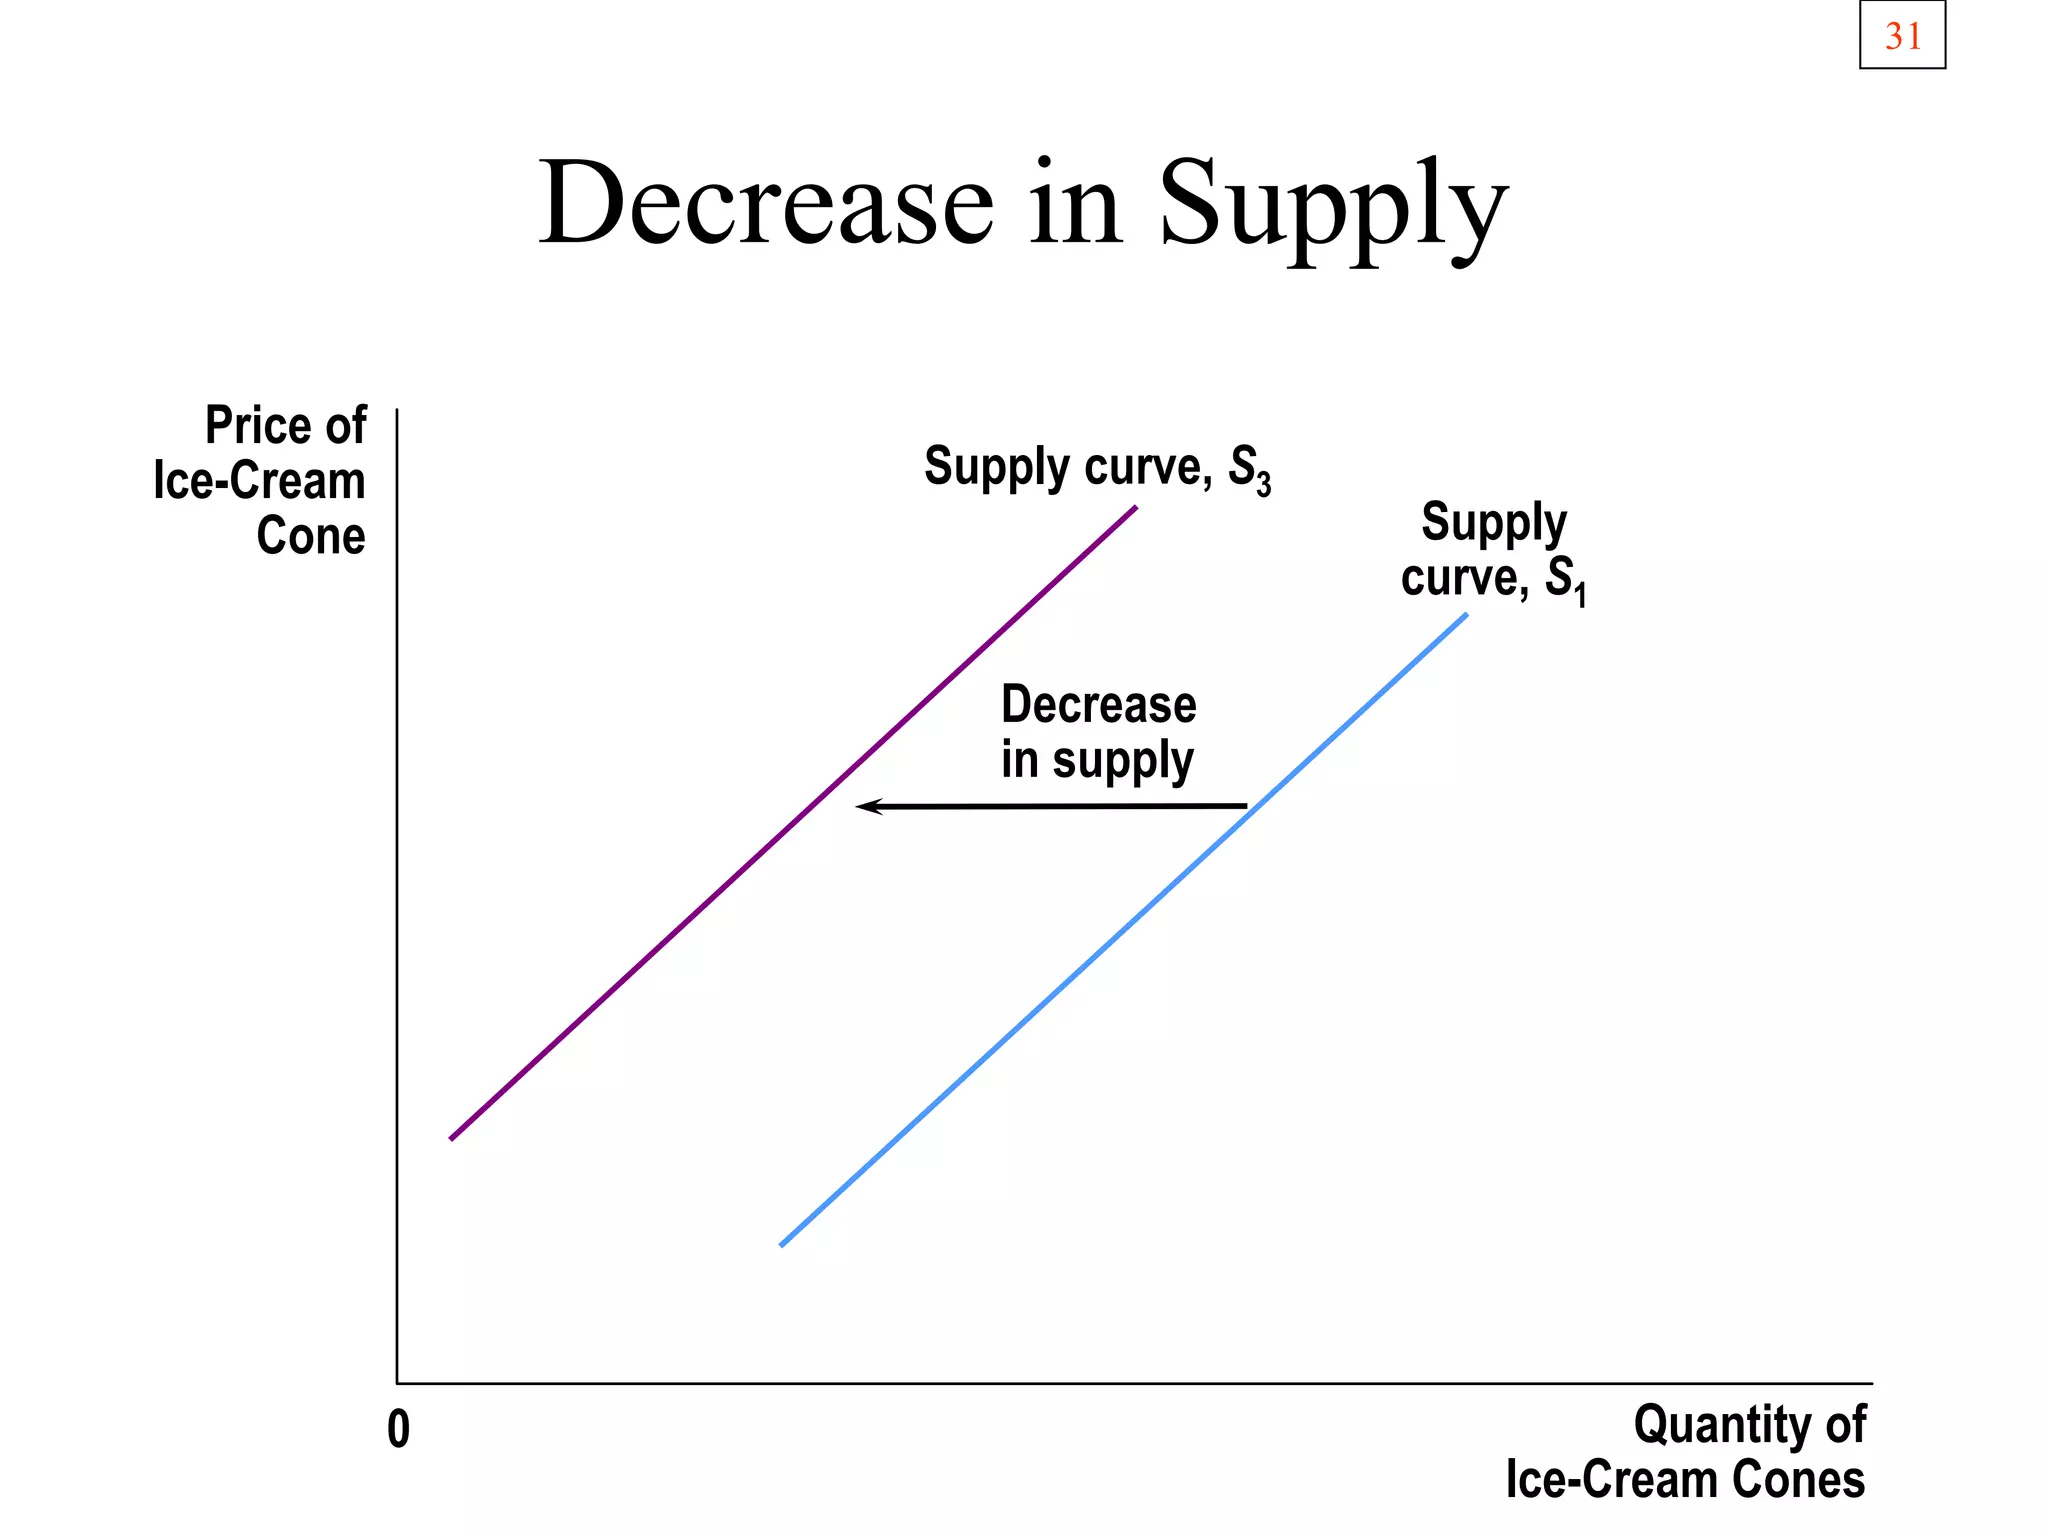
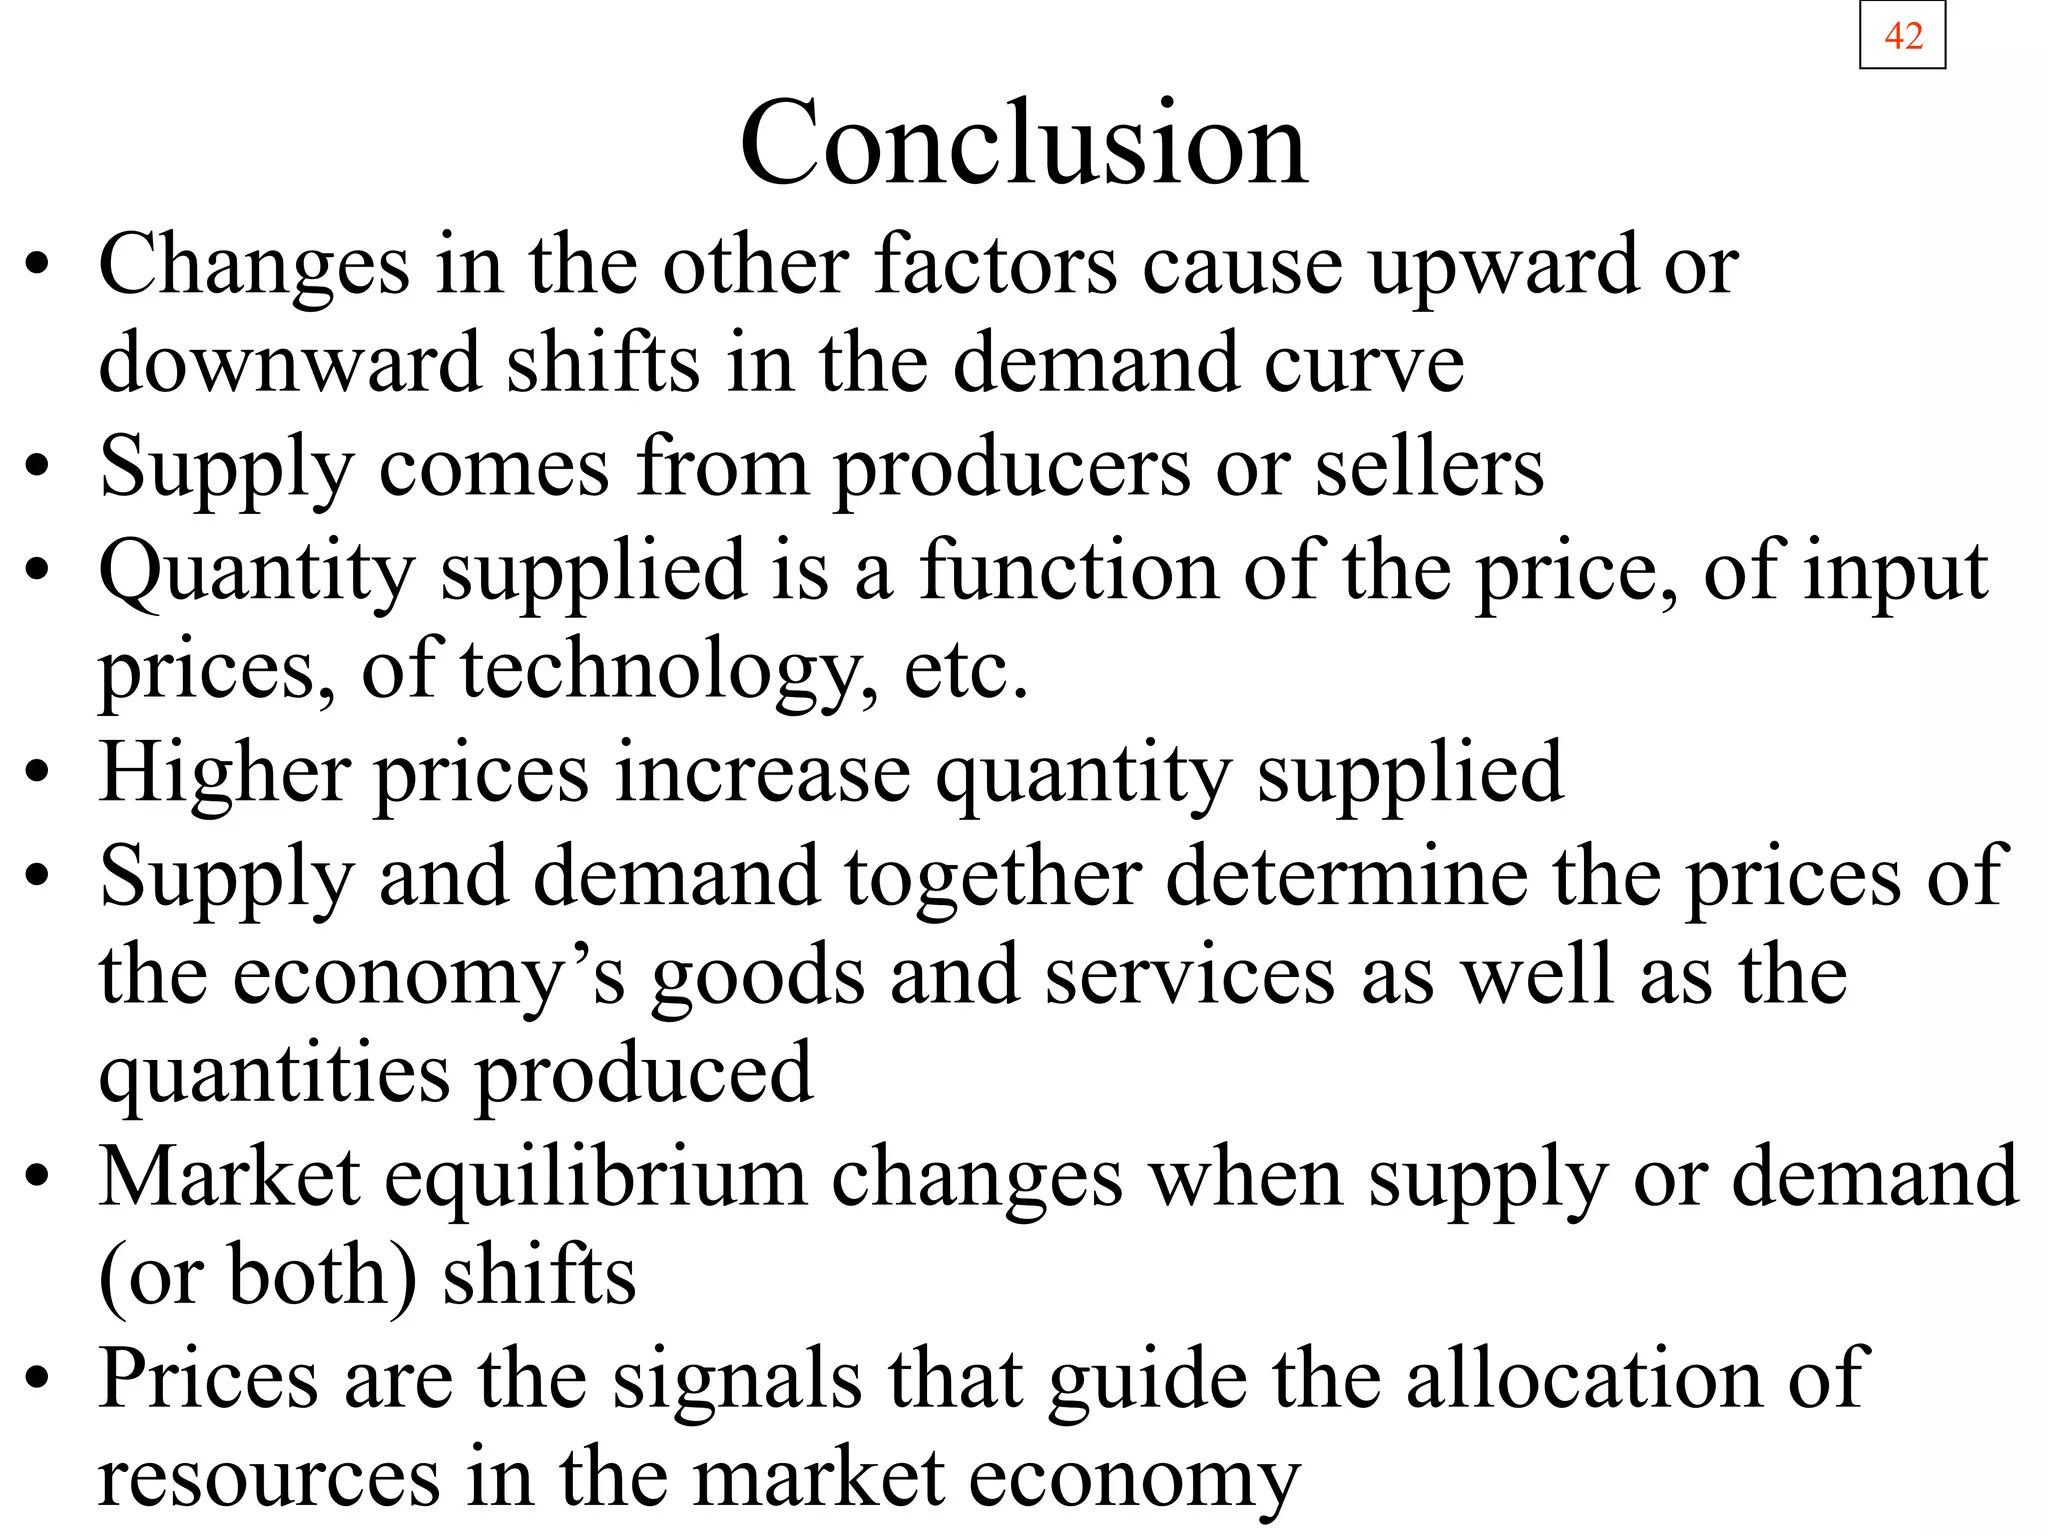
- The determinants of supply and how supply curves can shift from changes in input prices, technology, and expectations.
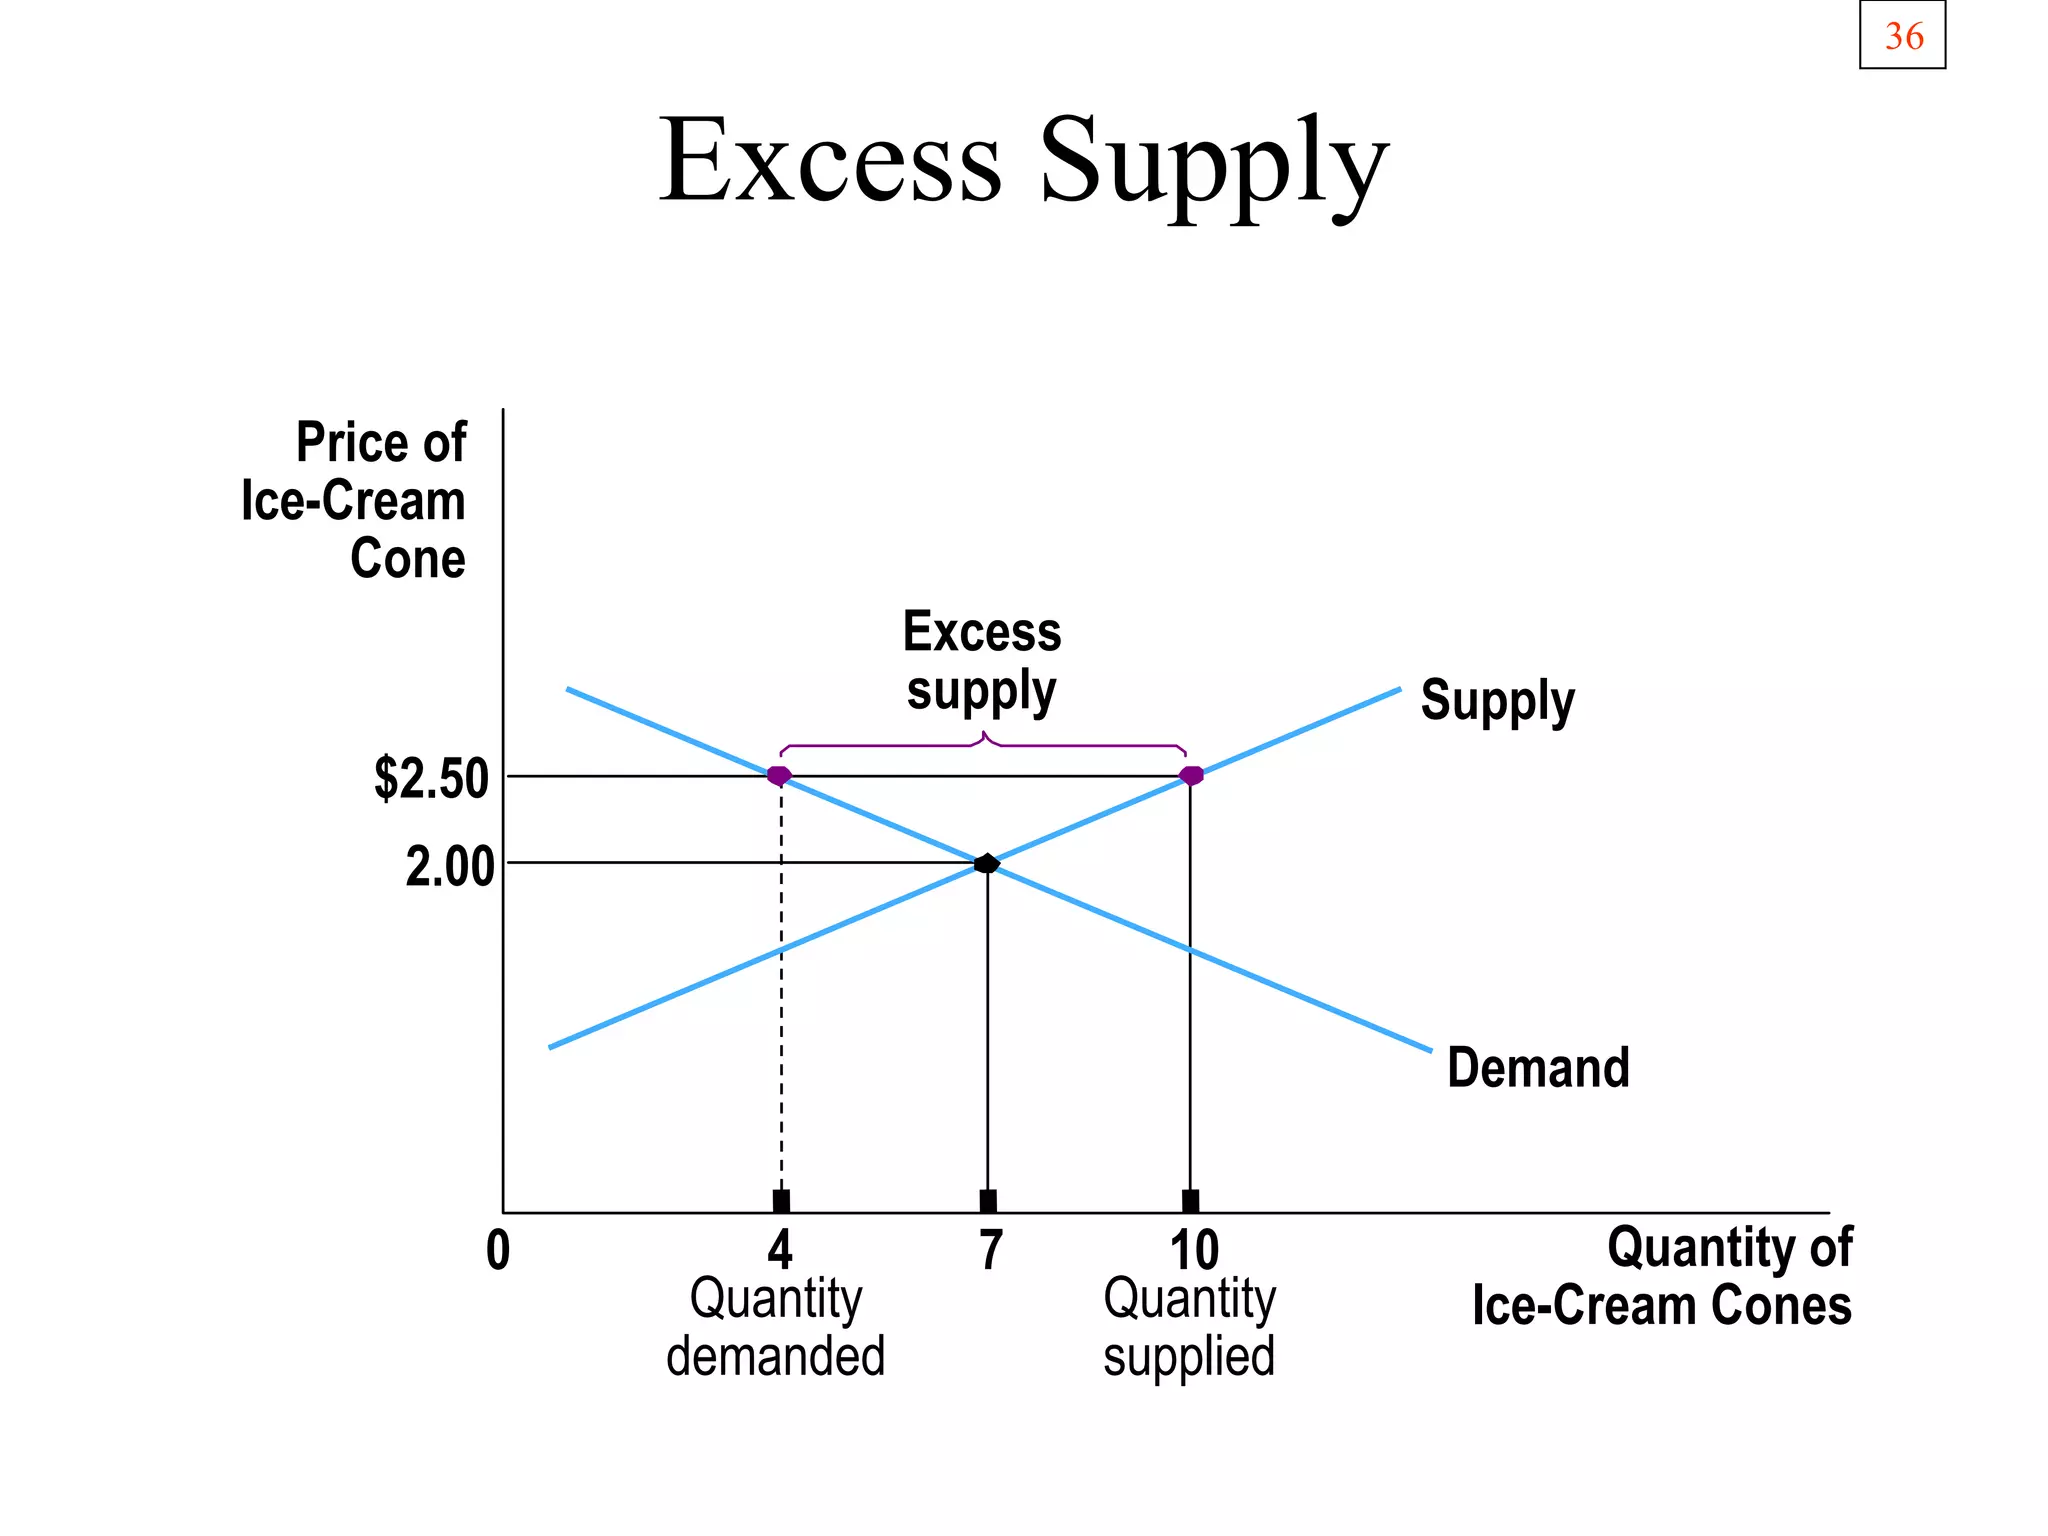
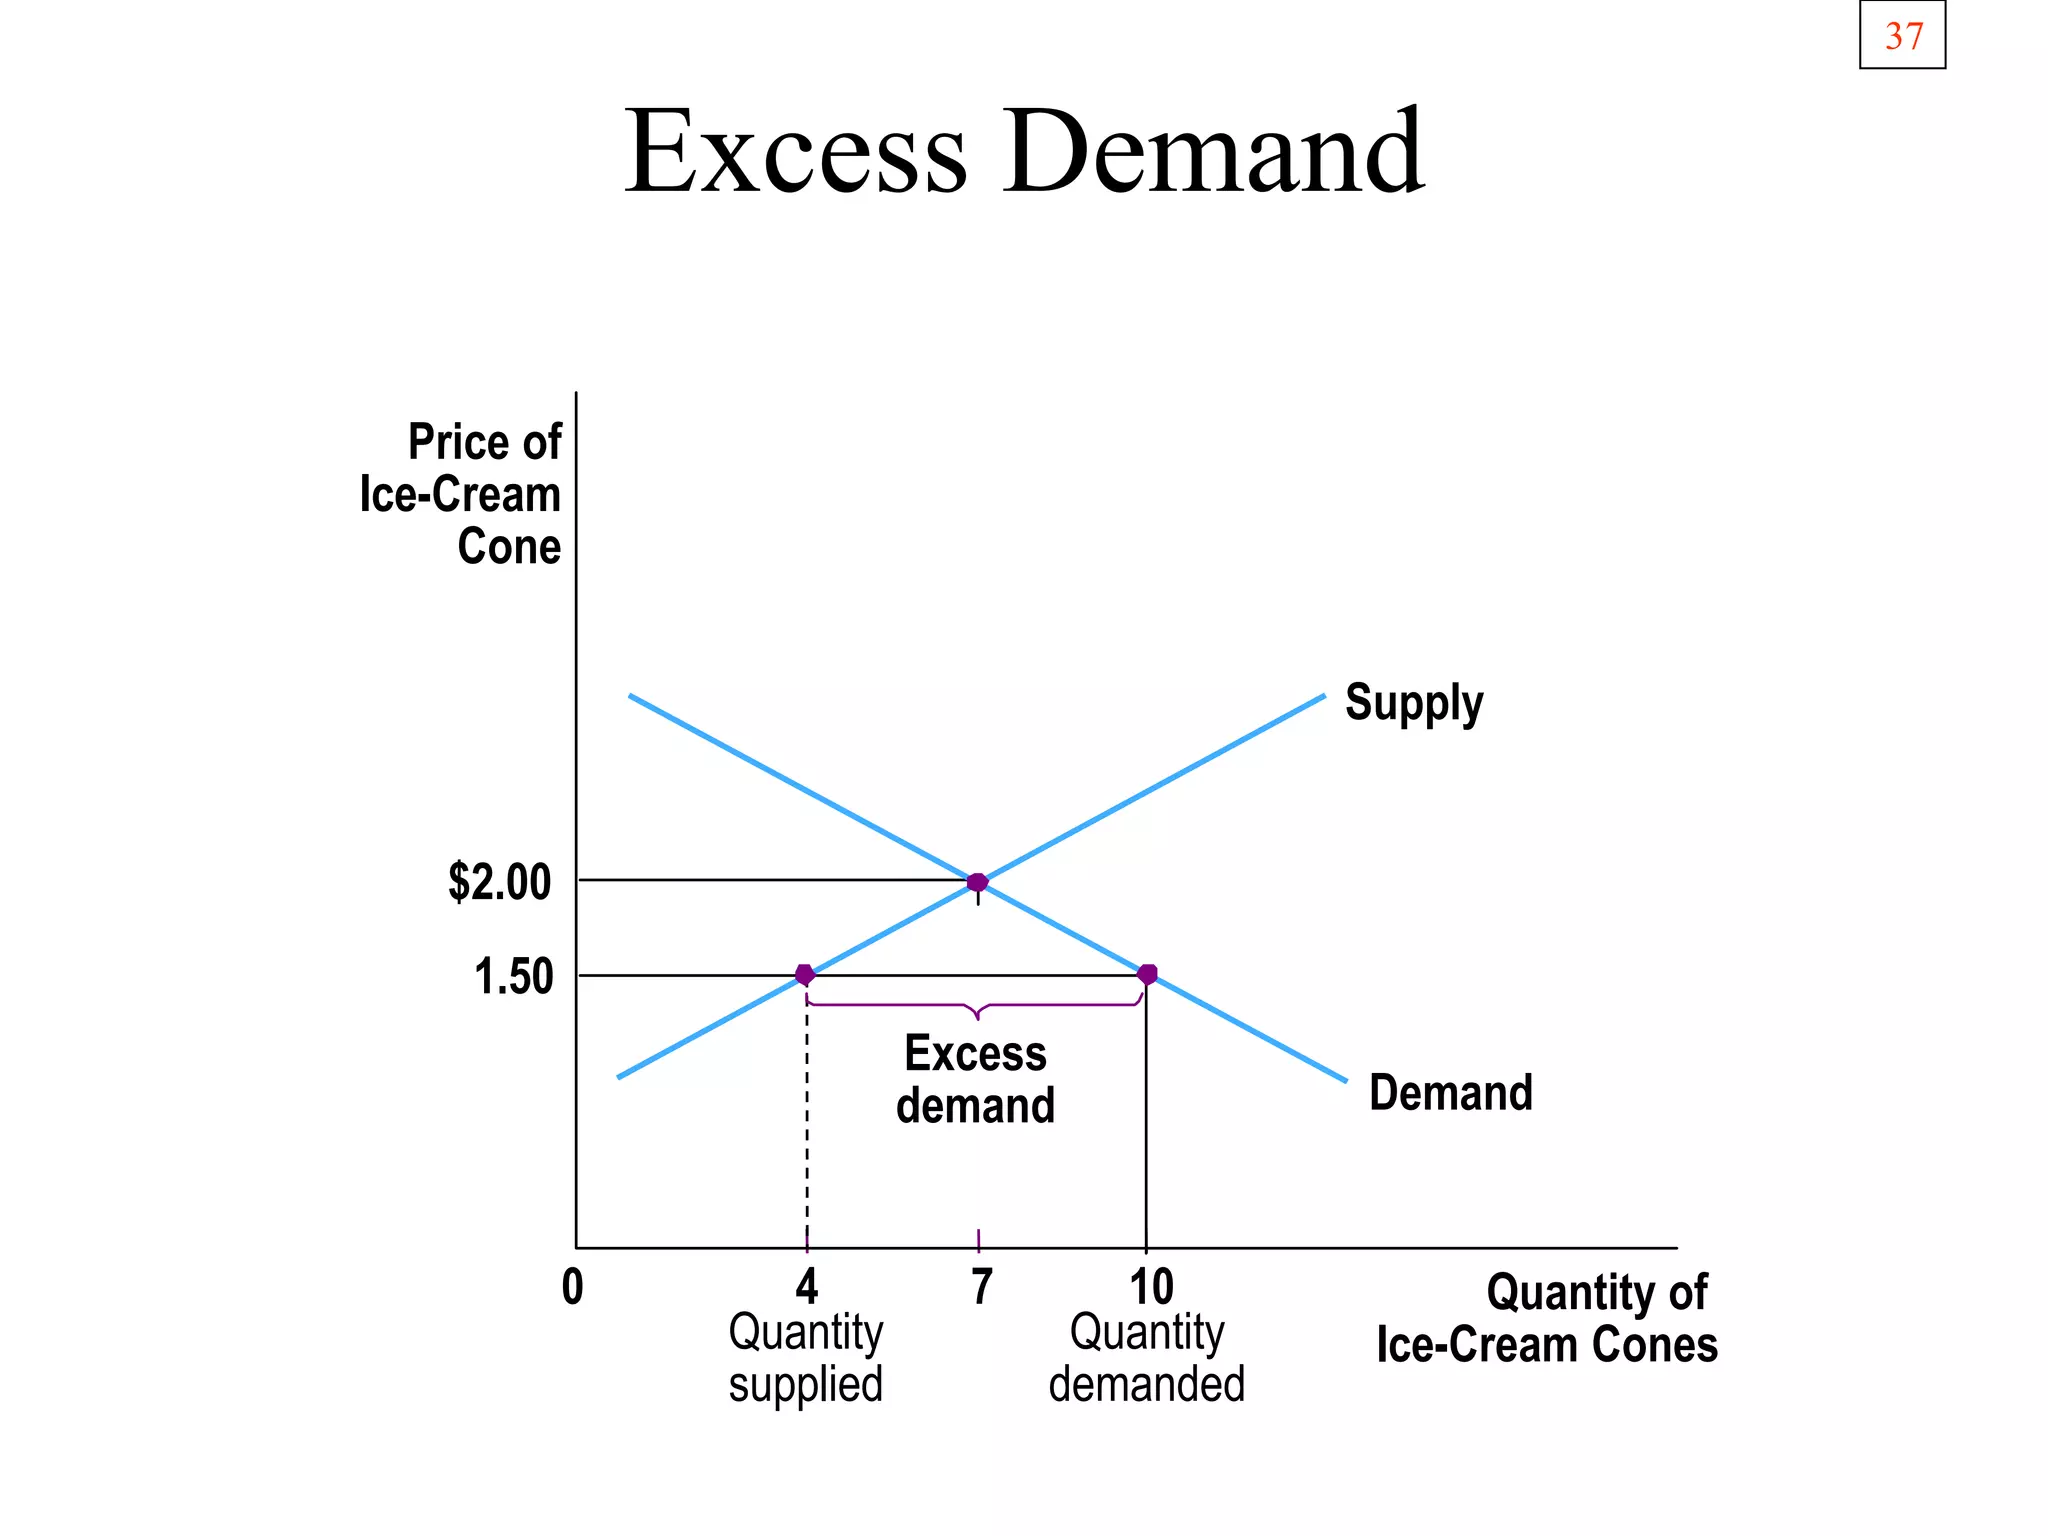
- How supply and demand interact in equilibrium to establish price and quantity, and what occurs in situations of excess supply or demand.
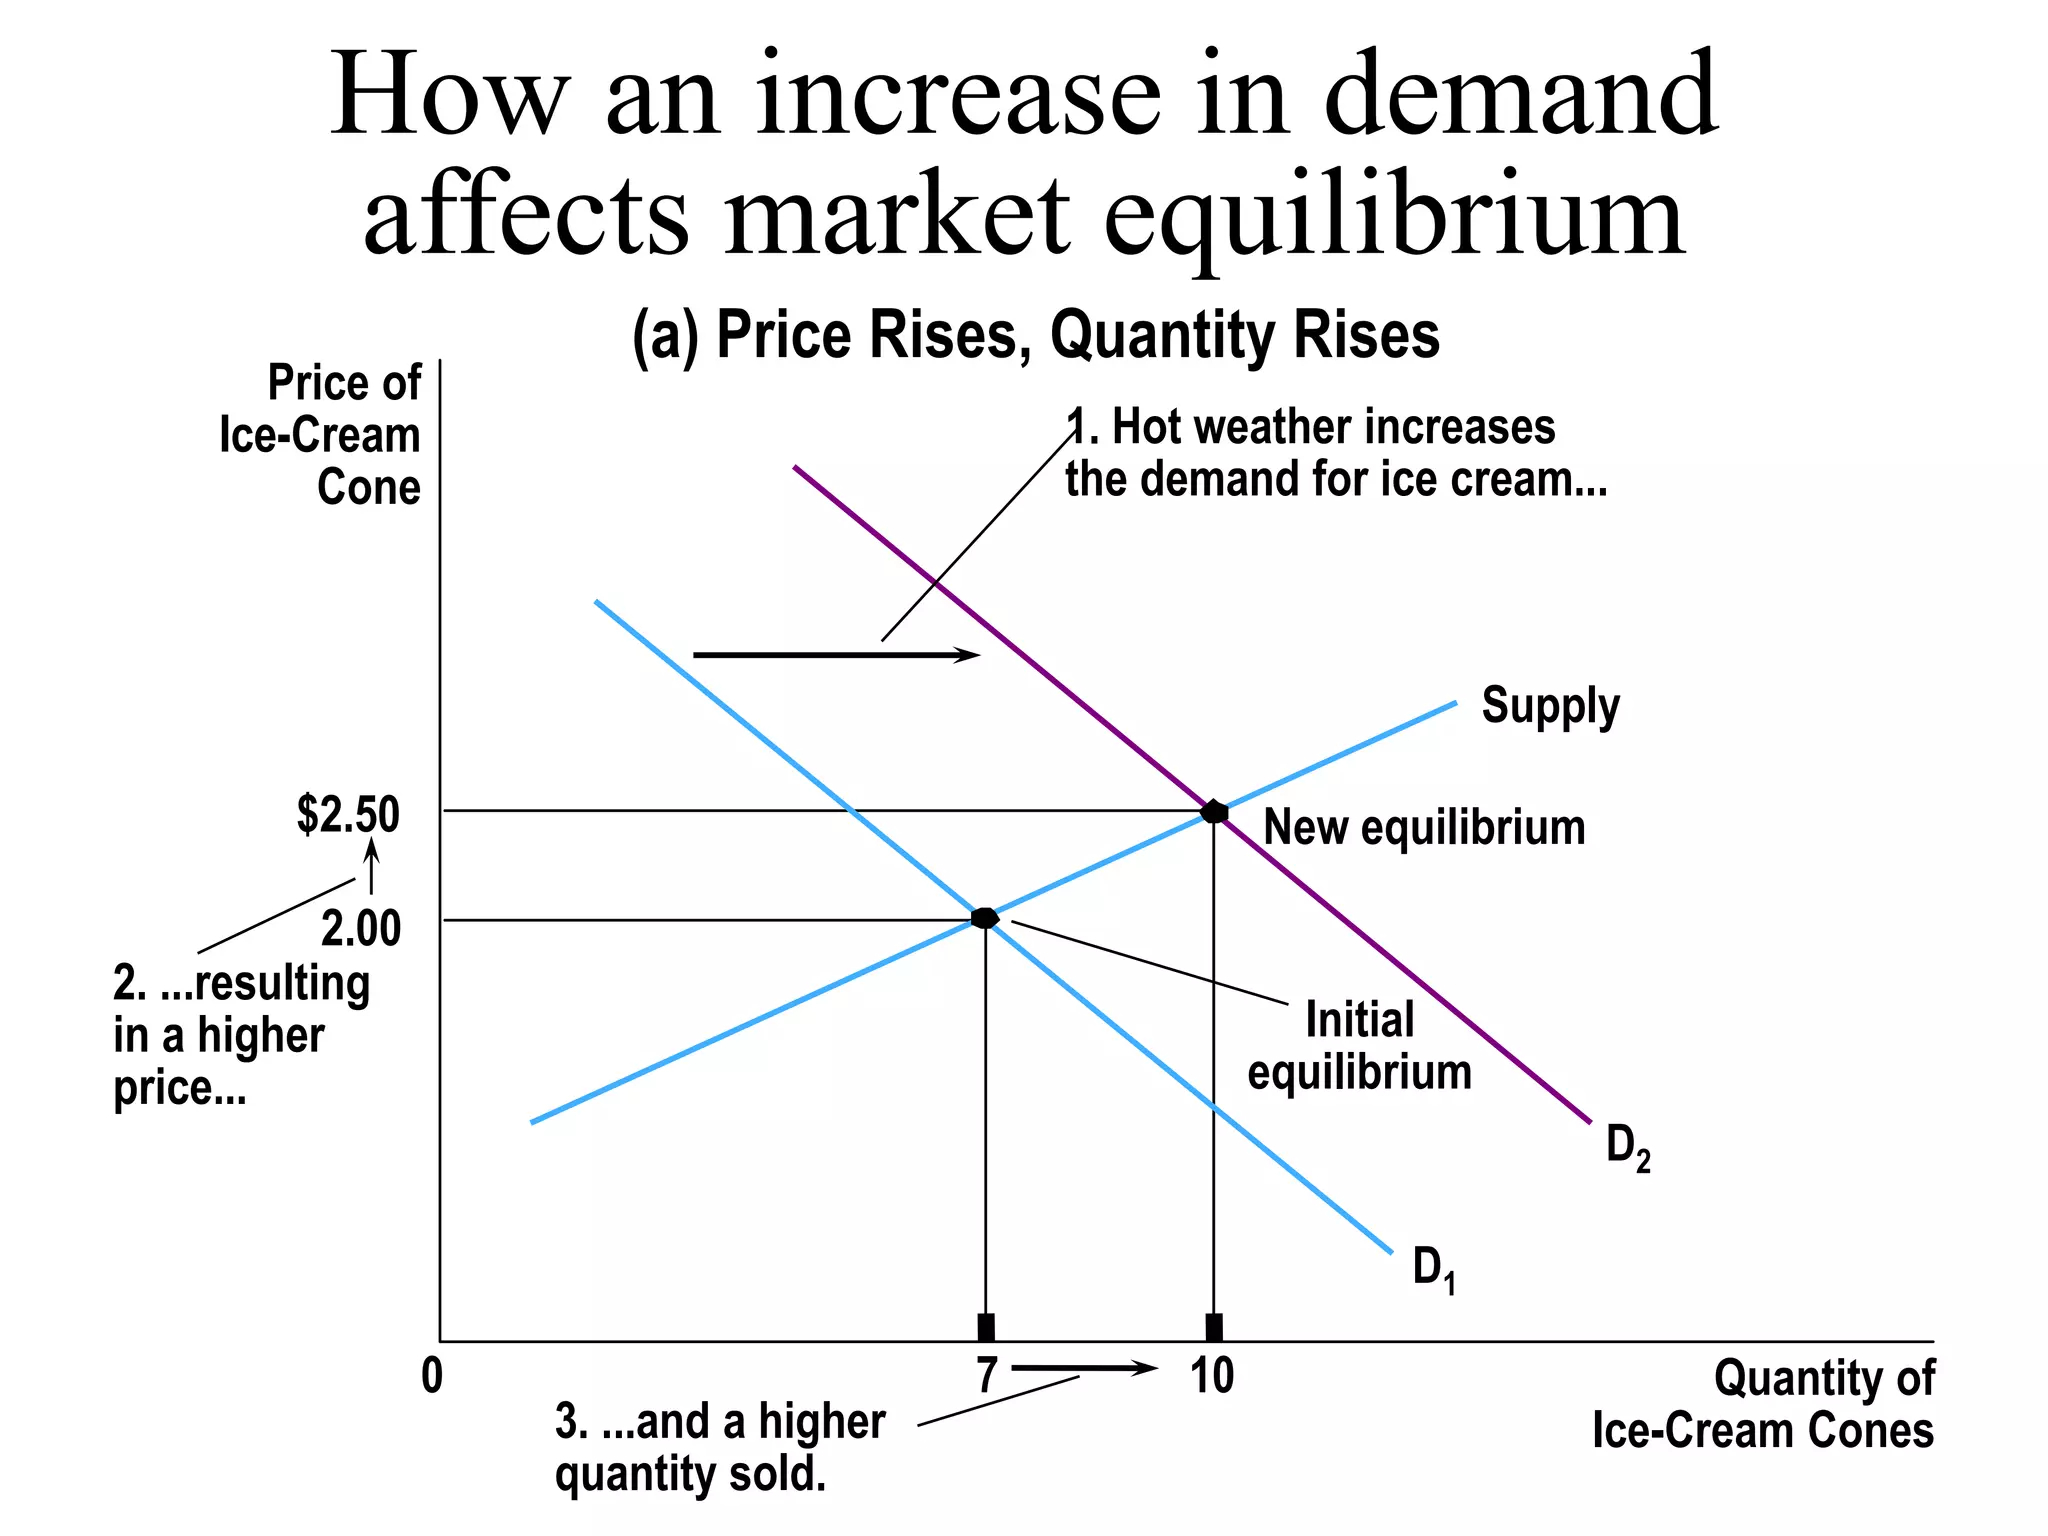
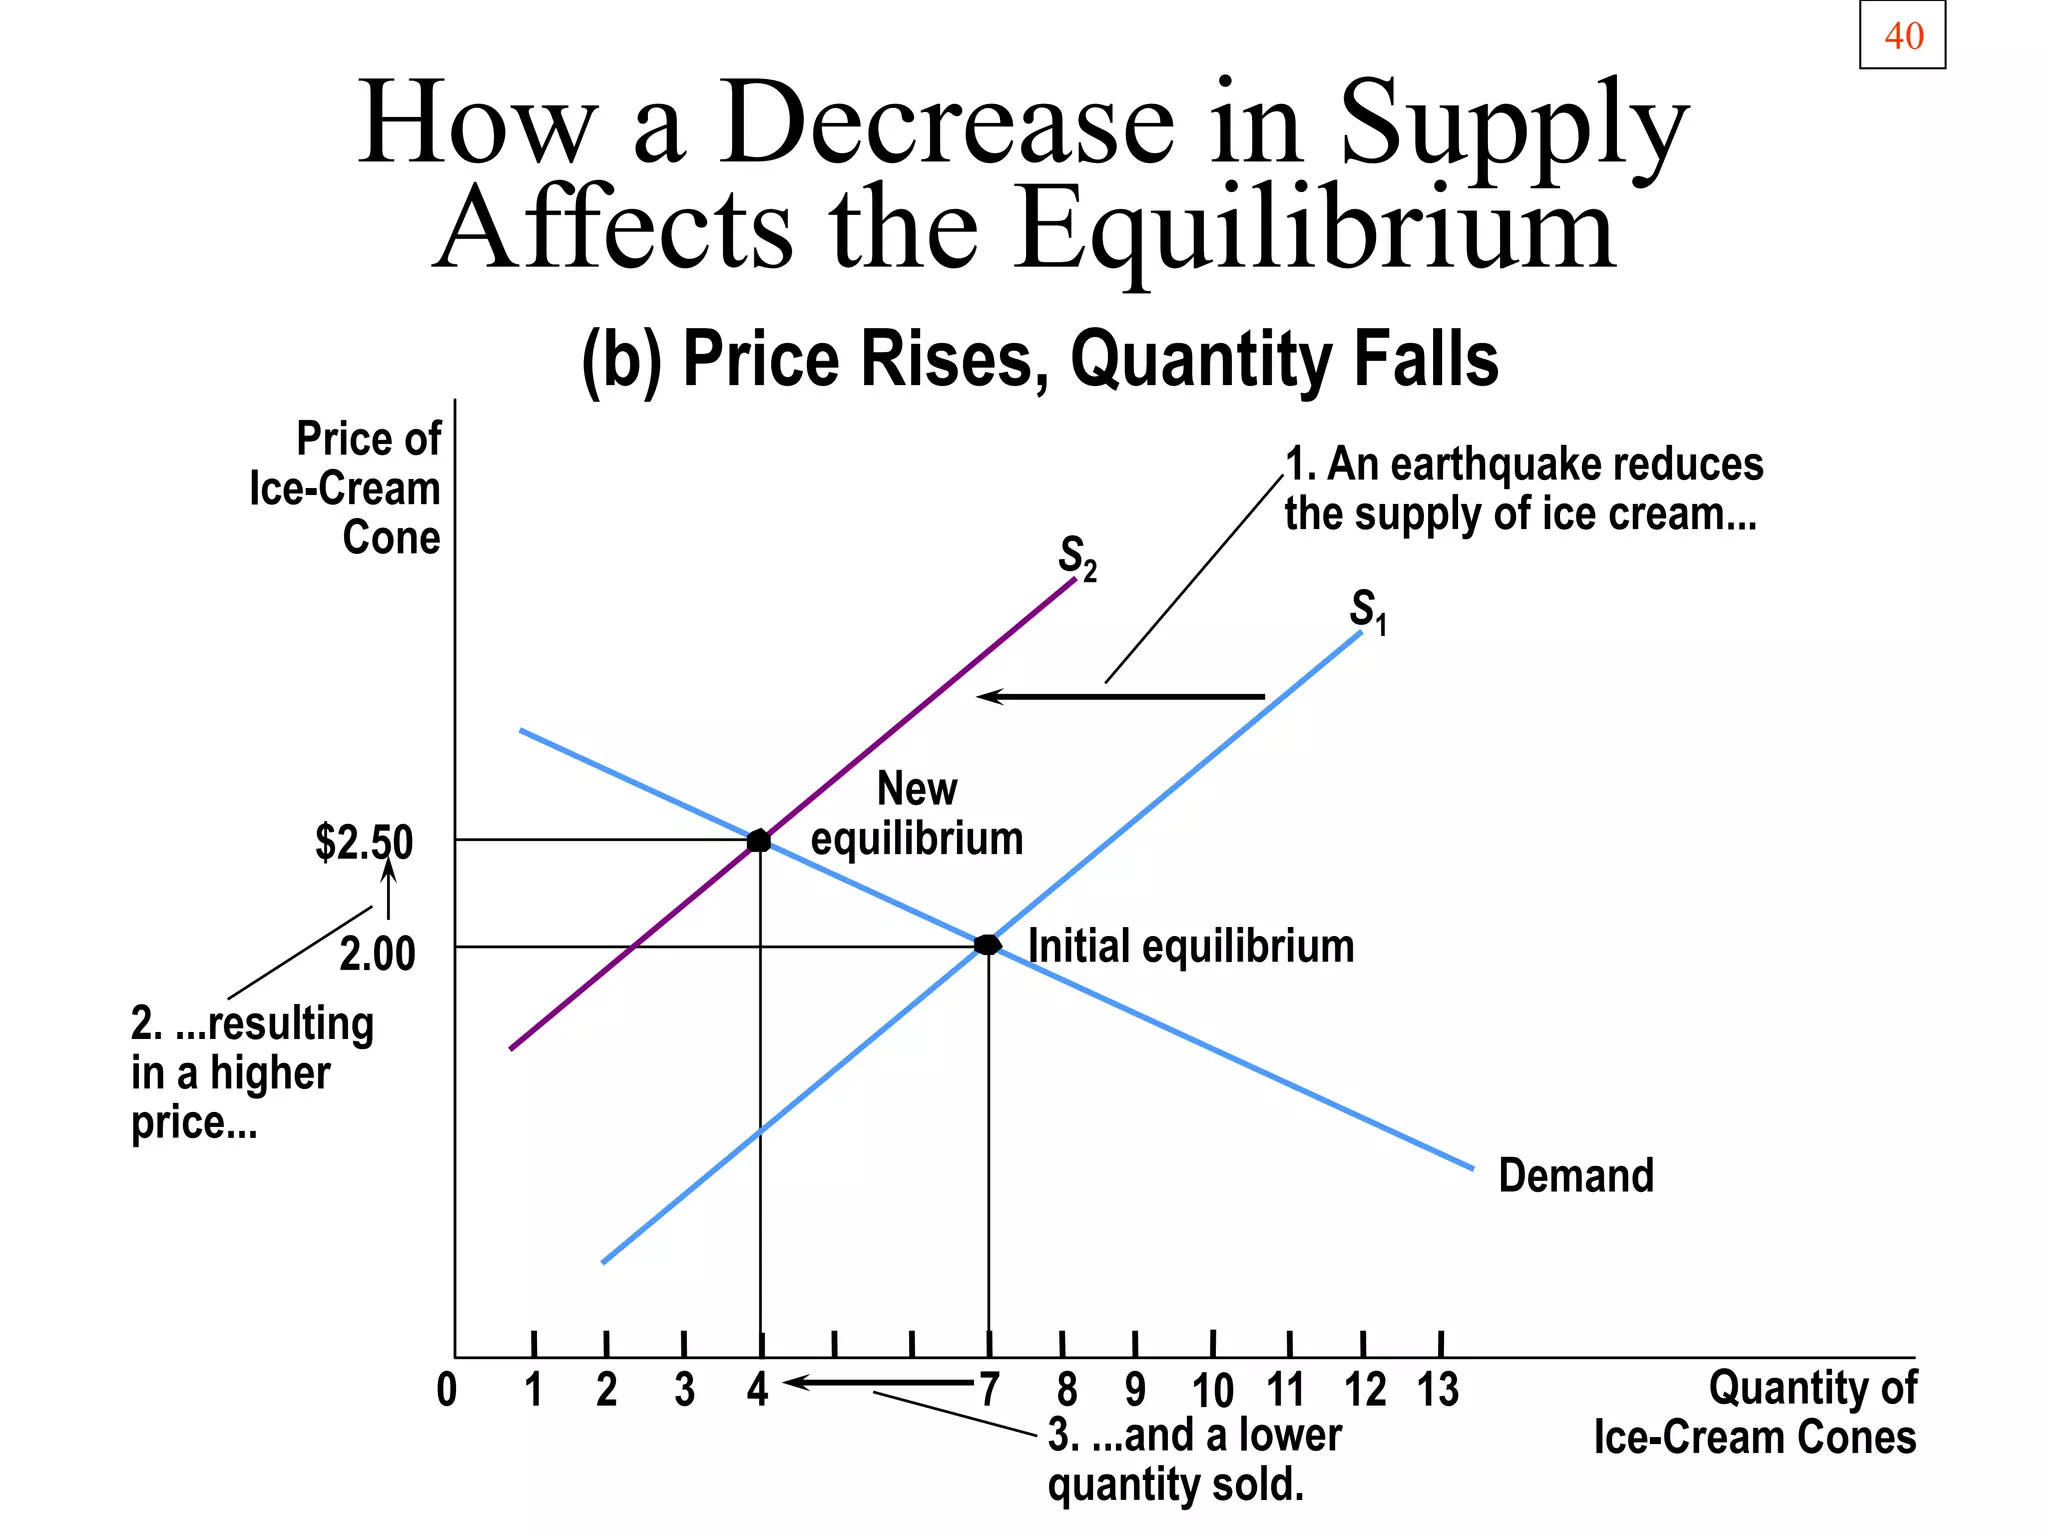
- How equilibrium changes in response to shifts in
Supply Demand and Equilibrium..
Market Exchange..
Law of Supply...
Law of Demand...
Laws of supply and demand versus the “theory of supply and demand”
Laws vs. Theory of Supply and Demand..
Different types of demand..
Market Supply ..
Demand Curve..
Supply Curve..
Market Equilibrium..
Elasticity..
Own price elasticity of demand..
SAS codes and tricks Comprehensive all codessrizrazariz
https://www.dropbox.com/sh/s12ibnz9e14sn7d/AADmeewvF8Q2gfHwRMKMd_Jda?dl=0
sas useful codes and tricks
https://www.dropbox.com/sh/s12ibnz9e14sn7d/AADmeewvF8Q2gfHwRMKMd_Jda?dl=0
https://www.dropbox.com/s/zihi3ns1wdrd7y1/ALLL%20CODESSS.txt?dl=0
https://www.dropbox.com/s/8ef11jo0ej7e57r/ALLL%20CODESSS.docx?dl=0
https://www.dropbox.com/sh/bgwcv8t450p66nx/AAAnNdElAwfxqc20GPz0dRLza?dl=0
SAS CODES AND TRICKS FOR BASIC DATA ANALYSIS
Cracking the Workplace Discipline Code Main.pptxWorkforce Group
Cultivating and maintaining discipline within teams is a critical differentiator for successful organisations.
Forward-thinking leaders and business managers understand the impact that discipline has on organisational success. A disciplined workforce operates with clarity, focus, and a shared understanding of expectations, ultimately driving better results, optimising productivity, and facilitating seamless collaboration.
Although discipline is not a one-size-fits-all approach, it can help create a work environment that encourages personal growth and accountability rather than solely relying on punitive measures.
In this deck, you will learn the significance of workplace discipline for organisational success. You’ll also learn
• Four (4) workplace discipline methods you should consider
• The best and most practical approach to implementing workplace discipline.
• Three (3) key tips to maintain a disciplined workplace.
Falcon stands out as a top-tier P2P Invoice Discounting platform in India, bridging esteemed blue-chip companies and eager investors. Our goal is to transform the investment landscape in India by establishing a comprehensive destination for borrowers and investors with diverse profiles and needs, all while minimizing risk. What sets Falcon apart is the elimination of intermediaries such as commercial banks and depository institutions, allowing investors to enjoy higher yields.
Implicitly or explicitly all competing businesses employ a strategy to select a mix
of marketing resources. Formulating such competitive strategies fundamentally
involves recognizing relationships between elements of the marketing mix (e.g.,
price and product quality), as well as assessing competitive and market conditions
(i.e., industry structure in the language of economics).
The key differences between the MDR and IVDR in the EUAllensmith572606
In the European Union (EU), two significant regulations have been introduced to enhance the safety and effectiveness of medical devices – the In Vitro Diagnostic Regulation (IVDR) and the Medical Device Regulation (MDR).
https://mavenprofserv.com/comparison-and-highlighting-of-the-key-differences-between-the-mdr-and-ivdr-in-the-eu/
Improving profitability for small businessBen Wann
In this comprehensive presentation, we will explore strategies and practical tips for enhancing profitability in small businesses. Tailored to meet the unique challenges faced by small enterprises, this session covers various aspects that directly impact the bottom line. Attendees will learn how to optimize operational efficiency, manage expenses, and increase revenue through innovative marketing and customer engagement techniques.
Discover the innovative and creative projects that highlight my journey throu...dylandmeas
Discover the innovative and creative projects that highlight my journey through Full Sail University. Below, you’ll find a collection of my work showcasing my skills and expertise in digital marketing, event planning, and media production.
Business Valuation Principles for EntrepreneursBen Wann
This insightful presentation is designed to equip entrepreneurs with the essential knowledge and tools needed to accurately value their businesses. Understanding business valuation is crucial for making informed decisions, whether you're seeking investment, planning to sell, or simply want to gauge your company's worth.
Premium MEAN Stack Development Solutions for Modern BusinessesSynapseIndia
Stay ahead of the curve with our premium MEAN Stack Development Solutions. Our expert developers utilize MongoDB, Express.js, AngularJS, and Node.js to create modern and responsive web applications. Trust us for cutting-edge solutions that drive your business growth and success.
Know more: https://www.synapseindia.com/technology/mean-stack-development-company.html
RMD24 | Retail media: hoe zet je dit in als je geen AH of Unilever bent? Heid...BBPMedia1
Grote partijen zijn al een tijdje onderweg met retail media. Ondertussen worden in dit domein ook de kansen zichtbaar voor andere spelers in de markt. Maar met die kansen ontstaan ook vragen: Zelf retail media worden of erop adverteren? In welke fase van de funnel past het en hoe integreer je het in een mediaplan? Wat is nu precies het verschil met marketplaces en Programmatic ads? In dit half uur beslechten we de dilemma's en krijg je antwoorden op wanneer het voor jou tijd is om de volgende stap te zetten.
3.0 Project 2_ Developing My Brand Identity Kit.pptxtanyjahb
A personal brand exploration presentation summarizes an individual's unique qualities and goals, covering strengths, values, passions, and target audience. It helps individuals understand what makes them stand out, their desired image, and how they aim to achieve it.
Digital Transformation and IT Strategy Toolkit and TemplatesAurelien Domont, MBA
This Digital Transformation and IT Strategy Toolkit was created by ex-McKinsey, Deloitte and BCG Management Consultants, after more than 5,000 hours of work. It is considered the world's best & most comprehensive Digital Transformation and IT Strategy Toolkit. It includes all the Frameworks, Best Practices & Templates required to successfully undertake the Digital Transformation of your organization and define a robust IT Strategy.
Editable Toolkit to help you reuse our content: 700 Powerpoint slides | 35 Excel sheets | 84 minutes of Video training
This PowerPoint presentation is only a small preview of our Toolkits. For more details, visit www.domontconsulting.com
LA HUG - Video Testimonials with Chynna Morgan - June 2024Lital Barkan
Have you ever heard that user-generated content or video testimonials can take your brand to the next level? We will explore how you can effectively use video testimonials to leverage and boost your sales, content strategy, and increase your CRM data.🤯
We will dig deeper into:
1. How to capture video testimonials that convert from your audience 🎥
2. How to leverage your testimonials to boost your sales 💲
3. How you can capture more CRM data to understand your audience better through video testimonials. 📊
What is the TDS Return Filing Due Date for FY 2024-25.pdfseoforlegalpillers
It is crucial for the taxpayers to understand about the TDS Return Filing Due Date, so that they can fulfill your TDS obligations efficiently. Taxpayers can avoid penalties by sticking to the deadlines and by accurate filing of TDS. Timely filing of TDS will make sure about the availability of tax credits. You can also seek the professional guidance of experts like Legal Pillers for timely filing of the TDS Return.
What is the TDS Return Filing Due Date for FY 2024-25.pdf
ch04.ppt
1. 1
THE MARKET FORCES OF
SUPPLY AND DEMAND
Chapter 4
PART TWO: SUPPLY AND DEMAND
I:
HOW MARKETS WORK
2. 2
What we learn in Part Two?
• Part Two introduces the model of supply and
demand in a market economy
• Supply and demand is the basic tool of economic
analysis
• In Principle Five and Chapter 3 we learned that
specialisation and trade makes everybody better off
• Principle Five tells us that markets are a good way
to organise economic activity
• Now we must see how markets work to achieve this
result
• Markets work through supply and demand
3. 3
Plan of Part Two
• There are three chapters in Part Two
• Chapter 4: Market forces of supply and demand
• It introduces the concept of supply and demand
along with other basic concepts such as competition,
market type, etc.
• Chapter 5: Elasticity and its applications
• It is about the relation between changes in prices and
changes in quantities
• Chapter 6: Supply, demand and government policies
• The tools of supply and demand are used to evaluate
different government policies towards markets
4. 4
Plan of this chapter
• We start by defining market types such as
competition, monopoly, oligopoly, etc.
• Then examine the factors that determine the demand
for a good or service in a competitive market
• Next we look at the determinants of the supply of a
good or service again in a competitive market
• Supply and demand come together to set the price of
the good or service and the quantity sold
• We establish how changes in demand or in supply
conditions affect the price and quantity
• And look at the key role of prices in allocation
scarce resources of society
5. 5
Market forces of
supply and demand
• Supply and demand are certainly the two words that
economists use most often
• Supply and demand are the forces that make market
economies work efficiently
• Supply and demand determine the quantity of each
good produced and the price at which it is sold
• Any event or policy that affects the economy will
work through its impact on supply and demand of
some goods
• Modern microeconomics is about supply, demand,
and the market equilibrium that results from their
interaction
6. 6
Markets
• The terms supply and demand refer to the behavior
of people as they interact with one another in
markets
• A market is a group of buyers and sellers of a
particular good or service
– Buyers determine demand
– Sellers determine supply
• Some markets are formally organised with a
building, etc. such as the Stock Market,
Commodities Market, etc.
• Most markets are not formally organised but they
exist because buyers and sellers know them
• People know where to go to buy a car, bread, etc.
7. 7
A Competitive Market
• A competitive market is a market
– with many buyers and sellers
– that is not controlled by any one person
– in which a narrow range of prices are
established that buyers and sellers act upon
• The number of buyers and sellers are an important
part of the definition of competition
• The second element is that a buyer or seller cannot
influence prices by his own actions alone
• When these two characteristics exist the market is
called competitive
8. 8
Types of markets
• Economic theory distinguishes among four different
types of markets
• Perfect Competition
– Competitive market where products are the same
• Monopoly
– One seller, and seller controls price
• Oligopoly
– Few sellers
– Not always aggressive competition
• Monopolistic Competition
– Many sellers
– Differentiated products
9. 9
The Concept of Demand
• We begin our analysis of demand by examining the
behaviour of buyers in the market for a good or
service
• Quantity demanded is the amount of a good that
buyers are willing and able to purchase
• Quantitiy demanded will vary with the price of the
good in question
• The demand schedule is a table that shows the
relationship between the price of the good and the
quantity demanded
• The demand curve is the downward-sloping line
relating price to quantity demanded
• Market demand is the sum of individual demands
11. 11
Law of Demand
• The law of
demand states that
there is an inverse
relationship
between price and
quantity
demanded.
Price of
Ice-Cream
Cone
1.50
2.00
2.50
$3.00
1.00
0.50
0 1 2 3 4 5 6 7 8 9 10 11 12 Quantity of
Ice-Cream Cones
12. 12
Determinants of Demand
• What are the factors that determine how much of a
product is bought in the market for that product?
• In the previous slides we looked at the demand for
ice cream
• What determines how much ice cream will be
bought?
– Market price of ice cream
– Consumer income
– Prices of related goods
– Tastes
– Expectations
– Number of consumers
13. 13
Demand function
• We can present the determinants of demand by the
symbols of a function
Q = F ( P , Y , Pn , Pe , a )
• It is called the demand function
– P = price of the good or service
– Y = income
– Pn = prices of other goods and services
– Pe = expectations about the change in price
– a = fashion and tastes of consumers
14. 14
Demand function
• What is the meaning of the demand function
Q = F ( P , Y , Pn , Pe , a)
• We we look at the relation between price and
quantity demanded while we keep other factors as
constant
• In other words, P is the only independent variable,
the others are kept constant
• Changes in income, other prices, price expectations
and tastes will cause a shift in the demand curve
• Whereas changes in price only affect quantities
• Change in prices changes the quantity demanded by
not the demand function
15. 15
Changes in income: normal and
inferior goods
• Changes in income cause a shift in the demand
curve
• Usually the direction of the shift is upward
• In other words, higher income means more demand
for most goods at all prices
• These are called normal goods
• However, for some goods, an increase in income
may actually result in less demand or a downward
shift in the demand curve
• These are called inferior goods
• They are consumed by the very poor
16. 16
Effect of an increase in income:
normal good
• As income
increases the
demand for a
normal good
will increase.
Price of
Ice-Cream
Cones
Quantity of
Ice-Cream Cones
Demand
curve, D 1
Demand
curve, D 2
0
Increase
in demand
17. 17
Effect of an increase in income
inferior good
• As income
increases the
demand for
an inferior
good will
decrease.
Price of
Ice-Cream
Cones
Quantity of
Ice-Cream Cones
Demand curve, D 3
Demand
curve, D 1
0
Decrease
in demand
18. 18
Prices of Related Goods
• The effects of changes in the prices of related goods
depend on the characteristics of the goods
• Two goods are called substitutes if they represent
similar goods for the consumer: beans or chick peas
are close substitutes
• A fall in the price of a substitute will reduce demand
for a good (demand curve shifts down)
• Two goods are called complements when consuming
one entails consuming the other: a car and tyres
• A fall in the price of a complement will increase
demand for a good (demand curve shifts up)
19. 19
Ceteris Paribus
• Attention to one aspect of the analysis so far
• We change one constant at a time while we keep the
others constant
• For example, when we look at the effect of a change
in income we keep the prices of related products
plus tastes plus price expectations unchanged
• Economic theory uses a short-cut to express this
method
• Ceteris paribus is a Latin phrase that means that all
variables other than the ones being studied are
assumed to be constant
20. 20
Change in Quantity Demanded
versus Change in Demand
• The distinction between change in demand and
change in quantity demanded is vital to understand
the analysis of demand
• Change in Quantity Demanded
– Movement along the demand curve.
– Caused by a change in the price of the product
• Change in Demand
– A shift in the demand curve, either to the left or
right
– Caused by a change in a determinant other than
the price (income, tastes, etc)
21. 21
Variables that
Affect Quantity Demanded A Change in This Variable . . .
Price Represents a movement along
the demand curve
Income Shifts the demand curve
Prices of related goods Shifts the demand curve
Tastes Shifts the demand curve
Expectations Shifts the demand curve
Number of buyers Shifts the demand curve
Change in Quantity Demanded
versus Change in Demand
22. 22
Changes in Quantity Demanded
Price of
Cigarettes,
per Pack
D1
0 12 20
$4.00
2.00
A tax that raises the price of
cigarettes results in a movement
along the demand curve.
Number of Cigarettes
Smoked per Day
23. 23
Changes in Quantity Demanded
Price of
Cigarettes,
per Pack
D1
0 12 20
$4.00
2.00
C
A
A tax that raises the price of
cigarettes results in a movement
along the demand curve.
Number of Cigarettes
Smoked per Day
24. 24
Change in Demand
Price of
Cigarettes,
per Pack
Number of Cigarettes
Smoked per Day
D2 D1
0 10 20
$2.00
B A
A policy to discourage
smoking shifts the
demand curve to the left.
25. 25
The Concept of Supply
• Goods and services are supplied to the market by
producers who are also sellers
• Supply looks at the behaviour of the producers
• Quantity supplied is the amount of a good or
service that sellers are willing and able to sell
• What determines the quantitiy supplied?
– Market price of the good or service
– Input prices (of those used in its production)
– Technology (with which it was produced)
– Expectations about the future level of prices
– Number of producers of the good or service
26. 26
Law of Supply
• The law of supply states that there is a direct
(positive) relationship between price and the
quantity supplied
• At higher prices there will be higher quantities of the
good or service supplied
• The supply schedule is a table that shows the
relationship between the price of the good or service
and the quantity supplied
• The supply curve is the upward-sloping line relating
price to quantity supplied
• Market supply curve is the sum of the supply curves
of the individual producers
28. 28
Change in Quantity Supplied
versus Change in Supply
• As in the demand, attention must be paid to the
difference between changes in the supply and
changes in the quantity supplied
• Change in Quantity Supplied
– Movement along the supply curve
– Caused by a change in the market price of the
product
• Change in Supply
– A shift in the supply curve, either to the left or
right
– Caused by a change in a determinant other than
price (input prices, technology, expectations, etc)
29. 29
Change in Quantity Supplied
versus Change in Supply
Variables that
Affect Quantity Supplied A Change in This Variable . . .
Price Represents a movement along
the supply curve
Input prices Shifts the supply curve
Technology Shifts the supply curve
Expectations Shifts the supply curve
Number of sellers Shifts the supply curve
30. 30
Increase in Supply
Price of
Ice-Cream
Cone
Quantity of
Ice-Cream Cones
0
Increase
in supply
Supply
curve, S1
Supply
curve, S2
31. 31
Decrease in Supply
Price of
Ice-Cream
Cone
Quantity of
Ice-Cream Cones
0
Decrease
in supply
Supply curve, S3
Supply
curve, S1
32. 32
Supply and demand together
• Market works by the interaction of supply and
demand
• Now we can see how the two come together
• Market equilibrium corresponds to a price where
quantitiy demanded and supplied is equal
• Equilibrium Price
– The price that balances supply and demand. On a
graph, it is the price at which the supply and
demand curves intersect
• Equilibrium Quantity
– The quantity that balances supply and demand.
On a graph it is the quantity at which the supply
and demand curves intersect
33. 33
Equilibrium of Supply and
Demand
Quantity of
Ice-Cream Cones
Price of
Ice-Cream
Cone
$2.00
0 1 2 3 4 5 6 7 8 9 10 11 12 13
Supply
Demand
34. 34
Equilibrium of Supply and
Demand
Quantity of
Ice-Cream Cones
Price of
Ice-Cream
Cone
$2.00
0 1 2 3 4 5 6 7 8 9 10 11 12 13
Equilibrium
quantity
Equilibrium price Equilibrium
Supply
Demand
35. 35
Markets Not in Equilibrium
• To understand the meaning of market equilibrium
we can look at a market not in equilibrium
• Outside of equilibrium there will be either unsold
products or unsatisfied customer demand
• Excess Supply
– Price is above equilibrium price
– Producers are unable to sell all they want at the
going price
• Excess Demand
– Price is below equilibrium price
– Consumers are unable to buy all they want at the
going price
38. 38
Changes in Equilibrium
• For market equilibrium to change one or more of the
determinants of demand or supply must have
changes
• When faced with an event or policy that affects the
market
• First, we must try to understand whether the event
shifts the supply or demand curve (or both)
• Then we search for the direction of the shift(s) in the
curve(s): upward or downward
• Only then can we determine the impact of the event
or policy on the equilibrium price and quantities
• And also the direction of the change
39. How an increase in demand
affects market equilibrium
Price of
Ice-Cream
Cone
2.00
$2.50
0 7 10 Quantity of
Ice-Cream Cones
Supply
New equilibrium
Initial
equilibrium
D1
D2
3. ...and a higher
quantity sold.
2. ...resulting
in a higher
price...
1. Hot weather increases
the demand for ice cream...
(a) Price Rises, Quantity Rises
40. 40
How a Decrease in Supply
Affects the Equilibrium
Price of
Ice-Cream
Cone
2.00
$2.50
0 1 2 3 4 7 8 9 11 12 Quantity of
Ice-Cream Cones
13
Demand
New
equilibrium
Initial equilibrium
S1
S2
2. ...resulting
in a higher
price...
1. An earthquake reduces
the supply of ice cream...
3. ...and a lower
quantity sold.
10
(b) Price Rises, Quantity Falls
41. 41
Conclusion
• Trade happens in markets of different types, some
competitive other not
• Market economies harness the forces of supply and
demand
• Demand comes from the consumers
• Quantity demanded of a good depends on its price,
on income, on the prices of related goods, on
expectation, on tastes and fashion
• When we analyse demand, only the price is allowed
to change while the other factors are kept constant
(ceteris paribus)
• Quantity demanded is a decreasing function of price
42. 42
Conclusion
• Changes in the other factors cause upward or
downward shifts in the demand curve
• Supply comes from producers or sellers
• Quantity supplied is a function of the price, of input
prices, of technology, etc.
• Higher prices increase quantity supplied
• Supply and demand together determine the prices of
the economy’s goods and services as well as the
quantities produced
• Market equilibrium changes when supply or demand
(or both) shifts
• Prices are the signals that guide the allocation of
resources in the market economy