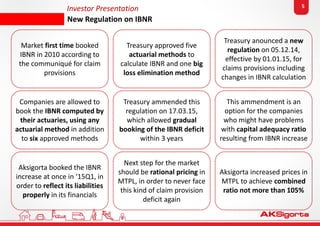
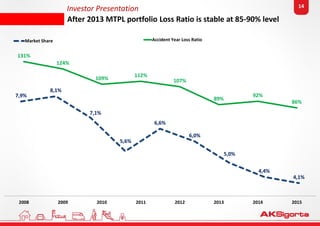
The document summarizes Aksigorta's financial results for the first quarter of 2015. Key points include:
- Net loss of TL 140 million for Q1 2015 due to a TL 183 million adjustment to increase motor third-party liability (MTPL) claim provisions.
- Excluding MTPL, Q1 2015 net profit was TL 24 million and combined ratio was 97%.
- New regulations effective in 2015 required insurers to book incurred but not reported (IBNR) claims, significantly impacting MTPL provisions.
- Guidance for 2015 forecasts 9-12% gross written premium growth excluding MTPL, a 1-2 percentage point improvement in combined ratio also excluding MTPL, and over 50% growth
TCS recently reported its Q1FY15 results, which were in line on revenue front & at operating level. However, the net profits were above estimates, aided by higher other income. Buy on dips.
1) The company reported consolidated financial results for the first quarter of 2009 with revenues of NT$25.6 billion, down 20% quarter-over-quarter and 24% year-over-year.
2) Net income was NT$1.71 billion, down slightly from the previous quarter but earnings per share were NT$0.78.
3) By business segment, power systems continued to be the largest contributor with 59% of total revenues, followed by components at 19% and industrial and others at 22%.
The document provides an earnings release and conference call summary for a real estate company for the first quarter of 2015. It highlights that the company generated cash flow of R$63 million in 1Q15, saw a 27% increase in services revenue, and reduced its leverage ratio to 13%. Inventory levels increased 35% to R$855 million compared to the previous quarter. Deliveries decreased 88% to R$85 million in 1Q15. The company also discussed its financial results, capital structure, buyback program, and contacts for investor relations.
The document summarizes the company's 2010 fourth quarter and full year financial results. Some key points:
- Fourth quarter revenues decreased 6% year-over-year to NT$45.9 billion. Net income decreased 25% to NT$3.38 billion.
- For the full year 2010, revenues increased 38% to NT$171.3 billion compared to 2009. Net income rose 40% to NT$17.3 billion.
- Revenue growth was driven by increases in the power supply and component businesses.
The document provides operating and financial results for Equatorial Energia for 1Q12. Key highlights include:
- CEMAR's billed energy volume increased 12.2% year-over-year to 1,119 GWh. Energy losses decreased 0.9 percentage points to 20.7%.
- Net operating revenues increased 32.1% to R$545.8 million and EBITDA grew 17.9% to R$132.5 million.
- Net income was R$48.1 million, a decrease of 40.9% compared to 1Q11.
- Total investments increased 47.4% to R$118.5 million, with CEMAR's own cape
The document provides an overview and financial update for Telecom Italia Group for investor meetings in June 2015. Key points include: Total revenues for FY 2014 were €21.6 billion, down 5.4% YoY, with EBITDA of €8.8 billion down 6.8% YoY. Capex for FY 2014 was €5 billion, up 13.3% YoY including licenses. Net debt including licenses was €26.65 billion as of end of FY 2014. First quarter 2015 results show improvements in line with the company's 2015-2017 plan targets.
Telecom Italia Group FY 2013 Results - Piergiorgio PelusoGruppo TIM
This document provides a summary of Telecom Italia Group's FY 2013 results. Key highlights include:
- Net debt decreased from €28.3 billion to €26.8 billion due to positive operating free cash flow of €4.8 billion.
- Domestic cash costs were reduced by €497 million, achieving 111% of the annual target through efficiency gains.
- Plans are outlined to strengthen the capital position through various asset sales and refinancing activities projected to increase financial flexibility by over €4 billion.
- The company is launching a €0.5 billion bond buyback and focusing resources on investments to support its broadband upgrade plans in 2014.
The document provides financial results for Generali Group for the first quarter of 2015. Key highlights include:
- Operating result increased 6% to €1.326 billion driven by an 8% increase in the Life business.
- Net result grew 10% like-for-like to €682 million.
- Shareholders' equity increased 12.5% to €26.098 billion due to unrealized gains and the net result.
- Solvency I ratio strengthened to 168% from 156% at the end of 2014.
Get the financial highlights and an overview of our performance per business.
You can view our financial reports here: www.sgs.com/en/Our-Company/Investor-Relations/Financial-Reports
EXFO provides testing, monitoring and analytics solutions for telecommunications service providers. The document summarizes EXFO's strategy to increase market share in wireless and evolve into a solutions provider to deliver higher margins. It highlights key contract wins supporting network visibility and productivity. Management aims to balance sales growth with profitability, targeting an adjusted EBITDA margin of 15% in the medium term. Q1 2015 results showed sales growth and improved gross margin year-over-year.
Company Presentation and 2015-2017 Plan OutlineGruppo TIM
Telecom Italia Group held investor meetings in April 2015 to present its Company Presentation and 2015-2017 Plan Outline. The document contained forward-looking statements and disclaimers. It provided an overview of Telecom Italia Group's 2014 financial results including revenues of €21.6 billion (down 5.4% YoY) and EBITDA of €8.8 billion (down 6.8% YoY). Details were given on performance by market, capital expenditures, net debt, and shareholders. Market share data and trends for the fixed broadband, fixed voice, mobile, and Italian mobile markets were also reviewed.
First quarter 2015 financial results for TDS and U.S. Cellular:
- Total operating revenues for U.S. Cellular grew 4% year-over-year to $965 million, driven by a 90% increase in equipment sales revenues. Operating cash flow more than doubled to $167 million.
- TDS Telecom saw total operating revenues increase 7% to $280 million due to strong growth at TDS Cable from increased video, broadband, and voice connections. Adjusted EBITDA grew 10% to nearly $80 million.
- For 2015, U.S. Cellular increased guidance for operating cash flow to a range of $400-500 million and adjusted EBITDA
Ageas delivered a strong set of first half-year figures evidencing good progress with respect to our Ambition 2018 strategic plan. Life inflows continued to grow while at the same time we optimised the product mix in Belgium and Asia. The result of our Life activities remained strong in all segments. The Non-Life businesses in Belgium and Continental Europe realised excellent results which were reflected in outstanding combined ratios.
The document provides highlights and financial results for CTEEP for 1Q15. Net revenue increased 12.6% while net income decreased slightly by 1.3%. EBITDA grew by 3.2% and gross debt was reduced by 1.9%. Revenue growth was driven by increases in the construction, operation and maintenance, and financial sectors. Costs grew mainly due to increases in personnel expenses and contingencies. The financial result declined by 34.2% due to lower cash balances and interest rates.
The document discusses the importance of the public sector as a taxpayer segment for the Uganda Revenue Authority (URA). It notes that the public sector was previously largely ignored as a taxpayer, with few inspections, audits, or debt collection. To address this, URA established a Public Sector Office (PSO) in 2014. The PSO cleaned the public sector taxpayer register, increased education and awareness efforts, and improved monitoring of tax flows. As a result, revenue collections from the public sector grew substantially, increasing 193.9% from 2014/15 to 2015/16 and an additional 105.7% from 2015/16 to 2016/17. The success of the PSO is attributed to management support, engagement with government
Telecom Italia Group held a dbAccess TMT Conference on September 3rd, 2014. Marco Patuano, CEO of Telecom Italia Group, presented highlights from the second quarter of 2014. The presentation contained forward-looking statements and noted changes in reporting classifications. Key highlights from the second quarter included stable performance in line with the company's plan, with improving revenue trends in Italy and continued strong growth in mobile data demand and network investments in Brazil.
This document provides an overview and summary of Telecom Italia Group's 2Q 2015 results. It includes the following:
- Marco Patuano discusses key events in 2Q 2015 including improving revenue trends in domestic services, the INWIT IPO, real estate plan savings, and a reduction in net debt.
- Piergiorgio Peluso provides an analysis of financial results with details on revenues and EBITDA for various business segments.
- The presentation outlines progress in the domestic market including mobile and fixed broadband expansion, and simplification of consumer mobile offers.
- An update is given on the "Tutto Voce" campaign in consumer fixed telephony and its impact on churn rates
This document contains the agenda and presentation slides for Telecom Italia Group's 3Q 2015 results presentation. The presentation discusses recent highlights such as domestic performance and regulatory changes. It provides an overview of 3Q 2015 results including declines in total revenues and service revenues but improvements in mobile revenues. Charts and data are presented on key metrics like fixed broadband users, fiber coverage, mobile subscribers and ARPU, and EBITDA performance.
Interplex Holdings Ltd reported financial results for the fourth quarter of fiscal year 2015, with revenue increasing 57% year-over-year to $238.4 million. Gross profit margin improved from 14.2% to 17.3% over the same period. Profit after tax also increased substantially, growing from $2 million in 4QFY14 to $18.3 million in 4QFY15. For the full fiscal year 2015, revenue rose 53% to $969.5 million compared to fiscal year 2014, with net profits up 147% to $44.4 million. The company saw growth across most industry segments, with consumer electronics and networking/enterprise servers representing its largest sources of revenue.
Business figures for the first nine months of 2018
Dürr on course for record order intake and sales
• Project pipeline and order books amply filled: Order intake and sales could reach new full-year records in 2018
• At 6.9%, Q3 operating EBIT margin within the target corridor
• Cash flow positive in Q3
• Digital Factory developing Smart Apps for optimizing production
Bietigheim-Bissingen, November 8, 2018 – Dürr is striving for new records in order intake and sales this year. After the first nine months of 2018, order intake stood at € 2,753.2 million and could rise to around € 3,900 million by the end of the year for the first time. Sales should come to more than € 3,800 million for the year as a whole, after reaching € 2,734.1 million in the first nine months. Ralf W. Dieter, CEO of Dürr AG: “We look set to achieve a very good fourth quarter, to which all five divisions should be able to contribute. In automotive business, there are many capital spending projects in the pipeline. This particularly applies to China where we are increasingly supplying new producers of electric vehicles alongside the established OEMs.” Operating earnings and cash flow in the third quarter exceeded the previous two quarters. The operating EBIT margin reached 6.9% in the third quarter, thus coming within the target that had been announced in October for the entire year (6.8 to 7.2%). Operating cash flow and free cash flow were in positive territory in the third quarter.
For further information read our press release: https://bit.ly/2D8ClIU
This document provides details of Nokia's Q3 2018 conference call, including an outline, disclaimer on forward-looking statements, and financial results. Key highlights include Nokia reporting 1% year-over-year decline in net sales for Q3 2018 but growth of 1% excluding catch-up licensing sales from Q3 2017. Non-IFRS diluted EPS was €0.06 compared to €0.09 year-over-year, driven by lower gross profit across Networks segments. Nokia also provided an outlook for 2018-2020 targets and details on its cost savings program.
- The document is a presentation for Ryder System Inc.'s first quarter 2013 earnings conference call. It includes an overview of key financial results for the quarter as well as forecasts for the remainder of 2013.
- Revenue increased 2% year-over-year driven by organic lease revenue growth and increased volumes in Supply Chain Solutions. Earnings per share were $0.79 compared to $0.68 in the prior year.
- Asset management metrics are provided, showing higher used vehicle sales volumes and proceeds per unit compared to prior year. The commercial rental fleet size declined year-over-year.
- The presentation reaffirms the company's full-year 2013 comparable EPS forecast of $4.70 - $
We are very satisfied with the strong nine month and third quarter results. They show that we are delivering on the promises of our Ambition 2018 strategic plan. The combined ratio, margins in guaranteed life, return on equity and solvency all exceed our targets.
Get the financial highlights and an overview of our performance per business.
You can view our financial reports here: www.sgs.com/en/Our-Company/Investor-Relations/Financial-Reports
Telecom Italia Group reported its 9M 2014 results, highlighting improvements in key metrics. Group EBITDA was €2.2 billion for 3Q 2014, down 8.0% year-over-year on a reported basis and 8.5% organically. Domestic service revenues showed a steady recovery, decreasing 6.2% in 3Q. The company's net debt was reduced to €26.57 billion. Innovative capex remained a focus, with NGN coverage above targets in Italy and mobile broadband expansion on track in Brazil.
Building a New Course for TI – Marco PatuanoGruppo TIM
- Marco Patuano of Telecom Italia Group outlined plans to build a new course for the company, focusing on network investment, governance reforms, and improving profitability.
- The presentation highlighted progress expanding fiber optic and 4G LTE networks to more cities and customers in Italy. It also discussed initiatives to enhance commercial offerings, improve operating efficiency, and transform networks and IT systems.
- Plans were presented to sharpen marketing approaches in Brazil, focusing on single SIM users and leveraging mobile broadband.
Update Post 2015-2017 plan outline presentation Gruppo TIM
Telecom Italia Group presented preliminary 2014 financial results and outlined plans for 2015-2017. Key points include:
- Revenues of €21.6 billion in 2014, down 1% year-over-year excluding Latam spectrum costs.
- Capex of €5 billion in 2014, up 13.3% year-over-year excluding Brazilian 700MHz spectrum auction.
- Plans to invest over €10 billion in Italy and over R$14 billion in Brazil from 2015-2017 to future-proof infrastructure.
- Goals of stabilizing core revenues, improving efficiency through transformation programs, and monetizing investments in innovation and broadband in Italy and 4G/LTE expansion in Brazil.
- Earnings results for 1Q14 showed consolidated traffic growth of 9.1% and tolls collected electronically increasing 14.2%. Adjusted EBITDA on a same basis increased 14.6% and net income on a same basis grew 7.5%.
- Costs were up 1.6% on a same basis, reflecting higher costs from new projects. Financial results declined due to higher debt levels and interest rates.
- The company maintained a comfortable leverage ratio and dividend payout remains over 50% of net income, demonstrating a continued commitment to shareholders.
Aksigorta - June 2015 - Conference Call PresentationAksigorta
This document provides an earnings call presentation for Aksigorta for the 2015 Q2 financial results. Some key points:
- Gross written premiums decreased 6% year-over-year excluding MTPL business and one-off claims.
- The combined ratio was 98% excluding MTPL and one-off claims, an improvement of 1 percentage point.
- Net profit was 45 million TL excluding MTPL and one-off claims, up 36% from the prior year.
- The non-motor business portfolio share increased to 55% of total premiums, up 9 percentage points.
- Guidance for the second half of 2015 forecasts a combined ratio of 94-95% and net profit of 60-65
Aksigorta's financial results for Q3 2015 were in line with its strategic plan. Excluding one-time claims and its mandatory traffic insurance (MTPL) business, gross written premiums declined 1% year-over-year for Q3 and year-to-date, while the combined ratio was around 98-99% and net profit was 70 million TL. For Q4 2015, excluding MTPL, the company expects gross written premiums to grow 8-10% year-over-year and the combined ratio to be around 92-93%, resulting in a 10-20% increase in net profit.
Get the financial highlights and an overview of our performance per business.
You can view our financial reports here: www.sgs.com/en/Our-Company/Investor-Relations/Financial-Reports
EXFO provides testing, monitoring and analytics solutions for telecommunications service providers. The document summarizes EXFO's strategy to increase market share in wireless and evolve into a solutions provider to deliver higher margins. It highlights key contract wins supporting network visibility and productivity. Management aims to balance sales growth with profitability, targeting an adjusted EBITDA margin of 15% in the medium term. Q1 2015 results showed sales growth and improved gross margin year-over-year.
Company Presentation and 2015-2017 Plan OutlineGruppo TIM
Telecom Italia Group held investor meetings in April 2015 to present its Company Presentation and 2015-2017 Plan Outline. The document contained forward-looking statements and disclaimers. It provided an overview of Telecom Italia Group's 2014 financial results including revenues of €21.6 billion (down 5.4% YoY) and EBITDA of €8.8 billion (down 6.8% YoY). Details were given on performance by market, capital expenditures, net debt, and shareholders. Market share data and trends for the fixed broadband, fixed voice, mobile, and Italian mobile markets were also reviewed.
First quarter 2015 financial results for TDS and U.S. Cellular:
- Total operating revenues for U.S. Cellular grew 4% year-over-year to $965 million, driven by a 90% increase in equipment sales revenues. Operating cash flow more than doubled to $167 million.
- TDS Telecom saw total operating revenues increase 7% to $280 million due to strong growth at TDS Cable from increased video, broadband, and voice connections. Adjusted EBITDA grew 10% to nearly $80 million.
- For 2015, U.S. Cellular increased guidance for operating cash flow to a range of $400-500 million and adjusted EBITDA
Ageas delivered a strong set of first half-year figures evidencing good progress with respect to our Ambition 2018 strategic plan. Life inflows continued to grow while at the same time we optimised the product mix in Belgium and Asia. The result of our Life activities remained strong in all segments. The Non-Life businesses in Belgium and Continental Europe realised excellent results which were reflected in outstanding combined ratios.
The document provides highlights and financial results for CTEEP for 1Q15. Net revenue increased 12.6% while net income decreased slightly by 1.3%. EBITDA grew by 3.2% and gross debt was reduced by 1.9%. Revenue growth was driven by increases in the construction, operation and maintenance, and financial sectors. Costs grew mainly due to increases in personnel expenses and contingencies. The financial result declined by 34.2% due to lower cash balances and interest rates.
The document discusses the importance of the public sector as a taxpayer segment for the Uganda Revenue Authority (URA). It notes that the public sector was previously largely ignored as a taxpayer, with few inspections, audits, or debt collection. To address this, URA established a Public Sector Office (PSO) in 2014. The PSO cleaned the public sector taxpayer register, increased education and awareness efforts, and improved monitoring of tax flows. As a result, revenue collections from the public sector grew substantially, increasing 193.9% from 2014/15 to 2015/16 and an additional 105.7% from 2015/16 to 2016/17. The success of the PSO is attributed to management support, engagement with government
Telecom Italia Group held a dbAccess TMT Conference on September 3rd, 2014. Marco Patuano, CEO of Telecom Italia Group, presented highlights from the second quarter of 2014. The presentation contained forward-looking statements and noted changes in reporting classifications. Key highlights from the second quarter included stable performance in line with the company's plan, with improving revenue trends in Italy and continued strong growth in mobile data demand and network investments in Brazil.
This document provides an overview and summary of Telecom Italia Group's 2Q 2015 results. It includes the following:
- Marco Patuano discusses key events in 2Q 2015 including improving revenue trends in domestic services, the INWIT IPO, real estate plan savings, and a reduction in net debt.
- Piergiorgio Peluso provides an analysis of financial results with details on revenues and EBITDA for various business segments.
- The presentation outlines progress in the domestic market including mobile and fixed broadband expansion, and simplification of consumer mobile offers.
- An update is given on the "Tutto Voce" campaign in consumer fixed telephony and its impact on churn rates
This document contains the agenda and presentation slides for Telecom Italia Group's 3Q 2015 results presentation. The presentation discusses recent highlights such as domestic performance and regulatory changes. It provides an overview of 3Q 2015 results including declines in total revenues and service revenues but improvements in mobile revenues. Charts and data are presented on key metrics like fixed broadband users, fiber coverage, mobile subscribers and ARPU, and EBITDA performance.
Interplex Holdings Ltd reported financial results for the fourth quarter of fiscal year 2015, with revenue increasing 57% year-over-year to $238.4 million. Gross profit margin improved from 14.2% to 17.3% over the same period. Profit after tax also increased substantially, growing from $2 million in 4QFY14 to $18.3 million in 4QFY15. For the full fiscal year 2015, revenue rose 53% to $969.5 million compared to fiscal year 2014, with net profits up 147% to $44.4 million. The company saw growth across most industry segments, with consumer electronics and networking/enterprise servers representing its largest sources of revenue.
Business figures for the first nine months of 2018
Dürr on course for record order intake and sales
• Project pipeline and order books amply filled: Order intake and sales could reach new full-year records in 2018
• At 6.9%, Q3 operating EBIT margin within the target corridor
• Cash flow positive in Q3
• Digital Factory developing Smart Apps for optimizing production
Bietigheim-Bissingen, November 8, 2018 – Dürr is striving for new records in order intake and sales this year. After the first nine months of 2018, order intake stood at € 2,753.2 million and could rise to around € 3,900 million by the end of the year for the first time. Sales should come to more than € 3,800 million for the year as a whole, after reaching € 2,734.1 million in the first nine months. Ralf W. Dieter, CEO of Dürr AG: “We look set to achieve a very good fourth quarter, to which all five divisions should be able to contribute. In automotive business, there are many capital spending projects in the pipeline. This particularly applies to China where we are increasingly supplying new producers of electric vehicles alongside the established OEMs.” Operating earnings and cash flow in the third quarter exceeded the previous two quarters. The operating EBIT margin reached 6.9% in the third quarter, thus coming within the target that had been announced in October for the entire year (6.8 to 7.2%). Operating cash flow and free cash flow were in positive territory in the third quarter.
For further information read our press release: https://bit.ly/2D8ClIU
This document provides details of Nokia's Q3 2018 conference call, including an outline, disclaimer on forward-looking statements, and financial results. Key highlights include Nokia reporting 1% year-over-year decline in net sales for Q3 2018 but growth of 1% excluding catch-up licensing sales from Q3 2017. Non-IFRS diluted EPS was €0.06 compared to €0.09 year-over-year, driven by lower gross profit across Networks segments. Nokia also provided an outlook for 2018-2020 targets and details on its cost savings program.
- The document is a presentation for Ryder System Inc.'s first quarter 2013 earnings conference call. It includes an overview of key financial results for the quarter as well as forecasts for the remainder of 2013.
- Revenue increased 2% year-over-year driven by organic lease revenue growth and increased volumes in Supply Chain Solutions. Earnings per share were $0.79 compared to $0.68 in the prior year.
- Asset management metrics are provided, showing higher used vehicle sales volumes and proceeds per unit compared to prior year. The commercial rental fleet size declined year-over-year.
- The presentation reaffirms the company's full-year 2013 comparable EPS forecast of $4.70 - $
We are very satisfied with the strong nine month and third quarter results. They show that we are delivering on the promises of our Ambition 2018 strategic plan. The combined ratio, margins in guaranteed life, return on equity and solvency all exceed our targets.
Get the financial highlights and an overview of our performance per business.
You can view our financial reports here: www.sgs.com/en/Our-Company/Investor-Relations/Financial-Reports
Telecom Italia Group reported its 9M 2014 results, highlighting improvements in key metrics. Group EBITDA was €2.2 billion for 3Q 2014, down 8.0% year-over-year on a reported basis and 8.5% organically. Domestic service revenues showed a steady recovery, decreasing 6.2% in 3Q. The company's net debt was reduced to €26.57 billion. Innovative capex remained a focus, with NGN coverage above targets in Italy and mobile broadband expansion on track in Brazil.
Building a New Course for TI – Marco PatuanoGruppo TIM
- Marco Patuano of Telecom Italia Group outlined plans to build a new course for the company, focusing on network investment, governance reforms, and improving profitability.
- The presentation highlighted progress expanding fiber optic and 4G LTE networks to more cities and customers in Italy. It also discussed initiatives to enhance commercial offerings, improve operating efficiency, and transform networks and IT systems.
- Plans were presented to sharpen marketing approaches in Brazil, focusing on single SIM users and leveraging mobile broadband.
Update Post 2015-2017 plan outline presentation Gruppo TIM
Telecom Italia Group presented preliminary 2014 financial results and outlined plans for 2015-2017. Key points include:
- Revenues of €21.6 billion in 2014, down 1% year-over-year excluding Latam spectrum costs.
- Capex of €5 billion in 2014, up 13.3% year-over-year excluding Brazilian 700MHz spectrum auction.
- Plans to invest over €10 billion in Italy and over R$14 billion in Brazil from 2015-2017 to future-proof infrastructure.
- Goals of stabilizing core revenues, improving efficiency through transformation programs, and monetizing investments in innovation and broadband in Italy and 4G/LTE expansion in Brazil.
- Earnings results for 1Q14 showed consolidated traffic growth of 9.1% and tolls collected electronically increasing 14.2%. Adjusted EBITDA on a same basis increased 14.6% and net income on a same basis grew 7.5%.
- Costs were up 1.6% on a same basis, reflecting higher costs from new projects. Financial results declined due to higher debt levels and interest rates.
- The company maintained a comfortable leverage ratio and dividend payout remains over 50% of net income, demonstrating a continued commitment to shareholders.
Aksigorta - June 2015 - Conference Call PresentationAksigorta
This document provides an earnings call presentation for Aksigorta for the 2015 Q2 financial results. Some key points:
- Gross written premiums decreased 6% year-over-year excluding MTPL business and one-off claims.
- The combined ratio was 98% excluding MTPL and one-off claims, an improvement of 1 percentage point.
- Net profit was 45 million TL excluding MTPL and one-off claims, up 36% from the prior year.
- The non-motor business portfolio share increased to 55% of total premiums, up 9 percentage points.
- Guidance for the second half of 2015 forecasts a combined ratio of 94-95% and net profit of 60-65
Aksigorta's financial results for Q3 2015 were in line with its strategic plan. Excluding one-time claims and its mandatory traffic insurance (MTPL) business, gross written premiums declined 1% year-over-year for Q3 and year-to-date, while the combined ratio was around 98-99% and net profit was 70 million TL. For Q4 2015, excluding MTPL, the company expects gross written premiums to grow 8-10% year-over-year and the combined ratio to be around 92-93%, resulting in a 10-20% increase in net profit.
This document summarizes the financial results of Aksigorta for the second quarter of 2016. Excluding the MTPL product line, Aksigorta saw 13% growth in gross premiums written, a 3 percentage point improvement in combined ratio to 94%, and a 13% increase in net profit compared to the same period last year. Key metrics such as combined ratio, underwriting margin and net profit excluding MTPL continued to improve according to the strategic plan. The presentation provides details on financial results, balance sheet information, investment portfolio allocation and full year 2016 guidance.
- Snam reported a 2.4% increase in revenues and a 2.0% decrease in EBITDA for 1Q 2015 compared to 1Q 2014. Net profit increased 11.3% over the same period.
- Key financial actions in 1Q 2015 included bond issuances totaling €250 million and new and canceled financing agreements with the EIB totaling €200 million and €300 million respectively.
- Cash flow from operations was €653 million for 1Q 2015, with free cash flow of €453 million after net capital expenditures of €200 million.
The document provides financial results for Aksigorta's first quarter of 2016 compared to the same period in 2015. Some key points:
- Excluding the mandatory traffic insurance (MTPL) product, gross written premiums grew 10% and net profit was stable at 23 million TL.
- The combined ratio excluding MTPL improved slightly to 95% from 97% due to a 2 percentage point decrease.
- Regulatory changes are expected to decrease MTPL prices while standardized pricing may be introduced. The Competition Board is investigating insurers for alleged anti-competitive practices regarding MTPL.
- For 2016, Aksigorta forecasts around 15% gross premium growth and a 1-2 percentage point combined ratio improvement excluding MTPL
Snam reported its 2013 full year results on February 28th, 2014. Key highlights included revenues of €3.529 billion, down 2.5% from 2012, and EBITDA of €2.803 billion, down 0.5% from the previous year. Net profit increased 17.7% to €917 million compared to 2012. Operationally, gas injected into Snam's network decreased 8.9% to 69 billion cubic meters for the year. Snam also paid a dividend of €0.25 per share for 2013 and continued investing in its gas infrastructure, spending over €1.29 billion on capital expenditures.
Direcional reported strong results for 1Q13, with record launches and sales. Launches increased 193% year-over-year to R$420 million, driven by the MCMV Level 1 segment. Sales grew even faster at 300% to R$530 million, with the sales-over-supply ratio reaching 40.7%. Adjusted net income increased 5% to R$57 million despite a slight decline in margin. Inventory fell 17% overall and 18.6% for completed units. The company also provided details on its debenture issue and reiterated forward-looking statements and contact information.
- The document presents financial results for Aksigorta for Q3 2016 and year-to-date 2016, excluding results from mandatory traffic insurance (MTPL) and agriculture products.
- Key metrics like premium production, combined ratio, and net profit improved compared to the same period in 2015 when excluding MTPL and agriculture. The portfolio mix has also been rebalanced with a reduced focus on motor insurance.
- Guidance for full-year 2016 forecasts premium growth of 10-11% and a 1-2 percentage point improvement in combined ratio compared to 2015, excluding MTPL. Net profit is expected to be similar to 2015 levels.
The document provides an earnings release and conference call agenda for a real estate company. It summarizes key operational and financial highlights for 2013, including a 17% increase in contracted sales, 20% increase in net revenues, and positive cash flow generation. A new dividend policy is announced targeting a payout of 40-50% of cash flow subject to leverage requirements. Contact information is provided for further questions.
Snam reported positive results for the first nine months of 2019, with earnings before interest and taxes (EBIT) increasing 3.2% compared to the same period in 2018. Regulated revenues excluding pass-through items grew 4.1% due to higher tariffs. Net income increased 9.3% to 867 million euros. Snam also continued progressing on international expansion and optimization of its financial structure. Full-year 2019 guidance was confirmed.
Triunfo Participações e Investimentos S.A. reported its 1Q12 earnings results. Net revenue grew 21.7% to R$231 million due to a 7.6% increase in traffic volume. Adjusted EBITDA was R$110 million, up 22.2% from 1Q11 with a margin of 54.4%. Net income was R$15 million. The company also won an airport expansion bid and issued R$300 million in promissory notes for investments.
The document summarizes financial results for 9M 2015. Key points include:
- Gross inflows were up 17% to EUR 22.8 billion driven by growth in Asia.
- Net insurance profit was up 6% to EUR 613 million, though the Q3 result was impacted by losses from equity impairments.
- The non-life combined ratio improved significantly.
- Shareholders' equity increased 7% to EUR 10.9 billion.
This presentation discusses HubSpot's position in the customer relationship management (CRM) software market and its growth strategy. It highlights HubSpot's inbound marketing platform and recent product launches like HubSpot CRM and Sidekick that integrate marketing and sales workflows. HubSpot sees significant opportunity to grow by expanding its leadership position in the mid-market and internationally while continuing to upsell and cross-sell existing customers.
This document summarizes the financial results of ACCIONA Group for the first half of 2015. Key points include:
- Revenues increased 9.9% to €3,304 million driven by growth in energy business.
- EBITDA grew 21.4% to €573 million with energy contributing most at 82%.
- Attributable net profit increased 50.6% to €103 million.
- Net debt decreased 2.7% to €5,153 million while gearing improved.
- Capital expenditure declined 48.2% to €99 million mainly in energy division.
Snam reported solid third quarter 2015 results, with revenues up 3.8% and adjusted net profit increasing 5.7% compared to the same period last year. Operating expenses rose due to higher regulated activities costs, but EBITDA was maintained at the prior year level. Cash flow from operations was strong, enabling continued investments while maintaining a stable net debt level. Overall the results demonstrated sound revenue growth and cash generation for Snam during the third quarter.
- Finmeccanica reported strong financial results for the first 9 months of 2015, with a 44.7% increase in EBITA to €745 million and a positive net result of €122 million compared to a net loss in the prior year.
- Most sectors performed well with improvements in orders, revenues, and profitability compared to the previous year. Notably, Selex ES and DRS showed significant increases in EBITA.
- The company reaffirmed its guidance for the full year with expectations to meet or exceed targets for orders, revenues, EBITA, free operating cash flow, and net debt.
- Terna reported its consolidated financial results for fiscal year 2015, with total revenues increasing 4.3% to €2,082 million driven by growth in both regulated and non-regulated activities. EBITDA rose 3.2% to €1,539 million.
- Key highlights included record electricity demand of 315 TWh and a peak demand of 59.4 GW. Renewable energy sources accounted for 40% of total generation.
- Total capex was €1,103 million, with €834 million spent on network development and €201 million on maintenance. Net debt increased to €8,003 million due to acquisitions and dividend payments.
TomTom reported its Q1 2014 results, with total revenue of €205 million. Key highlights included the launch of new GPS sports watches and an expansion of traffic services to new countries in Asia. Going forward, the company aims to maximize value from PNDs and establish a multi-product consumer business, while offering leading navigation software and services to automotive customers. Webfleet subscriptions increased 38% to 348,000 vehicles. For 2014, TomTom expects revenue of at least €900 million and adjusted EPS of around €0.25.
This document provides an earnings presentation for Aksigorta's 2018 first quarter results. Some key points:
- Premiums grew 17% in the overall market and 51% for Aksigorta, driven by growth in motor insurance.
- Aksigorta achieved a 94% combined ratio, 51 million TL in net profit (104% growth), and 61 million TL in underwriting profit (86% growth).
- The investment portfolio increased 6% to 1.574 billion TL, with an average yield of 15.5%.
- Guidance for 2018 forecasts 25-30% premium growth and 45-50% net profit growth for Aksigorta.
This document contains financial results and market analysis for a Turkish insurance company. It shows that the company outperformed the overall market in the first half of 2017, with growth 8 percentage points higher than the market overall and in non-motor insurance. Key drivers were strong performance in non-motor products like fire and health insurance, and growth in bank and corporate sales channels. The company expects to meet or exceed guidance for the full year.
Aksigorta cc presentation_2016_december_2016Aksigorta
This document provides an earnings call presentation summarizing Aksigorta's 2016 fourth quarter and full year financial results. Some key points:
- Aksigorta achieved a profitable growth in 2016, with 17% premium increase and 9% growth excluding MTPL. Net profit was 95 million TL excluding one-off items.
- Combined ratio improved to 98% in 2016 from 101% in 2015, excluding one-offs. UW profit was 138 million TL in 2016 excluding IBNR deferral.
- For 2017, Aksigorta expects 12-14% premium growth, a 1 percentage point improvement in combined ratio to 98%, and 8-10% growth in net profit to 95 million TL.
- Aksigorta's financial results for the third quarter of 2016 are in line with its strategic plan excluding motor third party liability (MTPL) and agriculture products. Premium production grew 11% excluding these lines, compared to 9% market growth.
- The combined ratio was 97% excluding MTPL claims and terrorism claims, consistent with 2015. Net profit increased 7% excluding these lines.
- Guidance for 2016 forecasts 10-11% premium growth excluding MTPL, a 1-2 point improvement in combined ratio, and similar net profit to 2015, all excluding MTPL.
Aksigorta Investor Presentation - Delivering Value in a Competitive EnvironmentAksigorta
This document provides an overview of Aksigorta, a Turkish insurance company. It discusses Aksigorta's strong financial performance in recent years, with increasing profitability as evidenced by declining combined and loss ratios between 2009-2013. The document also outlines Aksigorta's strategies to further improve profitability through initiatives focused on product mix, distribution channels, operational excellence, and customer service. Aksigorta aims to transform its business mix and distribution channels to achieve more sustainable profitability going forward.
Aksigorta Kasko Poliçesi sahibi müşterilerimizin kullanabileceği Mini Onarım hizmetinin detaylarına bu linkten ulaşaiblirsiniz! Mini Onarım hizmeti ile küçük çizikler, göçükler, boya tamiri, iç döşeme, cam ve plastik hasarları hasarsızlık indirimini bozmadan onarılır.
SATTA MATKA SATTA FAST RESULT KALYAN TOP MATKA RESULT KALYAN SATTA MATKA FAST RESULT MILAN RATAN RAJDHANI MAIN BAZAR MATKA FAST TIPS RESULT MATKA CHART JODI CHART PANEL CHART FREE FIX GAME SATTAMATKA ! MATKA MOBI SATTA 143 spboss.in TOP NO1 RESULT FULL RATE MATKA ONLINE GAME PLAY BY APP SPBOSS
Digital Marketing with a Focus on Sustainabilitysssourabhsharma
Digital Marketing best practices including influencer marketing, content creators, and omnichannel marketing for Sustainable Brands at the Sustainable Cosmetics Summit 2024 in New York
HOW TO START UP A COMPANY A STEP-BY-STEP GUIDE.pdf46adnanshahzad
How to Start Up a Company: A Step-by-Step Guide Starting a company is an exciting adventure that combines creativity, strategy, and hard work. It can seem overwhelming at first, but with the right guidance, anyone can transform a great idea into a successful business. Let's dive into how to start up a company, from the initial spark of an idea to securing funding and launching your startup.
Introduction
Have you ever dreamed of turning your innovative idea into a thriving business? Starting a company involves numerous steps and decisions, but don't worry—we're here to help. Whether you're exploring how to start a startup company or wondering how to start up a small business, this guide will walk you through the process, step by step.
Company Valuation webinar series - Tuesday, 4 June 2024FelixPerez547899
This session provided an update as to the latest valuation data in the UK and then delved into a discussion on the upcoming election and the impacts on valuation. We finished, as always with a Q&A
At Techbox Square, in Singapore, we're not just creative web designers and developers, we're the driving force behind your brand identity. Contact us today.
Part 2 Deep Dive: Navigating the 2024 Slowdownjeffkluth1
Introduction
The global retail industry has weathered numerous storms, with the financial crisis of 2008 serving as a poignant reminder of the sector's resilience and adaptability. However, as we navigate the complex landscape of 2024, retailers face a unique set of challenges that demand innovative strategies and a fundamental shift in mindset. This white paper contrasts the impact of the 2008 recession on the retail sector with the current headwinds retailers are grappling with, while offering a comprehensive roadmap for success in this new paradigm.
Industrial Tech SW: Category Renewal and CreationChristian Dahlen
Every industrial revolution has created a new set of categories and a new set of players.
Multiple new technologies have emerged, but Samsara and C3.ai are only two companies which have gone public so far.
Manufacturing startups constitute the largest pipeline share of unicorns and IPO candidates in the SF Bay Area, and software startups dominate in Germany.
❼❷⓿❺❻❷❽❷❼❽ Dpboss Matka Result Satta Matka Guessing Satta Fix jodi Kalyan Final ank Satta Matka Dpbos Final ank Satta Matta Matka 143 Kalyan Matka Guessing Final Matka Final ank Today Matka 420 Satta Batta Satta 143 Kalyan Chart Main Bazar Chart vip Matka Guessing Dpboss 143 Guessing Kalyan night
At Techbox Square, in Singapore, we're not just creative web designers and developers, we're the driving force behind your brand identity. Contact us today.
The APCO Geopolitical Radar - Q3 2024 The Global Operating Environment for Bu...APCO
The Radar reflects input from APCO’s teams located around the world. It distils a host of interconnected events and trends into insights to inform operational and strategic decisions. Issues covered in this edition include:
Navigating the world of forex trading can be challenging, especially for beginners. To help you make an informed decision, we have comprehensively compared the best forex brokers in India for 2024. This article, reviewed by Top Forex Brokers Review, will cover featured award winners, the best forex brokers, featured offers, the best copy trading platforms, the best forex brokers for beginners, the best MetaTrader brokers, and recently updated reviews. We will focus on FP Markets, Black Bull, EightCap, IC Markets, and Octa.
[To download this presentation, visit:
https://www.oeconsulting.com.sg/training-presentations]
This presentation is a curated compilation of PowerPoint diagrams and templates designed to illustrate 20 different digital transformation frameworks and models. These frameworks are based on recent industry trends and best practices, ensuring that the content remains relevant and up-to-date.
Key highlights include Microsoft's Digital Transformation Framework, which focuses on driving innovation and efficiency, and McKinsey's Ten Guiding Principles, which provide strategic insights for successful digital transformation. Additionally, Forrester's framework emphasizes enhancing customer experiences and modernizing IT infrastructure, while IDC's MaturityScape helps assess and develop organizational digital maturity. MIT's framework explores cutting-edge strategies for achieving digital success.
These materials are perfect for enhancing your business or classroom presentations, offering visual aids to supplement your insights. Please note that while comprehensive, these slides are intended as supplementary resources and may not be complete for standalone instructional purposes.
Frameworks/Models included:
Microsoft’s Digital Transformation Framework
McKinsey’s Ten Guiding Principles of Digital Transformation
Forrester’s Digital Transformation Framework
IDC’s Digital Transformation MaturityScape
MIT’s Digital Transformation Framework
Gartner’s Digital Transformation Framework
Accenture’s Digital Strategy & Enterprise Frameworks
Deloitte’s Digital Industrial Transformation Framework
Capgemini’s Digital Transformation Framework
PwC’s Digital Transformation Framework
Cisco’s Digital Transformation Framework
Cognizant’s Digital Transformation Framework
DXC Technology’s Digital Transformation Framework
The BCG Strategy Palette
McKinsey’s Digital Transformation Framework
Digital Transformation Compass
Four Levels of Digital Maturity
Design Thinking Framework
Business Model Canvas
Customer Journey Map
Understanding User Needs and Satisfying ThemAggregage
https://www.productmanagementtoday.com/frs/26903918/understanding-user-needs-and-satisfying-them
We know we want to create products which our customers find to be valuable. Whether we label it as customer-centric or product-led depends on how long we've been doing product management. There are three challenges we face when doing this. The obvious challenge is figuring out what our users need; the non-obvious challenges are in creating a shared understanding of those needs and in sensing if what we're doing is meeting those needs.
In this webinar, we won't focus on the research methods for discovering user-needs. We will focus on synthesis of the needs we discover, communication and alignment tools, and how we operationalize addressing those needs.
Industry expert Scott Sehlhorst will:
• Introduce a taxonomy for user goals with real world examples
• Present the Onion Diagram, a tool for contextualizing task-level goals
• Illustrate how customer journey maps capture activity-level and task-level goals
• Demonstrate the best approach to selection and prioritization of user-goals to address
• Highlight the crucial benchmarks, observable changes, in ensuring fulfillment of customer needs
Storytelling is an incredibly valuable tool to share data and information. To get the most impact from stories there are a number of key ingredients. These are based on science and human nature. Using these elements in a story you can deliver information impactfully, ensure action and drive change.
How MJ Global Leads the Packaging Industry.pdfMJ Global
MJ Global's success in staying ahead of the curve in the packaging industry is a testament to its dedication to innovation, sustainability, and customer-centricity. By embracing technological advancements, leading in eco-friendly solutions, collaborating with industry leaders, and adapting to evolving consumer preferences, MJ Global continues to set new standards in the packaging sector.
3 Simple Steps To Buy Verified Payoneer Account In 2024SEOSMMEARTH
Buy Verified Payoneer Account: Quick and Secure Way to Receive Payments
Buy Verified Payoneer Account With 100% secure documents, [ USA, UK, CA ]. Are you looking for a reliable and safe way to receive payments online? Then you need buy verified Payoneer account ! Payoneer is a global payment platform that allows businesses and individuals to send and receive money in over 200 countries.
If You Want To More Information just Contact Now:
Skype: SEOSMMEARTH
Telegram: @seosmmearth
Gmail: seosmmearth@gmail.com
The Genesis of BriansClub.cm Famous Dark WEb PlatformSabaaSudozai
BriansClub.cm, a famous platform on the dark web, has become one of the most infamous carding marketplaces, specializing in the sale of stolen credit card data.
Brian Fitzsimmons on the Business Strategy and Content Flywheel of Barstool S...Neil Horowitz
On episode 272 of the Digital and Social Media Sports Podcast, Neil chatted with Brian Fitzsimmons, Director of Licensing and Business Development for Barstool Sports.
What follows is a collection of snippets from the podcast. To hear the full interview and more, check out the podcast on all podcast platforms and at www.dsmsports.net
2. Investor Presentation
183m TL adjustment on MTPL claim provisions
2
410 423
476
456
14Q1 15Q1
Aksigorta GWP growth in ‘15Q1,
excl. MTPL and non-recurring
businesses, is %3
Premium
Production
(million TL)
Net impact of the increase in claim
provision on ‘15Q1 combined ratio
is 62pp
Combined ratio in ‘15Q1, excl. MTPL
and one-off claims in fire, is 97%
95% 97%
166%
14Q1 15Q1
Combined Ratio
Net PL impact of increase in claim
provision is 147m TL (183m TL PBT)
Net profit in ‘15Q1, excl. MTPL and
one off claims in fire, is 24m TL
19
-140
26 24
14Q1 15Q1
Net Income/Loss
(million TL)
3%
2pp
-8%
3. Investor Presentation
Portfolio share of non-motor continues to increase in line with strategy
3
6% 7%
12% 12%
13% 15%
69% 66%
MARKET
Agencies
Banks
Brokers
Direct Sales
Agency in Market 3pp
12% 13%
11% 11%
16% 16%
61% 60%
14Q1 15Q1
AKSİGORTA
Agencies
Banks
Brokers
Direct Sales
Agency in Aksigorta 1pp
11% 12%
39% 41%
50% 47%
MARKET
Motor
Non-Motor
Health
Non-motor in Market 2pp
11% 12%
43% 45%
46% 43%
14Q1 15Q1
AKSİGORTA
Motor
Non-Motor
Health
Non-motor in Aksigorta 2pp
Rolling 12 Months CHANNEL SHARES (%) Rolling 12 Months LOB SHARES (%)
4. Investor Presentation
Market realities for MTPL
4
Third parties benefit from
the product, not the
customer
Price sensitivity is very high
Price was set by the
government till 2008, base
price was ruled till 2014,
free tariffication started by
2014
MTPL is a long tail product,
claims can be notified within
more than 10 years
Material damages are notified
and handled within a short
time, bodily injury claims
take long time due to longer
expiry periods and litigation
process
Bodily injury claims’
severities started to
increase very fast by 2012
New cost in 2014; claim
payments to the dependents
of the faulty drivers who are
disabled or deceased
An independent institution
analysed the claim provision
deficit in the market and
reported at least 3 billion TL
New regulation on IBNR is
effective by 2015, the
biggest impact is on MTPL
5. Investor Presentation
New Regulation on IBNR
5
Market first time booked
IBNR in 2010 according to
the communiqué for claim
provisions
Treasury approved five
actuarial methods to
calculate IBNR and one big
loss elimination method
Treasury anounced a new
regulation on 05.12.14,
effective by 01.01.15, for
claims provisions including
changes in IBNR calculation
Companies are allowed to
book the IBNR computed by
their actuaries, using any
actuarial method in addition
to six approved methods
Treasury ammended this
regulation on 17.03.15,
which allowed gradual
booking of the IBNR deficit
within 3 years
This ammendment is an
option for the companies
who might have problems
with capital adequacy ratio
resulting from IBNR increase
Aksigorta booked the IBNR
increase at once in ‘15Q1, in
order to reflect its liabilities
properly in its financials
Next step for the market
should be rational pricing in
MTPL, in order to never face
this kind of claim provision
deficit again
Aksigorta increased prices in
MTPL to achieve combined
ratio not more than 105%
13. Investor Presentation
The MTPL reality hides sustaining profit
13
-174
16
30 24
151
16
14
7
Reported Profit
Before Tax Additional IBNR
Cancel Success
Ratio Additional URR
MTPL UW Result
in 2015 Q1
One off claims
in fire
PBT Exc. MTPL
and one off
claims in fire
Net Profit Exc.
MTPL and one
off claims in fire
2015 Q1 Financial Results (million TL)
This could be named as one
off equity adjustment for the
deficit in claim provisions
This adjusment is totally
related with the claims
incurred in the past
No more claim provision
adjustment is expected
under current conditions
We expect to report the pure
positive results of Aksigorta
Strategic Plan by 2015 Q2
15. Investor Presentation
Investment Portfolio
15
69%
19%
6%
6%
'14YE
Time Deposit
Corporate Bond
Government Bond
Eurobond
65%
22%
6%
7%
'15Q1
•Total Portfolio: TL 902m
•Average Yield: 10,1%
•Duration: 12 months
2014 YE
•Total Portfolio: TL 901m
•Average Yield (annualized): 10,6%
•Duration: 12 months
2015 Q1
16. Investor Presentation
2015 Guidance
16
1.403
2014 2015
GWP growth is expected to be
around 9-12% excluding MTPL and
non-recurring businesses
Premium
Production
(million TL)
Combined ratio is expected to
improve around 1-2pp both in
Statutory and IFRS, excluding MTPL
business
97% 96%
2014 2015
Statutory
Combined Ratio
Net Profit is expected to reach
break-even in Statutory financials
while over than 50% increase in IFRS
31
53
2014 2015
Statutory IFRS
Net Income/Loss
(million TL)
9-12%
1-2pp
+50% in
IFRS
17. Investor Presentation
Contact Information & Disclaimer
17
For further information please contact with;
(Mr.) Osman Akkoca, Financial Control Manager and (Mr.) Necip Çakmakoğlu, Financial Control Unit Manager
(T) +90 216 280 88 88
investor.relations@aksigorta.com.tr
www.aksigorta.com.tr/en/yatirimci_iliskileri.php
Poligon Cad. Buyaka 2 Sitesi No:8, Kule:1, Kat:6 34771 Ümraniye İstanbul Türkiye
Disclaimer
The information and opinions contained in this document have been compiled by Aksigorta A.Ş. (“Company”) from sources believed to be reliable and in
good faith, but no representation or warranty, expressed or implied, is made as to their accuracy, completeness or correctness. No undue reliance may
be placed for any purposes whatsoever on the information contained in this document is published for the assistance of recipients , but is not to be
relied upon as authoritative or taken in substitution for the exercise of judgment by any recipient. The Company does not accept any liability whatsoever
for any direct or consequential loss arising from any use of this document or its contents. This document is strictly confidential and may not be
reproduced, distributed or published for any purpose. The information and opinions contained in this document have been compiled by Aksigorta A.Ş.
(“Company”) from sources believed to be reliable and in good faith, but no representation or warranty, expressed or implied, is made as to their
accuracy, completeness or correctness. No undue reliance may be placed for any purposes whatsoever on the information contained in this presentation
or on its completeness, accuracy or fairness. This document contains forward-looking statements by using such words as "may", "will", "expect",
"believe", "plan" and other similar terminology that reflect the Company management’s current views, expectations, assumptions and forecasts with
respect to certain future events. As the actual performance of the companies may be affected by risks and uncertainties, all opinions, information and
estimates contained in this document constitute the Company’s current judgment and are subject to change, update, amend, supplement or otherwise
alter without notice. Although it is believed that the information and analysis are correct and expectations reflected in this document are reasonable,
they may be affected by a variety of variables and changes in underlying assumptions that could cause actual results to differ materially. Company does
not undertake any obligation, and disclaims any duty to update or revise any forward looking statements, whether as a result of new information or
future events. Neither this document nor the information contained within can construe any investment advice, invitation or an offer to buy or sell
Company’s shares. Company cannot guarantee that the securities described in this document constitute a suitable investment for all investors and
nothing shall be taken as an inducement to any person to invest in or otherwise deal with any shares of Company and its group companies. The
information contained in this document is published for the assistance of recipients, but is not to be relied upon as authoritative or taken in substitution
for the exercise of judgment by any recipient. You must not distribute the information in this document to, or cause it to be used by, any person or entity
in a place where its distribution or use would be unlawful. Neither Company, its board of directors, directors, managers, nor any of Its employees shall
have any liability whatsoever for any direct or consequential loss arising from any use of this document or its contents.