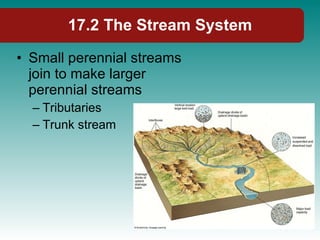
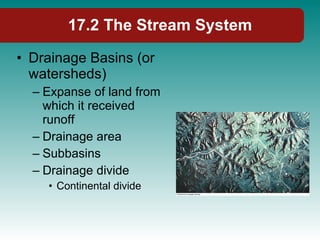
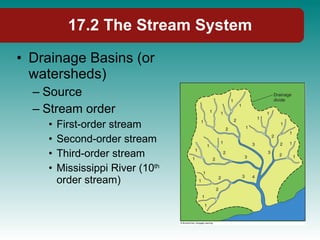
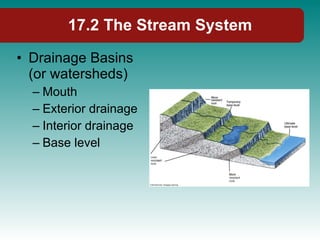
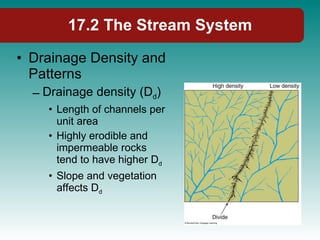
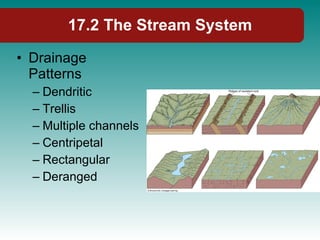
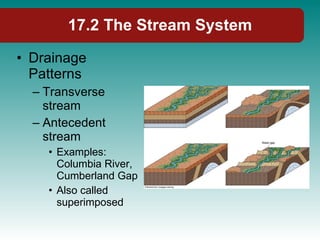
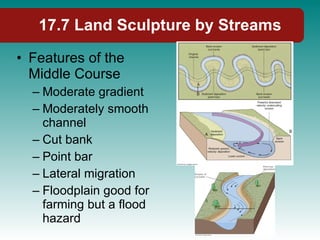
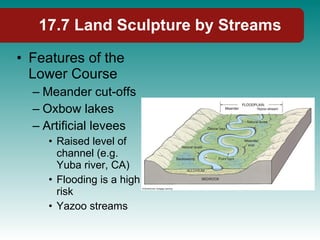
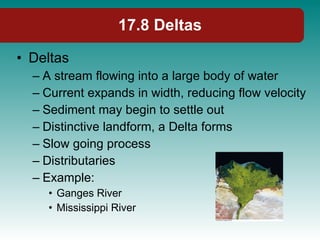
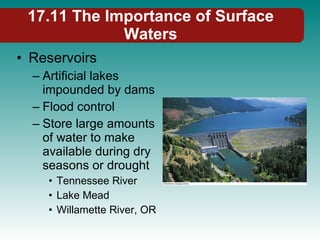
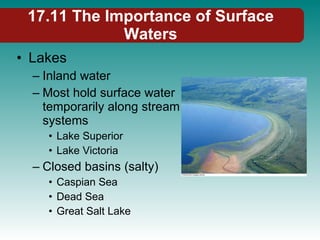
Chapter 17: Fluvial Processes and Landforms Physical Geography Ninth Edition Robert E. Gabler James. F. Petersen L. Michael Trapasso Dorothy Sack
Fluvial Processes and Landforms
Fluvial Processes and Landforms Fluvial geomorphology Study of flowing water as a land-shaping process Stream General term for natural, channelized flow Interfluve Floods Long-term effects
17.1 Surface Runoff Surface runoff Infiltration capacity Interception Amount of runoff depends on: Intensity and duration of storm Surface features Infiltration & evap. Deep soil, soil type, slope
17.1 Surface Runoff Surface runoff Sheet wash (unchannelized) Rills Gullies Ephemeral flow Perennial flow Intermittent flow Base flow
17.2 The Stream System Small perennial streams join to make larger perennial streams Tributaries Trunk stream
17.2 The Stream System Drainage Basins (or watersheds) Expanse of land from which it received runoff Drainage area Subbasins Drainage divide Continental divide
17.2 The Stream System Drainage Basins (or watersheds) Source Stream order First-order stream Second-order stream Third-order stream Mississippi River (10 th  order stream)
17.2 The Stream System Drainage Basins (or watersheds) Mouth Exterior drainage Interior drainage Base level
17.2 The Stream System Drainage Density and Patterns Drainage density (D d ) Length of channels per unit area Highly erodible and impermeable rocks tend to have higher D d Slope and vegetation affects D d
17.2 The Stream System Drainage Patterns Dendritic Trellis Multiple channels Centripetal Rectangular Deranged
17.2 The Stream System Drainage Patterns Transverse stream Antecedent stream  Examples: Columbia River, Cumberland Gap Also called superimposed
17.3 Stream Discharge Amount of stream discharge (Q) depends on: Recent weather Drainage basin Size Relief Climate Vegetation Rock type Land-use Q = Volume of water in a given cross section per unit of time
17.3 Stream Discharge Ten Largest Rivers of the World
17.3 Stream Discharge Q = wdv w = width d = channel depth v = average stream velocity
17.4 Stream Energy Kinetic energy Stream gradient Channel roughness Friction 95% of energy is consumed in overcoming friction
17.4 Stream Energy Stream load Stream competence and Stream capacity Both increase in response to small increases in velocity If velocity doubles, sediment load may go up 6-8 times Graded stream
17.5 Fluvial Processes Stream Erosion Fluvial erosion Degradation Aggradation Corrosion  Also called solution Hydraulic action Turbulence Plunge Pools Q: Why do deep plunge pools form at the base of most waterfalls?
17.5 Fluvial Processes Stream Erosion Abrasion (more powerful than hydraulic) Potholes Originate below waterfalls, swirling rapids, structural weakness Attrition Headward erosion
17.5 Fluvial Processes Stream Transportation Solution Minerals that are dissolved in water Suspension Finest solid particles carried Saltation Particles that are heavier and “bounce” along stream bed
17.5 Fluvial Processes Stream Transportation 3 Main Types of Stream Load: Dissolved load (Ions of rock material in solution) Suspended load (small clastic in suspension) Bed load (large particles that saltate or move in traction along streambed) Relative proportion of these vary with drainage
17.5 Fluvial Processes Stream Transportation Relative proportion of these vary with drainage Humid regions  Higher rates of weathering Suspended loads Muddy river e.g. Yellow River, China Arid regions Limited weathering Bed load
17.5 Fluvial Processes Stream Deposition A decrease in stream velocity will reduce its load through deposition Bar (accumulation of sediment, channel bend) Alluvium (fluvial deposits) Characteristic of sorting and/or rounding
17.5 Fluvial Processes Stream Deposition Natural levees Floodplains Vertical accretion Lateral accretion Q: What would the river floodwaters leave behind is flooded homes after the water recedes?
17.6 Channel Patterns Straight channels Exist for short distances Braided river Coarse sediment input is high Downstream of glaciers Yukon River, Canada Brahmaputra River, Tibet
17.6 Channel Patterns Meandering channels Most common in humid climates (e.g. Missouri River) May swing back and forth across valley
17.7 Land Sculpture by Streams Idealized river Gradient diminished downstream Does not always occur e.g. Mississippi River Longitudinal Profile Actual stream gradient from source to mouth Upper, middle and lower
17.7 Land Sculpture by Streams Features of the Upper Course Usually flows on contact with bedrock Steep gradient high above its base level Erosion creates steep sided valley, gorge This is called a V-shaped valley
17.7 Land Sculpture by Streams Features of the Upper Course Differential erosion Many spill from lake to lake (e.g., Niagara Falls) or gorges
17.7 Land Sculpture by Streams Features of the Middle Course Moderate gradient Moderately smooth channel Cut bank Point bar Lateral migration Floodplain good for farming but a flood hazard
17.7 Land Sculpture by Streams Features of the Lower Course Minimal gradient Low stream energy Lateral shifting of channel Large depositional plain Natural levees Alluvial plain
17.7 Land Sculpture by Streams Features of the Lower Course Meander cut-offs Oxbow lakes Artificial levees Raised level of channel (e.g. Yuba river, CA) Flooding is a high risk Yazoo streams
17.8 Deltas Deltas A stream flowing into a large body of water Current expands in width, reducing flow velocity Sediment may begin to settle out Distinctive landform, a Delta forms Slow going process Distributaries Example: Ganges River Mississippi River
17.8 Deltas Deltas
17.9 Base-Level Changes and Tectonism Base Level change Due primarily from climate change (glaciers advancing, sea levels decrease) Drop: downcutting and rejuvenated stream Rise: deposition New Uplift Entrenched
17.9 Base-Level Changes and Tectonism Stream Terraces Older, higher valley floors preserved Caused by varying: Base-level Stream equilibrium Tectonism Q: How many terraces can you identify in this photo?
17.10 Stream Hazards Flooding is a significant risk Stream channel can withstand 1 or 2 year flow 5, 10, 100 year flood overflows the channel Olivehurst, CA (Feather River)
17.10 Stream Hazards Stream Hydrograph Record of changes in Q over time Used to indicate how high/fast water level is
17.10 Stream Hazards Stream Hydrograph Rising limb Peak flow Receding limb Recurrence interval Q: Why would such a time lag occur between the rainfall and rise in the river?
17.10 Stream Hazards Stream Hydrograph Urbanization and suburbanization Increases impermeable cover Amount and rate of runoff increases Q: What features of the urbanized landscape shown here enhance runoff?
17.11 The Importance of Surface Waters Streams Historical Settlement and growth via Mississippi River Exploration Power for mills Inexpensive transportation Hydroelectricity Irrigation water Alluvial soils produce excellent farmland Source of food and water
Reservoirs Artificial lakes impounded by dams Flood control Store large amounts of water to make available during dry seasons or drought Tennessee River Lake Mead Willamette River, OR 17.11 The Importance of Surface Waters
Lakes Inland water Most hold surface water temporarily along stream systems Lake Superior Lake Victoria Closed basins (salty) Caspian Sea Dead Sea Great Salt Lake 17.11 The Importance of Surface Waters
Lakes Formation: Most are products of glaciation Rivers, groundwater, volcanism (e.g. Crater lake) Sedimentation and other processes lead to the destruction of most lakes Importance: Recreation Affect weather (moderate temperature/lake effect) Water supply Fishing 17.11 The Importance of Surface Waters
17.12 Quantitative Fluvial Geomorphology Objective analysis of fluvial systems Used by scientists including: Climatologists Geomorphologists Hydrologists Soil scientist Provide better understanding and improved prediction of water supply, floods, soil erosion, and pollution.
Physical Geography End of Chapter 17: Fluvial Processes and Landforms

17

  • 1.
    Chapter 17: FluvialProcesses and Landforms Physical Geography Ninth Edition Robert E. Gabler James. F. Petersen L. Michael Trapasso Dorothy Sack
  • 2.
  • 3.
    Fluvial Processes andLandforms Fluvial geomorphology Study of flowing water as a land-shaping process Stream General term for natural, channelized flow Interfluve Floods Long-term effects
  • 4.
    17.1 Surface RunoffSurface runoff Infiltration capacity Interception Amount of runoff depends on: Intensity and duration of storm Surface features Infiltration & evap. Deep soil, soil type, slope
  • 5.
    17.1 Surface RunoffSurface runoff Sheet wash (unchannelized) Rills Gullies Ephemeral flow Perennial flow Intermittent flow Base flow
  • 6.
    17.2 The StreamSystem Small perennial streams join to make larger perennial streams Tributaries Trunk stream
  • 7.
    17.2 The StreamSystem Drainage Basins (or watersheds) Expanse of land from which it received runoff Drainage area Subbasins Drainage divide Continental divide
  • 8.
    17.2 The StreamSystem Drainage Basins (or watersheds) Source Stream order First-order stream Second-order stream Third-order stream Mississippi River (10 th order stream)
  • 9.
    17.2 The StreamSystem Drainage Basins (or watersheds) Mouth Exterior drainage Interior drainage Base level
  • 10.
    17.2 The StreamSystem Drainage Density and Patterns Drainage density (D d ) Length of channels per unit area Highly erodible and impermeable rocks tend to have higher D d Slope and vegetation affects D d
  • 11.
    17.2 The StreamSystem Drainage Patterns Dendritic Trellis Multiple channels Centripetal Rectangular Deranged
  • 12.
    17.2 The StreamSystem Drainage Patterns Transverse stream Antecedent stream Examples: Columbia River, Cumberland Gap Also called superimposed
  • 13.
    17.3 Stream DischargeAmount of stream discharge (Q) depends on: Recent weather Drainage basin Size Relief Climate Vegetation Rock type Land-use Q = Volume of water in a given cross section per unit of time
  • 14.
    17.3 Stream DischargeTen Largest Rivers of the World
  • 15.
    17.3 Stream DischargeQ = wdv w = width d = channel depth v = average stream velocity
  • 16.
    17.4 Stream EnergyKinetic energy Stream gradient Channel roughness Friction 95% of energy is consumed in overcoming friction
  • 17.
    17.4 Stream EnergyStream load Stream competence and Stream capacity Both increase in response to small increases in velocity If velocity doubles, sediment load may go up 6-8 times Graded stream
  • 18.
    17.5 Fluvial ProcessesStream Erosion Fluvial erosion Degradation Aggradation Corrosion Also called solution Hydraulic action Turbulence Plunge Pools Q: Why do deep plunge pools form at the base of most waterfalls?
  • 19.
    17.5 Fluvial ProcessesStream Erosion Abrasion (more powerful than hydraulic) Potholes Originate below waterfalls, swirling rapids, structural weakness Attrition Headward erosion
  • 20.
    17.5 Fluvial ProcessesStream Transportation Solution Minerals that are dissolved in water Suspension Finest solid particles carried Saltation Particles that are heavier and “bounce” along stream bed
  • 21.
    17.5 Fluvial ProcessesStream Transportation 3 Main Types of Stream Load: Dissolved load (Ions of rock material in solution) Suspended load (small clastic in suspension) Bed load (large particles that saltate or move in traction along streambed) Relative proportion of these vary with drainage
  • 22.
    17.5 Fluvial ProcessesStream Transportation Relative proportion of these vary with drainage Humid regions Higher rates of weathering Suspended loads Muddy river e.g. Yellow River, China Arid regions Limited weathering Bed load
  • 23.
    17.5 Fluvial ProcessesStream Deposition A decrease in stream velocity will reduce its load through deposition Bar (accumulation of sediment, channel bend) Alluvium (fluvial deposits) Characteristic of sorting and/or rounding
  • 24.
    17.5 Fluvial ProcessesStream Deposition Natural levees Floodplains Vertical accretion Lateral accretion Q: What would the river floodwaters leave behind is flooded homes after the water recedes?
  • 25.
    17.6 Channel PatternsStraight channels Exist for short distances Braided river Coarse sediment input is high Downstream of glaciers Yukon River, Canada Brahmaputra River, Tibet
  • 26.
    17.6 Channel PatternsMeandering channels Most common in humid climates (e.g. Missouri River) May swing back and forth across valley
  • 27.
    17.7 Land Sculptureby Streams Idealized river Gradient diminished downstream Does not always occur e.g. Mississippi River Longitudinal Profile Actual stream gradient from source to mouth Upper, middle and lower
  • 28.
    17.7 Land Sculptureby Streams Features of the Upper Course Usually flows on contact with bedrock Steep gradient high above its base level Erosion creates steep sided valley, gorge This is called a V-shaped valley
  • 29.
    17.7 Land Sculptureby Streams Features of the Upper Course Differential erosion Many spill from lake to lake (e.g., Niagara Falls) or gorges
  • 30.
    17.7 Land Sculptureby Streams Features of the Middle Course Moderate gradient Moderately smooth channel Cut bank Point bar Lateral migration Floodplain good for farming but a flood hazard
  • 31.
    17.7 Land Sculptureby Streams Features of the Lower Course Minimal gradient Low stream energy Lateral shifting of channel Large depositional plain Natural levees Alluvial plain
  • 32.
    17.7 Land Sculptureby Streams Features of the Lower Course Meander cut-offs Oxbow lakes Artificial levees Raised level of channel (e.g. Yuba river, CA) Flooding is a high risk Yazoo streams
  • 33.
    17.8 Deltas DeltasA stream flowing into a large body of water Current expands in width, reducing flow velocity Sediment may begin to settle out Distinctive landform, a Delta forms Slow going process Distributaries Example: Ganges River Mississippi River
  • 34.
  • 35.
    17.9 Base-Level Changesand Tectonism Base Level change Due primarily from climate change (glaciers advancing, sea levels decrease) Drop: downcutting and rejuvenated stream Rise: deposition New Uplift Entrenched
  • 36.
    17.9 Base-Level Changesand Tectonism Stream Terraces Older, higher valley floors preserved Caused by varying: Base-level Stream equilibrium Tectonism Q: How many terraces can you identify in this photo?
  • 37.
    17.10 Stream HazardsFlooding is a significant risk Stream channel can withstand 1 or 2 year flow 5, 10, 100 year flood overflows the channel Olivehurst, CA (Feather River)
  • 38.
    17.10 Stream HazardsStream Hydrograph Record of changes in Q over time Used to indicate how high/fast water level is
  • 39.
    17.10 Stream HazardsStream Hydrograph Rising limb Peak flow Receding limb Recurrence interval Q: Why would such a time lag occur between the rainfall and rise in the river?
  • 40.
    17.10 Stream HazardsStream Hydrograph Urbanization and suburbanization Increases impermeable cover Amount and rate of runoff increases Q: What features of the urbanized landscape shown here enhance runoff?
  • 41.
    17.11 The Importanceof Surface Waters Streams Historical Settlement and growth via Mississippi River Exploration Power for mills Inexpensive transportation Hydroelectricity Irrigation water Alluvial soils produce excellent farmland Source of food and water
  • 42.
    Reservoirs Artificial lakesimpounded by dams Flood control Store large amounts of water to make available during dry seasons or drought Tennessee River Lake Mead Willamette River, OR 17.11 The Importance of Surface Waters
  • 43.
    Lakes Inland waterMost hold surface water temporarily along stream systems Lake Superior Lake Victoria Closed basins (salty) Caspian Sea Dead Sea Great Salt Lake 17.11 The Importance of Surface Waters
  • 44.
    Lakes Formation: Mostare products of glaciation Rivers, groundwater, volcanism (e.g. Crater lake) Sedimentation and other processes lead to the destruction of most lakes Importance: Recreation Affect weather (moderate temperature/lake effect) Water supply Fishing 17.11 The Importance of Surface Waters
  • 45.
    17.12 Quantitative FluvialGeomorphology Objective analysis of fluvial systems Used by scientists including: Climatologists Geomorphologists Hydrologists Soil scientist Provide better understanding and improved prediction of water supply, floods, soil erosion, and pollution.
  • 46.
    Physical Geography Endof Chapter 17: Fluvial Processes and Landforms

Editor's Notes

  • #3 Insert cover image for Chapter 17 (p. 460)
  • #4 Insert Figure 17.1a
  • #5 Insert Figure 17.2
  • #6 Insert Figure 17.3
  • #7 Insert Figure 17.4
  • #8 Insert Figure 17.5
  • #9 Insert Figure 17.6
  • #10 Insert Figure 17.7
  • #11 Insert Figure 17.8
  • #12 Insert Figure 17.9
  • #13 Insert Figure 17.10
  • #15 Insert Table 17.1
  • #16 Insert Figure 17.11
  • #17 Insert Figure 17.12
  • #18 Insert Figure 17.13
  • #19 Insert Figure 17.14
  • #20 Insert Figure 17.15
  • #21 Insert Figure 17.16
  • #22 Insert Figure 17.17
  • #23 Insert Figure 17.17
  • #24 Insert Figure 17.18
  • #25 Insert Figure 17.19 and 17.20
  • #26 Insert Figure 17.21
  • #27 Insert Figure 17.22
  • #28 Insert Figure 17.23
  • #29 Insert Figure 17.24
  • #30 Insert Figure 17.24
  • #31 Insert Figure 17.25
  • #32 Insert Figure 17.26
  • #33 Insert Figure 17.27
  • #34 Insert Figure 17.28a
  • #35 Insert Figure 17.28
  • #36 Insert Figure 17.29
  • #37 Insert Figure 17.30
  • #38 Insert Figure 17.31
  • #39 Insert Figure 17.32
  • #40 Insert Figure 17.33
  • #41 Insert Figure 17.34
  • #43 Insert Figure 17.35
  • #44 Insert Figure 17.36
  • #45 Insert Figure 17.36