Download to read offline
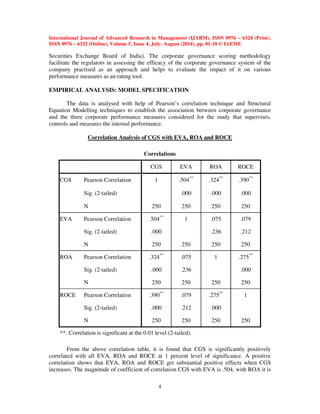
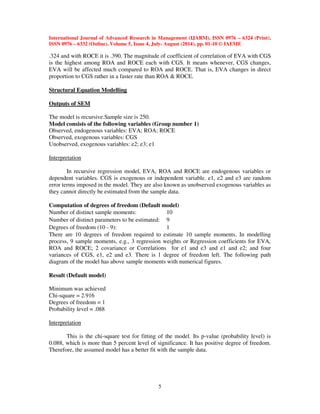
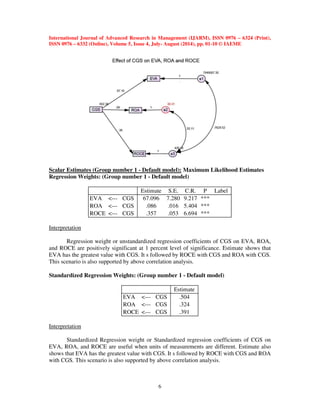
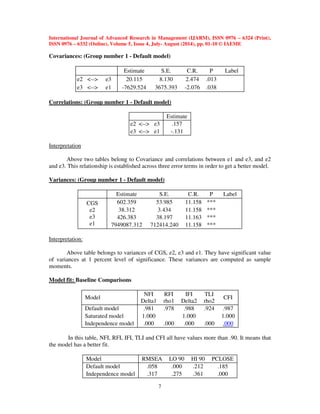
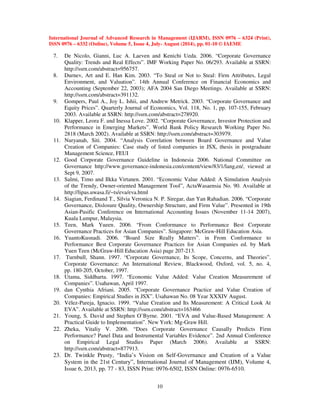

The study investigates the relationship between corporate governance (CG) mechanisms and corporate performance measures in Indian companies, specifically evaluating their impact on return on assets (ROA), return on capital employed (ROCE), and economic value added (EVA). Using a sample of 250 listed companies, the research finds significant positive correlations between CG scores and performance metrics, particularly noting that CG has the most substantial effect on EVA. This research emphasizes the importance of good corporate governance in enhancing shareholder value and informing investment decisions.


