SlideShare a Scribd company logo
In Vivo Solid-Phase Microextraction with in Vitro Calibration:
Determination of Off-Flavor Components in Live Fish
Ziwei Bai,†
Alexandre Pilote,‡
Pallab Kumer Sarker,‡
Grant Vandenberg,‡
and Janusz Pawliszyn*,†
†
Department of Chemistry, University of Waterloo, Waterloo, Ontario N2L 3G1, Canada
‡
Department des Sciences Animales, Université Laval, Pavillon Paul-Comtois, Québec, Québec G1K 0A6, Canada
ABSTRACT: The presence of off-flavor compounds in fish
represents a significant economic problem encountered in
aquaculture production. The off-flavor compounds are due to
the absorption of substances produced by a range of
microorganisms. Currently, a number of strategies have been
used to prevent or limit the growth of these microorganisms.
Therefore, it is important to evaluate the effectiveness of
strategies via monitoring the concentrations of off-flavor
compounds in the recirculating aquaculture system. In vivo
solid-phase microextraction (SPME), a rapid and simple
sample preparation method, will allow monitoring the
concentration of off-flavor compounds in live fish. In this
research, geosmin and 2-methylisoborneol (2-MIB) produced
by cyanobacteria and actinomycetes, which are the major sources for “earthy” and “muddy” flavors in fish, were selected as
representatives. In order to accurately quantify these compounds in fish muscle, two kinetic calibration methods, on-fiber
standardization and measurement using predetermined sampling rate, were used as quantification methods, which were both
validated by traditional methods. The detection limit of in vivo SPME in fish muscle was 0.12 ng/g for geosmin and 0.21 ng/g for
2-MIB, which are both below the human sensory thresholds.
Recirculating aquaculture systems (RAS) are fish culture
systems in which water is largely reused after undergoing
treatment.1
Currently, commercial RAS production systems
typically recirculate over 99% of their water usage, thus
significantly reducing water consumption.2
In addition, RAS
improves opportunities for waste management and nutrient
recycling,3
thus providing better hygiene and disease manage-
ment,4
as well as biological pollution control.5
However, one
major disadvantage of producing fish in RAS is the presence of
off-flavor compounds. Among those flavors, the “earthy” and
“muddy” odors constitute more than 80% of the off-flavor
problems found in farm-raised fish.6
Such flavors come from
the absorption by fish of substances including geosmin and 2-
methylisoborneol (2-MIB), which are produced by a broad
group of microorganisms in water.7−9
The presence of
undesirable off-flavors in products raised in RAS may cause a
major reduction in the consumption of the products, or make
them unsuitable for sale. The presence of off-flavors therefore
represents a major hurdle for the wide-scale adoption of RAS
technologies as a production technique.
Currently in RAS research, there is focus on developing
strategies to prevent or limit the development of micro-
organisms that produce the off-flavor compounds found in fish.
Therefore, in order to evaluate the effectiveness of these
strategies on microorganisms, a method needs to be
implemented that can monitor the level of target compounds
by repeatedly sampling the individual living fish in RAS over
time. Recently, solid-phase microextraction (SPME) has been
widely used as a rapid, inexpensive, and solvent-free sample
preparation method, which combines sampling, analyte
isolation, and enrichment into one step.10
Successful use of in vivo SPME depends on the selection of
an appropriate calibration method. The on-fiber standardization
method is one of the most widely used calibration methods for
SPME in vivo sampling,11−15
which uses the symmetry between
the desorption of deuterated standards from the extraction
phase to the sample and the absorption of analytes from sample
to the extraction phase.16
Recently, another calibration method
using predetermined sampling rates of the analytes has been
reported by Ouyang et al.17
It assumes that the rate of mass
transfer or sampling rate remains constant throughout the
duration of sampling within the linear range. The relationship
between the concentration of target analytes in the sample
matrixes (C0) and the extracted amount of analytes at time t(n)
can be expressed with eq 1:
=C n R t/0 s (1)
where Rs is the sampling rate for the target analyte and t is the
sampling time. Use of eq 1 assumes that the intersample matrix
differences in semisolid tissues (such as fish muscle) are slight
between individuals of the same species. Consequently, the
Received: November 15, 2012
Accepted: January 18, 2013
Published: January 18, 2013
Article
pubs.acs.org/ac
© 2013 American Chemical Society 2328 dx.doi.org/10.1021/ac3033245 | Anal. Chem. 2013, 85, 2328−2332
sampling rate of the SPME fiber can be predetermined under
laboratory conditions and directly used for real sample
analysis.18
With this method, no distribution coefficient (K)
determination and deuterated standard uploading prior to
sampling are needed any longer.
The objective of this study was to develop an effective and
simple method to determine geosmin and 2-MIB in fish using
in vivo sampling technique. In order to accomplish this goal,
two kinetic calibration methods were investigated and verified:
(1) on-fiber standardization and (2) measurement using
predetermined sampling rates of analytes. Finally, the
developed methods were applied for on-site determination of
off-flavors. These results were compared to those obtained from
the traditional methods of analysis using lethal sampling and
microwave distillation prior to SPME.
■ EXPERIMENTAL SECTION
Chemicals and Materials. Geosmin and 2-MIB were
purchased from Wako Chemicals U.S.A., Inc. Deuterated MIB
(MIB-d3) was obtained from CDN Isotopes Inc. (Pointe-Claire,
Quebec, Canada), and deuterated geosmin (geosmin-d3) was
purchased from Sigma-Aldrich (Oakville, Ontario, Canada),
with the purity of 99%. All chemicals purchased were of the
highest possible purity and were used without further
purification. Chloroform for fat content measurement was
purchased from EMD Chemicals Inc. (Damstadt, Germany).
HPLC (high-performance liquid chromatography) grade
methanol was purchased from Fisher Scientific (Unionville,
Ontario, Canada). HPLC grade acetone was obtained from
Caledon Laboratories Ltd. (Georgetown, Ontario, Canada).
Pump oil was purchased from Varian Vacuum Technologies
(Lexington, MA). Nanopure water was obtained using the
Barnstead Nanopure water system. The 1 cm metal core
commercial PDMS fibers were obtained from Supelco
(Bellefonte, PA). Taint-free rainbow trout fillets were
purchased from Sobeys Inc. (Ontario, Canada). Rainbow
trout fillets contaminated with geosmin and 2-MIB were
obtained from Alma Aquaculture Research Station (University
of Guelph, Ontario, Canada). All fish tissue experiments were
performed in accordance with protocols approved by our
institutional Animal Care Committee (AUP no. A-12-01) in the
Chemistry Lab Facility at the University of Waterloo. All in vivo
fish experimental procedures were approved by the Animal
Care Committee at University of Guelph (AUP no. 12R066).
Symmetry of Geosmin and 2-MIB on SPME under in
Vitro Condition for the On-Fiber Standardization
Calibration Method. Desorption time profiles of deuterated
standards and absorption time profiles of analytes were
performed simultaneously to verify the symmetry. Deuterated
standards preloaded onto the fiber prior to the extraction were
prepared by using headspace sampling from deuterated
standards pump oil solution under 25 °C. Both homogenized
and nonhomogenized fish tissue samples were utilized.
Contaminated homogenized fish muscle was obtained by
spiking specific amounts of geosmin and 2-MIB methanol
solution into taint-free homogenized fish tissue. Nonhomogen-
ized fish tissue with off-flavors was prepared by cutting each
sample in 4 g size. Sampling was conducted by directly inserting
the SPME fibers in the homogenized and nonhomogenized
fish. All the experiments were performed under 8.5 °C, the
same temperature as in vivo sampling. The absorption time
profile was obtained by extracting from geosmin and 2-MIB
contaminated samples for different sampling times. Meanwhile,
the desorption time profile was drawn by preloading same
amounts of standards and desorbing in the samples for different
times.
In Vivo Sampling System Setup. For this study, in vivo
sampling experiments were performed at Alma Aquaculture
Research Station, University of Guelph. The source of water in
the station was from the underground wells nearby and was
proved to contain no detectable 2-MIB or geosmin by using a
headspace SPME analysis technique.19
The water temperature
was kept constant at 8.5 °C. Rainbow trout (Oncorhynchus
mykiss) were of marketable table size at 900 ± 154 g (n = 48).
Before experiments, fish were acclimated with the diet in a flow-
through system 1 week prior to experimentation. The system
was located indoors and consisted of 16 (729 L) tanks. Each
tank held four fish, three for in vivo sampling and one for lethal
sampling. Before exposure to tainted water, the fish were
deprived of food for 48 h. This was in order to minimize
variations in metabolic rates and ventilation rates between
individual fish with different feeding histories.20
During the
exposure time, the fish were deprived of food as well. The
uptake of off-flavor compounds from contaminated water by
fish as well as the in vivo sampling experiments were both
performed in a static, albeit oxygen offered system (no water
flow rate). The water inside each static system (round tank)
was transferred from flow-through system, and the volume was
90 L.
The procedure for operating in vivo sampling was as follows:
First, fibers were prepared by uploading deuterated geosmin
standard from the headspace of pump oil solution. Before each
SPME sampling, fish were anesthetized in a 80 μg/mL MS-222
water solution for the duration of approximately 1 min. After
that, an 18 gauge needle was used to pierce the fish skin, where
it is below the anterior point of the dorsal fin (as shown in
Figure 1), and a 21 gauge long stainless steel wire was
introduced into the same perforation and penetrated to the
same length as the SPME fiber, because the needle was not as
long as the SPME fiber. Then the SPME fiber was inserted, and
the hub was pushed to the end. Following fiber placement, fish
were placed back in the static tank. After 30 min of SPME
extraction, the fish was anesthetized again. At last, the fiber was
removed, gently washed with Nanopure water, wiped with a
Kimwipe, sealed with a Teflon cap, wrapped with aluminum
foil, and stored in the dry ice until gas chromatography mass
spectrometry (GC/MS) analysis.
Figure 1. SPME fiber inserting position for in vivo sampling in fish
muscle.
Analytical Chemistry Article
dx.doi.org/10.1021/ac3033245 | Anal. Chem. 2013, 85, 2328−23322329
Instrumentation. A Varian 3800 GC coupled with a Varian
4000 electron ionization ion-trap mass spectrometer (GC/EI-
IT-MS) (Varian, Inc. Walnut Creek, CA, U.S.A.) was used for
analysis. The GC was equipped with a capillary column (RTX-
5, 30 m × 0.25 mm i.d., 0.25 μm film thickness) (Restek
Corporation, Bellefonte, PA, U.S.A.). The oven temperature
program was 60 °C (0.5 min) increasing at 40 °C/min to 110
°C, increasing at 1 °C/min to 117 °C, increasing at 5 °C/min
to 156 °C, increasing at 40 °C/min to 250 °C (10 min). The
split/splitless injector of the GC was equipped with a Merlin
microseal injector adapter (Merlin Instrument Company, Half
Moon Bay, CA, U.S.A.) for metal fiber desorption. For both
liquid injection and SPME, splitless mode was used, and split
was opened after 5 min of desorption. The temperature of the
transfer line was 280 and 240 °C for the ion trap. The column
flow rate of the helium carrier gas was 1 mL/min. The 1079
injector was equipped with a programmed temperature
vaporizer. The temperature of the injector was 250 °C. When
using selected ion storage (SIS) scan mode, m/z 112, m/z 150,
m/z 115, and m/z 138 were selected for quantification of
geosmin, 2-MIB, geosmin-d3, and MIB-d3, respectively. As
qualifier ions, m/z 126 and 182 were for geosmin, m/z 168 was
to represent 2-MIB, m/z 129 and 185 were for geosmin-d3, and
m/z 171 were selected for MIB-d3. When performing the in
vivo sampling analysis, 2-MIB required using MS/MS mode,
and geosmin kept using SIS mode. Under MS/MS mode, the
parent ion of 2-MIB m/z 95 yielded daughter ions m/z 67 and
m/z 91. The excitation amplitude was set as 1.0 V applied with
resonant waveform. The emission current and maximum
ionization time were set as 80 μA and 65 000 μs, respectively.
■ RESULTS AND DISCUSSION
Preliminary Experiments. Selected ion storage mode was
utilized for symmetry determination. To determine geosmin,
geosmin-d3 was used as an internal standard. In this case, the EI
spectrum of the labeled compound produced a base peak at m/
z 115, which contained three deuterium atoms, in the
agreement with the fragmentation proposed by Lloyd and
Grimm.21
The quantification of geosmin and geosmin-d3 was
achieved using the ion pair at m/z 112 and 115, and
qualification was established by using the ions m/z 126 and
182 for geosmin and m/z 129 and 185 for geosmin-d3.
However, for 2-MIB and MIB-d3, the base peak ion at m/z
95 for both was not a deuterated fragment. Finally, only m/z
150 and 138 could be decided to represent 2-MIB and MIB-d3.
However, in that case, the limit of detection for 2-MIB was as
high as 10 ng/g in fish tissue, which was more than 10 times
higher than the human sensory threshold.22
Consequently, the
on-fiber standardization calibration method is not suitable for
determination of low contamination of 2-MIB in fish.
Therefore, measurement using the predetermined sampling
rates method, which does not require the use of the internal
standard, was placed.
Fouling issues due to the adsorption of macromolecular
compounds on the SPME coating surface, such as lipids and
protein,23
was found after the fiber was desorbed in the GC in
the form of 2-MIB and geosmin peak intensity enhancement.
To address this, following the desorption, the fiber was gently
wiped with an acetone-soaked Kimwipes and rinsed with large
amounts of water, followed by conditioning in the GC injector
for 10 min at 250 °C. As a result, the repeatability of the fiber
was kept acceptable.
Symmetry of Desorption and Absorption Verification
under in Vivo and in Vitro Conditions. The kinetics of
absorption and desorption was performed in homogenized fish
tissue, nonhomogenized fish tissue, and live fish. Time profiles
were used for this verification. Because this calibration method
could not be used to determine a low concentration of 2-MIB
in fish tissue, the concentrations of 2-MIB in all these three
systems were high. The details about the concentration for both
analytes were as follows: homogenized fish tissue 0.5 μg/g for
2-MIB and 0.025 μg/g for geosmin; nonhomogenized fish
tissue and live fish were around 0.3 μg/g for both analytes in
these two systems. The time constants of absorption and
desorption were very similar for both 2-MIB and geosmin in all
three systems, which means the symmetry was kept all through
the desorption and absorption processes (as shown in Table 1).
Different Concentrations of Analytes in Homogen-
ized Fish Tissue. A various range of concentrations (0.5, 2.5,
5.0, 12.5, 25.0 ng/g) of 2-MIB and geosmin in homogenized
fish tissue were prepared and followed by a 30 min extraction.
Equation 2 describes the entire absorption kinetics of the
analyte from the sample matrixes to SPME liquid, in which n is
the amount of extracted analyte at time t, ne is the amount of
analyte extracted at equilibrium, and a is a absorption time
constant.24
According to eq 2, the extraction amount should be
proportional to the initial concentration, if all the parameters
keep constant. The linearity displayed in Figure 2 indicates that
the extraction time constant for both analytes remained
consistent in this concentration range. In addition, the value
of the extraction time constant was obtained in Table 1. This
discovery was important for both calibration methods. For the
on-fiber standardization calibration method, it needs the
Table 1. Time Constant Results and Conclusions for 2-MIB and Geosmin under Both in Vitro and in Vivo Conditionsa
2-MIB geosmin
desorption a (min−1
) (R2
) absorption a (min−1
) (R2
) desorption a (min−1
) (R2
) absorption a (min−1
) (R2
)
homogenized fish tissue 0.012 ± 0.002 (0.946) 0.011 ± 0.001 (0.984) 0.008 ± 0.001 (0.987) 0.008 ± 0.001 (0.984)
nonhomogenized fish tissue 0.012 ± 0.003 (0.844) 0.012 ± 0.006 (0.780) 0.007 ± 0.001 (0.884) 0.010 ± 0.004 (0.837)
live fish 0.010 ± 0.003 (0.852) 0.013 ± 0.006 (0.790) 0.012 ± 0.003 (0.747) 0.011 ± 0.007 (0.839)
a
Correlation coefficients are given in parentheses.
Figure 2. Different concentrations of analytes in homogenized fish
tissue.
Analytical Chemistry Article
dx.doi.org/10.1021/ac3033245 | Anal. Chem. 2013, 85, 2328−23322330
symmetry of desorption and absorption during the sampling
time. For the calibration method using a predetermined
sampling rate, it requires the constant sampling rate.
= − − = − −
+
n at n at
K V V
K V
C[1 exp( )] [1 exp( )]e
fs f s
fs s
0
(2)
Determination of Sampling Rate for Calibration Using
a Predetermined Rate. Different concentrations (0.5, 2.5,
5.0, 12.5, 25.0 ng/g) of 2-MIB and geosmin in homogenized
fish tissue were prepared to obtain the extraction amount n
under 30 min of sampling time, and all the other conditions
were performed the same as in vivo sampling SPME. Plotting
C0t versus n, the slope obtained was Rs (as shown in Figure 3).
As a result, the Rs value was determined to be 1.6 × 10⁻⁴
g/min
for 2-MIB and 7.8 × 10⁻⁵
g/min for geosmin.
Validation of in Vivo SPME Sampling Using Micro-
wave Distillation SPME (MD-SPME). Nine fish were exposed
to a low concentration of geosmin and 2-MIB (0.05 ng/mL) in
water. Preloading was performed by headspace extracting from
50 μg/g geosmin-d3 pump oil solution with agitation, and the
extraction time was 10 s under 25 °C. The on-fiber
standardization (OFS) calibration method was applied for the
quantification of geosmin, and the predetermined sampling rate
(PDSR) approach was used to determine both 2-MIB and
geosmin. Fat content of rainbow trout was assessed according
to Zhang et al.’s method.25
According to the results, there is no
obvious relationship between mass, fat, and concentration of
analytes. Fish from different tanks do not exhibit a significant
difference. To confirm the accuracy of results, a traditional
method, microwave distillation SPME, was used for validation.
Microwave distillation and SPME headspace extraction
procedures were executed in accordance with Lloyd and
Grimm’s publication.21
The same instrument parameters were
used as in vivo sampling analysis of fish. Table 2 displays the
results of off-flavor compounds concentrations of nine low-
contaminated fish using two sample preparation methods. The
Student t test was applied to confirm that the on-fiber
standardization calibration method and the measurement using
a predetermined sampling rate calibration method or in vivo
SPME and MD-SPME yield the same results, which validates
the use of the in vivo sampling SPME technique with both
calibration methods.
■ CONCLUSION AND FUTURE DIRECTIONS
An in vivo SPME sampling technique to measure the
concentration of off-flavor compounds in fish was developed.
When compared with traditional methods, it has the advantages
of time efficiency, simplicity of procedure, and most important,
the capability of monitoring target compound concentration
changes when sampling from the same individual fish. Kinetic
calibration methods were used for quantification. The on-fiber
standardization method was used to measure geosmin, while
predetermined kinetic rates were employed to determine the
concentration of both 2-MIB and geosmin in live fish. The
symmetry character of desorption of internal standards from
fiber and absorption of analytes onto fiber for these two
compounds was confirmed.
The future application of this method could assist in real-
time, nonlethal monitoring of key sensory qualities and drug/
pesticide or other contaminants residues of fish and other food
products prior to harvesting. To facilitate the on-site analysis, a
portable GC or other instrumentation could be utilized.
■ AUTHOR INFORMATION
Corresponding Author
*Phone: +1-519-888-4641. Fax: +1-519-746-0435. E-mail:
janusz@uwaterloo.ca.
Notes
The authors declare no competing financial interest.
■ ACKNOWLEDGMENTS
The authors thank the Natural Sciences and Engineering
Research Council (NSERC) of Canada for financial support.
The authors acknowledge Alma Research Station of University
of Guelph for their support in providing the in vivo sampling
equipment.
■ REFERENCES
(1) Rosenthal, H.; Castell, J. D.; Chiba, K.; Forster, J. R. M.; Hilge,
V.; Hogendoorn, H.; Mayo, R. D.; Muir, J. F.; Murray, K. R.; Petit, J.;
Wedemeyer, G. A.; Wheaton, F.; Wickins, J. EIFAC 1986, 100.
(2) Verdegem, M. C. J.; Bosma, R. H.; Verreth, J. A. J. Int. J. Water
Resour. Dev. 2006, 22, 101−113.
(3) Piedrahita, R. H. Aquaculture 2003, 226, 35−44.
(4) Summerfelt, S. T.; Sharrer, M. J.; Tsukuda, S. M.; Gearheart, M.
Aquaculture 2009, 40, 17−27.
Figure 3. Determination the Rs of 2-MIB and geosmin in
homogenized fish tissue.
Table 2. Results Comparison between MD-SPME and in
Vivo SPME
2-
MIB
(ng/
g)
geosmin
(ng/g)
fish
no.
mass
(g) sex
fat
content
(%) PDSR
MD-
SPME
(ng/g) OFS PDSR
MD-
SPME
(ng/g)
1 1013.0 F 3.4 3.4 3.0 2.6 2.6 3.0
2 883.3 M 3.0 3.9 3.9 3.0 3.3 3.7
3 855.4 M 2.7 2.8 3.6 2.1 2.2 2.9
4 1003.2 M 3.7 2.6 4.4 2.0 1.6 3.0
5 894.1 M 1.6 3.3 3.3 3.4 5.0 4.6
6 985.6 M 2.1 3.4 4.6 2.2 2.6 3.7
7 772.6 M 2.9 4.9 3.7 6.1 5.9 5.9
8 958.3 M 2.7 3.8 5.4 3.0 3.9 5.1
9 896.0 M 3.7 4.5 4.4 5.2 5.2 5.0
Analytical Chemistry Article
dx.doi.org/10.1021/ac3033245 | Anal. Chem. 2013, 85, 2328−23322331
(5) Zohar, Y.; Tal, Y.; Schreier, H. J.; Steven, C.; Stubblefield, J.;
Place, A. Urban Aquacult. 2005, 159−171.
(6) Grimm, C. C.; Lloyd, S. W.; Batista, R.; Zimba, P. V. J.
Chromatogr. Sci. 2000, 38, 289−296.
(7) Gerbek, N. N. J. Antibiot. 1969, 22, 508−509.
(8) Rosen, A. A.; Mashni, C. I.; Safferman, R. S. Water Treat. Exam.
1970, 19, 106−119.
(9) Yurkowski, M.; Tabachek, J. L. J. Fish. Res. Board Can. 1976, 33,
25−35.
(10) Arthur, C. L.; Pawliszyn, J. Anal. Chem. 1990, 62, 2145−2148.
(11) Zhou, S.; Zhao, W.; Pawliszyn, J. Anal. Chem. 2008, 80, 481−
490.
(12) Togunde, O. P.; Oakes, K.; Servos, M.; Pawliszyn, J. Anal. Chim.
Acta 2012, 742, 2−9.
(13) Zhang, X.; Oakes, K. D.; Hoque, M. E.; Luong, D.; Metcalfe, C.
D.; Pawliszyn, J.; Servos, M. R. Anal. Chem. 2011, 83, 3365−3370.
(14) Zhou, S.; Zhang, X.; Ouyang, G.; Es-haghi, A.; Pawliszyn, J.
Anal. Chem. 2007, 79, 1221−1230.
(15) Zhou, S.; Oakes, K. D.; Servos, M. R.; Pawliszyn, J. Environ. Sci.
Technol. 2008, 42, 6073−6079.
(16) Chen, Y.; Pawliszyn, J. Anal. Chem. 2004, 76, 5807−5815.
(17) Ouyang, G.; Vuckovic, D.; Pawliszyn, J. Chem. Rev. 2011, 111,
2784−2814.
(18) Ouyang, G.; Oakes, K. D.; Bragg, L.; Wang, S.; Cui, S.; Servos,
M. R.; Dixon, D. G.; Pawliszyn, J. Environ. Sci. Technol. 2010, 45,
7792−7798.
(19) Lloyd, S. W.; Lea, J. M.; Zimba, P. V.; Grimm, C. C. Water Res.
1998, 32, 2140−2146.
(20) Robertsona, R. F.; Jaunceyb, K.; Beveridgec, M. C. M.; Lawton,
L. A. Aquaculture 2005, 245, 89−99.
(21) Lloyd, S.W.; Grimm, C. C. J. Agric. Food Chem. 1999, 47, 164−
169.
(22) Robertson, R. F.; Jauncey, K.; Beveridge, M. C. M.; Lawton, L.
A. Aquaculture 2005, 245, 89−99.
(23) Pawliszyn, J. Anal. Chem. 2003, 75, 2543−2558.
(24) Pawliszyn, J. Handbook of Solid Phase Microextraction; Chemical
Industry Press: Beijing, China, 2009.
(25) Zhang, X.; Oakes, K. D.; Cui, S.; Bragg, L.; Servos, M. R.;
Pawliszyn, J. Environ. Sci. Technol. 2010, 44, 3417−3422.
Analytical Chemistry Article
dx.doi.org/10.1021/ac3033245 | Anal. Chem. 2013, 85, 2328−23322332

More Related Content

What's hot

Method Development and Validation-Solid Phase Extraction-Ultra Performance Li...
Method Development and Validation-Solid Phase Extraction-Ultra Performance Li...Method Development and Validation-Solid Phase Extraction-Ultra Performance Li...
Method Development and Validation-Solid Phase Extraction-Ultra Performance Li...
Partha Ray
 
Zina Al-Saffar 2016- BACT control biosenor_final article
Zina Al-Saffar 2016- BACT control biosenor_final articleZina Al-Saffar 2016- BACT control biosenor_final article
Zina Al-Saffar 2016- BACT control biosenor_final article
Zina Al-Saffar
 
Uzma Waheed JPAM_Vol_9_N_3_2145-2152
Uzma Waheed JPAM_Vol_9_N_3_2145-2152Uzma Waheed JPAM_Vol_9_N_3_2145-2152
Uzma Waheed JPAM_Vol_9_N_3_2145-2152
UZMA WAHEED
 
Jacobs Mara - Grad_Symposium_Poster_RH(2) converted
Jacobs Mara - Grad_Symposium_Poster_RH(2) convertedJacobs Mara - Grad_Symposium_Poster_RH(2) converted
Jacobs Mara - Grad_Symposium_Poster_RH(2) converted
Elizabeth Mara Jacobs
 
Concho_Research_Overview_report
Concho_Research_Overview_reportConcho_Research_Overview_report
Concho_Research_Overview_report
Allana Robertson
 
CYP2A6_HPLC_PK_2015 New Simple Method for Coumarin in Liver Cytochrome of Rats
CYP2A6_HPLC_PK_2015 New Simple Method for Coumarin in Liver Cytochrome of RatsCYP2A6_HPLC_PK_2015 New Simple Method for Coumarin in Liver Cytochrome of Rats
CYP2A6_HPLC_PK_2015 New Simple Method for Coumarin in Liver Cytochrome of Rats
Wael Ebied
 
Star Paper 2 - Pesticides
Star Paper 2 - PesticidesStar Paper 2 - Pesticides
Star Paper 2 - Pesticides
Ukwa Uche
 

What's hot (20)

Method Development and Validation-Solid Phase Extraction-Ultra Performance Li...
Method Development and Validation-Solid Phase Extraction-Ultra Performance Li...Method Development and Validation-Solid Phase Extraction-Ultra Performance Li...
Method Development and Validation-Solid Phase Extraction-Ultra Performance Li...
 
AOAC PAH FLD
AOAC PAH FLDAOAC PAH FLD
AOAC PAH FLD
 
Zina Al-Saffar 2016- BACT control biosenor_final article
Zina Al-Saffar 2016- BACT control biosenor_final articleZina Al-Saffar 2016- BACT control biosenor_final article
Zina Al-Saffar 2016- BACT control biosenor_final article
 
E45012938
E45012938E45012938
E45012938
 
pcb
pcbpcb
pcb
 
Investigation into Effect of Soil Moisture Depletion on Vegetable Crop Uptake...
Investigation into Effect of Soil Moisture Depletion on Vegetable Crop Uptake...Investigation into Effect of Soil Moisture Depletion on Vegetable Crop Uptake...
Investigation into Effect of Soil Moisture Depletion on Vegetable Crop Uptake...
 
Uzma Waheed JPAM_Vol_9_N_3_2145-2152
Uzma Waheed JPAM_Vol_9_N_3_2145-2152Uzma Waheed JPAM_Vol_9_N_3_2145-2152
Uzma Waheed JPAM_Vol_9_N_3_2145-2152
 
"Efficacy of vermiwash in the production of live fish food organisms"
"Efficacy of vermiwash in the production of live fish food organisms""Efficacy of vermiwash in the production of live fish food organisms"
"Efficacy of vermiwash in the production of live fish food organisms"
 
Algae for Conversion of Manure Nutrients to Animal Feed: Evaluation of Advanc...
Algae for Conversion of Manure Nutrients to Animal Feed: Evaluation of Advanc...Algae for Conversion of Manure Nutrients to Animal Feed: Evaluation of Advanc...
Algae for Conversion of Manure Nutrients to Animal Feed: Evaluation of Advanc...
 
Strawn et al, 2015
Strawn et al, 2015Strawn et al, 2015
Strawn et al, 2015
 
Jacobs Mara - Grad_Symposium_Poster_RH(2) converted
Jacobs Mara - Grad_Symposium_Poster_RH(2) convertedJacobs Mara - Grad_Symposium_Poster_RH(2) converted
Jacobs Mara - Grad_Symposium_Poster_RH(2) converted
 
Analysis of Herbicide Atrazine and Its Degradation Products in Agricultural S...
Analysis of Herbicide Atrazine and Its Degradation Products in Agricultural S...Analysis of Herbicide Atrazine and Its Degradation Products in Agricultural S...
Analysis of Herbicide Atrazine and Its Degradation Products in Agricultural S...
 
Concho_Research_Overview_report
Concho_Research_Overview_reportConcho_Research_Overview_report
Concho_Research_Overview_report
 
Application of phosphate oxygen isotope ratios to detect sources and cycling ...
Application of phosphate oxygen isotope ratios to detect sources and cycling ...Application of phosphate oxygen isotope ratios to detect sources and cycling ...
Application of phosphate oxygen isotope ratios to detect sources and cycling ...
 
Characterization of fresh moringa oleifera beverage
Characterization of fresh moringa oleifera beverageCharacterization of fresh moringa oleifera beverage
Characterization of fresh moringa oleifera beverage
 
CYP2A6_HPLC_PK_2015 New Simple Method for Coumarin in Liver Cytochrome of Rats
CYP2A6_HPLC_PK_2015 New Simple Method for Coumarin in Liver Cytochrome of RatsCYP2A6_HPLC_PK_2015 New Simple Method for Coumarin in Liver Cytochrome of Rats
CYP2A6_HPLC_PK_2015 New Simple Method for Coumarin in Liver Cytochrome of Rats
 
Developing tools to attenuate emerging contaminants in onsite wastewater trea...
Developing tools to attenuate emerging contaminants in onsite wastewater trea...Developing tools to attenuate emerging contaminants in onsite wastewater trea...
Developing tools to attenuate emerging contaminants in onsite wastewater trea...
 
INVESTIGATION OF IN-VITRO ANTHELMINTIC AND CYTOTOXIC ACTIVITIES OF ARTABOTRYS...
INVESTIGATION OF IN-VITRO ANTHELMINTIC AND CYTOTOXIC ACTIVITIES OF ARTABOTRYS...INVESTIGATION OF IN-VITRO ANTHELMINTIC AND CYTOTOXIC ACTIVITIES OF ARTABOTRYS...
INVESTIGATION OF IN-VITRO ANTHELMINTIC AND CYTOTOXIC ACTIVITIES OF ARTABOTRYS...
 
Master Presentation
Master PresentationMaster Presentation
Master Presentation
 
Star Paper 2 - Pesticides
Star Paper 2 - PesticidesStar Paper 2 - Pesticides
Star Paper 2 - Pesticides
 

Viewers also liked

исаак ньютон
исаак ньютонисаак ньютон
исаак ньютон
sunvywern
 
A new chelating sorbent for metal ion extraction under high
A new chelating sorbent for metal ion extraction under highA new chelating sorbent for metal ion extraction under high
A new chelating sorbent for metal ion extraction under high
Audry Arias
 
Pepsee system of irrigation
Pepsee system of irrigationPepsee system of irrigation
Pepsee system of irrigation
Pallabi Senapati
 
кто я
кто якто я
кто я
JIexa01
 
исаак ньютон
исаак ньютонисаак ньютон
исаак ньютон
sunvywern
 
Perと音楽
Perと音楽Perと音楽
Perと音楽
hitode909
 
Perlで伝統芸能
Perlで伝統芸能Perlで伝統芸能
Perlで伝統芸能
hitode909
 

Viewers also liked (18)

исаак ньютон
исаак ньютонисаак ньютон
исаак ньютон
 
A new chelating sorbent for metal ion extraction under high
A new chelating sorbent for metal ion extraction under highA new chelating sorbent for metal ion extraction under high
A new chelating sorbent for metal ion extraction under high
 
Salary report 2016
Salary report 2016Salary report 2016
Salary report 2016
 
Sindrome premenstrual
Sindrome premenstrualSindrome premenstrual
Sindrome premenstrual
 
Igor Neves | Caderno Técnico
Igor Neves | Caderno TécnicoIgor Neves | Caderno Técnico
Igor Neves | Caderno Técnico
 
Pepsee system of irrigation
Pepsee system of irrigationPepsee system of irrigation
Pepsee system of irrigation
 
An 0903-0042 en
An 0903-0042 enAn 0903-0042 en
An 0903-0042 en
 
An 0903-0042 en
An 0903-0042 enAn 0903-0042 en
An 0903-0042 en
 
Navegadores de internet
Navegadores de internetNavegadores de internet
Navegadores de internet
 
кто я
кто якто я
кто я
 
исаак ньютон
исаак ньютонисаак ньютон
исаак ньютон
 
freund|jungst
freund|jungstfreund|jungst
freund|jungst
 
Perと音楽
Perと音楽Perと音楽
Perと音楽
 
The X File of History - Câu chuyện lịch sử
The X File of History - Câu chuyện lịch sử  The X File of History - Câu chuyện lịch sử
The X File of History - Câu chuyện lịch sử
 
An essay on lepidoptera
An essay on lepidopteraAn essay on lepidoptera
An essay on lepidoptera
 
feromonas en insectos
feromonas en insectosferomonas en insectos
feromonas en insectos
 
Perlで伝統芸能
Perlで伝統芸能Perlで伝統芸能
Perlで伝統芸能
 
Cholera
CholeraCholera
Cholera
 

Similar to 10.1021@ac3033245

FoodChek_White Paper_Combined Method BAX Listeria monocytogenes _Actero Listeria
FoodChek_White Paper_Combined Method BAX Listeria monocytogenes _Actero ListeriaFoodChek_White Paper_Combined Method BAX Listeria monocytogenes _Actero Listeria
FoodChek_White Paper_Combined Method BAX Listeria monocytogenes _Actero Listeria
Sergey Olishevsky
 
FoodChek_White Paper_Combined Method BAX Listeria Genus Actero Listeria
FoodChek_White Paper_Combined Method BAX Listeria Genus Actero ListeriaFoodChek_White Paper_Combined Method BAX Listeria Genus Actero Listeria
FoodChek_White Paper_Combined Method BAX Listeria Genus Actero Listeria
Sergey Olishevsky
 
Conceição et al, 2006. orpotrin a novel vasoconstrictor peptide from the veno...
Conceição et al, 2006. orpotrin a novel vasoconstrictor peptide from the veno...Conceição et al, 2006. orpotrin a novel vasoconstrictor peptide from the veno...
Conceição et al, 2006. orpotrin a novel vasoconstrictor peptide from the veno...
pryloock
 
Conventional and modern methods for detection of spoilage
Conventional and modern methods for detection of spoilageConventional and modern methods for detection of spoilage
Conventional and modern methods for detection of spoilage
AnuKiruthika
 
Uploaded file 130063320915382275
Uploaded file 130063320915382275Uploaded file 130063320915382275
Uploaded file 130063320915382275
준호 유
 

Similar to 10.1021@ac3033245 (20)

ca3711en.pdf
ca3711en.pdfca3711en.pdf
ca3711en.pdf
 
FoodChek_White Paper_Combined Method BAX Listeria monocytogenes _Actero Listeria
FoodChek_White Paper_Combined Method BAX Listeria monocytogenes _Actero ListeriaFoodChek_White Paper_Combined Method BAX Listeria monocytogenes _Actero Listeria
FoodChek_White Paper_Combined Method BAX Listeria monocytogenes _Actero Listeria
 
FoodChek_White Paper_Combined Method BAX Listeria Genus Actero Listeria
FoodChek_White Paper_Combined Method BAX Listeria Genus Actero ListeriaFoodChek_White Paper_Combined Method BAX Listeria Genus Actero Listeria
FoodChek_White Paper_Combined Method BAX Listeria Genus Actero Listeria
 
Formulation and Evaluation of Atorvastatin Calcium Niosomes
Formulation and Evaluation of Atorvastatin Calcium NiosomesFormulation and Evaluation of Atorvastatin Calcium Niosomes
Formulation and Evaluation of Atorvastatin Calcium Niosomes
 
An Investigation Into The Mechanisms Underlying Enhanced Biosulphidogenesis I...
An Investigation Into The Mechanisms Underlying Enhanced Biosulphidogenesis I...An Investigation Into The Mechanisms Underlying Enhanced Biosulphidogenesis I...
An Investigation Into The Mechanisms Underlying Enhanced Biosulphidogenesis I...
 
Conceição et al, 2006. orpotrin a novel vasoconstrictor peptide from the veno...
Conceição et al, 2006. orpotrin a novel vasoconstrictor peptide from the veno...Conceição et al, 2006. orpotrin a novel vasoconstrictor peptide from the veno...
Conceição et al, 2006. orpotrin a novel vasoconstrictor peptide from the veno...
 
JBR_Eszter_Tuboly
JBR_Eszter_TubolyJBR_Eszter_Tuboly
JBR_Eszter_Tuboly
 
vora and raikwar
vora and raikwarvora and raikwar
vora and raikwar
 
Cultivation of an Aquaponic Culture with Qualitative Estimates of Growth and ...
Cultivation of an Aquaponic Culture with Qualitative Estimates of Growth and ...Cultivation of an Aquaponic Culture with Qualitative Estimates of Growth and ...
Cultivation of an Aquaponic Culture with Qualitative Estimates of Growth and ...
 
Colitag 16 - 48 Hour Presentation
Colitag 16 - 48 Hour PresentationColitag 16 - 48 Hour Presentation
Colitag 16 - 48 Hour Presentation
 
Conventional and modern methods for detection of spoilage
Conventional and modern methods for detection of spoilageConventional and modern methods for detection of spoilage
Conventional and modern methods for detection of spoilage
 
M0557376
M0557376M0557376
M0557376
 
Biosorption of Malathion pesticide using Spirogyra sp
Biosorption of Malathion pesticide using Spirogyra spBiosorption of Malathion pesticide using Spirogyra sp
Biosorption of Malathion pesticide using Spirogyra sp
 
A pilot scale integrated seaweed (Ulva lactuca) & abalone (Haliotis midae) re...
A pilot scale integrated seaweed (Ulva lactuca) & abalone (Haliotis midae) re...A pilot scale integrated seaweed (Ulva lactuca) & abalone (Haliotis midae) re...
A pilot scale integrated seaweed (Ulva lactuca) & abalone (Haliotis midae) re...
 
In-Vivo Evaluation of Rifampicin Loaded Nanospheres: Biodistribution and Myco...
In-Vivo Evaluation of Rifampicin Loaded Nanospheres: Biodistribution and Myco...In-Vivo Evaluation of Rifampicin Loaded Nanospheres: Biodistribution and Myco...
In-Vivo Evaluation of Rifampicin Loaded Nanospheres: Biodistribution and Myco...
 
Enterocin 55 produced by non rabbit-derived strain Enterococcus faecium EF55 ...
Enterocin 55 produced by non rabbit-derived strain Enterococcus faecium EF55 ...Enterocin 55 produced by non rabbit-derived strain Enterococcus faecium EF55 ...
Enterocin 55 produced by non rabbit-derived strain Enterococcus faecium EF55 ...
 
Pig-a
Pig-aPig-a
Pig-a
 
Rapid microbiological methods
Rapid microbiological methodsRapid microbiological methods
Rapid microbiological methods
 
Uploaded file 130063320915382275
Uploaded file 130063320915382275Uploaded file 130063320915382275
Uploaded file 130063320915382275
 
Virulence Phenotype, Physicochemical Properties and Biofilm Formation of Pseu...
Virulence Phenotype, Physicochemical Properties and Biofilm Formation of Pseu...Virulence Phenotype, Physicochemical Properties and Biofilm Formation of Pseu...
Virulence Phenotype, Physicochemical Properties and Biofilm Formation of Pseu...
 

Recently uploaded

Green house gases GlobalWarmingPotential.pptx
Green house gases GlobalWarmingPotential.pptxGreen house gases GlobalWarmingPotential.pptx
Green house gases GlobalWarmingPotential.pptx
ViniHema
 
Genetic diversity and association analysis for different morphological traits...
Genetic diversity and association analysis for different morphological traits...Genetic diversity and association analysis for different morphological traits...
Genetic diversity and association analysis for different morphological traits...
Open Access Research Paper
 
一比一原版(Lincoln毕业证)新西兰林肯大学毕业证成绩单
一比一原版(Lincoln毕业证)新西兰林肯大学毕业证成绩单一比一原版(Lincoln毕业证)新西兰林肯大学毕业证成绩单
一比一原版(Lincoln毕业证)新西兰林肯大学毕业证成绩单
tyvaq
 
Use of Raffias’ species (Raphia spp.) and its impact on socioeconomic charact...
Use of Raffias’ species (Raphia spp.) and its impact on socioeconomic charact...Use of Raffias’ species (Raphia spp.) and its impact on socioeconomic charact...
Use of Raffias’ species (Raphia spp.) and its impact on socioeconomic charact...
Open Access Research Paper
 
一比一原版(Monash毕业证)莫纳什大学毕业证成绩单
一比一原版(Monash毕业证)莫纳什大学毕业证成绩单一比一原版(Monash毕业证)莫纳什大学毕业证成绩单
一比一原版(Monash毕业证)莫纳什大学毕业证成绩单
pcoow
 

Recently uploaded (20)

DRAFT NRW Recreation Strategy - People and Nature thriving together
DRAFT NRW Recreation Strategy - People and Nature thriving togetherDRAFT NRW Recreation Strategy - People and Nature thriving together
DRAFT NRW Recreation Strategy - People and Nature thriving together
 
Powers and Functions of CPCB - The Water Act 1974.pdf
Powers and Functions of CPCB - The Water Act 1974.pdfPowers and Functions of CPCB - The Water Act 1974.pdf
Powers and Functions of CPCB - The Water Act 1974.pdf
 
Green house gases GlobalWarmingPotential.pptx
Green house gases GlobalWarmingPotential.pptxGreen house gases GlobalWarmingPotential.pptx
Green house gases GlobalWarmingPotential.pptx
 
Presentación Giulio Quaggiotto-Diálogo improbable .pptx.pdf
Presentación Giulio Quaggiotto-Diálogo improbable .pptx.pdfPresentación Giulio Quaggiotto-Diálogo improbable .pptx.pdf
Presentación Giulio Quaggiotto-Diálogo improbable .pptx.pdf
 
DESERT ECOSYSTEM AND ITS CHARACTERISTICS AND TYPES
DESERT ECOSYSTEM AND ITS CHARACTERISTICS AND TYPESDESERT ECOSYSTEM AND ITS CHARACTERISTICS AND TYPES
DESERT ECOSYSTEM AND ITS CHARACTERISTICS AND TYPES
 
Artificial Reefs by Kuddle Life Foundation - May 2024
Artificial Reefs by Kuddle Life Foundation - May 2024Artificial Reefs by Kuddle Life Foundation - May 2024
Artificial Reefs by Kuddle Life Foundation - May 2024
 
Genetic diversity and association analysis for different morphological traits...
Genetic diversity and association analysis for different morphological traits...Genetic diversity and association analysis for different morphological traits...
Genetic diversity and association analysis for different morphological traits...
 
Environmental Science Book By Dr. Y.K. Singh
Environmental Science Book By Dr. Y.K. SinghEnvironmental Science Book By Dr. Y.K. Singh
Environmental Science Book By Dr. Y.K. Singh
 
International+e-Commerce+Platform-www.cfye-commerce.shop
International+e-Commerce+Platform-www.cfye-commerce.shopInternational+e-Commerce+Platform-www.cfye-commerce.shop
International+e-Commerce+Platform-www.cfye-commerce.shop
 
The State Board for Water Pollution - The Water Act 1974 .pptx
The State Board for  Water Pollution - The Water Act 1974  .pptxThe State Board for  Water Pollution - The Water Act 1974  .pptx
The State Board for Water Pollution - The Water Act 1974 .pptx
 
Paper: Man and Environmental relationship
Paper: Man and Environmental relationshipPaper: Man and Environmental relationship
Paper: Man and Environmental relationship
 
Navigating the complex landscape of AI governance
Navigating the complex landscape of AI governanceNavigating the complex landscape of AI governance
Navigating the complex landscape of AI governance
 
Natural farming @ Dr. Siddhartha S. Jena.pptx
Natural farming @ Dr. Siddhartha S. Jena.pptxNatural farming @ Dr. Siddhartha S. Jena.pptx
Natural farming @ Dr. Siddhartha S. Jena.pptx
 
一比一原版(Lincoln毕业证)新西兰林肯大学毕业证成绩单
一比一原版(Lincoln毕业证)新西兰林肯大学毕业证成绩单一比一原版(Lincoln毕业证)新西兰林肯大学毕业证成绩单
一比一原版(Lincoln毕业证)新西兰林肯大学毕业证成绩单
 
Environmental Impact Assessment (EIA) in Nepal.pptx
Environmental Impact Assessment (EIA) in Nepal.pptxEnvironmental Impact Assessment (EIA) in Nepal.pptx
Environmental Impact Assessment (EIA) in Nepal.pptx
 
@@how to Join @occult for money ritual..☎️+2349022657119.
@@how to Join @occult for money ritual..☎️+2349022657119.@@how to Join @occult for money ritual..☎️+2349022657119.
@@how to Join @occult for money ritual..☎️+2349022657119.
 
Alert-driven Community-based Forest monitoring: A case of the Peruvian Amazon
Alert-driven Community-based Forest monitoring: A case of the Peruvian AmazonAlert-driven Community-based Forest monitoring: A case of the Peruvian Amazon
Alert-driven Community-based Forest monitoring: A case of the Peruvian Amazon
 
Use of Raffias’ species (Raphia spp.) and its impact on socioeconomic charact...
Use of Raffias’ species (Raphia spp.) and its impact on socioeconomic charact...Use of Raffias’ species (Raphia spp.) and its impact on socioeconomic charact...
Use of Raffias’ species (Raphia spp.) and its impact on socioeconomic charact...
 
ppt on beauty of the nature by Palak.pptx
ppt on  beauty of the nature by Palak.pptxppt on  beauty of the nature by Palak.pptx
ppt on beauty of the nature by Palak.pptx
 
一比一原版(Monash毕业证)莫纳什大学毕业证成绩单
一比一原版(Monash毕业证)莫纳什大学毕业证成绩单一比一原版(Monash毕业证)莫纳什大学毕业证成绩单
一比一原版(Monash毕业证)莫纳什大学毕业证成绩单
 

10.1021@ac3033245

  • 1. In Vivo Solid-Phase Microextraction with in Vitro Calibration: Determination of Off-Flavor Components in Live Fish Ziwei Bai,† Alexandre Pilote,‡ Pallab Kumer Sarker,‡ Grant Vandenberg,‡ and Janusz Pawliszyn*,† † Department of Chemistry, University of Waterloo, Waterloo, Ontario N2L 3G1, Canada ‡ Department des Sciences Animales, Université Laval, Pavillon Paul-Comtois, Québec, Québec G1K 0A6, Canada ABSTRACT: The presence of off-flavor compounds in fish represents a significant economic problem encountered in aquaculture production. The off-flavor compounds are due to the absorption of substances produced by a range of microorganisms. Currently, a number of strategies have been used to prevent or limit the growth of these microorganisms. Therefore, it is important to evaluate the effectiveness of strategies via monitoring the concentrations of off-flavor compounds in the recirculating aquaculture system. In vivo solid-phase microextraction (SPME), a rapid and simple sample preparation method, will allow monitoring the concentration of off-flavor compounds in live fish. In this research, geosmin and 2-methylisoborneol (2-MIB) produced by cyanobacteria and actinomycetes, which are the major sources for “earthy” and “muddy” flavors in fish, were selected as representatives. In order to accurately quantify these compounds in fish muscle, two kinetic calibration methods, on-fiber standardization and measurement using predetermined sampling rate, were used as quantification methods, which were both validated by traditional methods. The detection limit of in vivo SPME in fish muscle was 0.12 ng/g for geosmin and 0.21 ng/g for 2-MIB, which are both below the human sensory thresholds. Recirculating aquaculture systems (RAS) are fish culture systems in which water is largely reused after undergoing treatment.1 Currently, commercial RAS production systems typically recirculate over 99% of their water usage, thus significantly reducing water consumption.2 In addition, RAS improves opportunities for waste management and nutrient recycling,3 thus providing better hygiene and disease manage- ment,4 as well as biological pollution control.5 However, one major disadvantage of producing fish in RAS is the presence of off-flavor compounds. Among those flavors, the “earthy” and “muddy” odors constitute more than 80% of the off-flavor problems found in farm-raised fish.6 Such flavors come from the absorption by fish of substances including geosmin and 2- methylisoborneol (2-MIB), which are produced by a broad group of microorganisms in water.7−9 The presence of undesirable off-flavors in products raised in RAS may cause a major reduction in the consumption of the products, or make them unsuitable for sale. The presence of off-flavors therefore represents a major hurdle for the wide-scale adoption of RAS technologies as a production technique. Currently in RAS research, there is focus on developing strategies to prevent or limit the development of micro- organisms that produce the off-flavor compounds found in fish. Therefore, in order to evaluate the effectiveness of these strategies on microorganisms, a method needs to be implemented that can monitor the level of target compounds by repeatedly sampling the individual living fish in RAS over time. Recently, solid-phase microextraction (SPME) has been widely used as a rapid, inexpensive, and solvent-free sample preparation method, which combines sampling, analyte isolation, and enrichment into one step.10 Successful use of in vivo SPME depends on the selection of an appropriate calibration method. The on-fiber standardization method is one of the most widely used calibration methods for SPME in vivo sampling,11−15 which uses the symmetry between the desorption of deuterated standards from the extraction phase to the sample and the absorption of analytes from sample to the extraction phase.16 Recently, another calibration method using predetermined sampling rates of the analytes has been reported by Ouyang et al.17 It assumes that the rate of mass transfer or sampling rate remains constant throughout the duration of sampling within the linear range. The relationship between the concentration of target analytes in the sample matrixes (C0) and the extracted amount of analytes at time t(n) can be expressed with eq 1: =C n R t/0 s (1) where Rs is the sampling rate for the target analyte and t is the sampling time. Use of eq 1 assumes that the intersample matrix differences in semisolid tissues (such as fish muscle) are slight between individuals of the same species. Consequently, the Received: November 15, 2012 Accepted: January 18, 2013 Published: January 18, 2013 Article pubs.acs.org/ac © 2013 American Chemical Society 2328 dx.doi.org/10.1021/ac3033245 | Anal. Chem. 2013, 85, 2328−2332
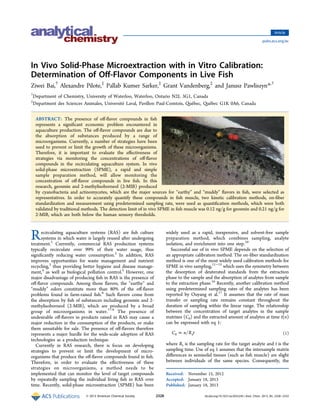
  • 2. sampling rate of the SPME fiber can be predetermined under laboratory conditions and directly used for real sample analysis.18 With this method, no distribution coefficient (K) determination and deuterated standard uploading prior to sampling are needed any longer. The objective of this study was to develop an effective and simple method to determine geosmin and 2-MIB in fish using in vivo sampling technique. In order to accomplish this goal, two kinetic calibration methods were investigated and verified: (1) on-fiber standardization and (2) measurement using predetermined sampling rates of analytes. Finally, the developed methods were applied for on-site determination of off-flavors. These results were compared to those obtained from the traditional methods of analysis using lethal sampling and microwave distillation prior to SPME. ■ EXPERIMENTAL SECTION Chemicals and Materials. Geosmin and 2-MIB were purchased from Wako Chemicals U.S.A., Inc. Deuterated MIB (MIB-d3) was obtained from CDN Isotopes Inc. (Pointe-Claire, Quebec, Canada), and deuterated geosmin (geosmin-d3) was purchased from Sigma-Aldrich (Oakville, Ontario, Canada), with the purity of 99%. All chemicals purchased were of the highest possible purity and were used without further purification. Chloroform for fat content measurement was purchased from EMD Chemicals Inc. (Damstadt, Germany). HPLC (high-performance liquid chromatography) grade methanol was purchased from Fisher Scientific (Unionville, Ontario, Canada). HPLC grade acetone was obtained from Caledon Laboratories Ltd. (Georgetown, Ontario, Canada). Pump oil was purchased from Varian Vacuum Technologies (Lexington, MA). Nanopure water was obtained using the Barnstead Nanopure water system. The 1 cm metal core commercial PDMS fibers were obtained from Supelco (Bellefonte, PA). Taint-free rainbow trout fillets were purchased from Sobeys Inc. (Ontario, Canada). Rainbow trout fillets contaminated with geosmin and 2-MIB were obtained from Alma Aquaculture Research Station (University of Guelph, Ontario, Canada). All fish tissue experiments were performed in accordance with protocols approved by our institutional Animal Care Committee (AUP no. A-12-01) in the Chemistry Lab Facility at the University of Waterloo. All in vivo fish experimental procedures were approved by the Animal Care Committee at University of Guelph (AUP no. 12R066). Symmetry of Geosmin and 2-MIB on SPME under in Vitro Condition for the On-Fiber Standardization Calibration Method. Desorption time profiles of deuterated standards and absorption time profiles of analytes were performed simultaneously to verify the symmetry. Deuterated standards preloaded onto the fiber prior to the extraction were prepared by using headspace sampling from deuterated standards pump oil solution under 25 °C. Both homogenized and nonhomogenized fish tissue samples were utilized. Contaminated homogenized fish muscle was obtained by spiking specific amounts of geosmin and 2-MIB methanol solution into taint-free homogenized fish tissue. Nonhomogen- ized fish tissue with off-flavors was prepared by cutting each sample in 4 g size. Sampling was conducted by directly inserting the SPME fibers in the homogenized and nonhomogenized fish. All the experiments were performed under 8.5 °C, the same temperature as in vivo sampling. The absorption time profile was obtained by extracting from geosmin and 2-MIB contaminated samples for different sampling times. Meanwhile, the desorption time profile was drawn by preloading same amounts of standards and desorbing in the samples for different times. In Vivo Sampling System Setup. For this study, in vivo sampling experiments were performed at Alma Aquaculture Research Station, University of Guelph. The source of water in the station was from the underground wells nearby and was proved to contain no detectable 2-MIB or geosmin by using a headspace SPME analysis technique.19 The water temperature was kept constant at 8.5 °C. Rainbow trout (Oncorhynchus mykiss) were of marketable table size at 900 ± 154 g (n = 48). Before experiments, fish were acclimated with the diet in a flow- through system 1 week prior to experimentation. The system was located indoors and consisted of 16 (729 L) tanks. Each tank held four fish, three for in vivo sampling and one for lethal sampling. Before exposure to tainted water, the fish were deprived of food for 48 h. This was in order to minimize variations in metabolic rates and ventilation rates between individual fish with different feeding histories.20 During the exposure time, the fish were deprived of food as well. The uptake of off-flavor compounds from contaminated water by fish as well as the in vivo sampling experiments were both performed in a static, albeit oxygen offered system (no water flow rate). The water inside each static system (round tank) was transferred from flow-through system, and the volume was 90 L. The procedure for operating in vivo sampling was as follows: First, fibers were prepared by uploading deuterated geosmin standard from the headspace of pump oil solution. Before each SPME sampling, fish were anesthetized in a 80 μg/mL MS-222 water solution for the duration of approximately 1 min. After that, an 18 gauge needle was used to pierce the fish skin, where it is below the anterior point of the dorsal fin (as shown in Figure 1), and a 21 gauge long stainless steel wire was introduced into the same perforation and penetrated to the same length as the SPME fiber, because the needle was not as long as the SPME fiber. Then the SPME fiber was inserted, and the hub was pushed to the end. Following fiber placement, fish were placed back in the static tank. After 30 min of SPME extraction, the fish was anesthetized again. At last, the fiber was removed, gently washed with Nanopure water, wiped with a Kimwipe, sealed with a Teflon cap, wrapped with aluminum foil, and stored in the dry ice until gas chromatography mass spectrometry (GC/MS) analysis. Figure 1. SPME fiber inserting position for in vivo sampling in fish muscle. Analytical Chemistry Article dx.doi.org/10.1021/ac3033245 | Anal. Chem. 2013, 85, 2328−23322329
  • 3. Instrumentation. A Varian 3800 GC coupled with a Varian 4000 electron ionization ion-trap mass spectrometer (GC/EI- IT-MS) (Varian, Inc. Walnut Creek, CA, U.S.A.) was used for analysis. The GC was equipped with a capillary column (RTX- 5, 30 m × 0.25 mm i.d., 0.25 μm film thickness) (Restek Corporation, Bellefonte, PA, U.S.A.). The oven temperature program was 60 °C (0.5 min) increasing at 40 °C/min to 110 °C, increasing at 1 °C/min to 117 °C, increasing at 5 °C/min to 156 °C, increasing at 40 °C/min to 250 °C (10 min). The split/splitless injector of the GC was equipped with a Merlin microseal injector adapter (Merlin Instrument Company, Half Moon Bay, CA, U.S.A.) for metal fiber desorption. For both liquid injection and SPME, splitless mode was used, and split was opened after 5 min of desorption. The temperature of the transfer line was 280 and 240 °C for the ion trap. The column flow rate of the helium carrier gas was 1 mL/min. The 1079 injector was equipped with a programmed temperature vaporizer. The temperature of the injector was 250 °C. When using selected ion storage (SIS) scan mode, m/z 112, m/z 150, m/z 115, and m/z 138 were selected for quantification of geosmin, 2-MIB, geosmin-d3, and MIB-d3, respectively. As qualifier ions, m/z 126 and 182 were for geosmin, m/z 168 was to represent 2-MIB, m/z 129 and 185 were for geosmin-d3, and m/z 171 were selected for MIB-d3. When performing the in vivo sampling analysis, 2-MIB required using MS/MS mode, and geosmin kept using SIS mode. Under MS/MS mode, the parent ion of 2-MIB m/z 95 yielded daughter ions m/z 67 and m/z 91. The excitation amplitude was set as 1.0 V applied with resonant waveform. The emission current and maximum ionization time were set as 80 μA and 65 000 μs, respectively. ■ RESULTS AND DISCUSSION Preliminary Experiments. Selected ion storage mode was utilized for symmetry determination. To determine geosmin, geosmin-d3 was used as an internal standard. In this case, the EI spectrum of the labeled compound produced a base peak at m/ z 115, which contained three deuterium atoms, in the agreement with the fragmentation proposed by Lloyd and Grimm.21 The quantification of geosmin and geosmin-d3 was achieved using the ion pair at m/z 112 and 115, and qualification was established by using the ions m/z 126 and 182 for geosmin and m/z 129 and 185 for geosmin-d3. However, for 2-MIB and MIB-d3, the base peak ion at m/z 95 for both was not a deuterated fragment. Finally, only m/z 150 and 138 could be decided to represent 2-MIB and MIB-d3. However, in that case, the limit of detection for 2-MIB was as high as 10 ng/g in fish tissue, which was more than 10 times higher than the human sensory threshold.22 Consequently, the on-fiber standardization calibration method is not suitable for determination of low contamination of 2-MIB in fish. Therefore, measurement using the predetermined sampling rates method, which does not require the use of the internal standard, was placed. Fouling issues due to the adsorption of macromolecular compounds on the SPME coating surface, such as lipids and protein,23 was found after the fiber was desorbed in the GC in the form of 2-MIB and geosmin peak intensity enhancement. To address this, following the desorption, the fiber was gently wiped with an acetone-soaked Kimwipes and rinsed with large amounts of water, followed by conditioning in the GC injector for 10 min at 250 °C. As a result, the repeatability of the fiber was kept acceptable. Symmetry of Desorption and Absorption Verification under in Vivo and in Vitro Conditions. The kinetics of absorption and desorption was performed in homogenized fish tissue, nonhomogenized fish tissue, and live fish. Time profiles were used for this verification. Because this calibration method could not be used to determine a low concentration of 2-MIB in fish tissue, the concentrations of 2-MIB in all these three systems were high. The details about the concentration for both analytes were as follows: homogenized fish tissue 0.5 μg/g for 2-MIB and 0.025 μg/g for geosmin; nonhomogenized fish tissue and live fish were around 0.3 μg/g for both analytes in these two systems. The time constants of absorption and desorption were very similar for both 2-MIB and geosmin in all three systems, which means the symmetry was kept all through the desorption and absorption processes (as shown in Table 1). Different Concentrations of Analytes in Homogen- ized Fish Tissue. A various range of concentrations (0.5, 2.5, 5.0, 12.5, 25.0 ng/g) of 2-MIB and geosmin in homogenized fish tissue were prepared and followed by a 30 min extraction. Equation 2 describes the entire absorption kinetics of the analyte from the sample matrixes to SPME liquid, in which n is the amount of extracted analyte at time t, ne is the amount of analyte extracted at equilibrium, and a is a absorption time constant.24 According to eq 2, the extraction amount should be proportional to the initial concentration, if all the parameters keep constant. The linearity displayed in Figure 2 indicates that the extraction time constant for both analytes remained consistent in this concentration range. In addition, the value of the extraction time constant was obtained in Table 1. This discovery was important for both calibration methods. For the on-fiber standardization calibration method, it needs the Table 1. Time Constant Results and Conclusions for 2-MIB and Geosmin under Both in Vitro and in Vivo Conditionsa 2-MIB geosmin desorption a (min−1 ) (R2 ) absorption a (min−1 ) (R2 ) desorption a (min−1 ) (R2 ) absorption a (min−1 ) (R2 ) homogenized fish tissue 0.012 ± 0.002 (0.946) 0.011 ± 0.001 (0.984) 0.008 ± 0.001 (0.987) 0.008 ± 0.001 (0.984) nonhomogenized fish tissue 0.012 ± 0.003 (0.844) 0.012 ± 0.006 (0.780) 0.007 ± 0.001 (0.884) 0.010 ± 0.004 (0.837) live fish 0.010 ± 0.003 (0.852) 0.013 ± 0.006 (0.790) 0.012 ± 0.003 (0.747) 0.011 ± 0.007 (0.839) a Correlation coefficients are given in parentheses. Figure 2. Different concentrations of analytes in homogenized fish tissue. Analytical Chemistry Article dx.doi.org/10.1021/ac3033245 | Anal. Chem. 2013, 85, 2328−23322330
  • 4. symmetry of desorption and absorption during the sampling time. For the calibration method using a predetermined sampling rate, it requires the constant sampling rate. = − − = − − + n at n at K V V K V C[1 exp( )] [1 exp( )]e fs f s fs s 0 (2) Determination of Sampling Rate for Calibration Using a Predetermined Rate. Different concentrations (0.5, 2.5, 5.0, 12.5, 25.0 ng/g) of 2-MIB and geosmin in homogenized fish tissue were prepared to obtain the extraction amount n under 30 min of sampling time, and all the other conditions were performed the same as in vivo sampling SPME. Plotting C0t versus n, the slope obtained was Rs (as shown in Figure 3). As a result, the Rs value was determined to be 1.6 × 10⁻⁴ g/min for 2-MIB and 7.8 × 10⁻⁵ g/min for geosmin. Validation of in Vivo SPME Sampling Using Micro- wave Distillation SPME (MD-SPME). Nine fish were exposed to a low concentration of geosmin and 2-MIB (0.05 ng/mL) in water. Preloading was performed by headspace extracting from 50 μg/g geosmin-d3 pump oil solution with agitation, and the extraction time was 10 s under 25 °C. The on-fiber standardization (OFS) calibration method was applied for the quantification of geosmin, and the predetermined sampling rate (PDSR) approach was used to determine both 2-MIB and geosmin. Fat content of rainbow trout was assessed according to Zhang et al.’s method.25 According to the results, there is no obvious relationship between mass, fat, and concentration of analytes. Fish from different tanks do not exhibit a significant difference. To confirm the accuracy of results, a traditional method, microwave distillation SPME, was used for validation. Microwave distillation and SPME headspace extraction procedures were executed in accordance with Lloyd and Grimm’s publication.21 The same instrument parameters were used as in vivo sampling analysis of fish. Table 2 displays the results of off-flavor compounds concentrations of nine low- contaminated fish using two sample preparation methods. The Student t test was applied to confirm that the on-fiber standardization calibration method and the measurement using a predetermined sampling rate calibration method or in vivo SPME and MD-SPME yield the same results, which validates the use of the in vivo sampling SPME technique with both calibration methods. ■ CONCLUSION AND FUTURE DIRECTIONS An in vivo SPME sampling technique to measure the concentration of off-flavor compounds in fish was developed. When compared with traditional methods, it has the advantages of time efficiency, simplicity of procedure, and most important, the capability of monitoring target compound concentration changes when sampling from the same individual fish. Kinetic calibration methods were used for quantification. The on-fiber standardization method was used to measure geosmin, while predetermined kinetic rates were employed to determine the concentration of both 2-MIB and geosmin in live fish. The symmetry character of desorption of internal standards from fiber and absorption of analytes onto fiber for these two compounds was confirmed. The future application of this method could assist in real- time, nonlethal monitoring of key sensory qualities and drug/ pesticide or other contaminants residues of fish and other food products prior to harvesting. To facilitate the on-site analysis, a portable GC or other instrumentation could be utilized. ■ AUTHOR INFORMATION Corresponding Author *Phone: +1-519-888-4641. Fax: +1-519-746-0435. E-mail: janusz@uwaterloo.ca. Notes The authors declare no competing financial interest. ■ ACKNOWLEDGMENTS The authors thank the Natural Sciences and Engineering Research Council (NSERC) of Canada for financial support. The authors acknowledge Alma Research Station of University of Guelph for their support in providing the in vivo sampling equipment. ■ REFERENCES (1) Rosenthal, H.; Castell, J. D.; Chiba, K.; Forster, J. R. M.; Hilge, V.; Hogendoorn, H.; Mayo, R. D.; Muir, J. F.; Murray, K. R.; Petit, J.; Wedemeyer, G. A.; Wheaton, F.; Wickins, J. EIFAC 1986, 100. (2) Verdegem, M. C. J.; Bosma, R. H.; Verreth, J. A. J. Int. J. Water Resour. Dev. 2006, 22, 101−113. (3) Piedrahita, R. H. Aquaculture 2003, 226, 35−44. (4) Summerfelt, S. T.; Sharrer, M. J.; Tsukuda, S. M.; Gearheart, M. Aquaculture 2009, 40, 17−27. Figure 3. Determination the Rs of 2-MIB and geosmin in homogenized fish tissue. Table 2. Results Comparison between MD-SPME and in Vivo SPME 2- MIB (ng/ g) geosmin (ng/g) fish no. mass (g) sex fat content (%) PDSR MD- SPME (ng/g) OFS PDSR MD- SPME (ng/g) 1 1013.0 F 3.4 3.4 3.0 2.6 2.6 3.0 2 883.3 M 3.0 3.9 3.9 3.0 3.3 3.7 3 855.4 M 2.7 2.8 3.6 2.1 2.2 2.9 4 1003.2 M 3.7 2.6 4.4 2.0 1.6 3.0 5 894.1 M 1.6 3.3 3.3 3.4 5.0 4.6 6 985.6 M 2.1 3.4 4.6 2.2 2.6 3.7 7 772.6 M 2.9 4.9 3.7 6.1 5.9 5.9 8 958.3 M 2.7 3.8 5.4 3.0 3.9 5.1 9 896.0 M 3.7 4.5 4.4 5.2 5.2 5.0 Analytical Chemistry Article dx.doi.org/10.1021/ac3033245 | Anal. Chem. 2013, 85, 2328−23322331
  • 5. (5) Zohar, Y.; Tal, Y.; Schreier, H. J.; Steven, C.; Stubblefield, J.; Place, A. Urban Aquacult. 2005, 159−171. (6) Grimm, C. C.; Lloyd, S. W.; Batista, R.; Zimba, P. V. J. Chromatogr. Sci. 2000, 38, 289−296. (7) Gerbek, N. N. J. Antibiot. 1969, 22, 508−509. (8) Rosen, A. A.; Mashni, C. I.; Safferman, R. S. Water Treat. Exam. 1970, 19, 106−119. (9) Yurkowski, M.; Tabachek, J. L. J. Fish. Res. Board Can. 1976, 33, 25−35. (10) Arthur, C. L.; Pawliszyn, J. Anal. Chem. 1990, 62, 2145−2148. (11) Zhou, S.; Zhao, W.; Pawliszyn, J. Anal. Chem. 2008, 80, 481− 490. (12) Togunde, O. P.; Oakes, K.; Servos, M.; Pawliszyn, J. Anal. Chim. Acta 2012, 742, 2−9. (13) Zhang, X.; Oakes, K. D.; Hoque, M. E.; Luong, D.; Metcalfe, C. D.; Pawliszyn, J.; Servos, M. R. Anal. Chem. 2011, 83, 3365−3370. (14) Zhou, S.; Zhang, X.; Ouyang, G.; Es-haghi, A.; Pawliszyn, J. Anal. Chem. 2007, 79, 1221−1230. (15) Zhou, S.; Oakes, K. D.; Servos, M. R.; Pawliszyn, J. Environ. Sci. Technol. 2008, 42, 6073−6079. (16) Chen, Y.; Pawliszyn, J. Anal. Chem. 2004, 76, 5807−5815. (17) Ouyang, G.; Vuckovic, D.; Pawliszyn, J. Chem. Rev. 2011, 111, 2784−2814. (18) Ouyang, G.; Oakes, K. D.; Bragg, L.; Wang, S.; Cui, S.; Servos, M. R.; Dixon, D. G.; Pawliszyn, J. Environ. Sci. Technol. 2010, 45, 7792−7798. (19) Lloyd, S. W.; Lea, J. M.; Zimba, P. V.; Grimm, C. C. Water Res. 1998, 32, 2140−2146. (20) Robertsona, R. F.; Jaunceyb, K.; Beveridgec, M. C. M.; Lawton, L. A. Aquaculture 2005, 245, 89−99. (21) Lloyd, S.W.; Grimm, C. C. J. Agric. Food Chem. 1999, 47, 164− 169. (22) Robertson, R. F.; Jauncey, K.; Beveridge, M. C. M.; Lawton, L. A. Aquaculture 2005, 245, 89−99. (23) Pawliszyn, J. Anal. Chem. 2003, 75, 2543−2558. (24) Pawliszyn, J. Handbook of Solid Phase Microextraction; Chemical Industry Press: Beijing, China, 2009. (25) Zhang, X.; Oakes, K. D.; Cui, S.; Bragg, L.; Servos, M. R.; Pawliszyn, J. Environ. Sci. Technol. 2010, 44, 3417−3422. Analytical Chemistry Article dx.doi.org/10.1021/ac3033245 | Anal. Chem. 2013, 85, 2328−23322332