Download as PDF, PPTX
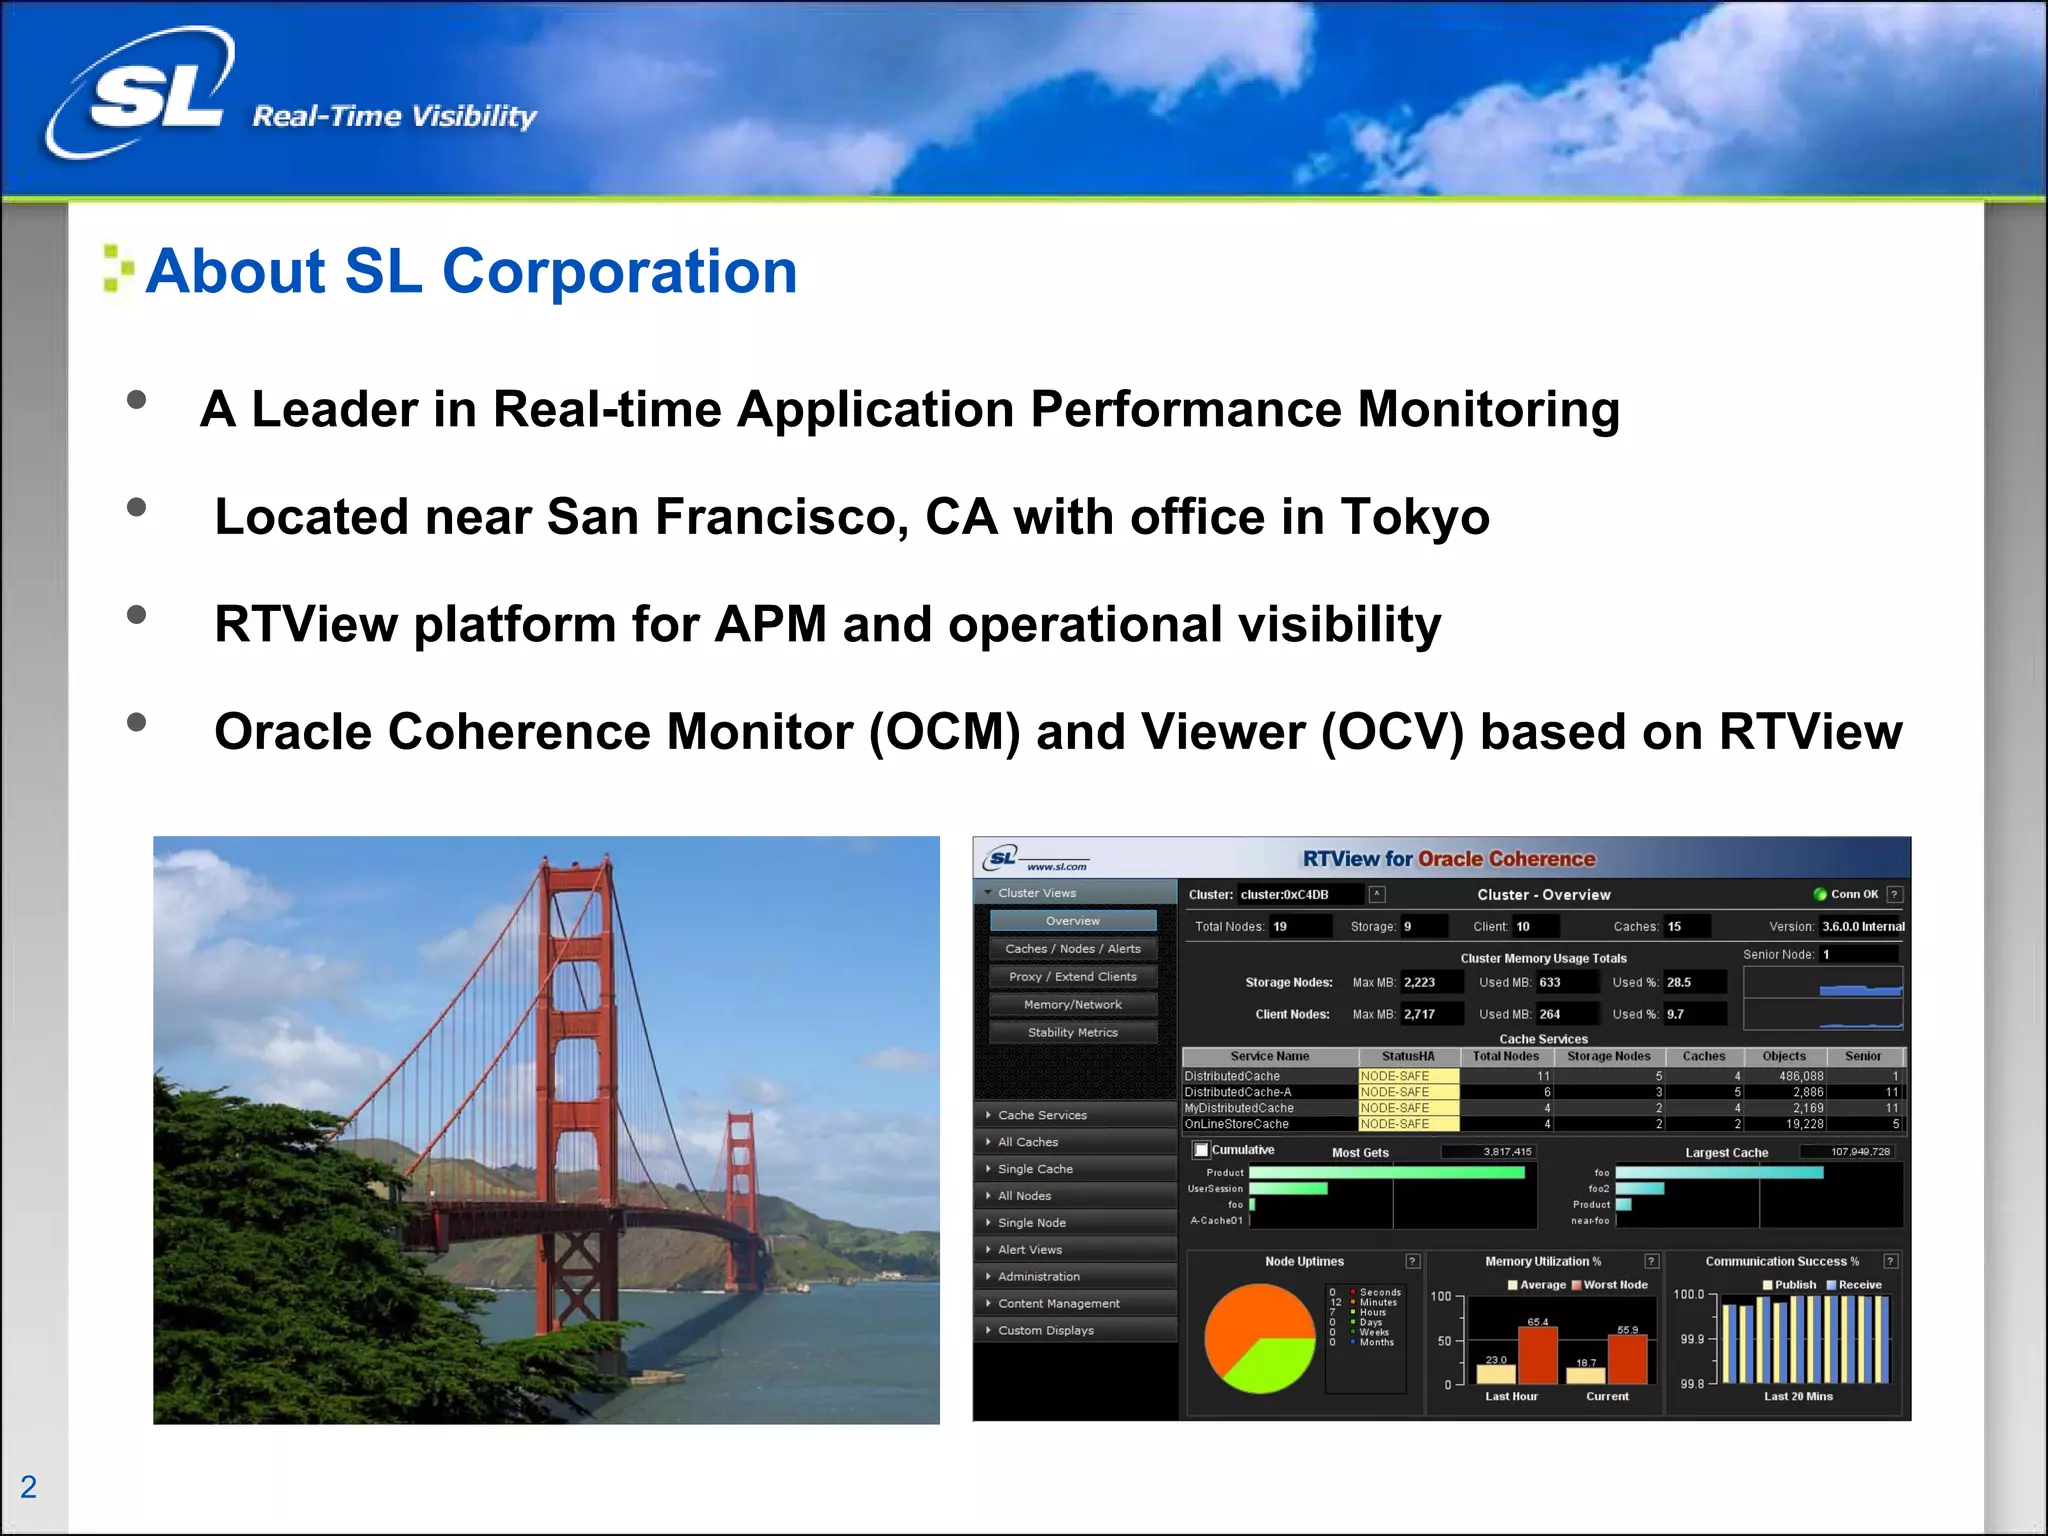
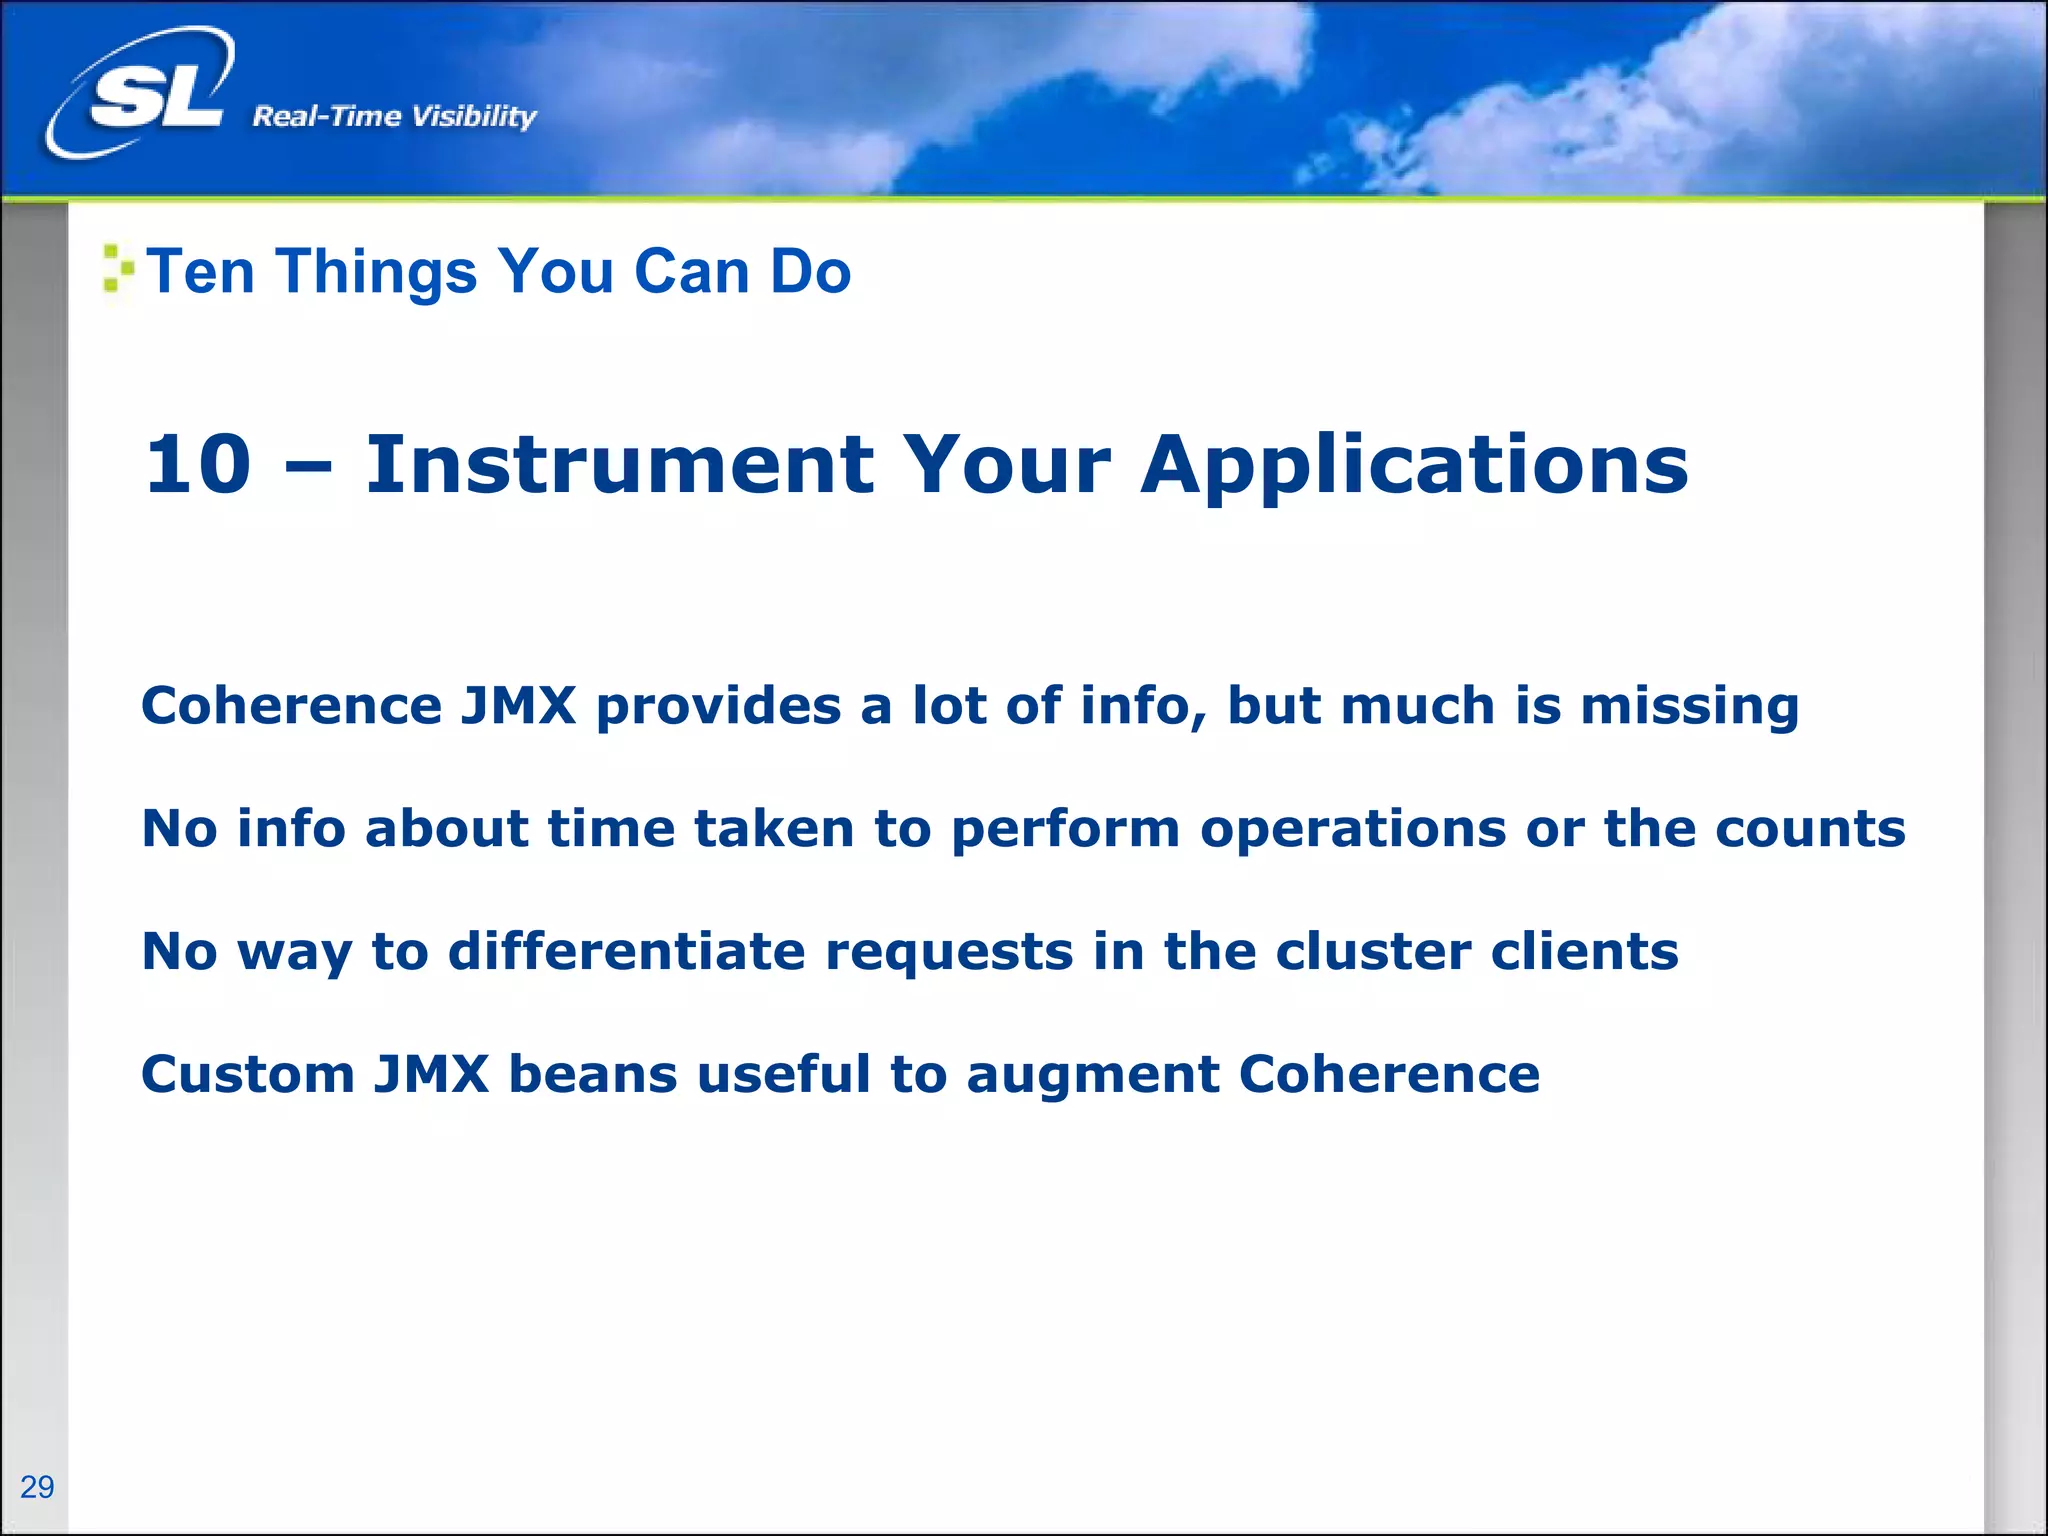
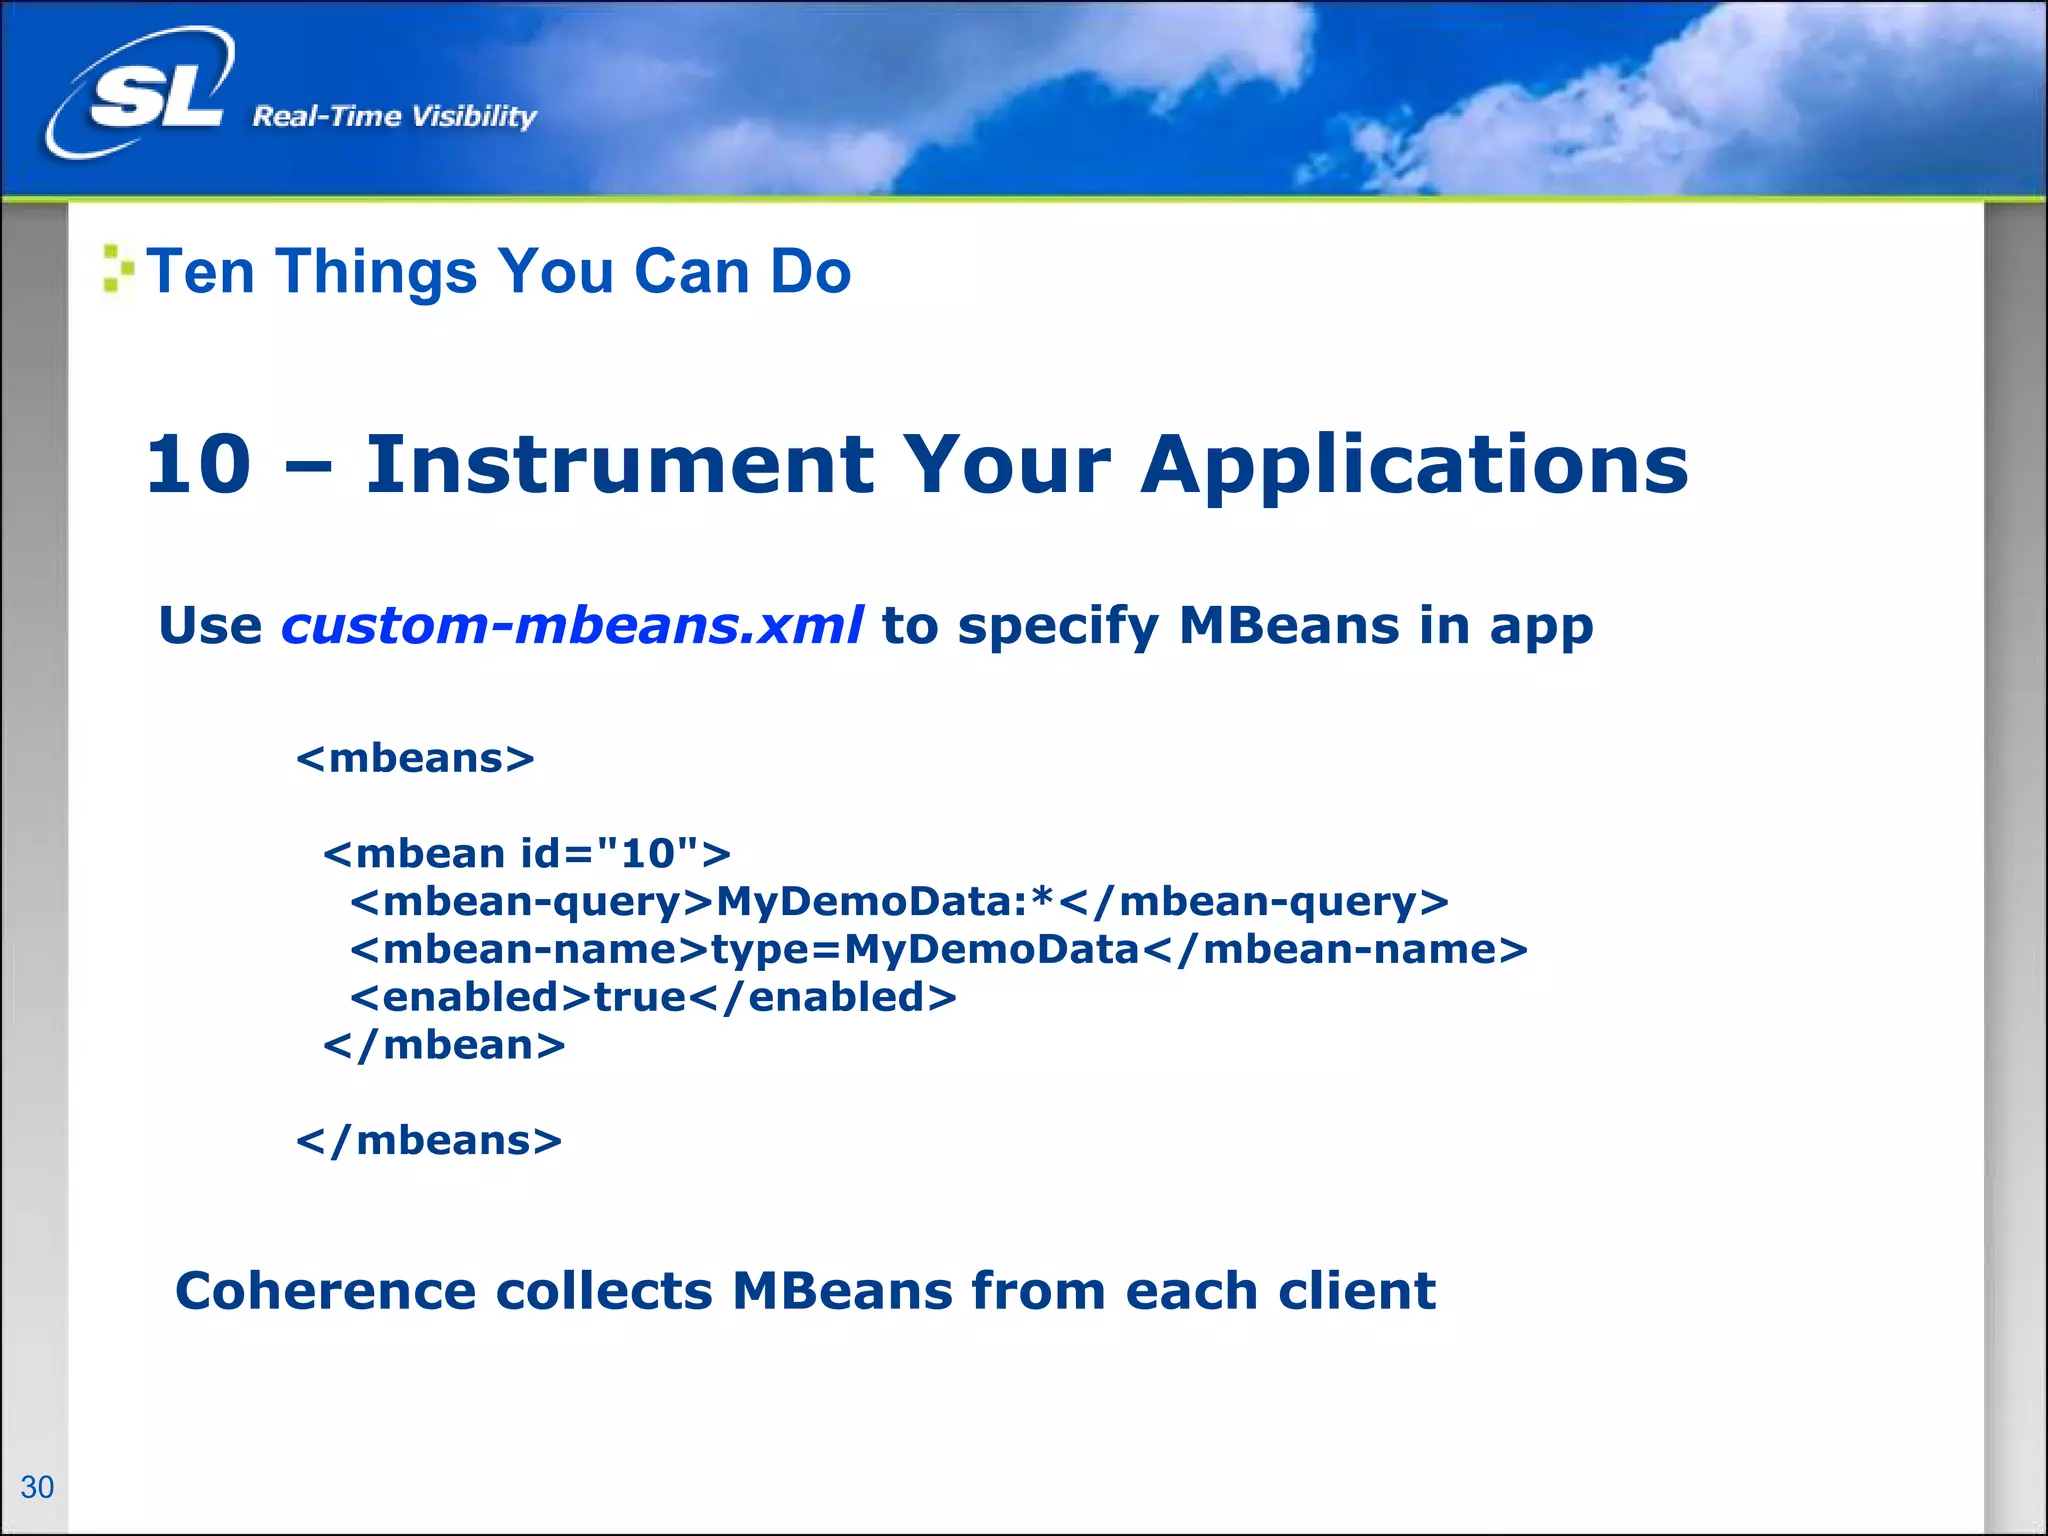

Tom Lubinski is the founder and CTO of SL Corporation, located near San Francisco. SL Corporation produces the RTView platform for application performance monitoring and operational visibility, including the Oracle Coherence Monitor (OCM) and Viewer (OCV). The document discusses why monitoring Coherence clusters is important, what typically happens with Coherence projects, and provides 10 things that can be done to better monitor and manage Coherence clusters, such as understanding network metrics, configuring services for monitoring, and instrumenting applications.


![Coded Agents – with UiPath SDK + LangGraph [Virtual Hands-on Workshop]](https://cdn.slidesharecdn.com/ss_thumbnails/codedagentsdeck-251215155422-5497c599-thumbnail.jpg?width=640&height=640&fit=bounds)
![Vibe Coding vs. Spec-Driven Development [Free Meetup]](https://cdn.slidesharecdn.com/ss_thumbnails/vibecodingvsspecdrivendevelopment-251209105622-43f455e7-thumbnail.jpg?width=640&height=640&fit=bounds)


