The document provides an overview of a conjoint analysis study conducted to understand home insurance online purchasing behavior. The study aimed to answer questions about the optimal price differential, product cover combination, and presentation format for a premium home insurance product.
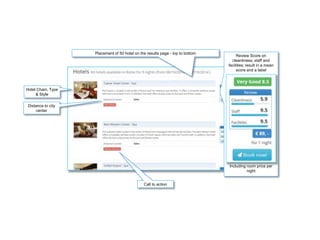
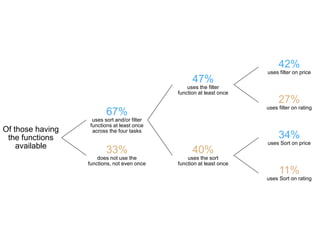
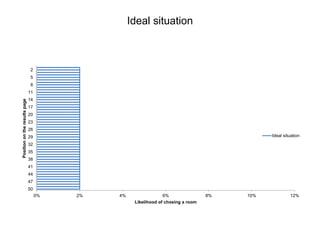
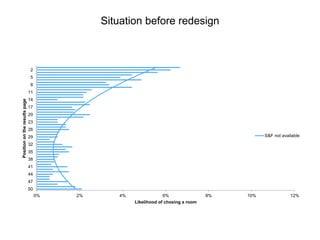
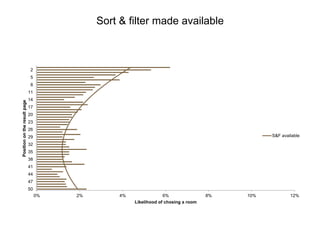
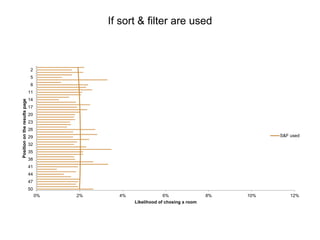
The conjoint analysis involved 12 choice tasks with 2-3 randomly generated insurance product profiles described by 7 cover features. Modeling of responses indicated influences on choice. While the model predicted a 56% choice share for the premium product, actual stated preference was only 25%, indicating limitations of modeling complex real-world decisions. Pragmatic conclusions for the client included reducing premium product covers to lower price rather than raising basic prices.