Downloaded 15 times


![‹#›
© 2015 Lieberman Research Worldwide.
All rights reserved. CONFIDENTIAL.
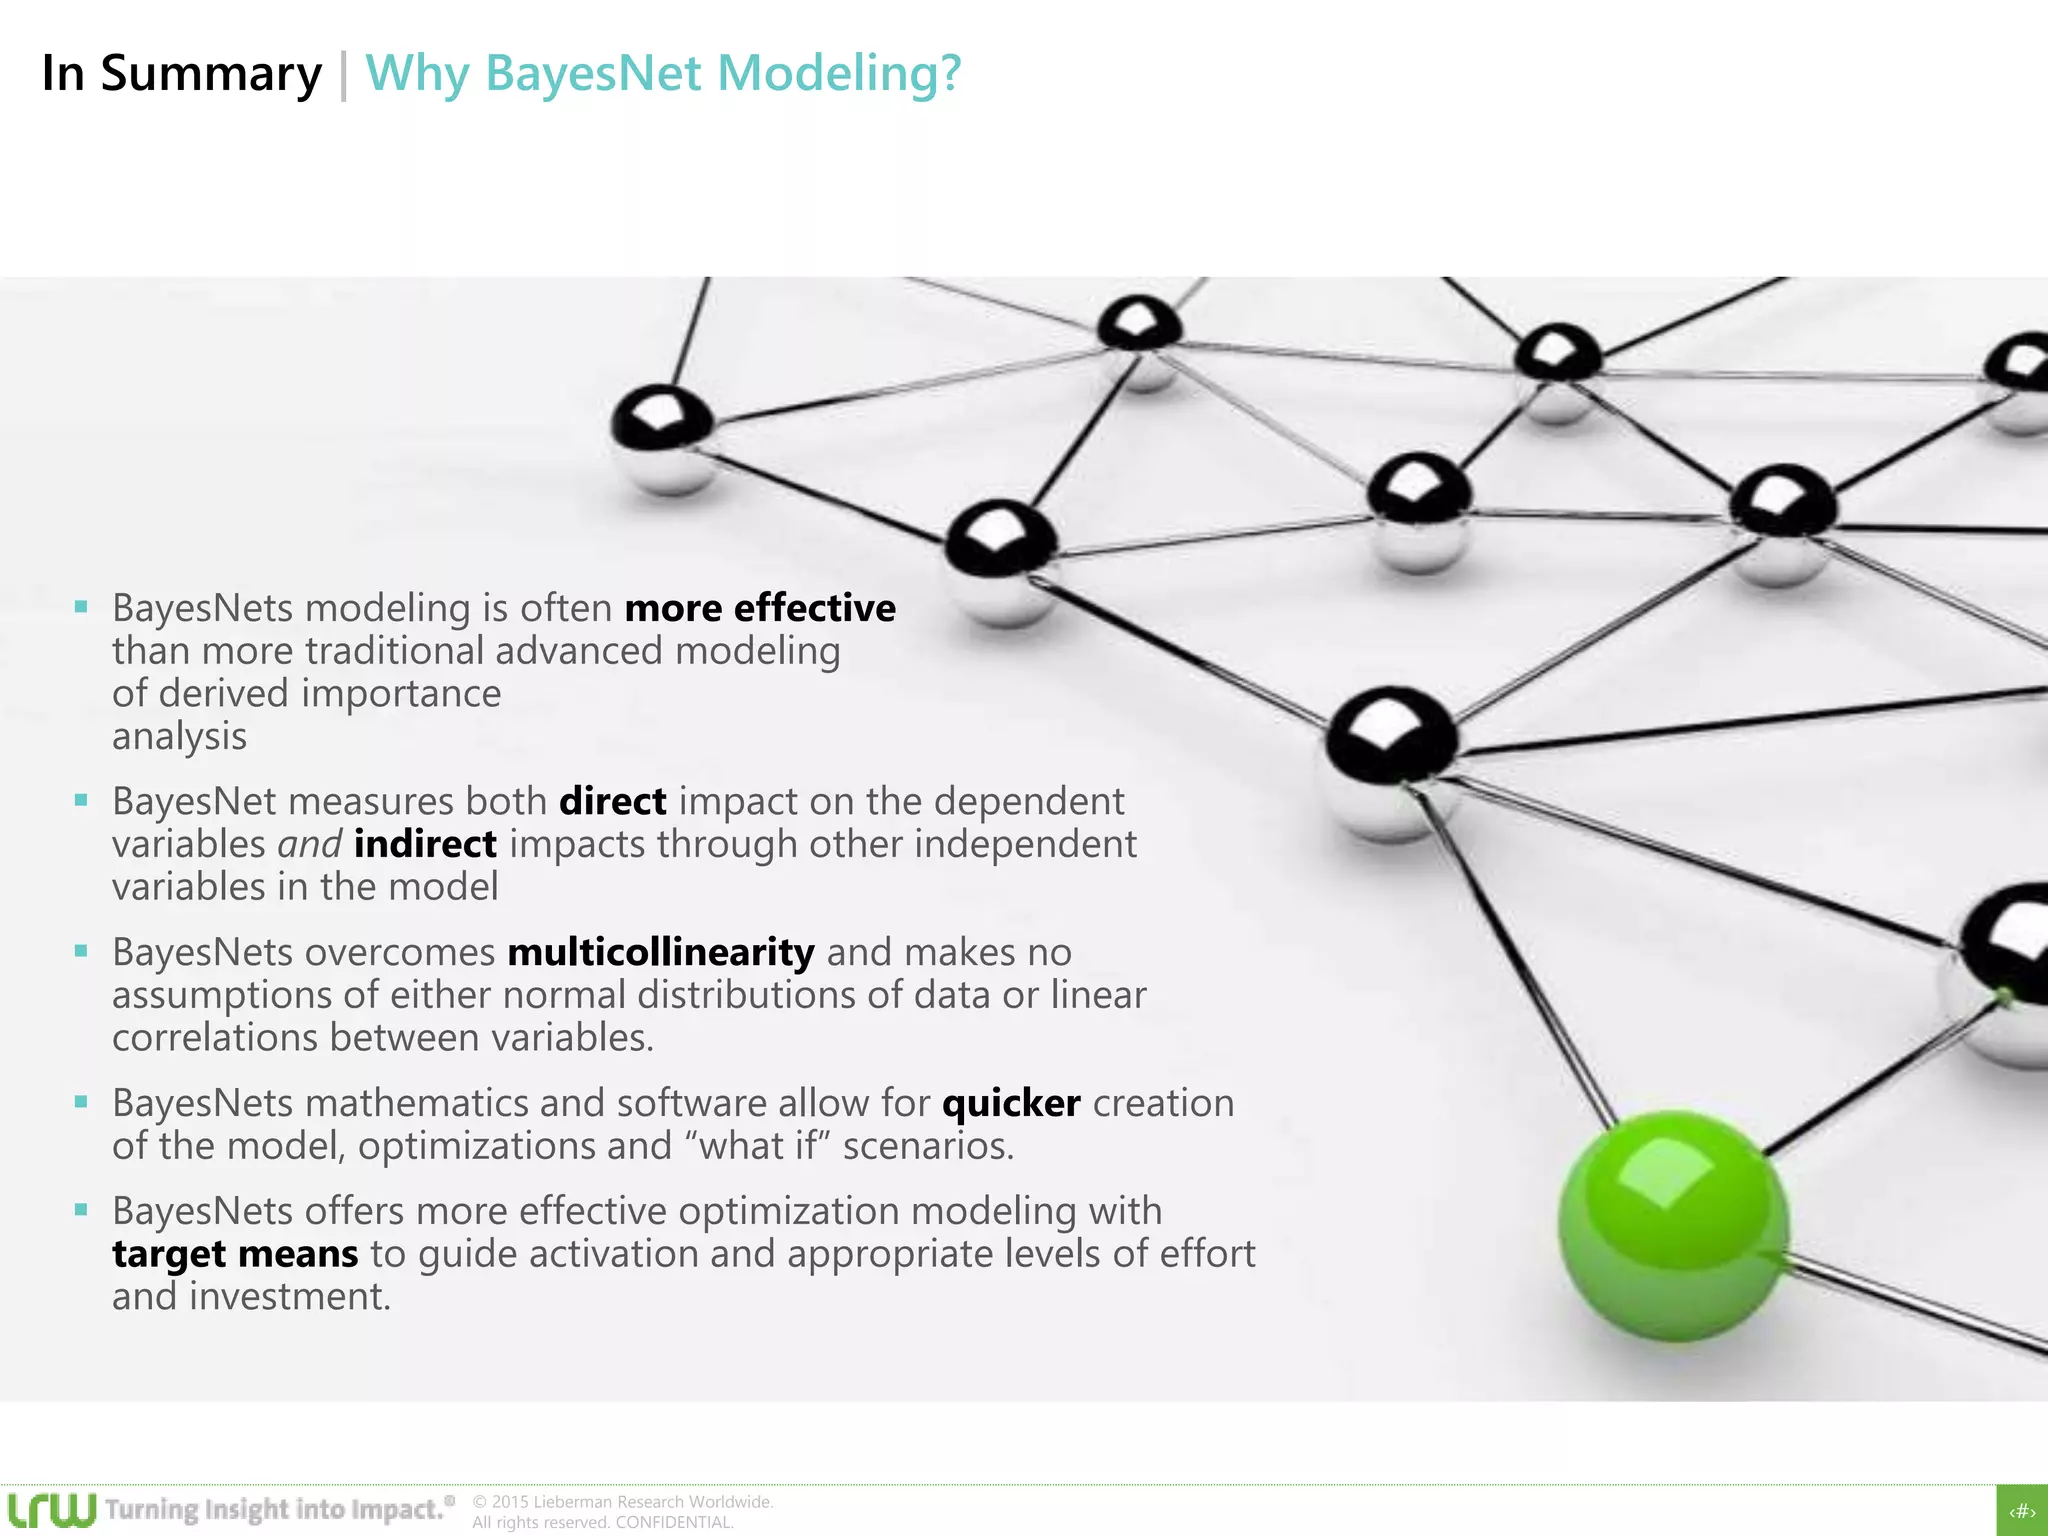
Why Should Our Industry Care About BayesNets?
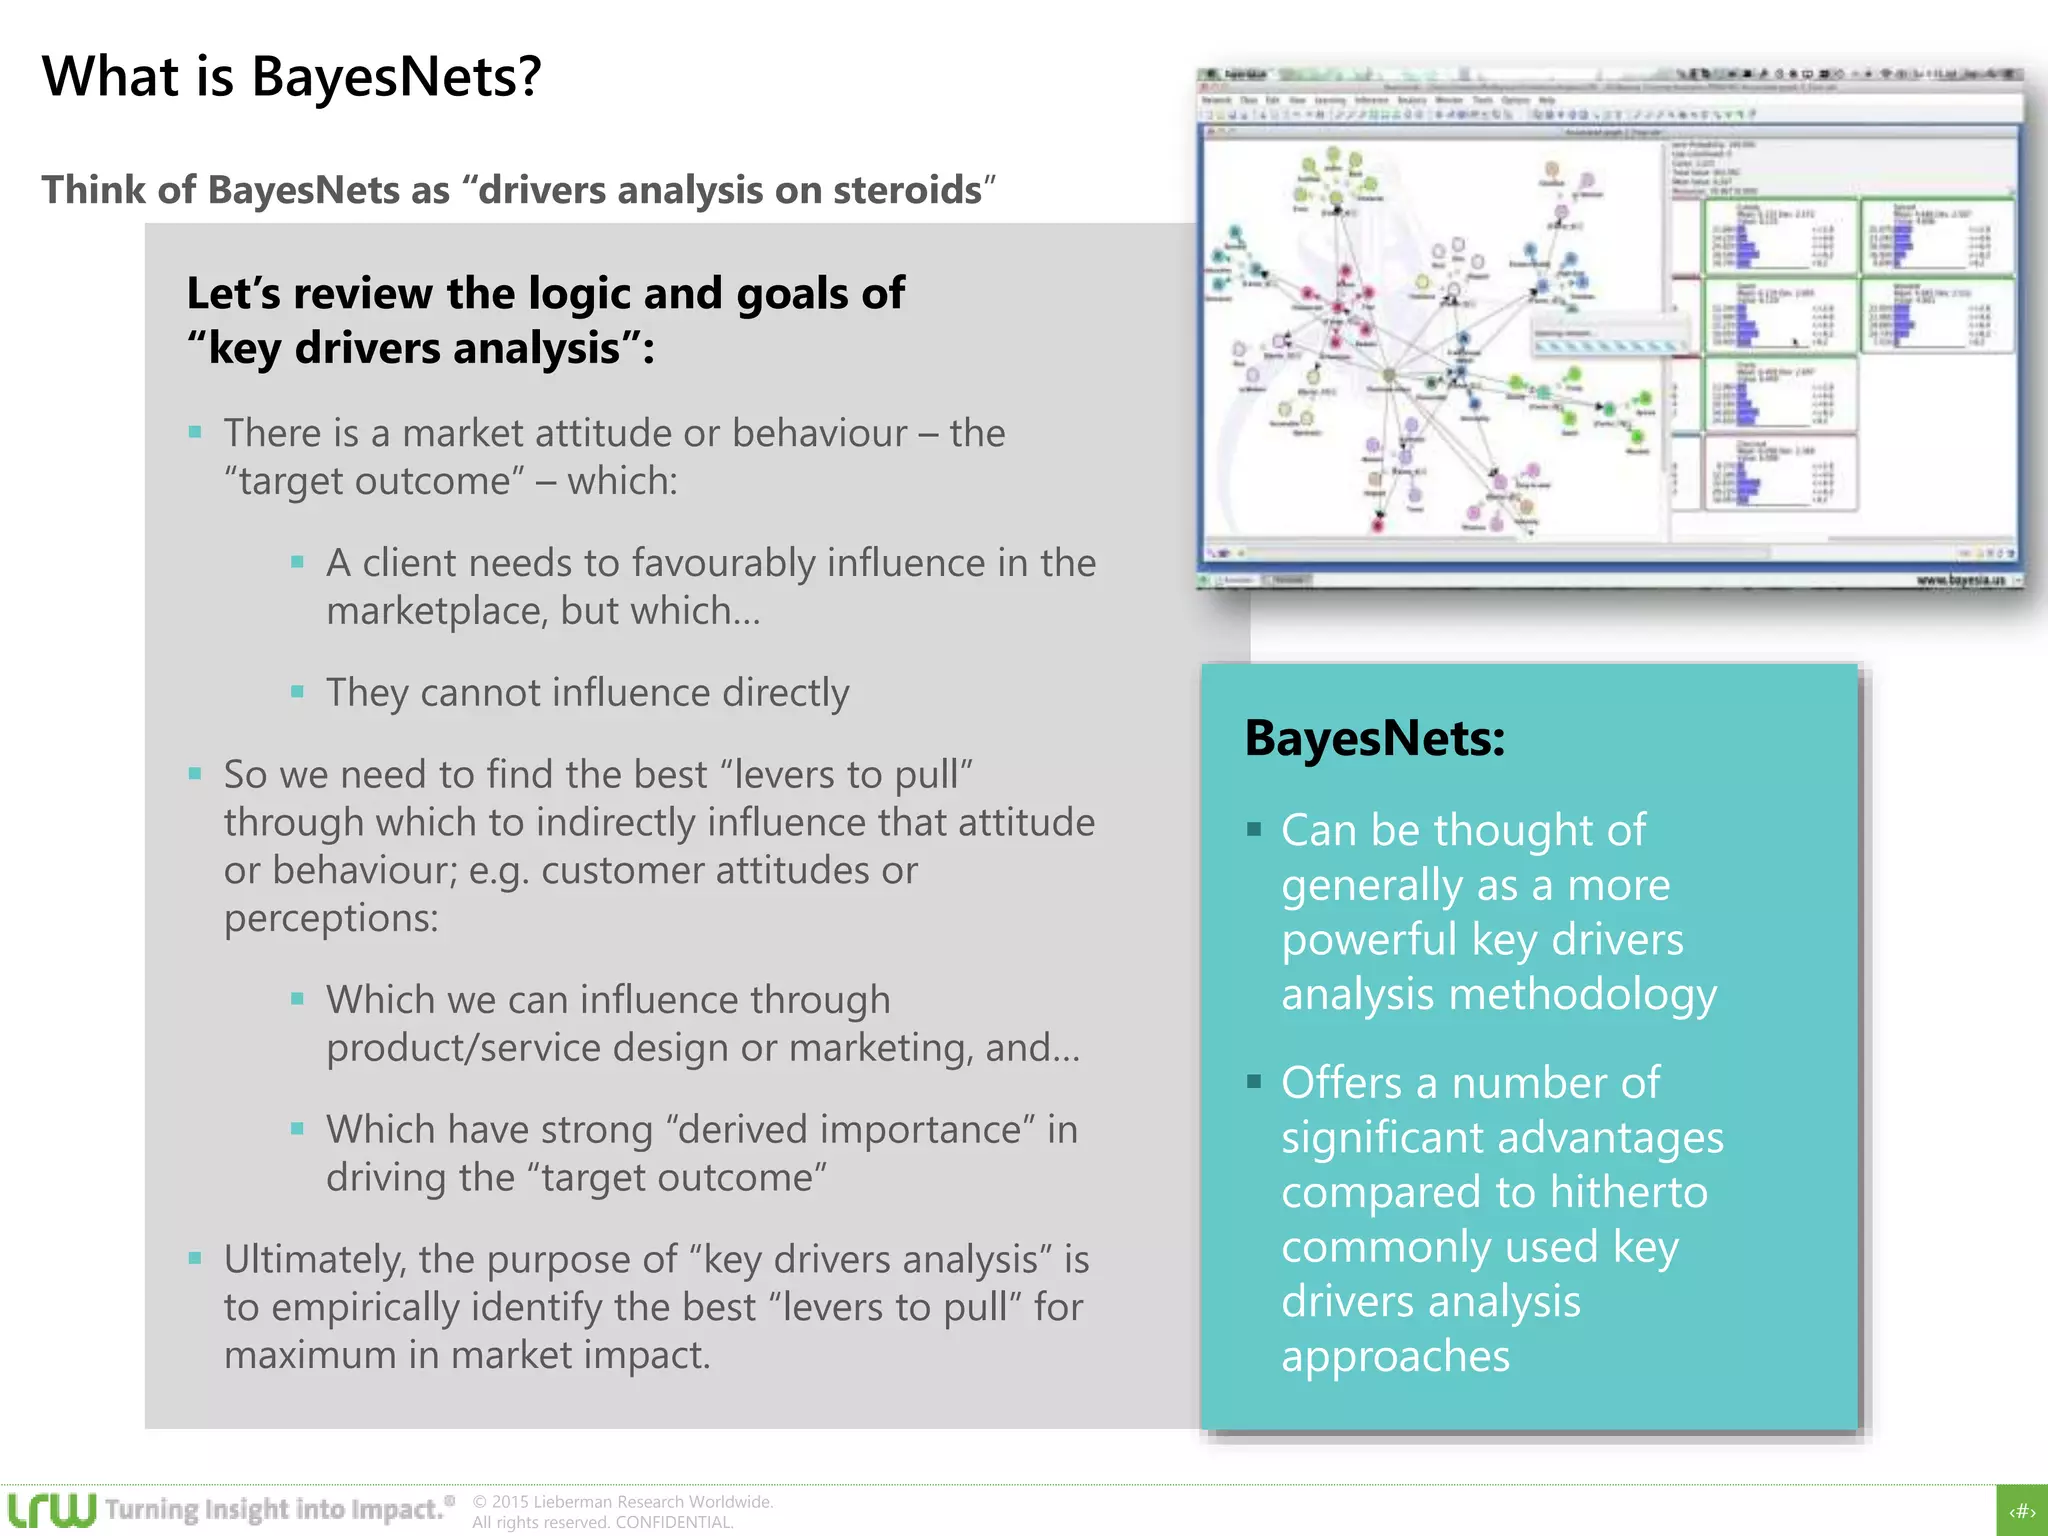
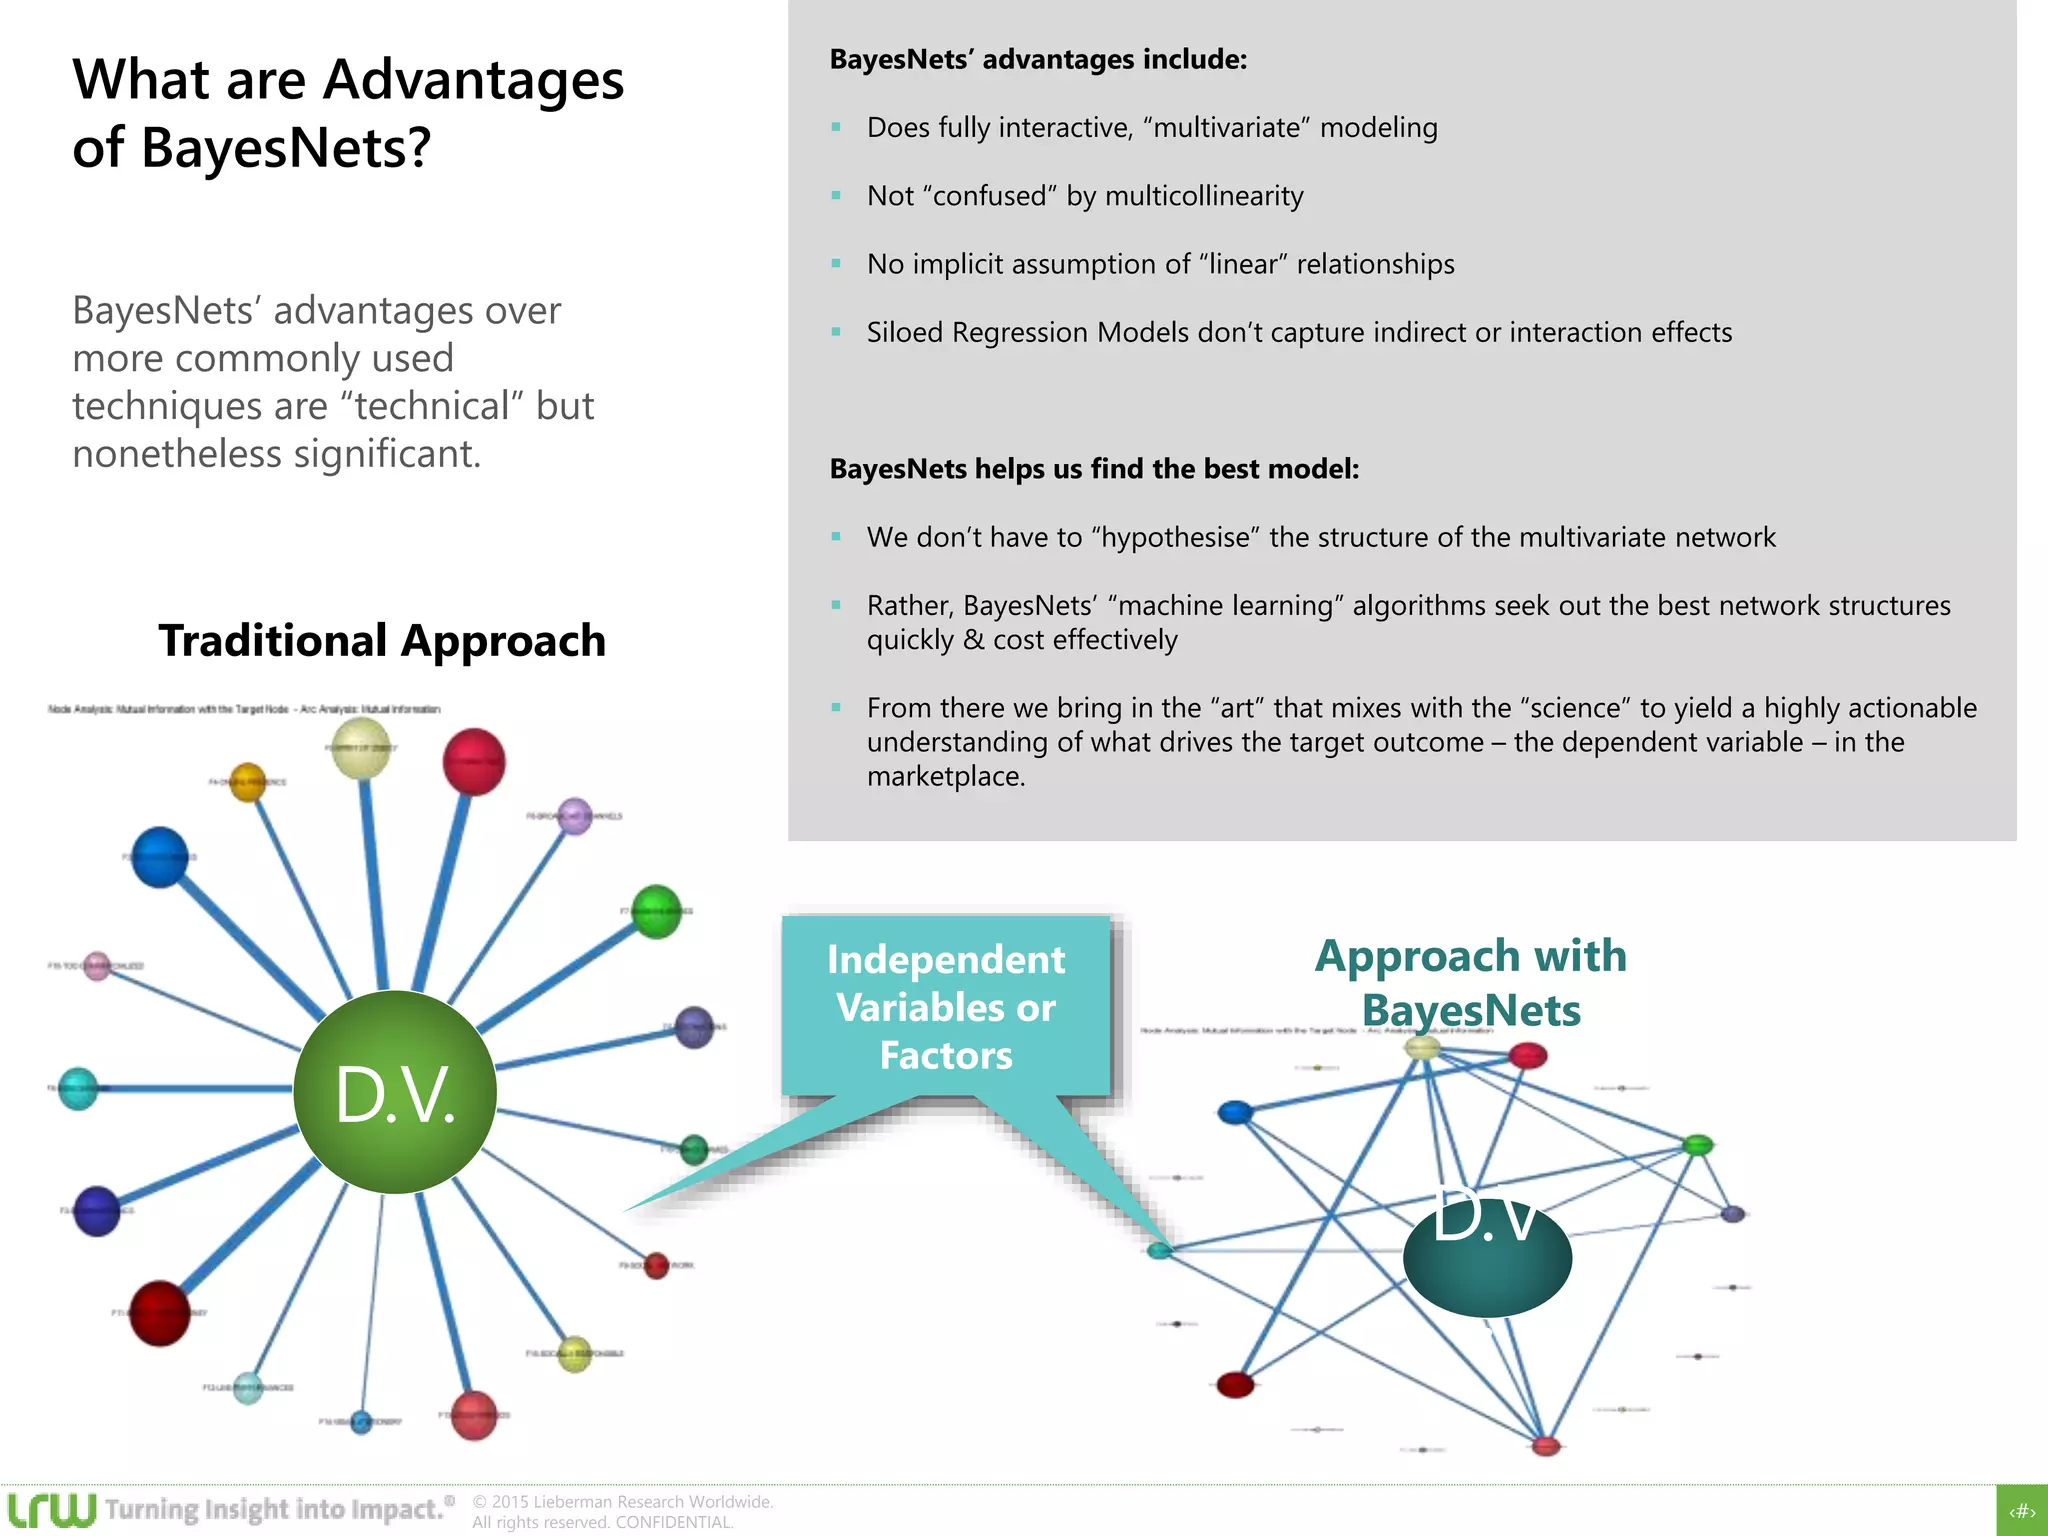
BayesNets is a unique and more comprehensive driver analysis to
assist Marketers
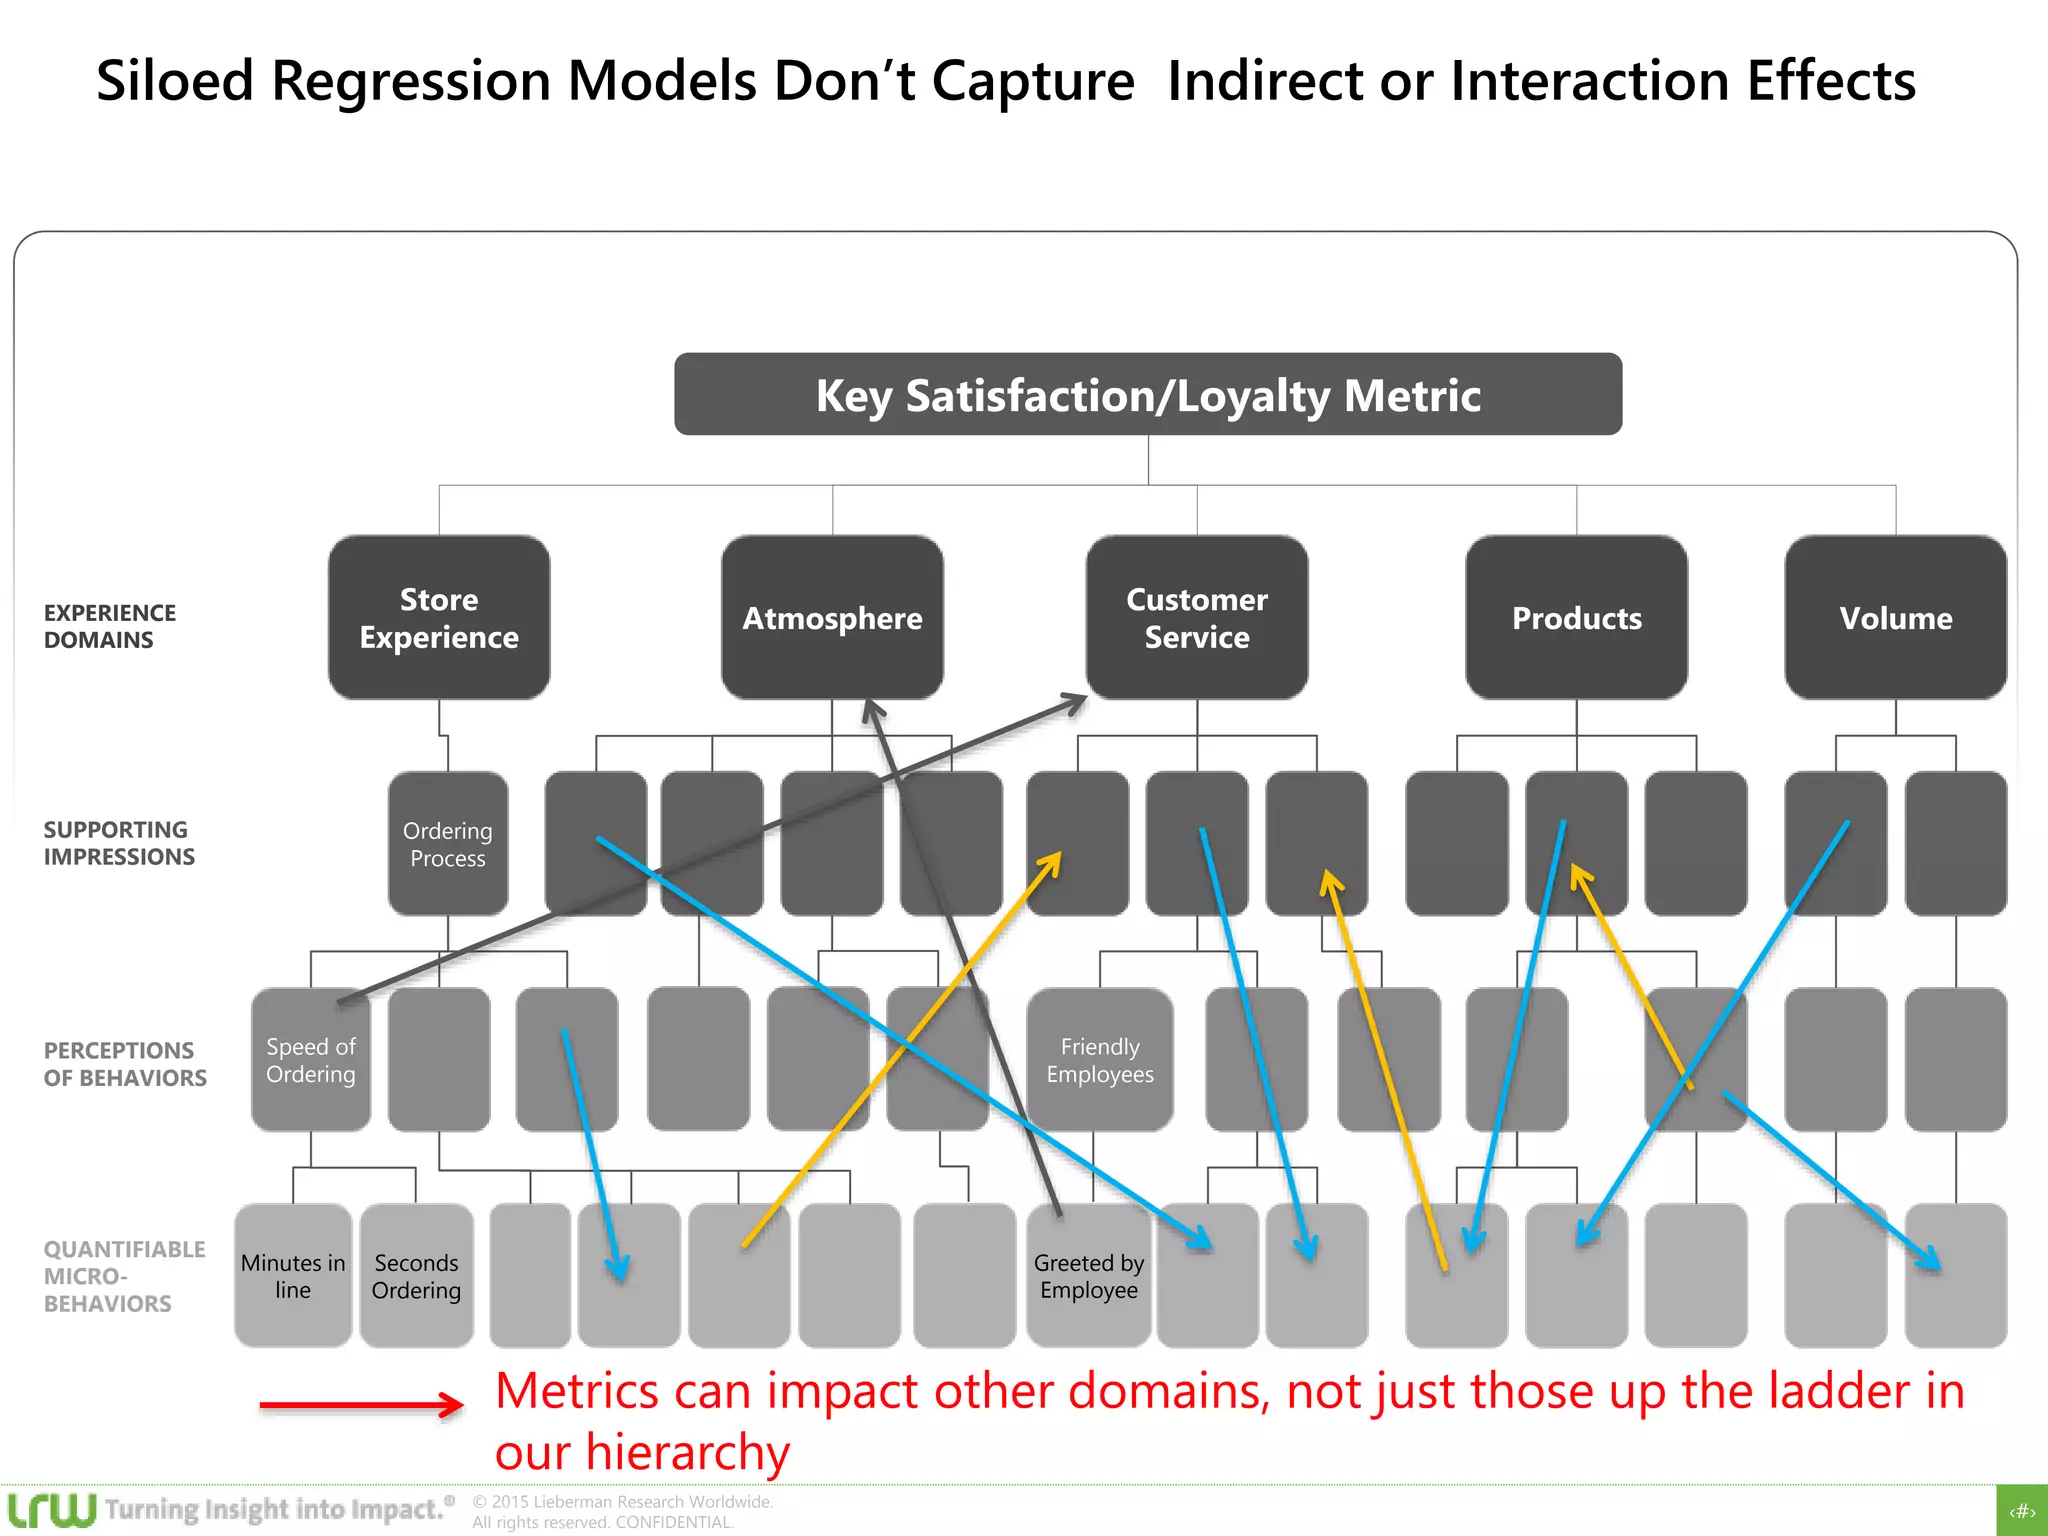
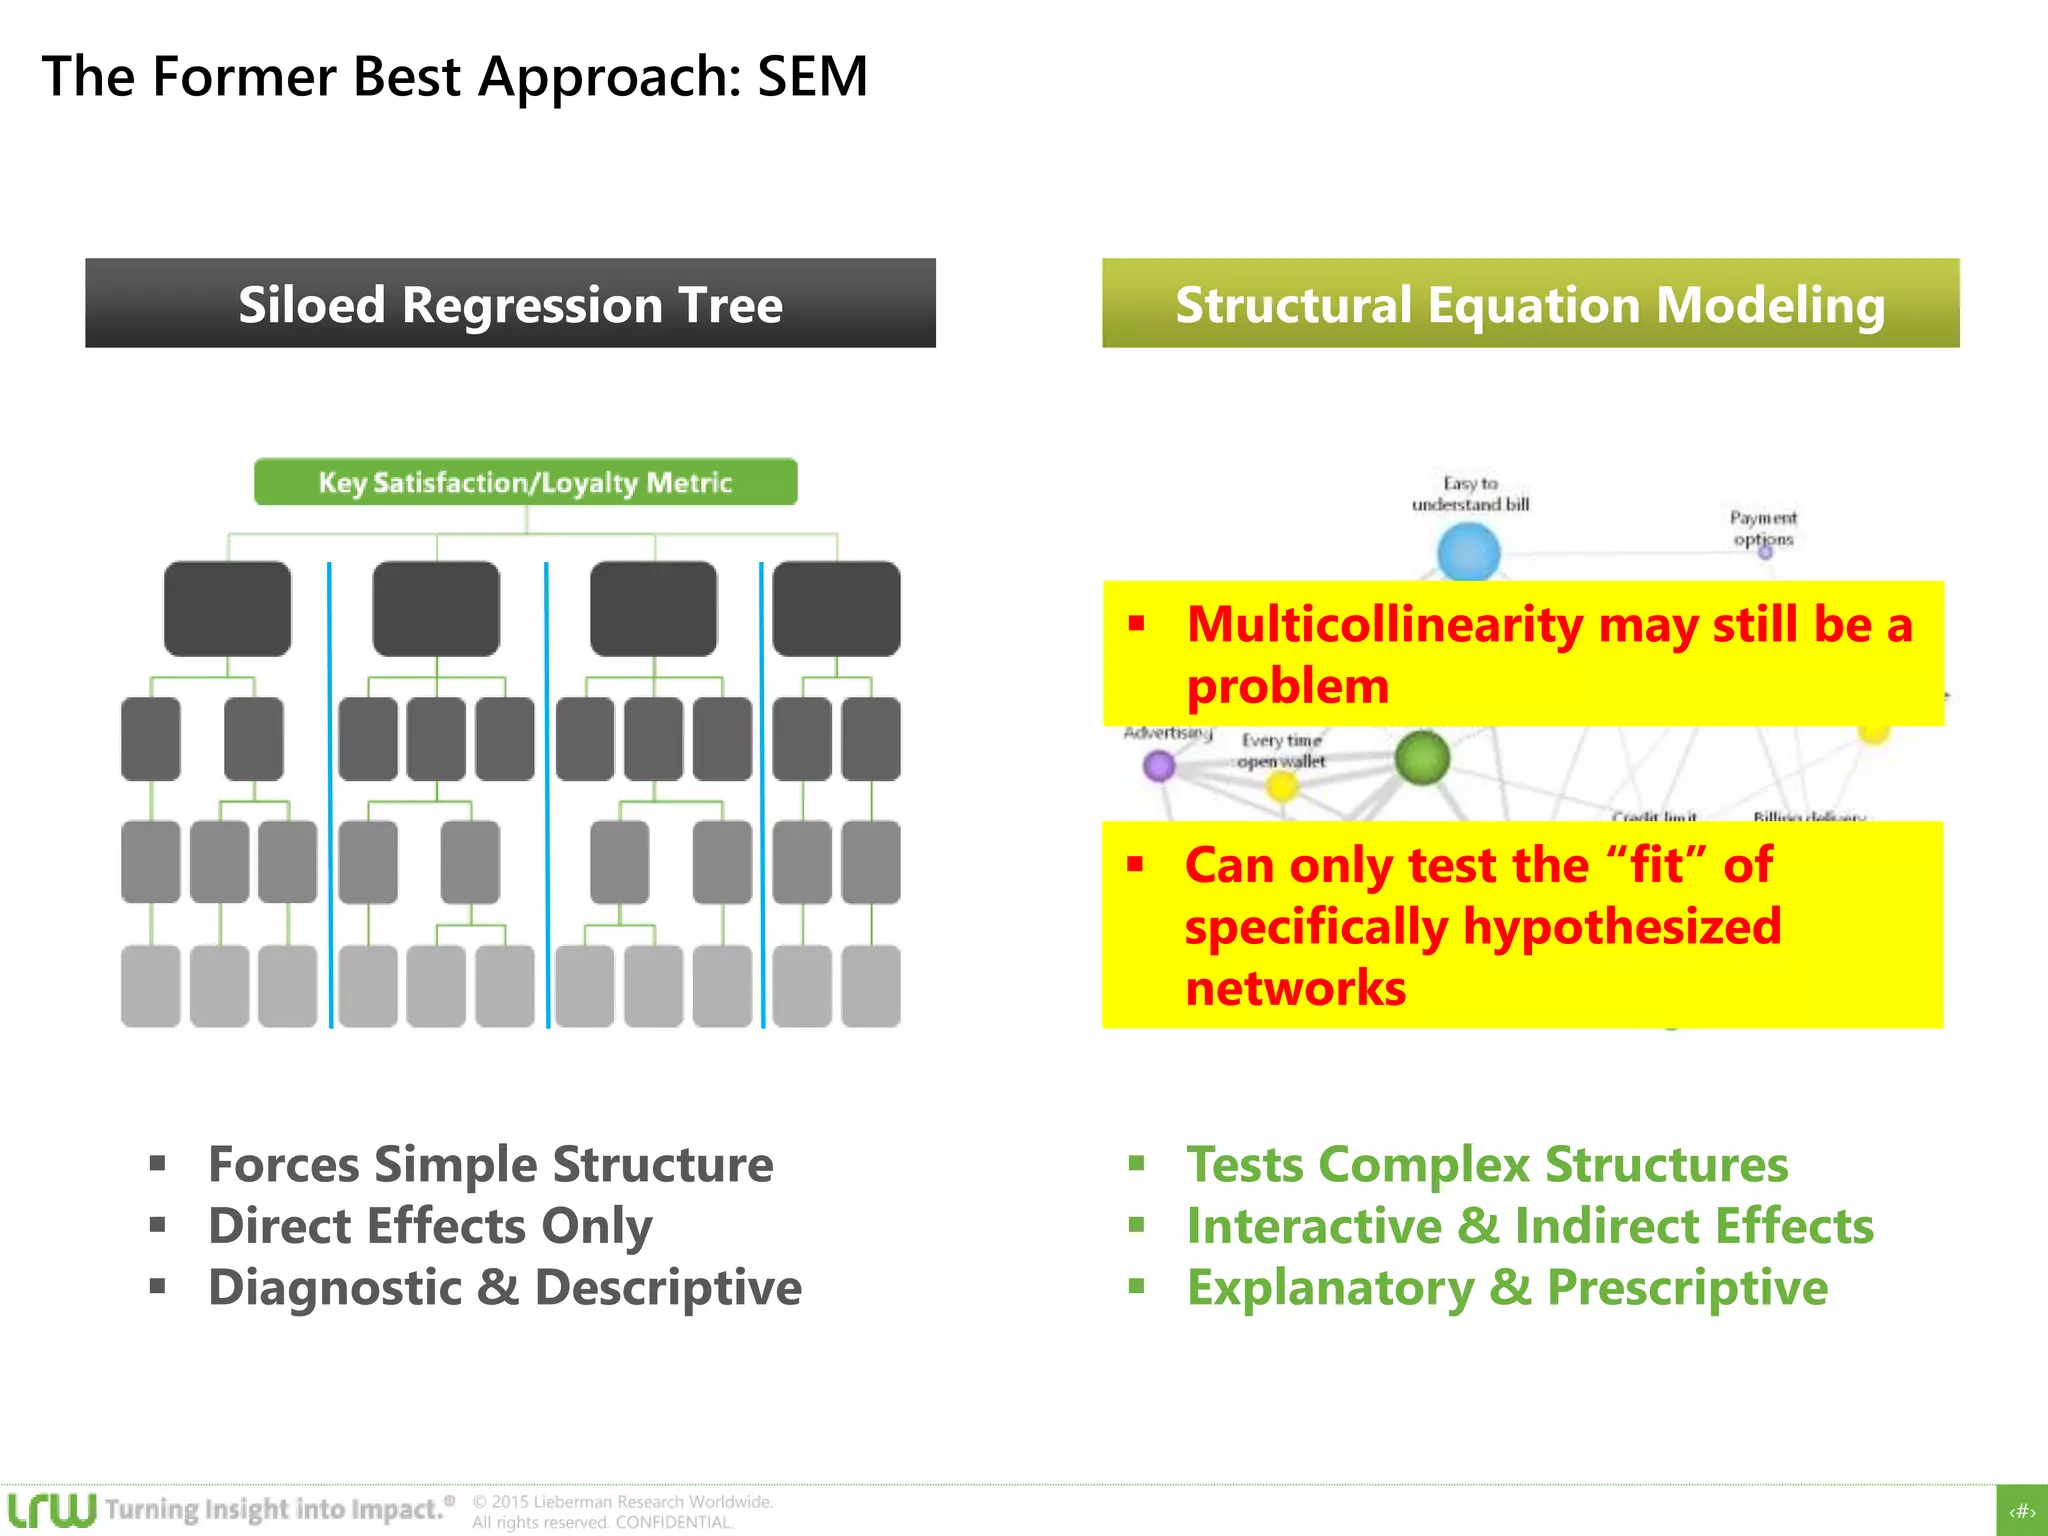
Overcomes the shortcomings of traditional [drivers analysis] methods
Allows the integration of profiling, behavioural and other metrics with
attitudinal/preference ratings to create a more holistic view of what
drives the dependent variable
“Bayesnets has played a major role in several
recent wins. It’s especially helpful with brand
positioning research where the complex
relationships between brand attributes
demands a more nuanced and flexible
approach to analysis”. LRW Account Director](https://image.slidesharecdn.com/adanforweb-150518094107-lva1-app6892/75/MRS-Advanced-Analytics-Innovation-Symposium-Presentation-39-2048.jpg)


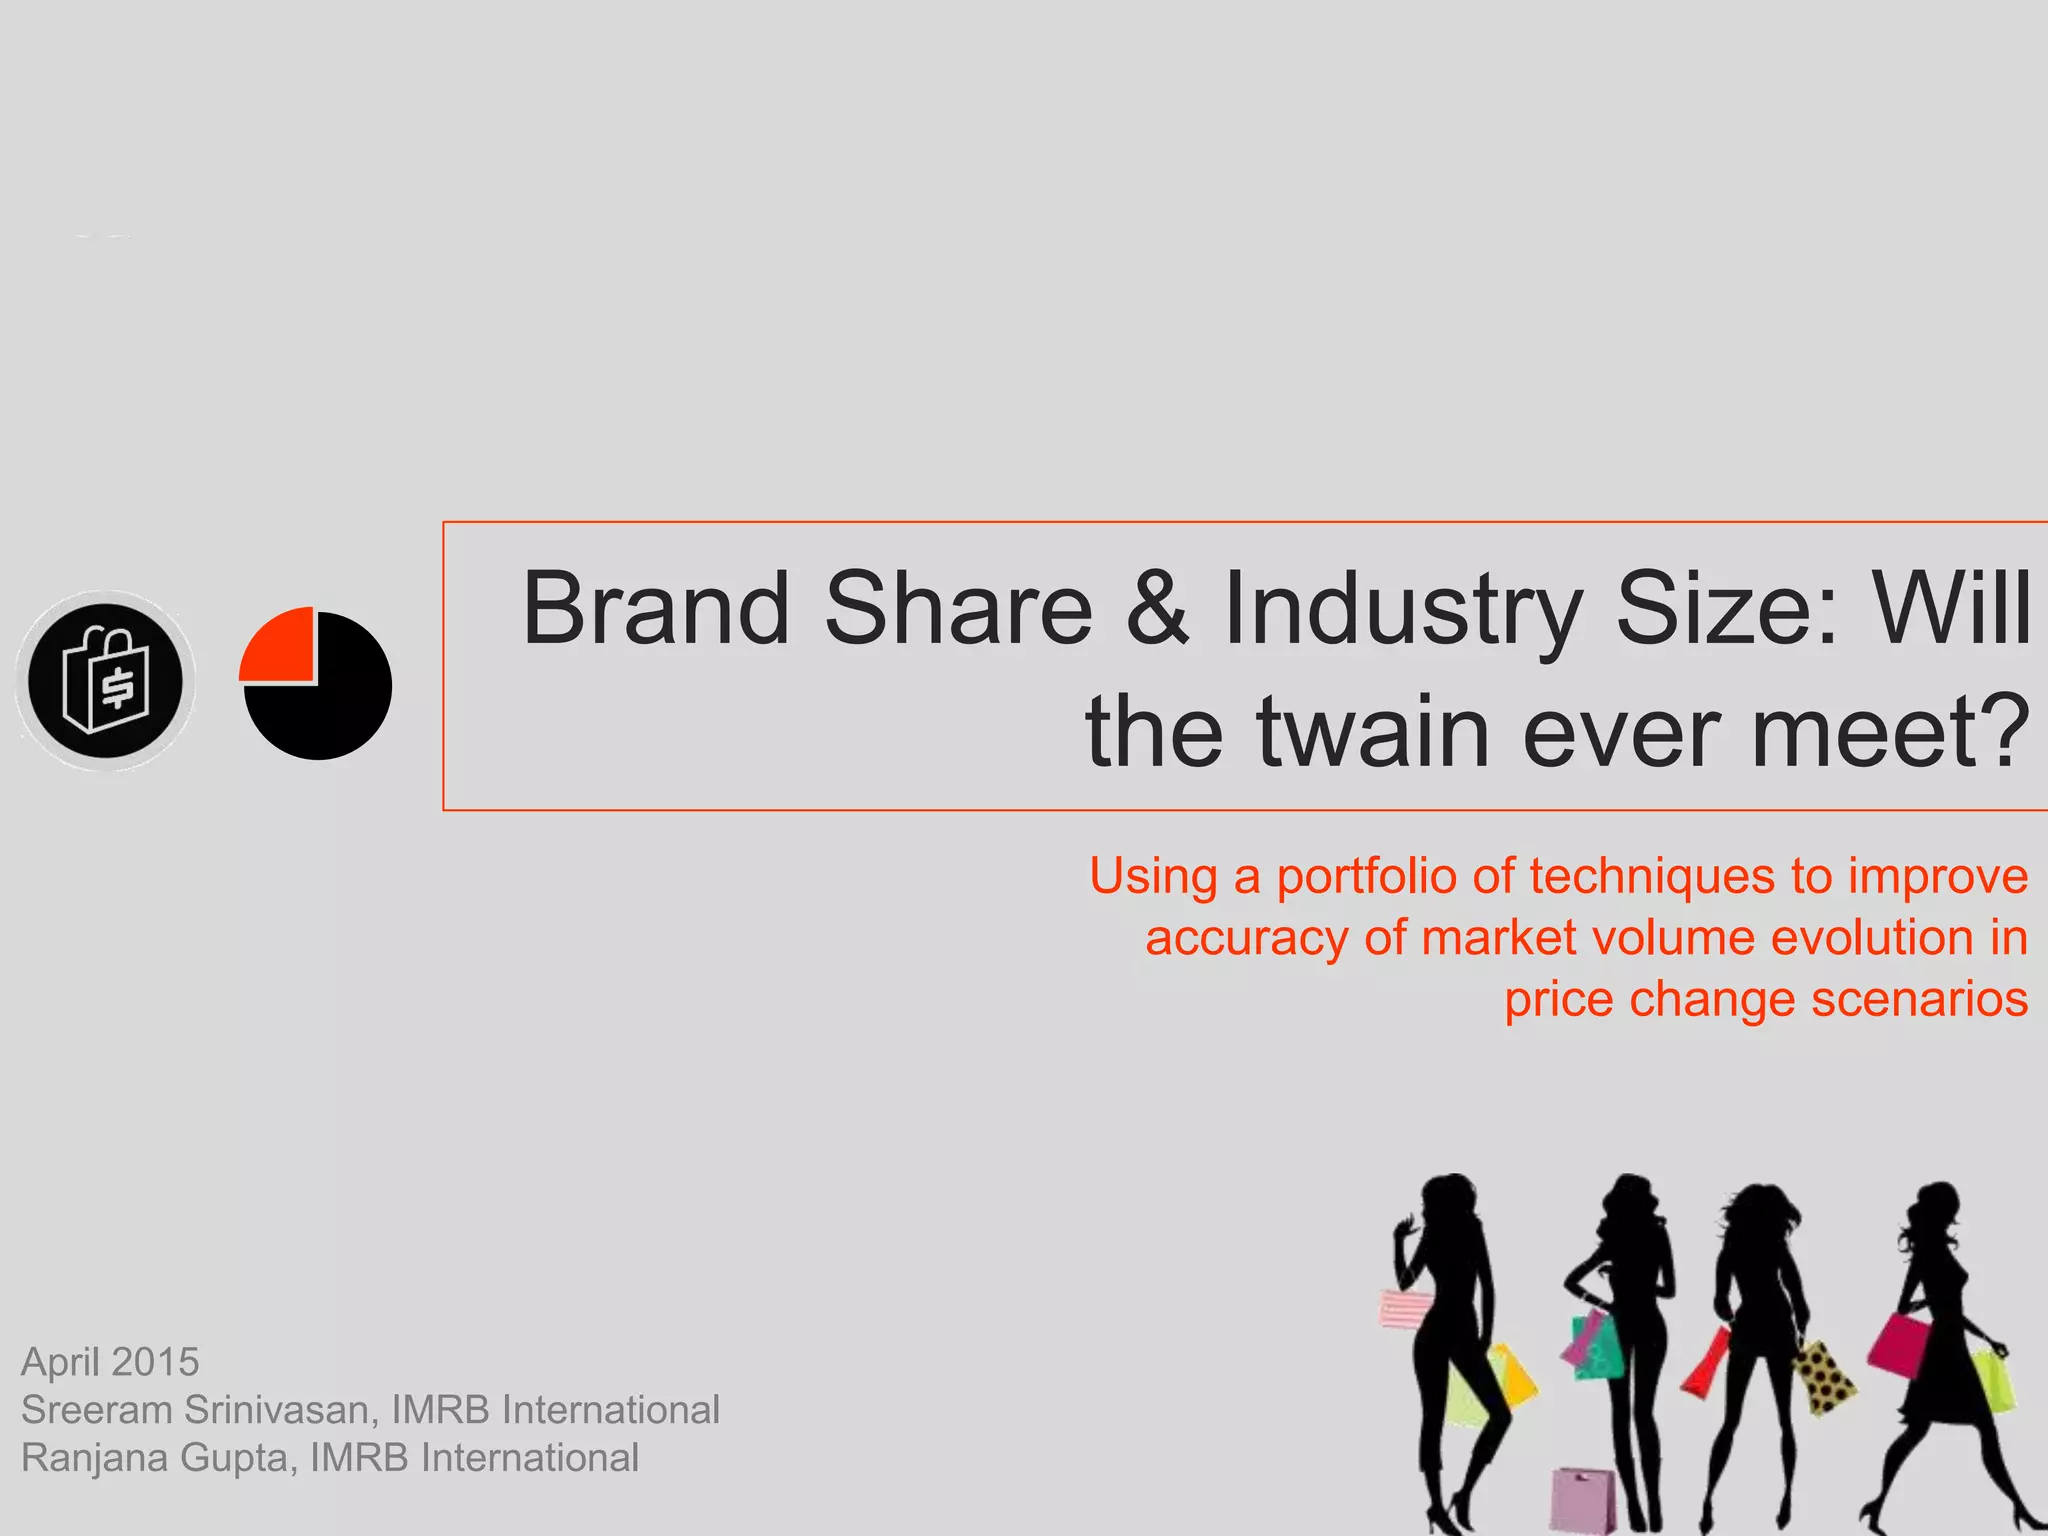
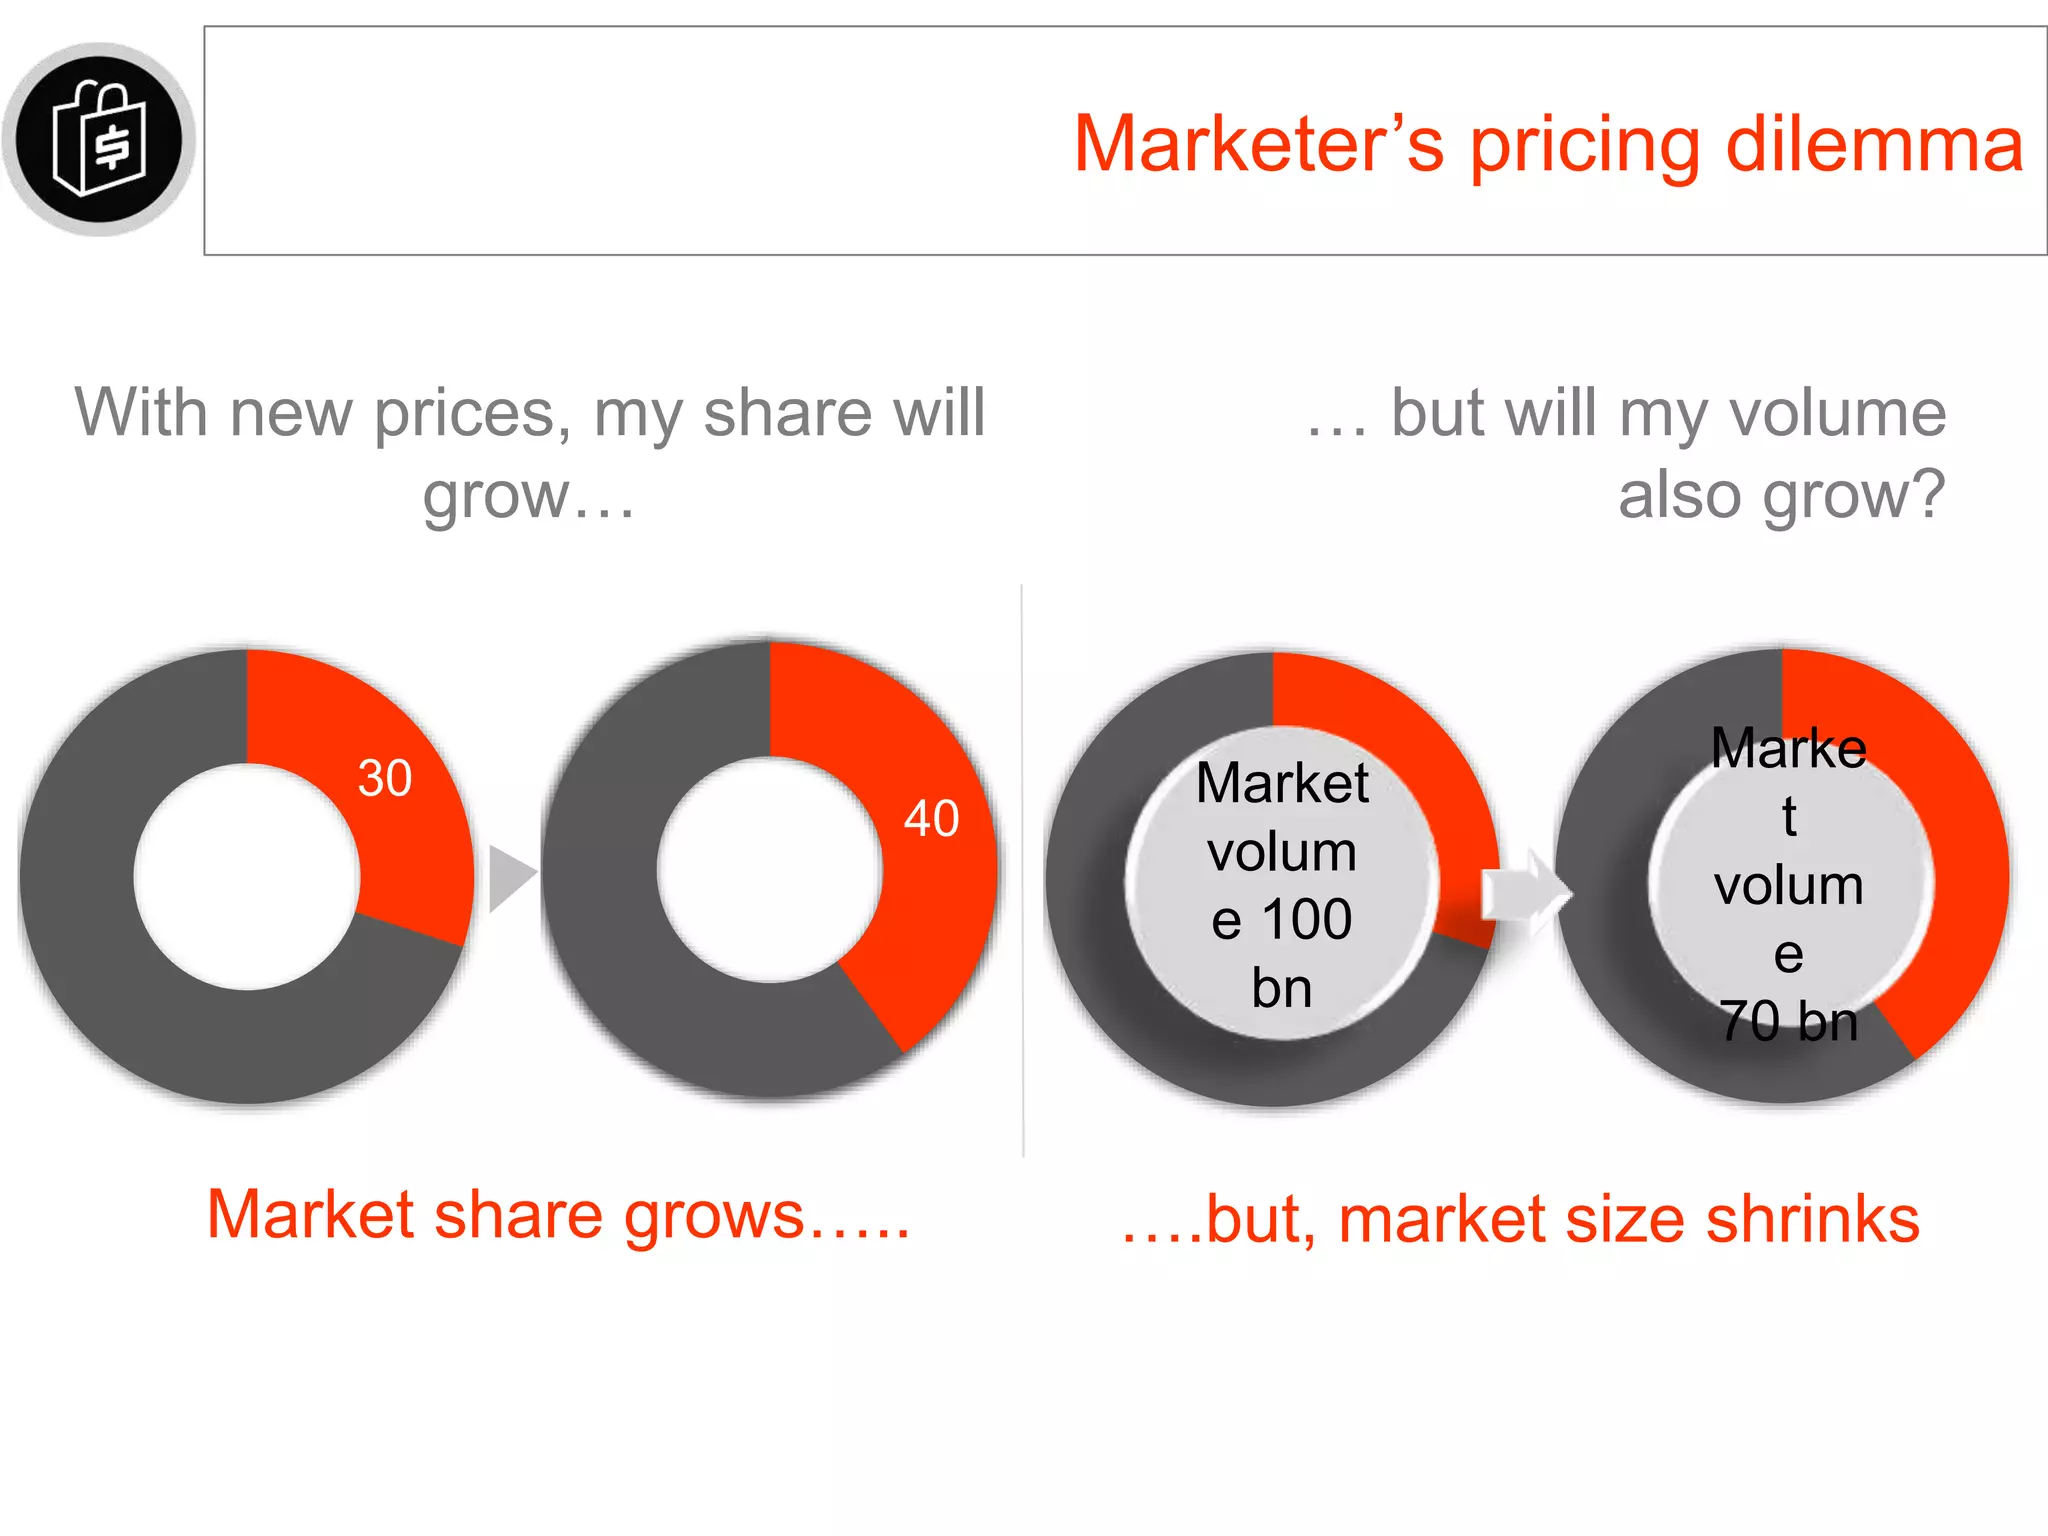
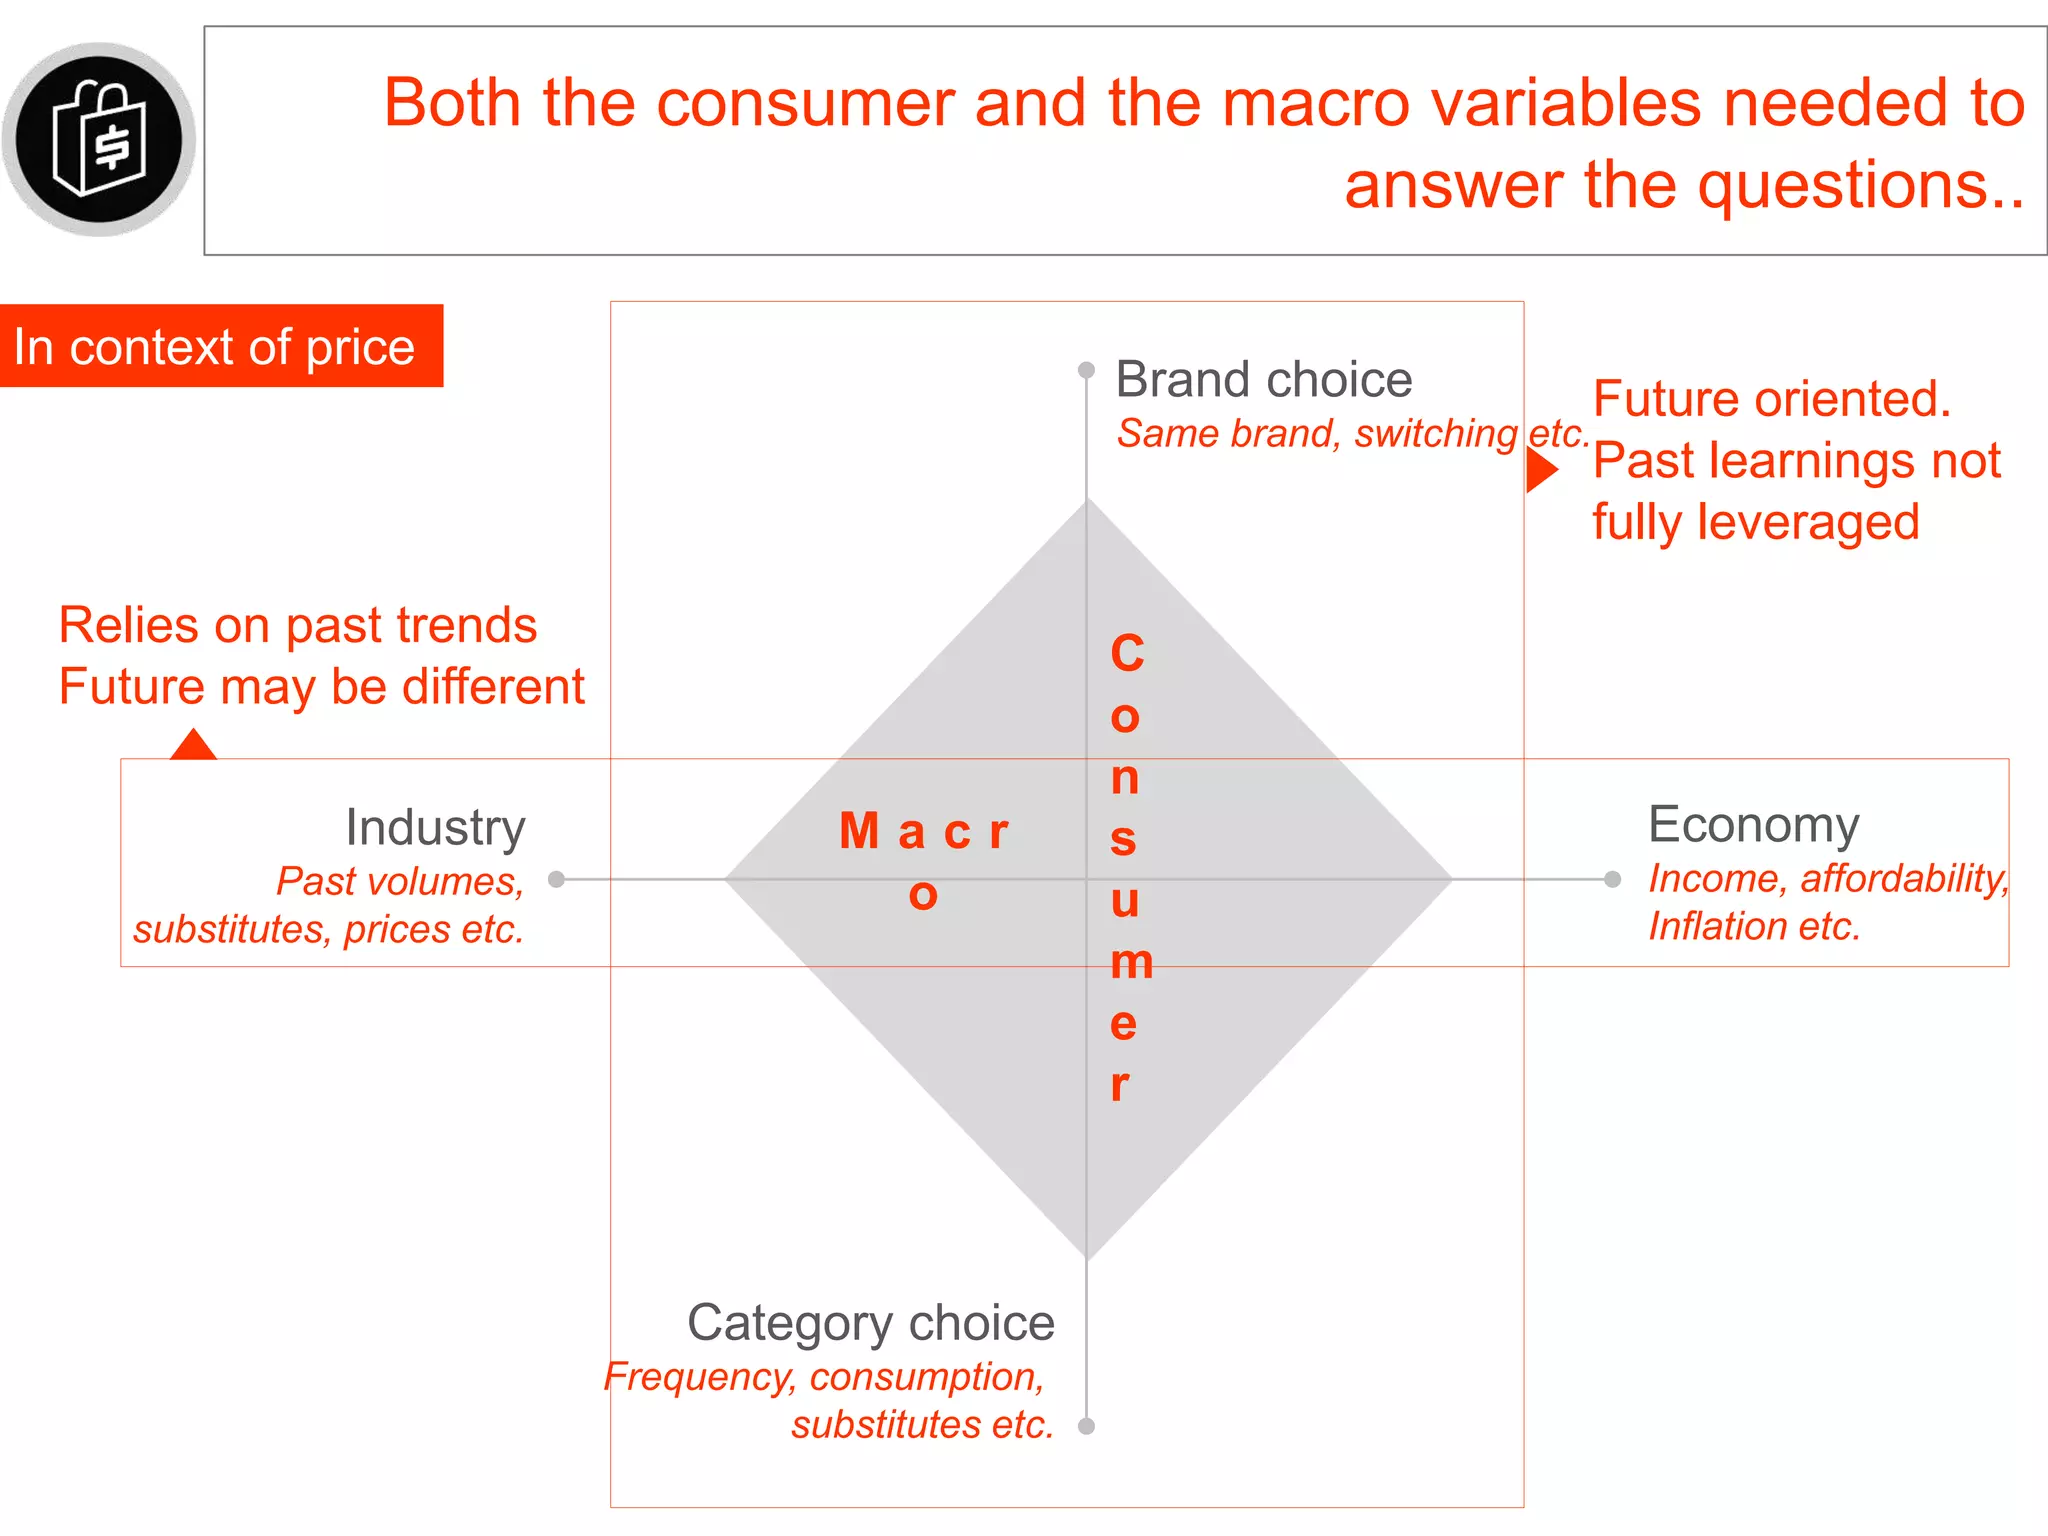
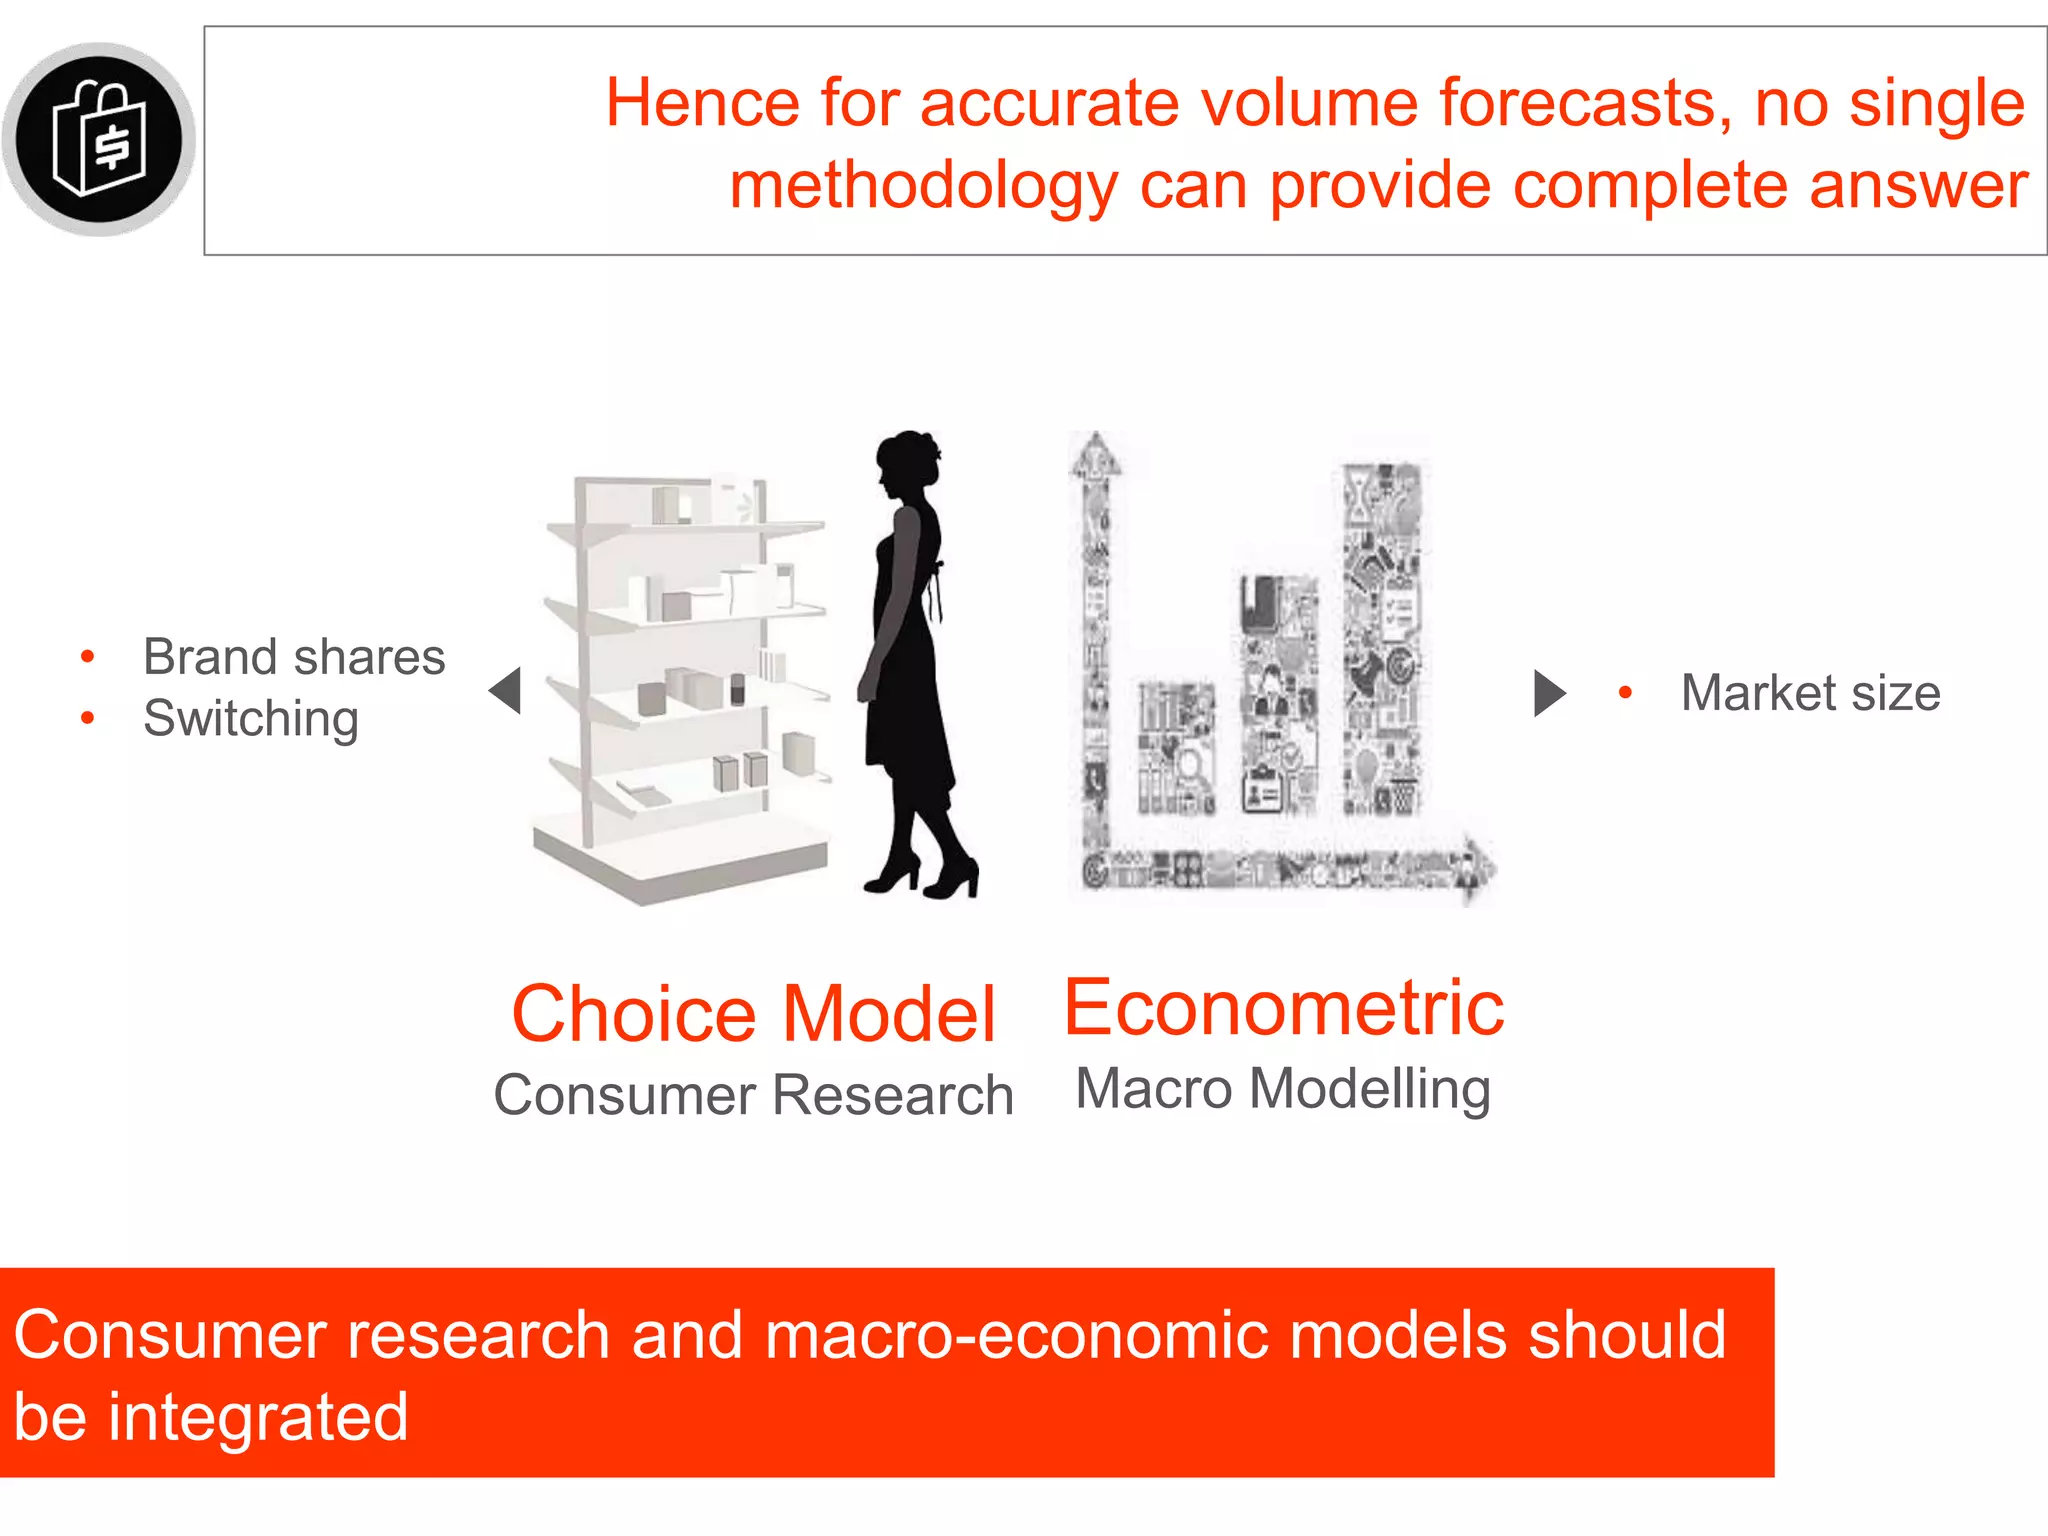
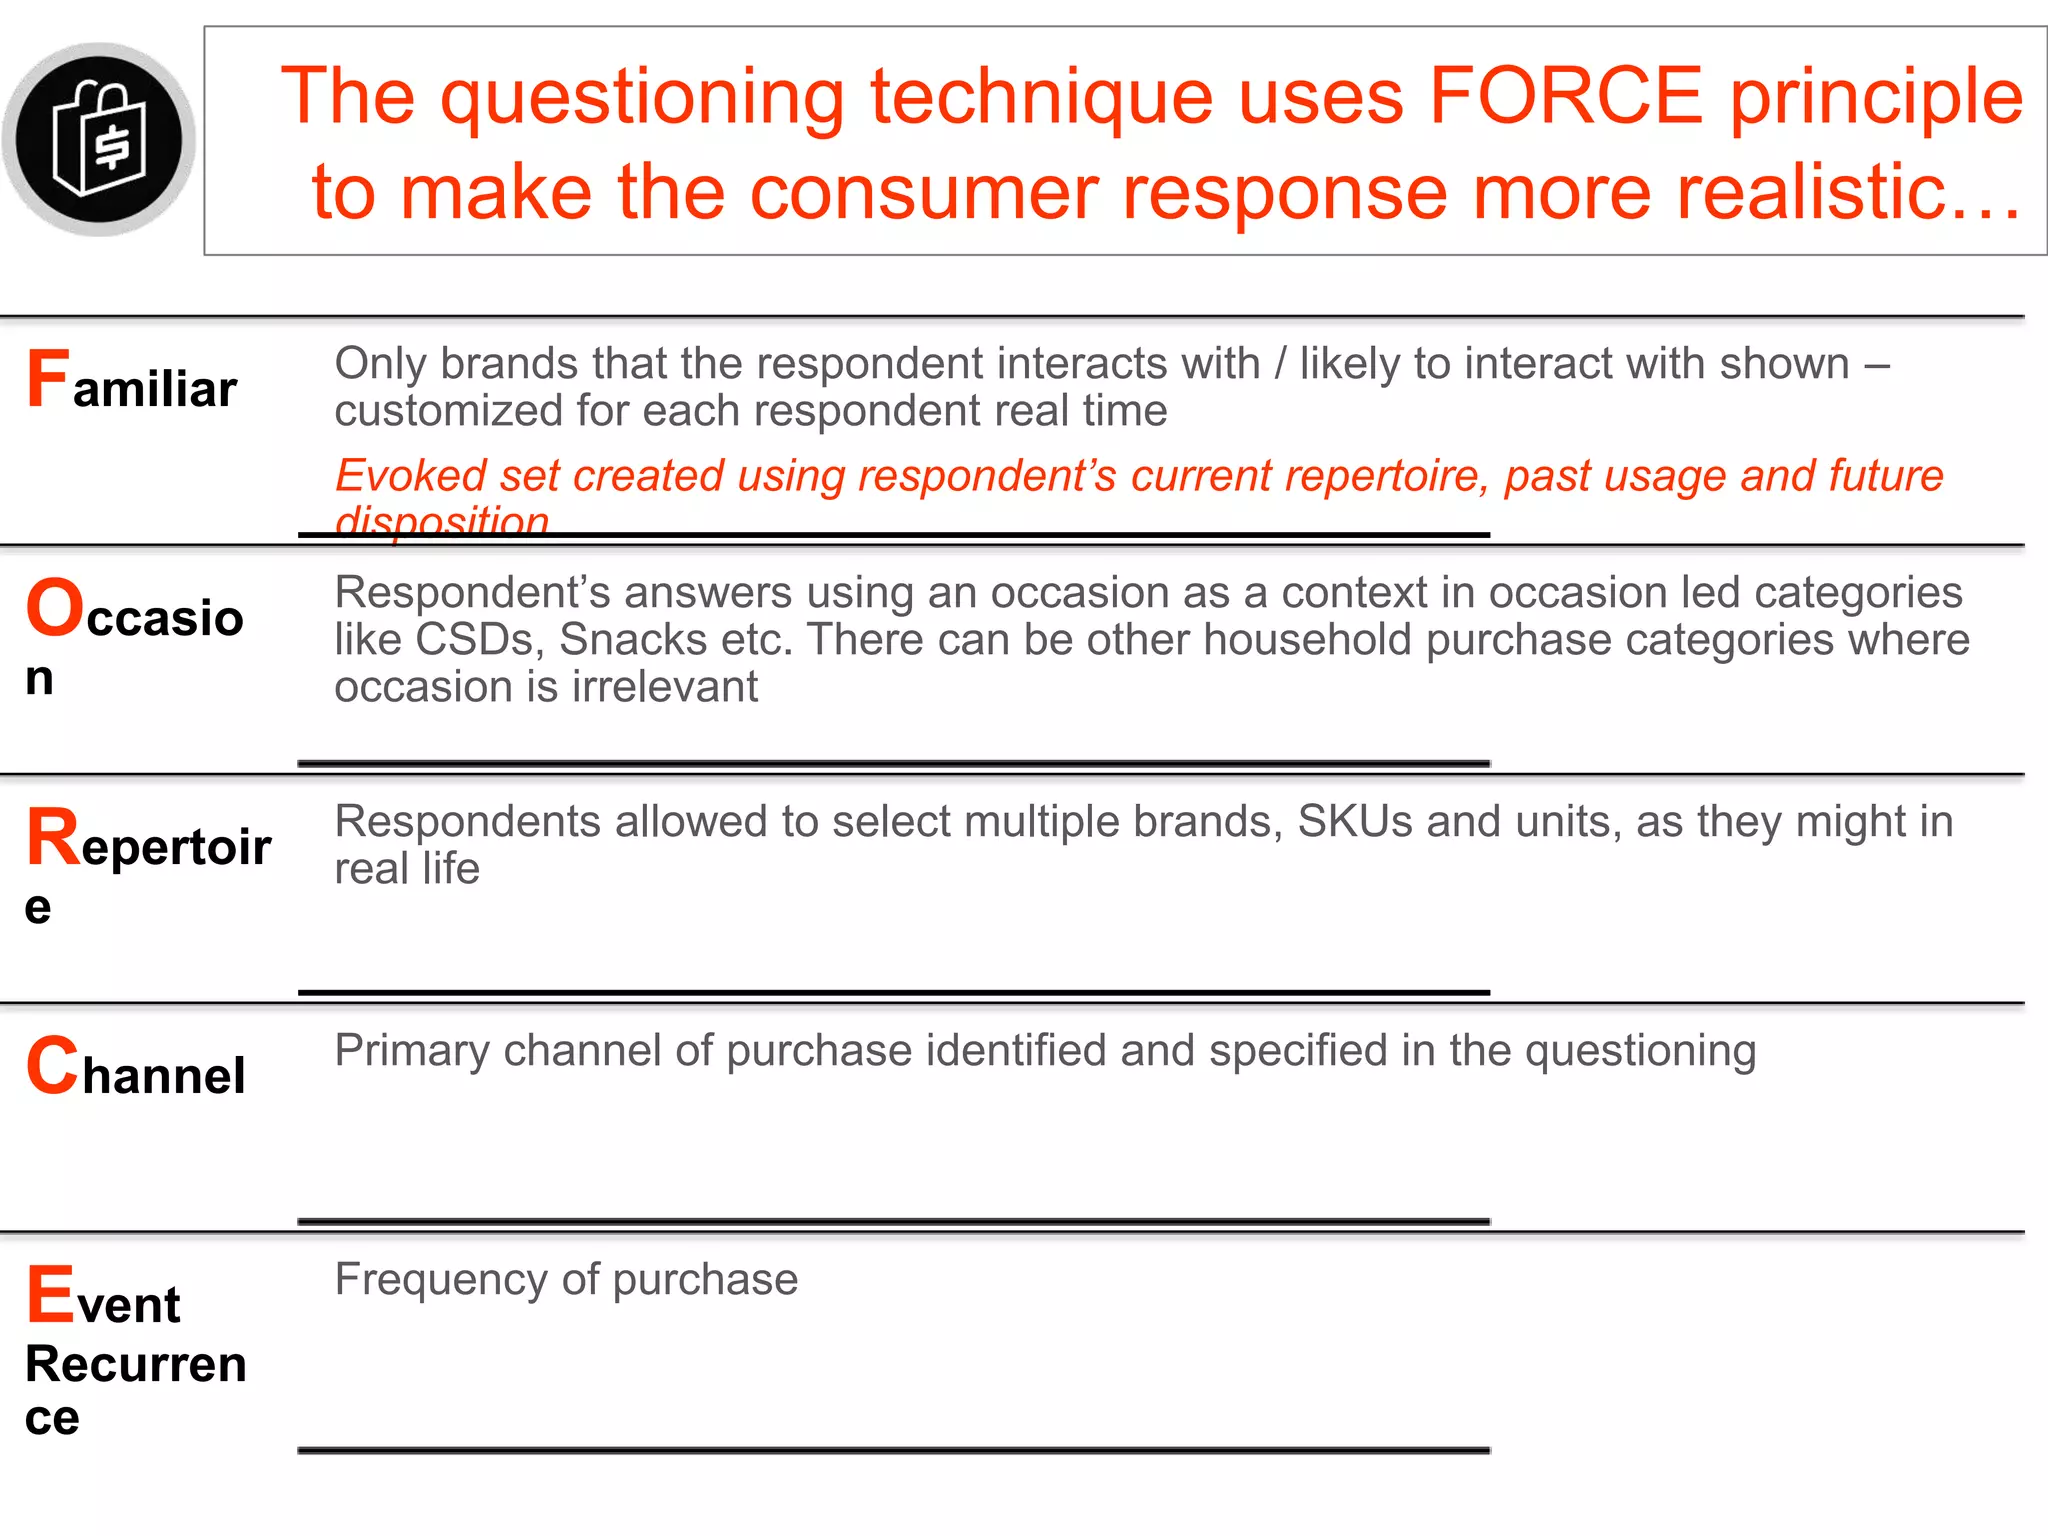
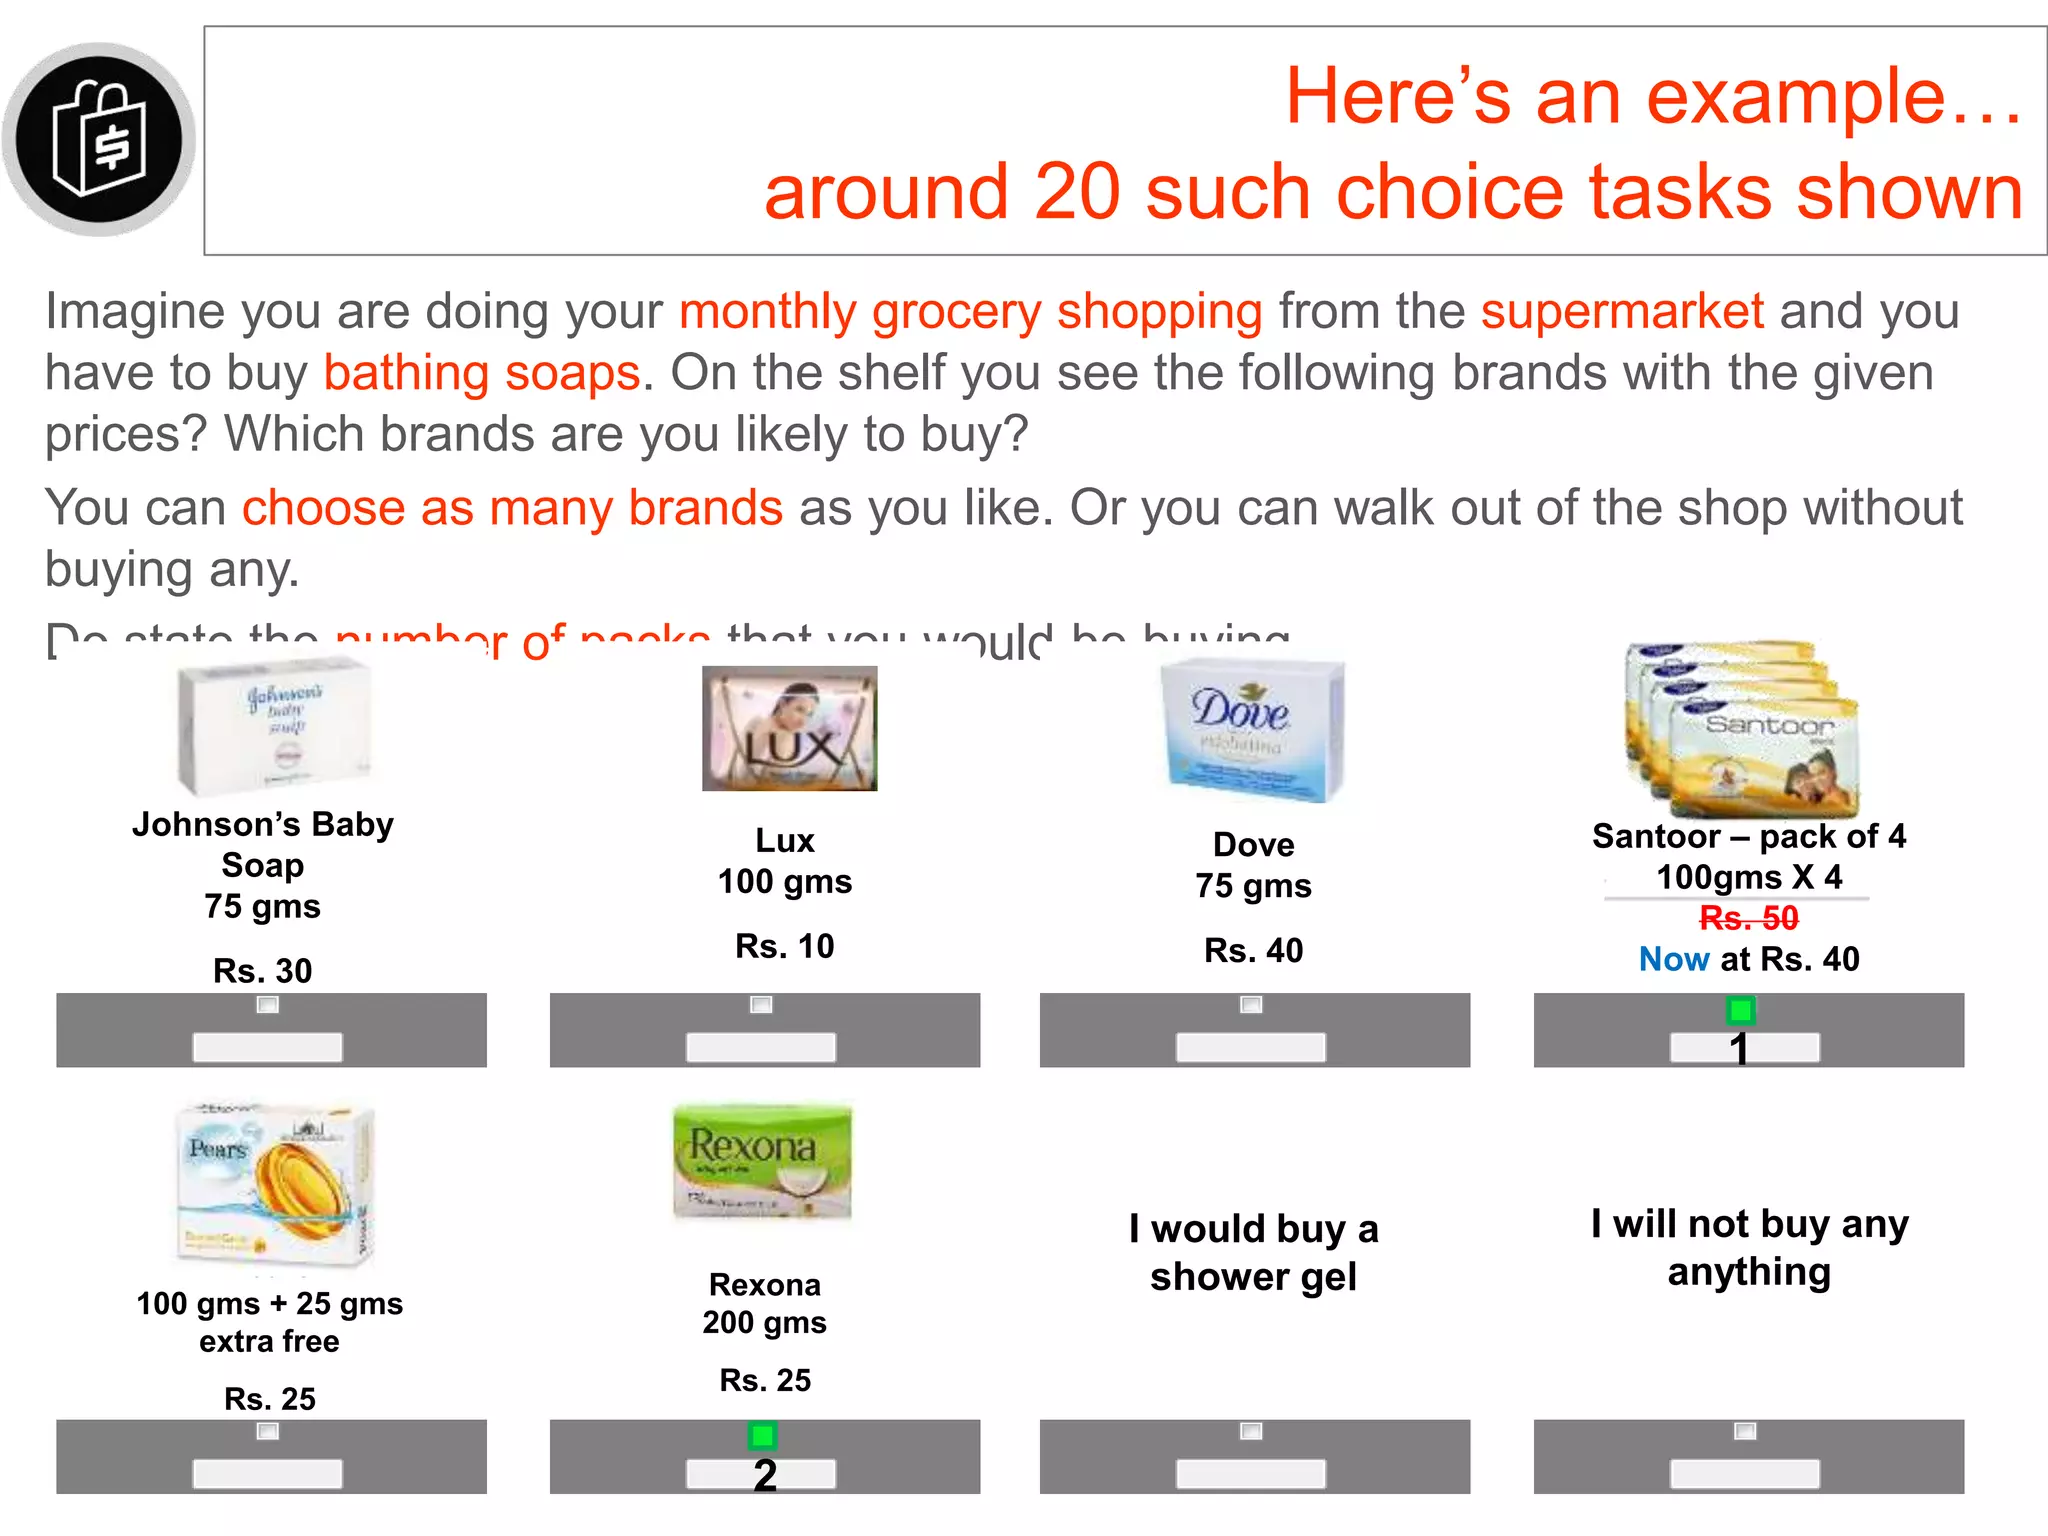
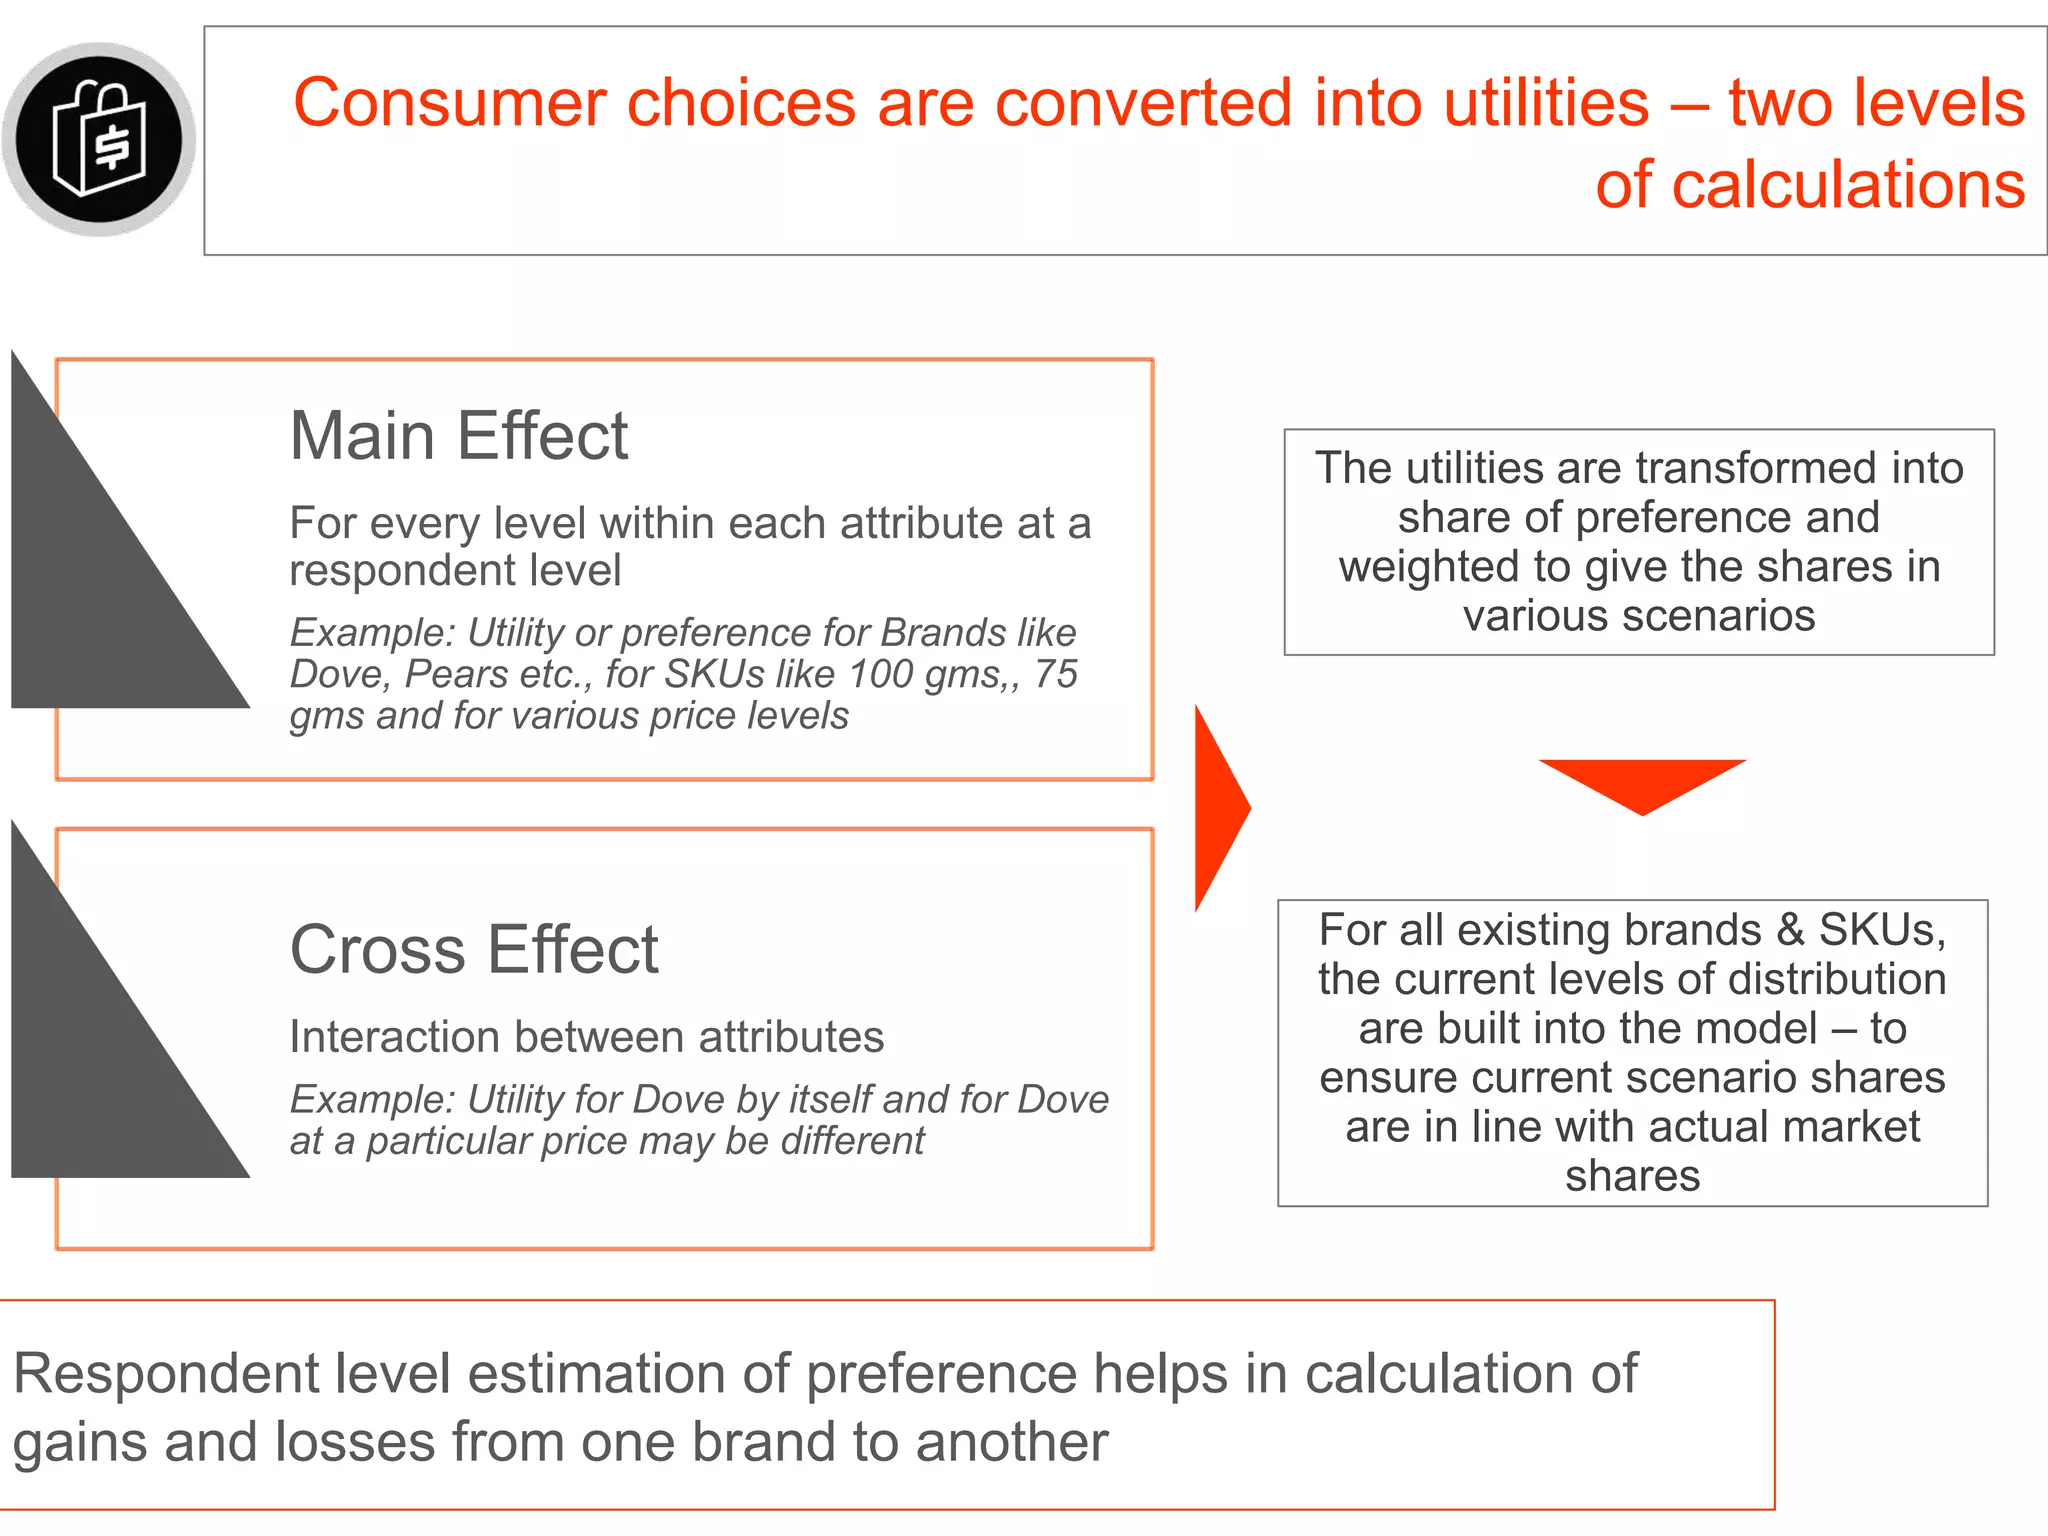
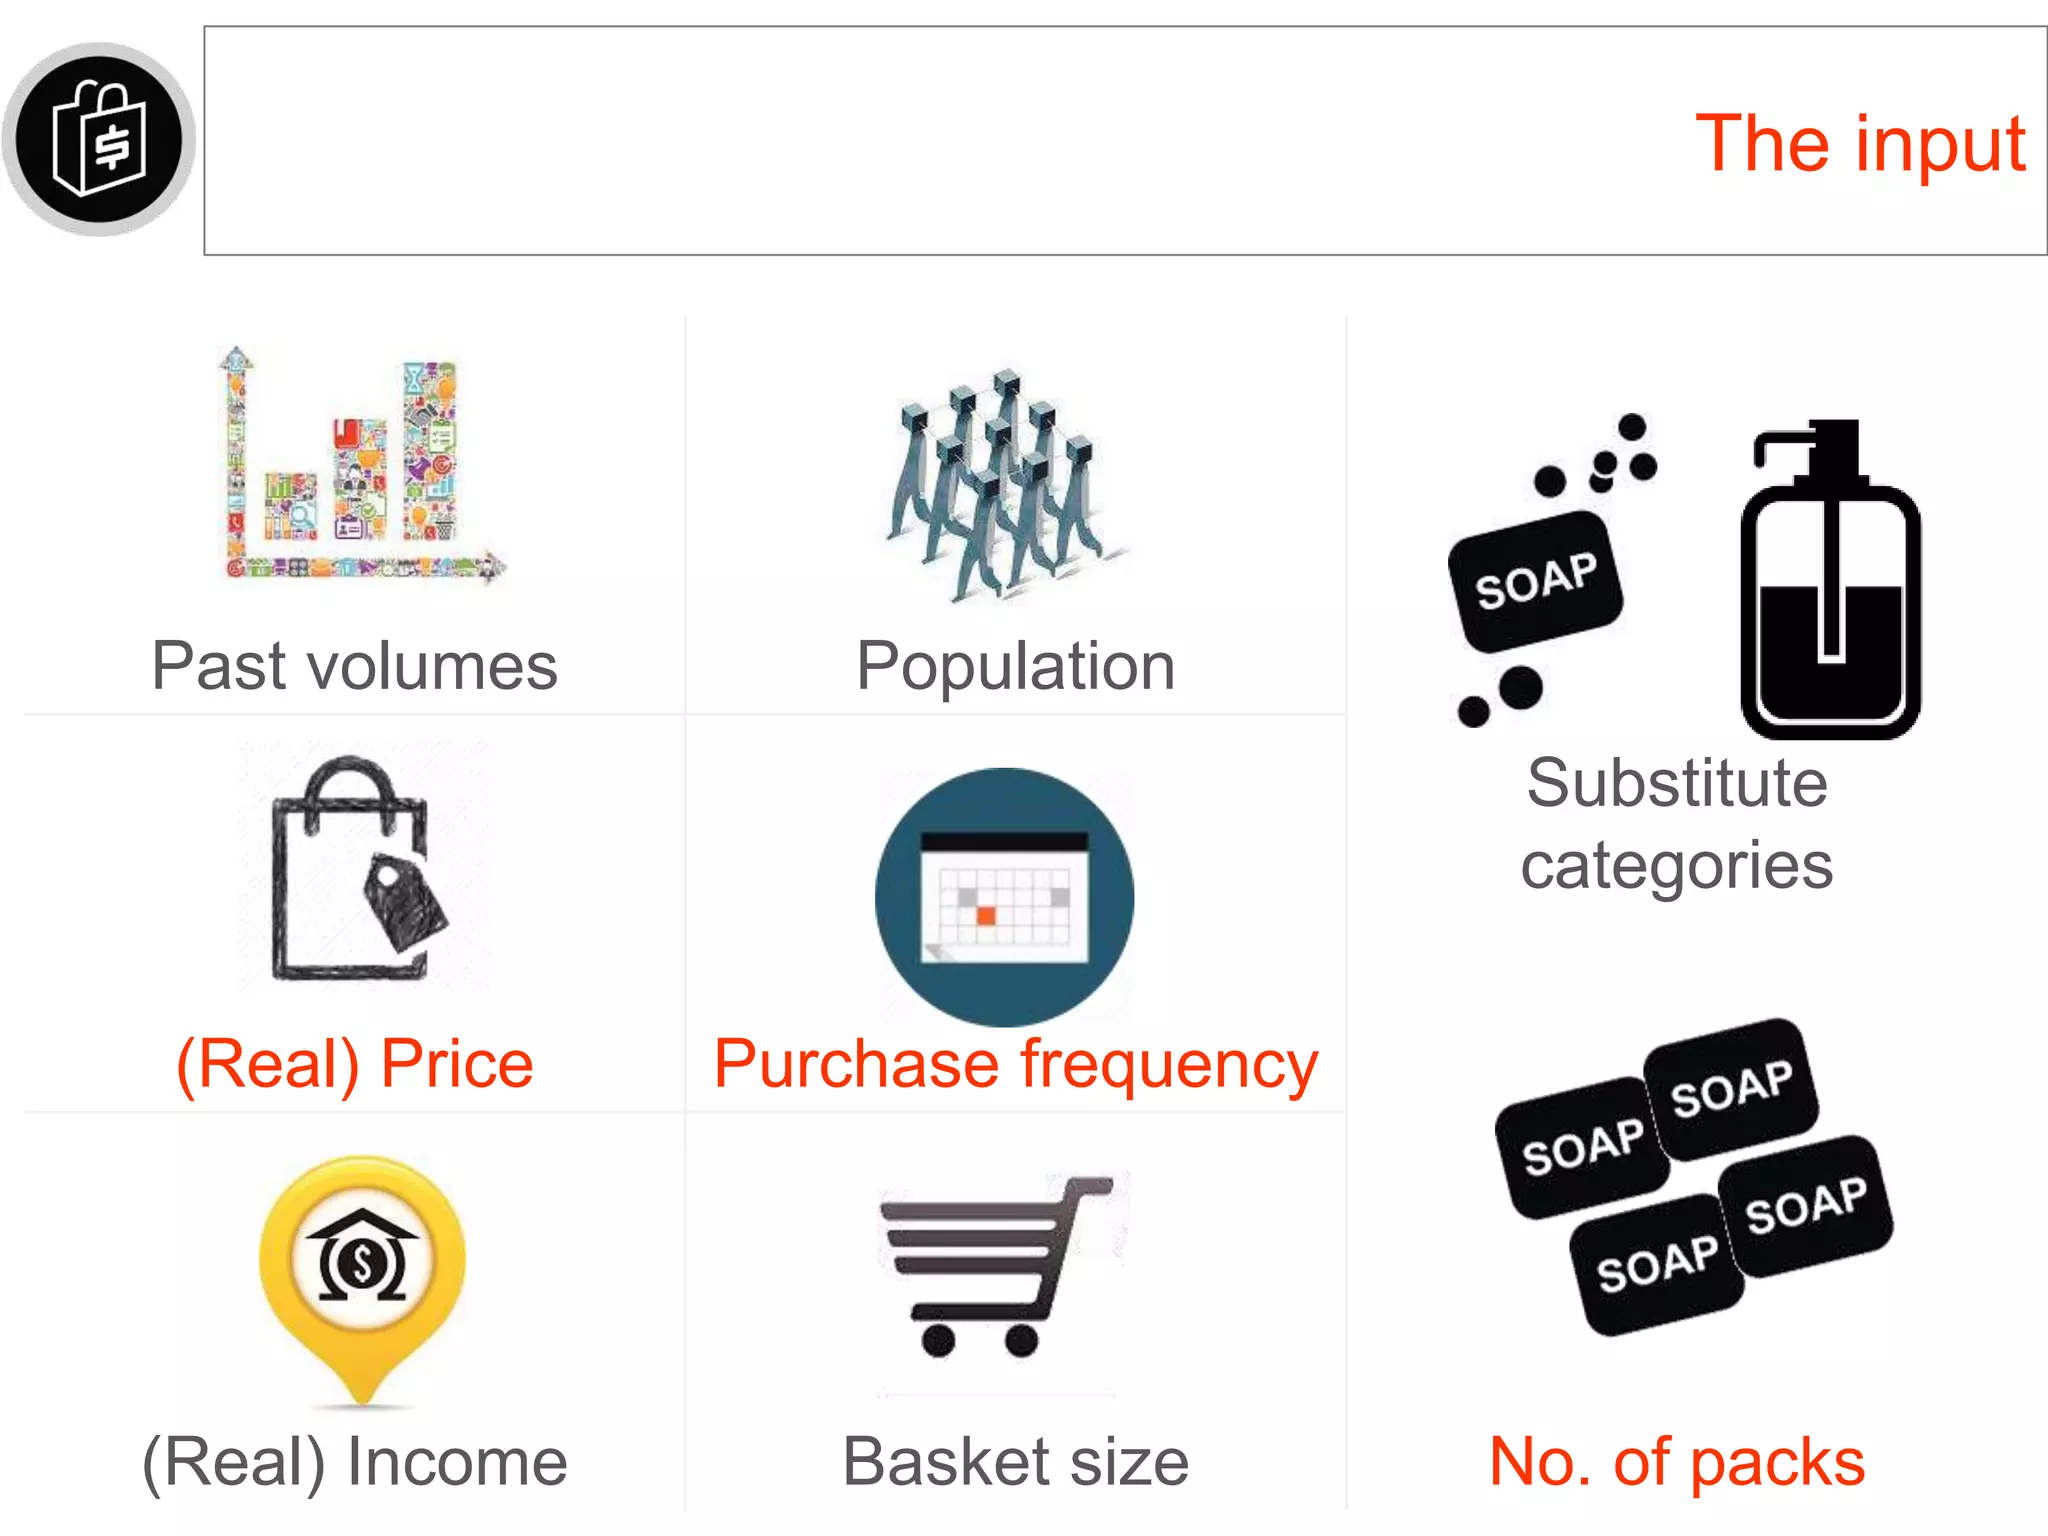
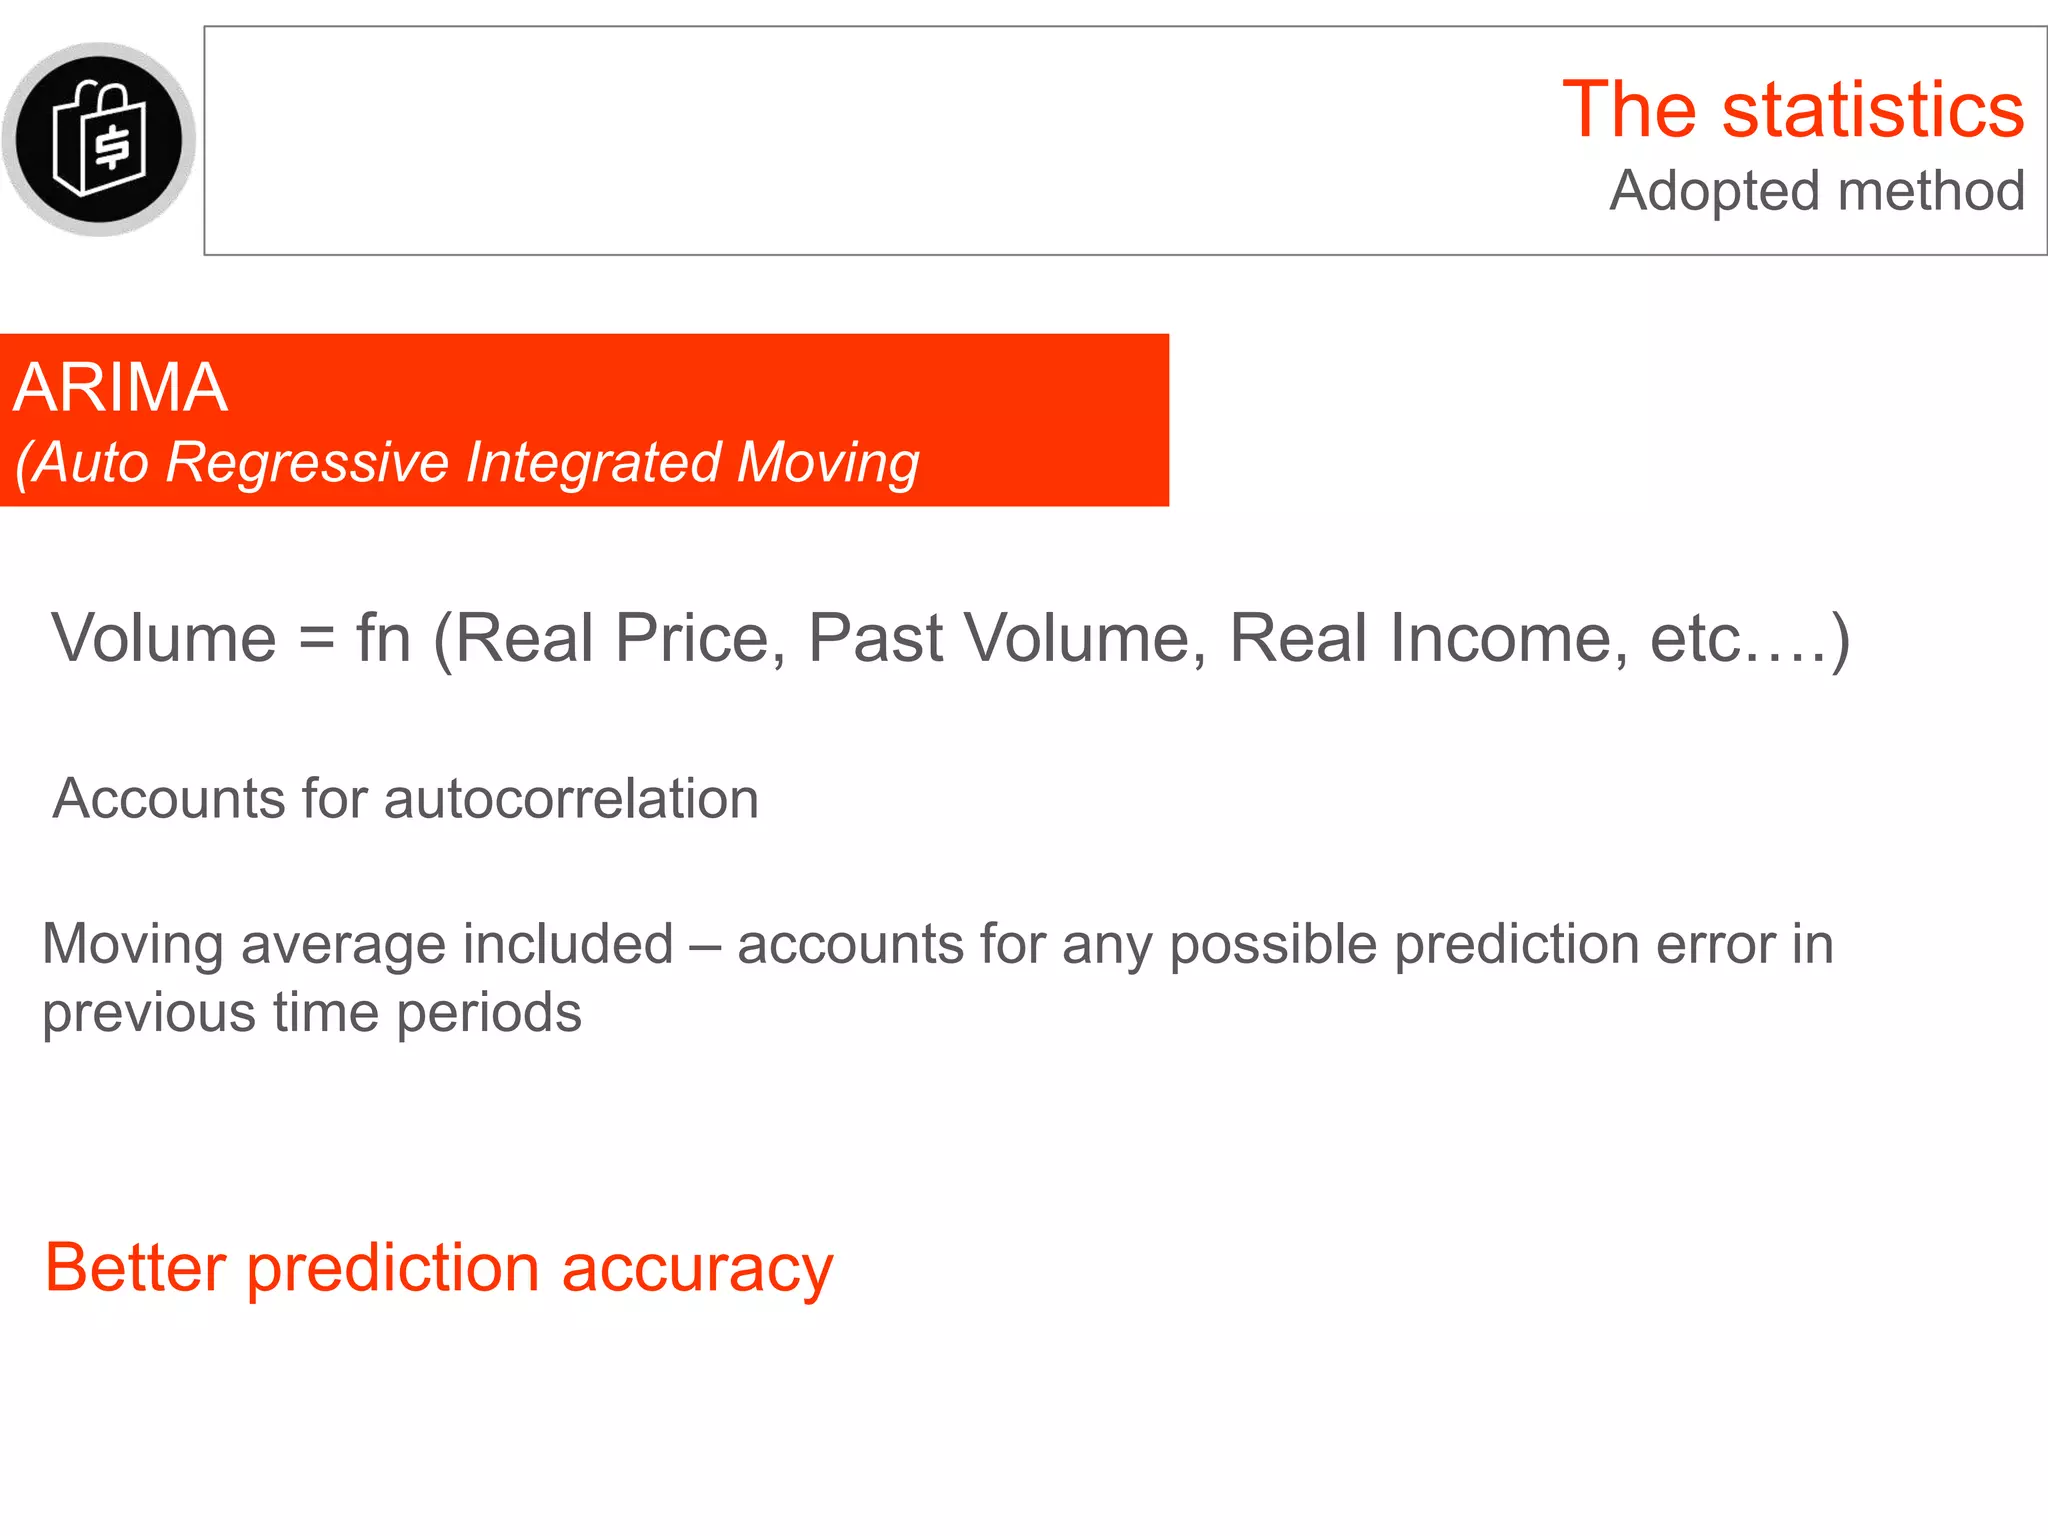
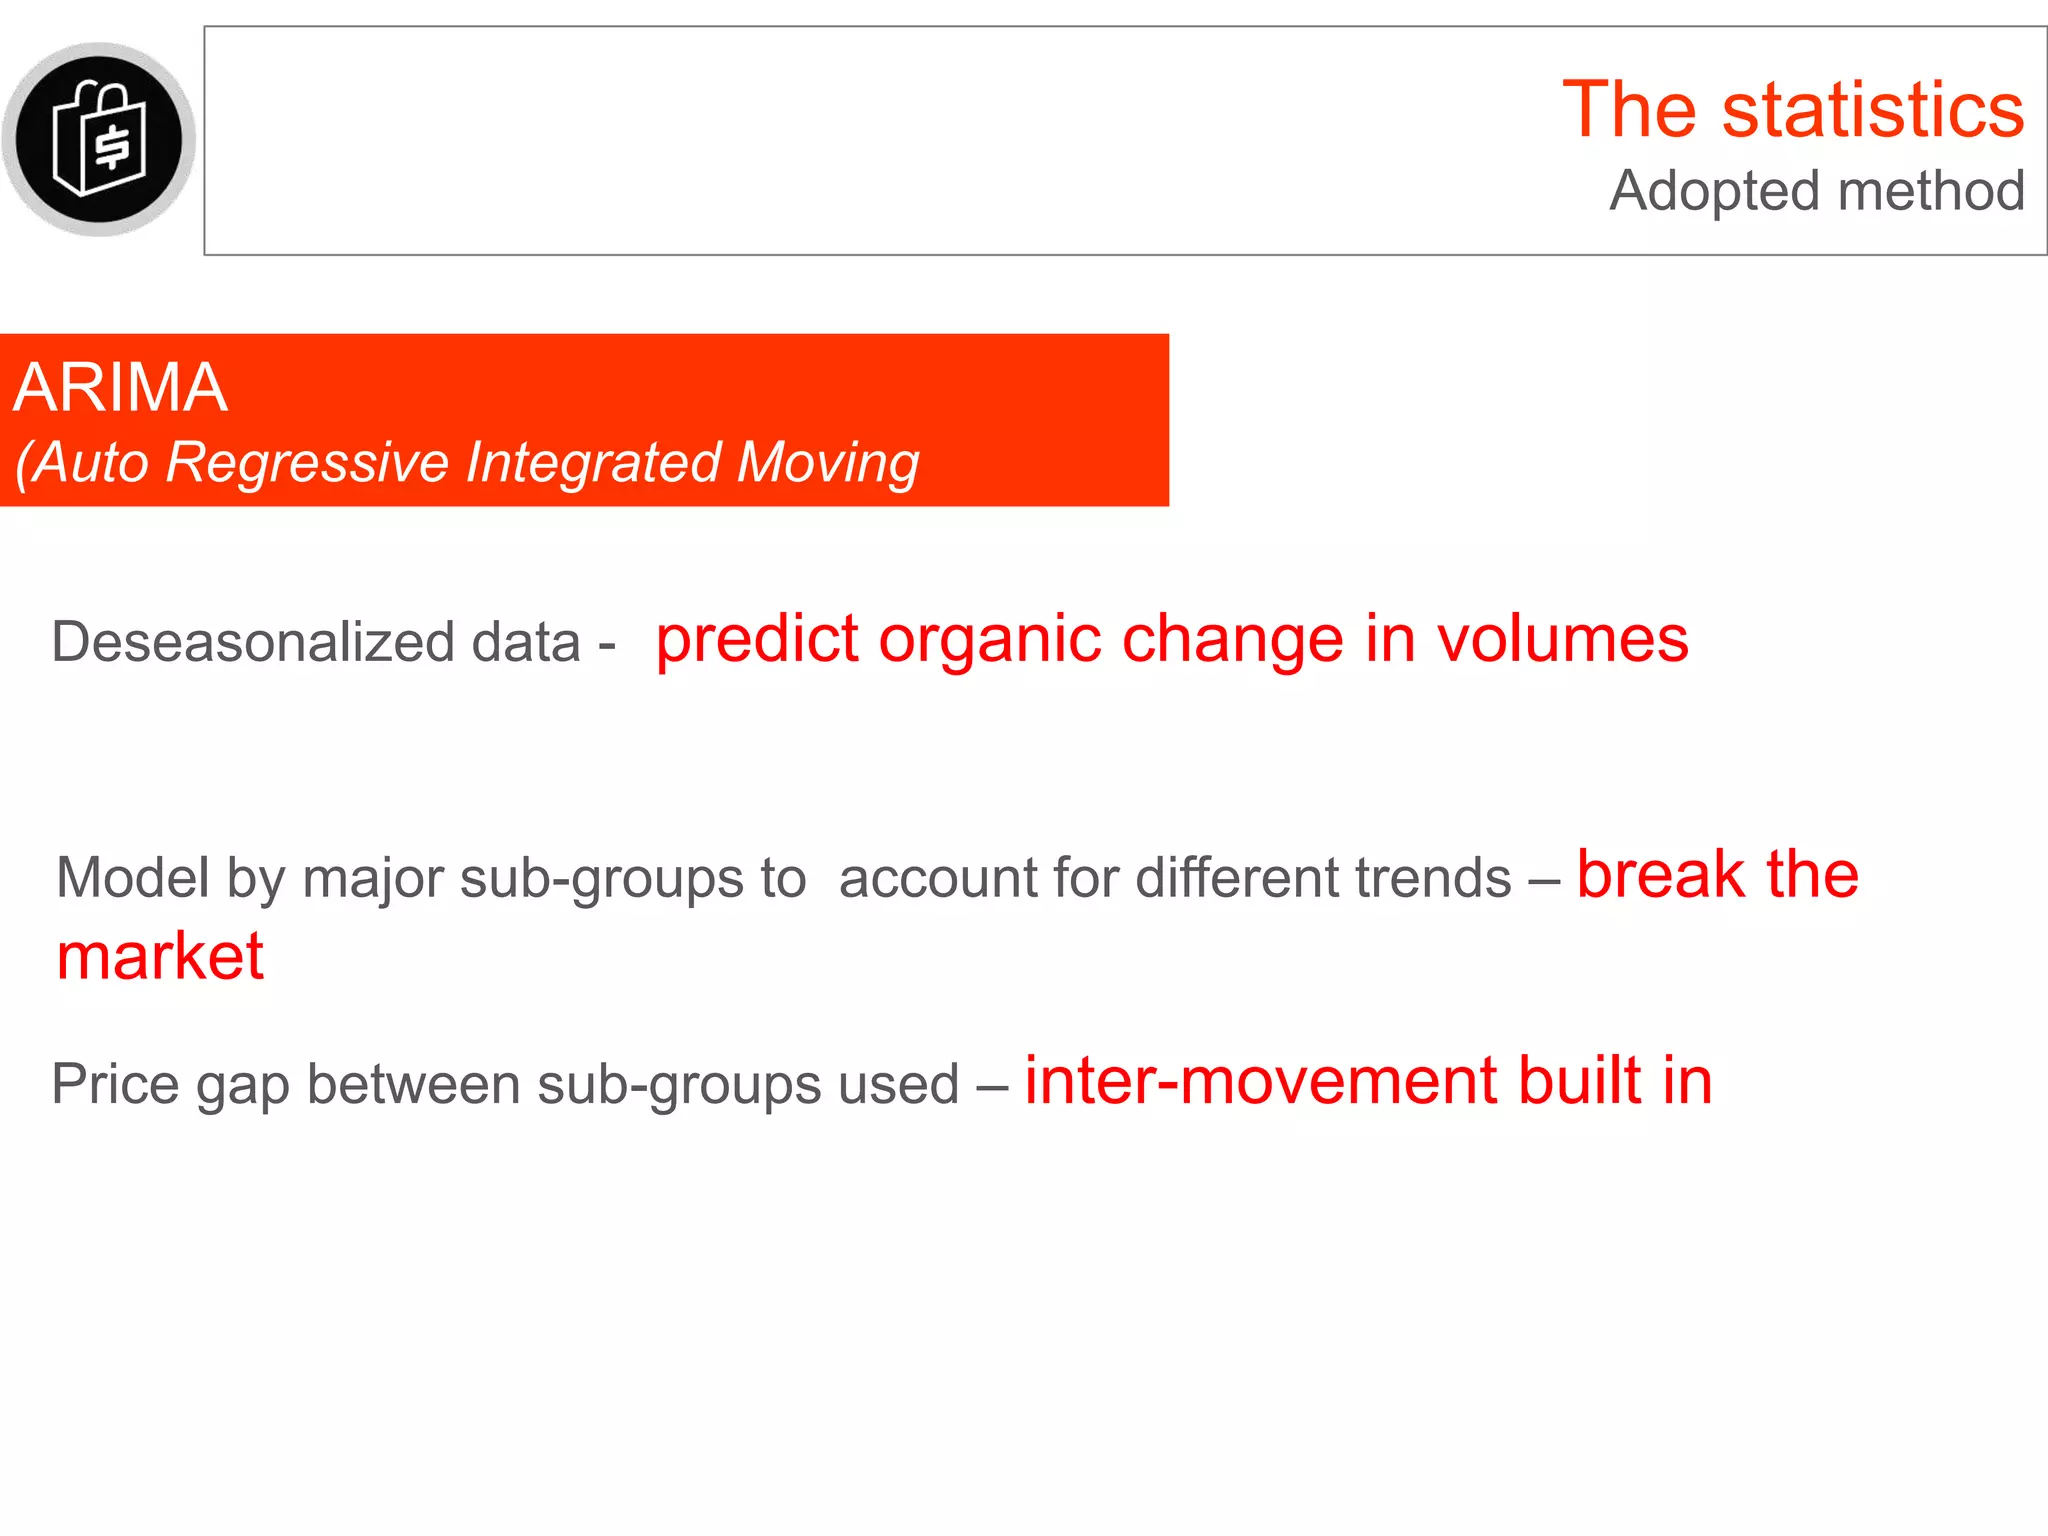
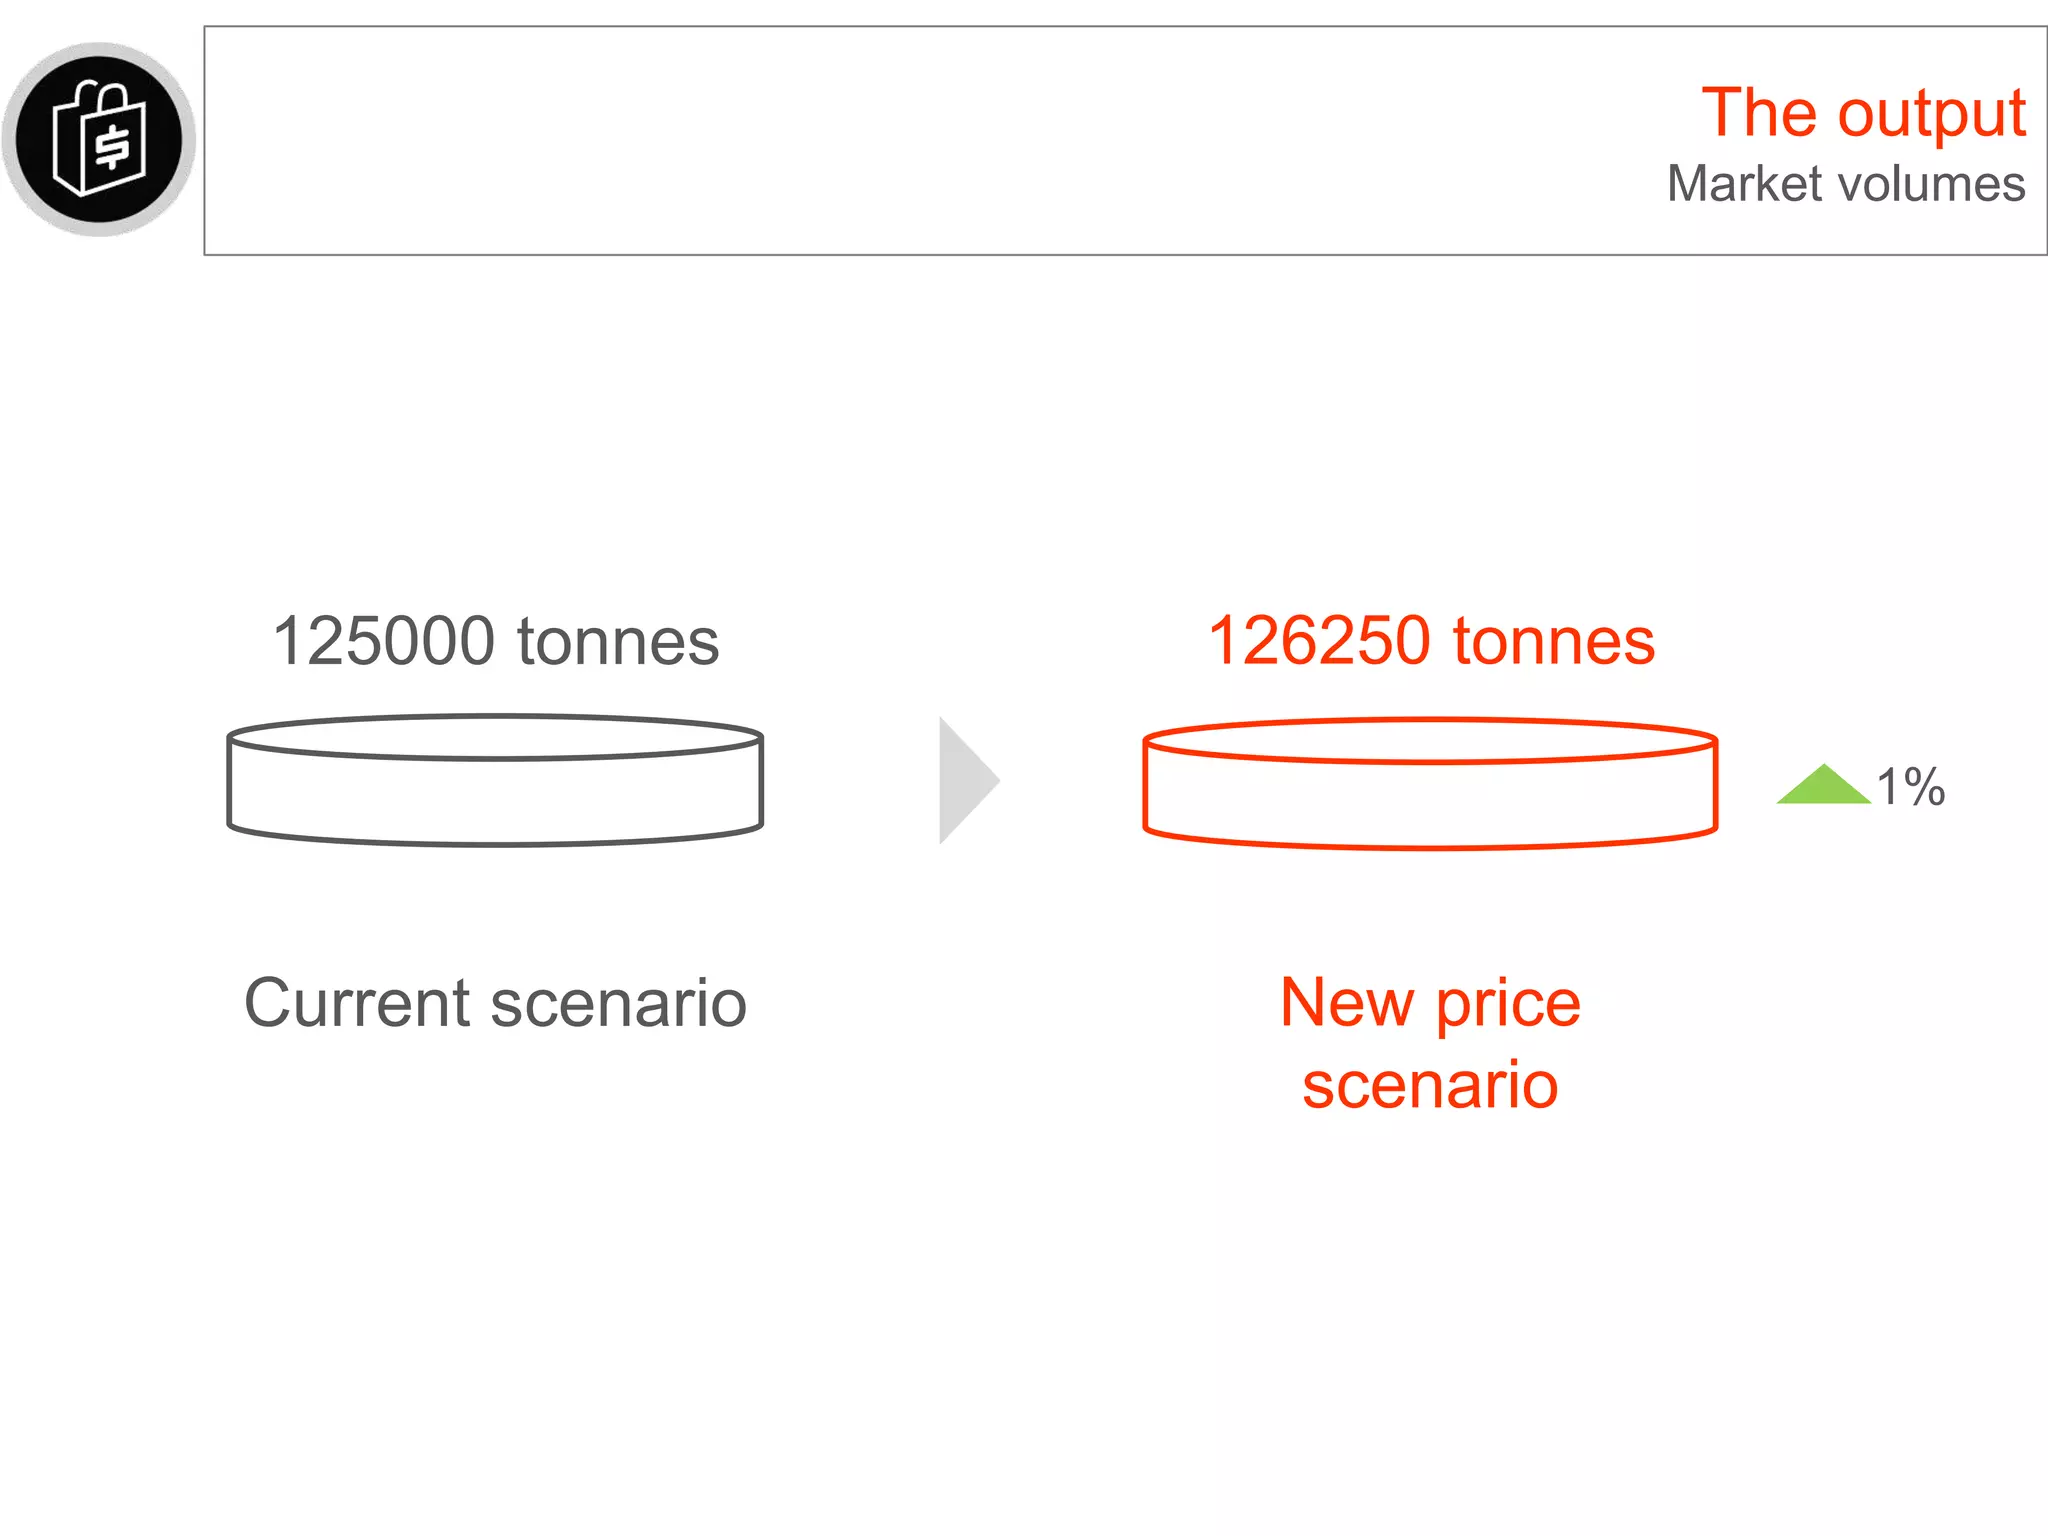
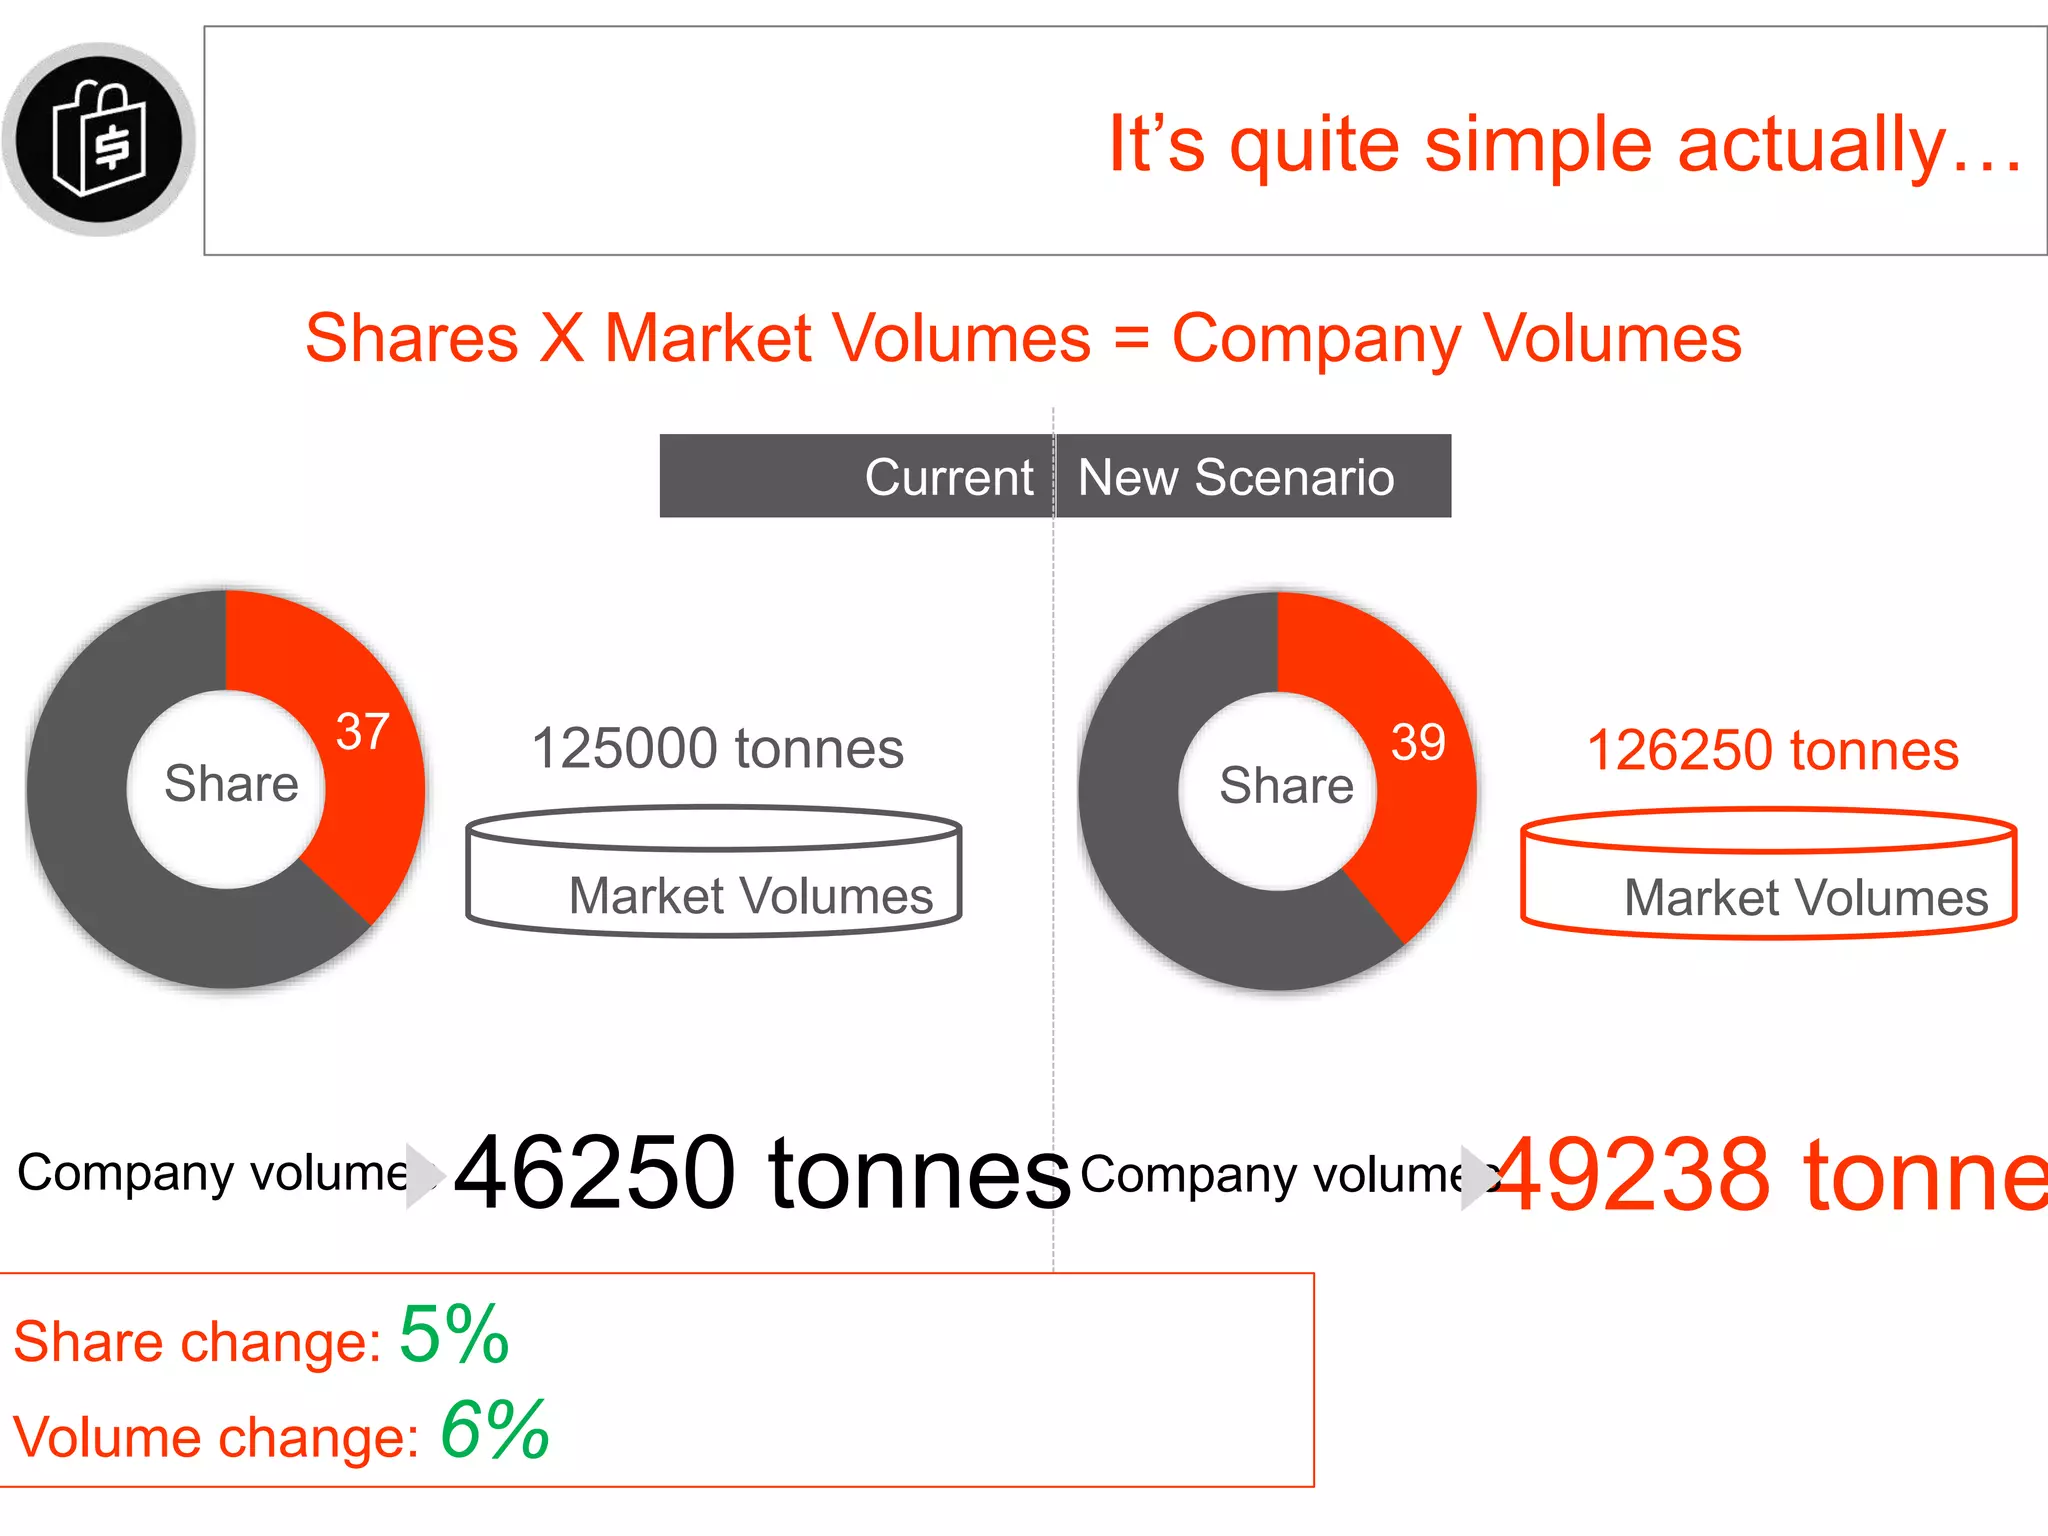
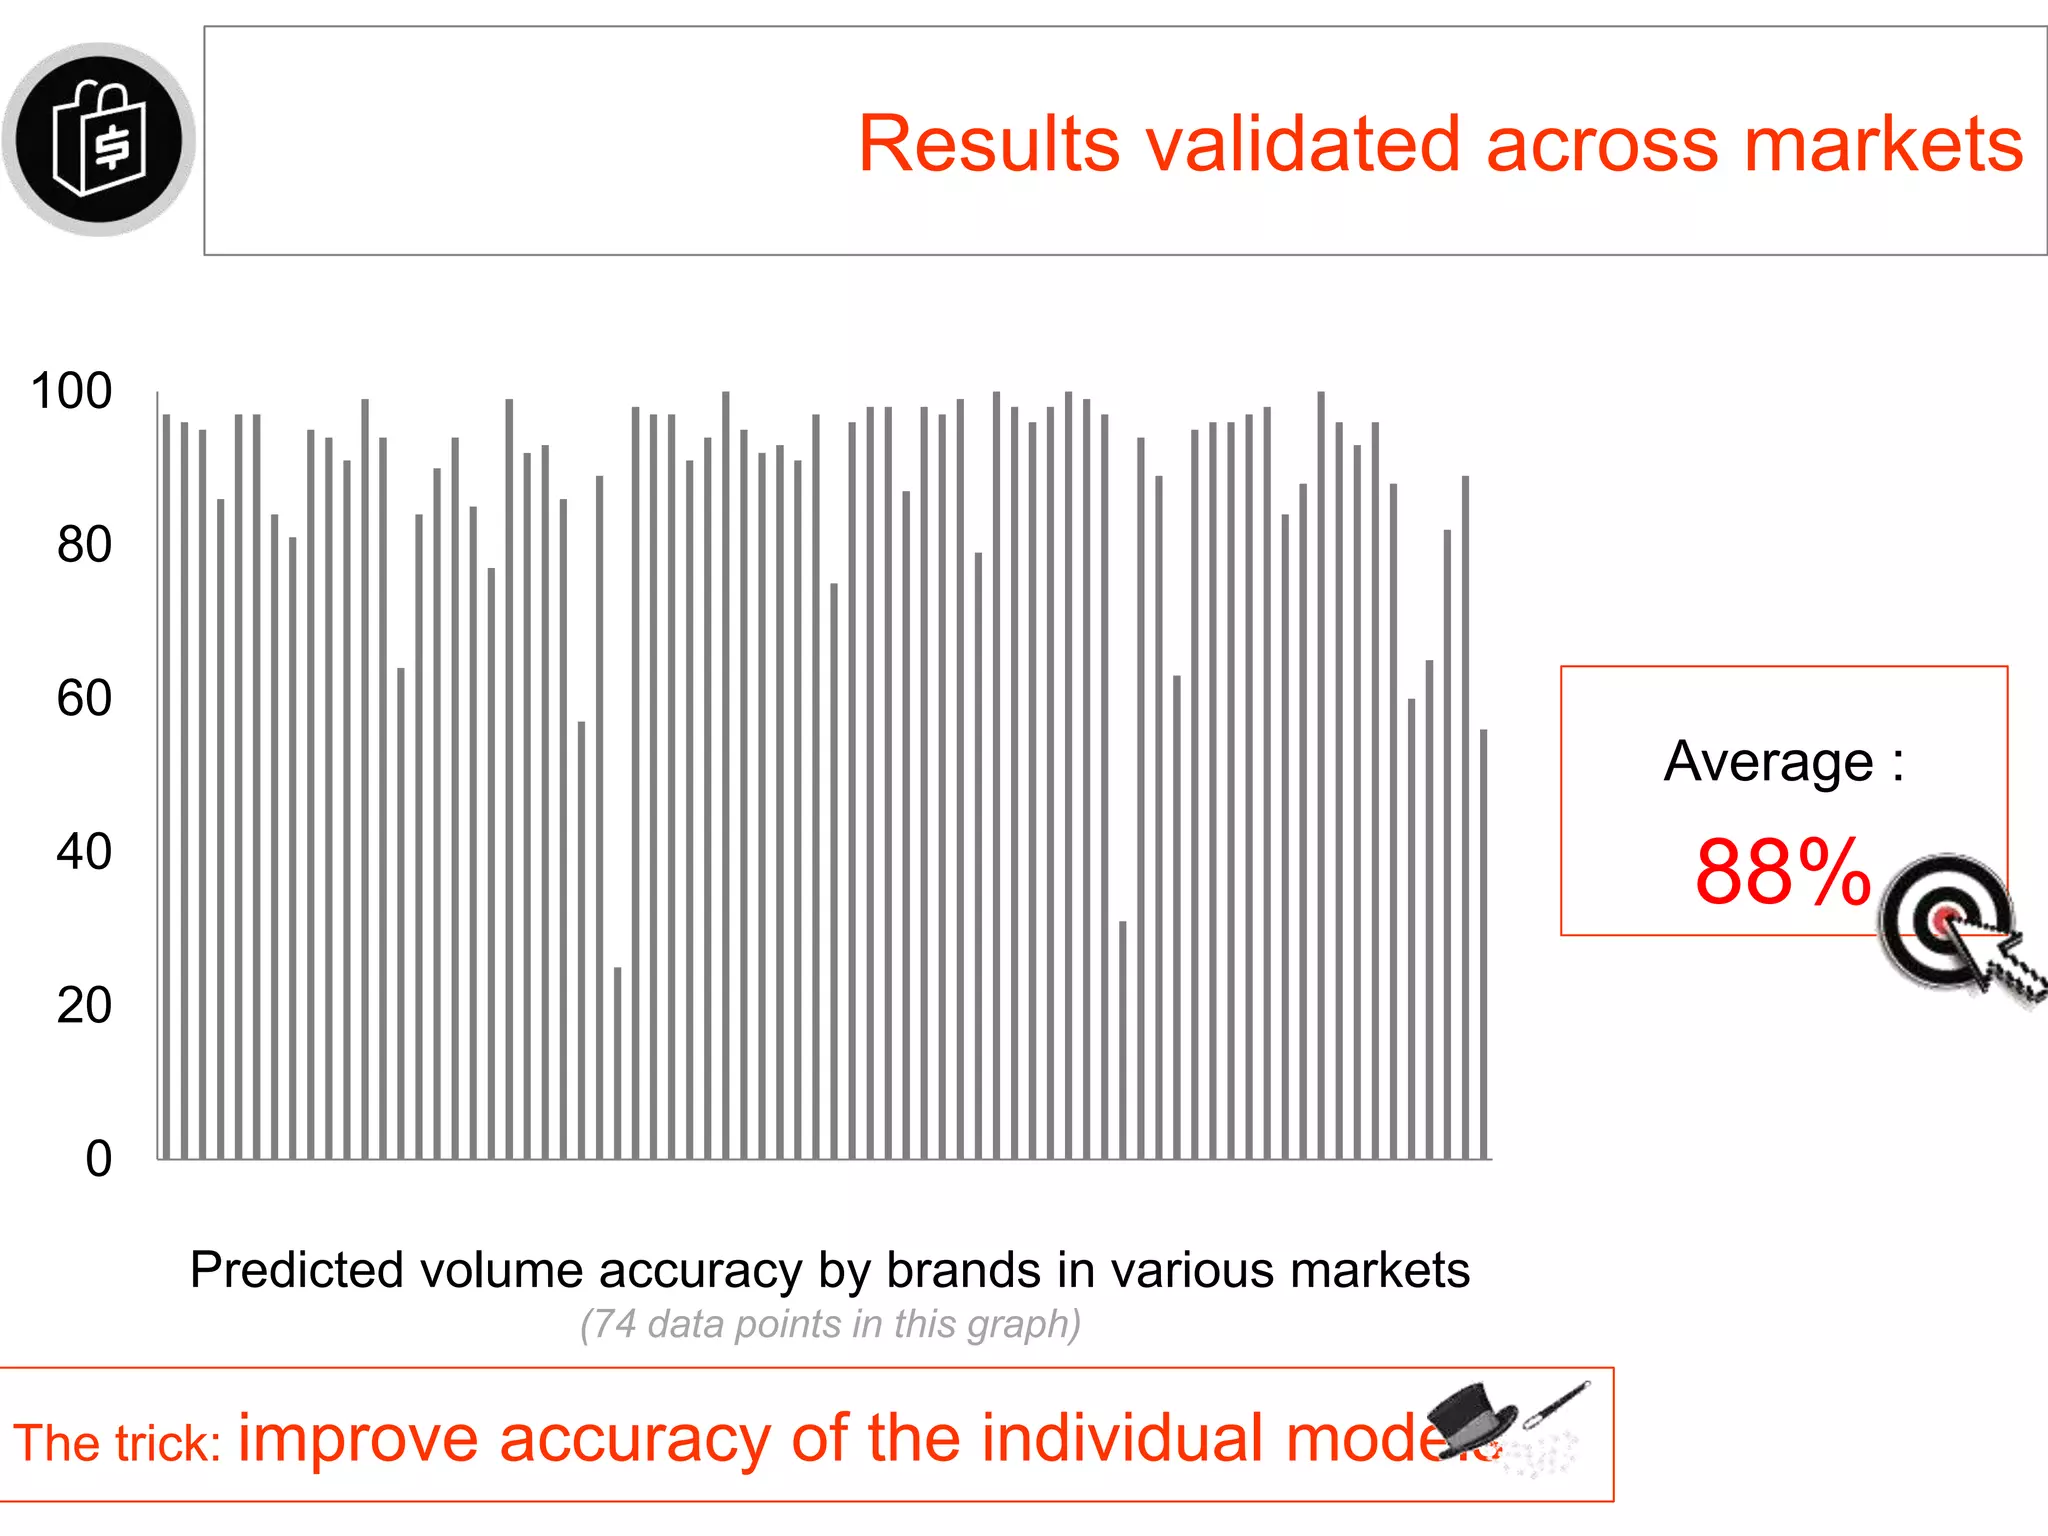
Using a combination of choice modeling and econometric techniques, the authors develop an integrated approach to more accurately forecast how changes in price could impact both market share and market volume. Choice modeling captures consumer preferences and brand switching, while econometric modeling accounts for macroeconomic factors. By combining the output of share simulations from choice models with volume projections from econometric models, the authors are able to estimate how changes in price could impact both a brand's share and the overall market size. The methodology was validated across different product categories and markets, demonstrating predictive accuracy rates of around 88% on average.


![[foresight research] Introduction to Brand Health Tracking](https://cdn.slidesharecdn.com/ss_thumbnails/bht-introduction-180208065326-thumbnail.jpg?width=640&height=640&fit=bounds)


![Mental[1].brand.equity.michael dorn](https://cdn.slidesharecdn.com/ss_thumbnails/mental1-brand-equity-michaeldorn-130705003616-phpapp01-thumbnail.jpg?width=640&height=640&fit=bounds)


![Where to Buy LinkedIn Accounts_ [12 Best Sites] (2).pdf](https://cdn.slidesharecdn.com/ss_thumbnails/wheretobuylinkedinaccounts12bestsites2-251124191348-c246988b-thumbnail.jpg?width=640&height=640&fit=bounds)


