This document contains a table with data on cross-sectional measurements of a roadway, including station locations, left (L), center (CL), and right (R) measurements of the road width, and elevation levels. The table includes station locations from 0+000 to 0+400 meters in 20 meter increments, with width measurements for each location and benchmark (BM) and point (PT) locations noted.
This document contains a table with data on cross-sectional measurements of a roadway, including station locations, left (L), center (CL), and right (R) measurements of the road width, and elevation levels. The table includes station locations from 0+000 to 0+400 meters in 20 meter increments, with width measurements for each location and benchmark (BM) and point (PT) locations noted.
1. The document contains a table of station (STA), angle, correction, and log sine values.
2. Angles are adjusted in two steps using correction values to calculate adjusted degrees, minutes, and seconds.
3. Log sine values are calculated and compared at each adjustment step to check calculations.
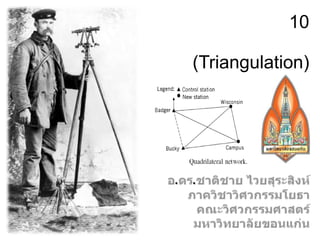
Trilateration and triangulation are surveying methods to establish horizontal control networks. Trilateration involves measuring the lengths of all three sides of triangles without measuring angles, while triangulation measures angles and the length of one base line. Both methods are used to determine coordinate positions through trigonometric computations. Triangulation networks can be classified based on their intended accuracy and purpose, from primary/first order for determining large areas to tertiary/third order for more detailed surveys.
This document discusses triangulation, which is a surveying technique used to establish horizontal control networks over large areas. It involves measuring angles and lengths within networks of triangles. There are different orders of triangulation based on accuracy and area covered, including primary, secondary, and tertiary triangulation. Key aspects discussed include triangulation station layout and design, angle and distance measurements, controlling errors, and computation of unknown lengths and directions within triangles.
Module 2,plane table surveying (kannur university)Vishnudev C
This document describes various methods of plane table surveying. It discusses the principle, equipment, setting up, orientation, and main methods - radiation, intersection, traversing, and resection (by compass, backsight, two point, and three point problems). Plane table surveying allows simultaneous field observation and plotting. It is suitable for small scale maps and eliminates errors in field books.
The document provides instructions for setting up and operating a Sokkia SET total station for surveying tasks. It describes how to level the instrument, perform calibration by backsight or resection, and take measurements such as distance and height. Key steps include leveling the instrument for accurate results, establishing orientation by shooting a known point or angle, and checking calibration by re-measuring control points. The document emphasizes proper setup, calibration checking, and understanding coordinate systems for accurate surveying work.
The document discusses theodolite traversing and defines key terms related to using a transit theodolite. It describes the main components of a transit theodolite including the telescope, vertical circle, plate bubbles, tribrach, and foot screws. It explains how to perform temporary adjustments like centering the theodolite over a station mark and leveling it using the tripod and foot screws. It also provides details on measuring horizontal and vertical angles with a vernier theodolite.
10. Chain of Triangles เป็นการคำนวณหาความยาวของด้านต่างๆที่ไม่ใช่เส้นฐาน จากความยาวของเส้นฐาน โดยต้องคำนวณตามลำดับเท่านั้น เช่น จากเส้นฐาน AB หา BC แล้วจึงไปหา CD แล้วโยงไปหาด้าน DE แล้วจึงต่อไปคำนวณด้าน EF E F C D B A เส้นฐาน
11. Chain of Polygons เป็นข่ายสามเหลี่ยมที่เกิดจากรูปหลายเหลี่ยมซึ่งประกอบขึ้นจากกลุ่มของสามเหลี่ยมที่มีจุดยอดร่วมกัน ผลบวกของมุมภายในสามเหลี่ยมแต่ละรูป ต้องเท่ากับ 180o ผลบวกของมุมรอบจุดศูนย์กลางต้องเท่ากับ 360o ข่ายสามเหลี่ยมระบบนี้จะสามารถทำการคำนวณความยาวของด้านได้ 2 แนวทางและค่าที่ได้จากสองแนวทางนี้ต้องสอดคล้องกัน L G C M J F N H A O K D E I B
12. Chain of Quadrilaterals ข่ายสามเหลี่ยมที่โยงยัดกันเป็นลูกโซ่โดยประกอบด้วยแบบลูกโซ่ของสามเหลี่ยมเดี่ยว 2 ลูกโซ่ซ้อนกันอยู่ ผลรวมของมุมราบรอบจุดๆหนึ่งรวมเท่ากับ 360o ในสามเหลี่ยมใดๆมุมทั้งสามรวมกันต้องเป็น 180o C E A D F B
13. Equal Shift สำหรับ Quadrilateral Station Adjustment ผลรวมของมุมรอบจุดแต่ละสถานีเป็น 360o Figure Adjustment ผลรวมของมุมที่ประกอบกันเป็นรูปเหลี่ยมต้องเป็น 360o ผลรวมของคู่มุมที่ตรงข้ามกันที่เกิดจากการตัดกันของเส้นทแยงมุมต้องมีผลบวกเท่ากัน (1+2 = 5+6 และ 3+4=8+7) ผลบวก Log Sine มุมทางซ้าย = ผลบวก Log Sine มุมทางขวา C 4 5 B 3 2 6 7 1 8 D A
15. ตัวอย่างการคำนวณปรับแก้ด้วยวิธี Equal Shift C 4 5 ผลรวมของมุมที่ประกอบกันเป็นรูปเหลี่ยมต้องเป็น 360o ผลรวมของคู่มุมที่ตรงข้ามกันที่เกิดจากการตัดกันของเส้นทแยงมุมต้องมีผลบวกเท่ากัน (1+2 = 5+6 และ 3+4=8+7) B 3 2 6 7 1 8 D A
16. ตัวอย่างการคำนวณปรับแก้ด้วยวิธี Equal Shift (ต่อ) เงื่อนไขทางด้าน (Side Condition) เป็นการปรับแก้ตามเงื่อนไขทางตรีโกณมิติโดยให้ความยาวที่คำนวณได้จากแต่ละเส้นทางมีค่าเท่ากัน - ผลบวก Log Sine มุมทางซ้าย = ผลบวก Log Sine มุมทางขวา
17. ความยึดเหนี่ยวของรูป (Strength of Figure) การคำนวณความด้านจากเส้นฐาน คำนวณได้หลายเส้นทาง ทำให้ได้ความยาวหลายค่า กล่าวคือ จากรูป Quadrilateral ความยาวเส้น CD ที่คำนวณจากเส้นฐาน AB นั้นคำนวณได้จาก 4 เส้นทาง ดังนั้น จึงมีค่า CD ด้วยกัน 4 ค่า จึงต้องเลือกค่าที่คลาดเคลื่อนน้อยที่สุด สิ่งซึ่งจะเป็นเครื่องชี้ว่าควรจะเลือกคำนวณจากเส้นทางใด เรียกว่า ความยึดเหนี่ยวของรูป (Strength of Figure) 1 2 3 4 C 4 5 B 3 2 6 7 1 8 D A
18. ความยึดเหนี่ยวของรูป (Strength of Figure) ใช้สัญลักษณ์ R เส้นทางใดมีค่า R น้อยที่สุด แสดงว่า ความยาวที่คำนวณจากเส้นทางนั้นมีค่าความคลาดเคลื่อนน้อยที่สุด เส้นทางนั้นมีความยึดเหนี่ยวของรูปดีที่สุด ความยึดเหนี่ยวของรูปจะเกี่ยวข้องกับ รูปร่างของสามเหลี่ยมในทางเรขาคณิต จำนวนมุมสถานีที่ทำการรังวัดมุมหรือทิศทาง จำนวนสภาวะทางมุมและสภาวะทางด้านที่ใช้ในการปรับแก้โครงข่าย
19. ความยึดเหนี่ยวของรูป (Strength of Figure) สูตรที่ใช้ในการคำนวณความยึดเหนี่ยวของรูป คือ R = ความยึดเหนี่ยวของรูป D = จำนวนทิศทางที่ทำการวัดทั้งสองทิศทาง ไม่รวมเส้นฐานที่รูปความยาว C = จำนวนสภาวะของรูปโครง คือ จำนวนเงื่อนไขทางเรขาคณิตและทางตรีโกณมิติ = Na+Ns = (n’-s’+1)+(n-2s+3) Na = จำนวนเงื่อนไขทางเรขาคณิต (เงื่อนไขทางมุม) =n’-s’+1 Ns = จำนวนเงื่อนไขทางตรีโกณมิติ (เงื่อนไขทางด้าน) = (n-2s+3) dA, dB = ค่าต่างของ log sine ที่มุมระยะเพิ่มขึ้น 1” ใช้ตัวเลขในทิศนิยมตำแหน่งที่ 6 A = มุมระยะที่อยู่ตรงข้ามด้านที่ต้องการหาความยาวด้าน B = มุมระยะที่อยู่ตรงข้ามด้านที่ทราบความยาวด้าน
29. การเล็งสกัด (Intersection) สถานี B และ D เป็นสถานีที่ค่าพิกัด และ ต้องการทราบค่าพิกัดสถานี C ข้อมูลรังวัด วัดมุมที่สถานี B คือ α วัดมุมที่สถานี D คือ β