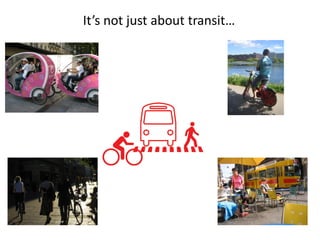
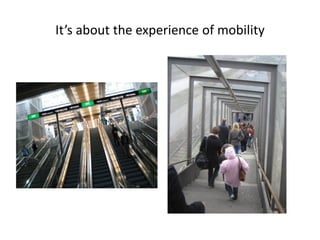
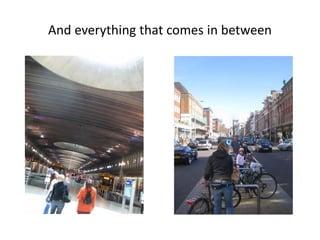
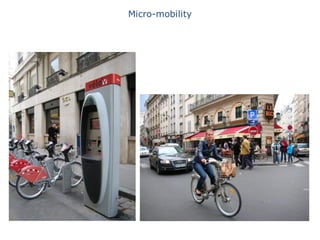
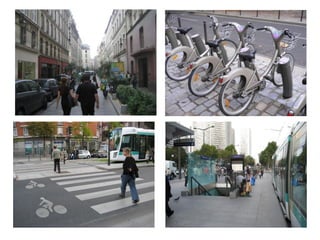
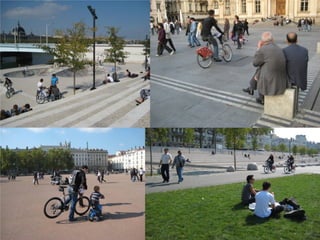
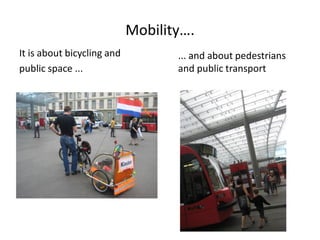
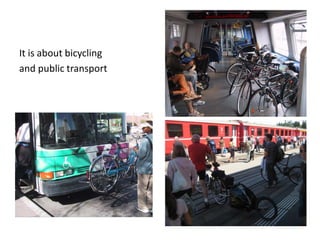
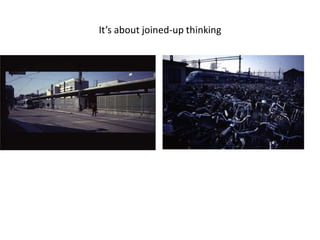
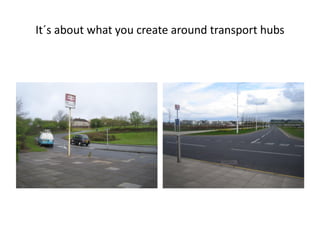
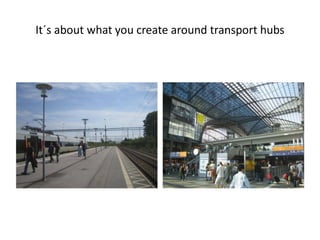
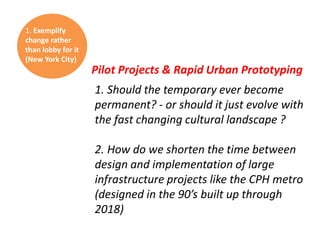
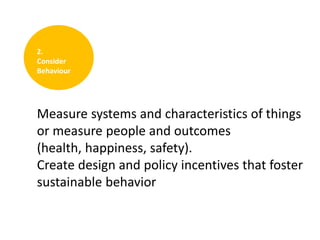
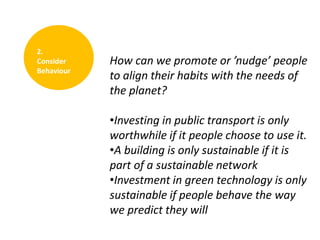
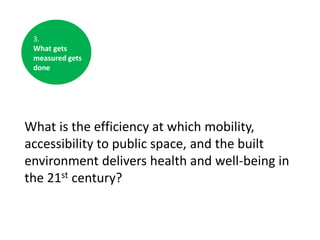
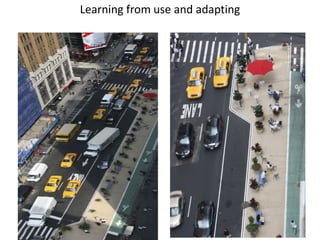
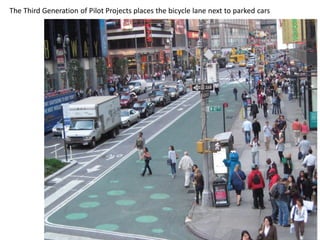
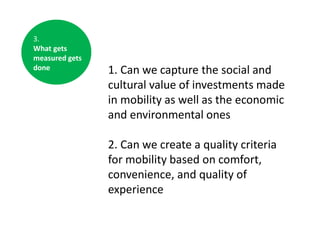
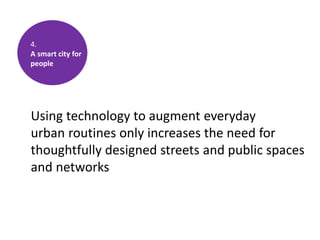
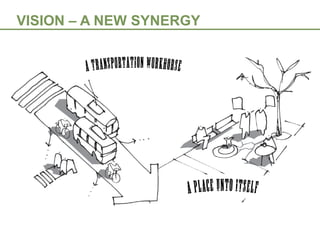
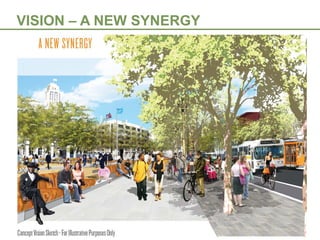
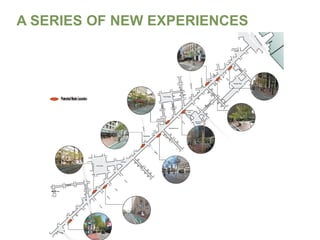
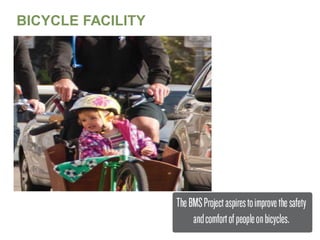
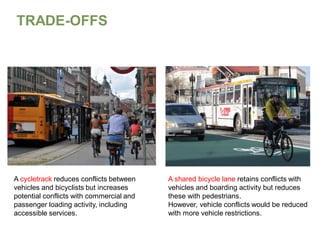
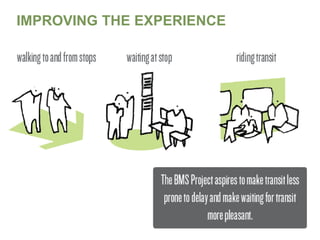
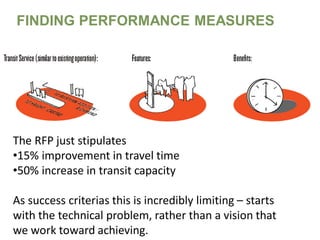
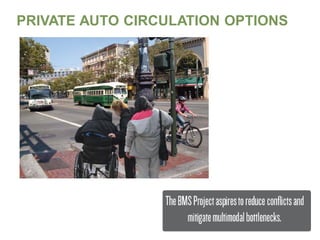
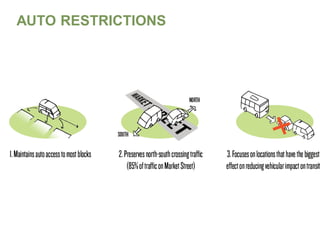
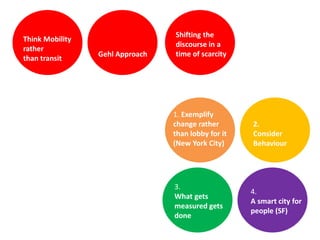
Changing the urban
design paradigm:
Mobility oriented planning
Allison Dutoit
Head of Gehl Studio, Gehl Architects
Architect; BFA, M. Arch
Think Mobility
rather
than transit

Gehl Approach

Shifting the
discourse in a
time of scarcity

1. Exemplify
change rather
than lobby for it
(New York City)

3.
What gets
measured gets
done

2.
Consider
Behaviour

4.
A smart city for
people (SF)
Think Mobility
rather
than transit
It’s not just about transit…
It’s about the experience of mobility
And everything that comes in between
Micro-mobility
Mobility….
It is about bicycling and
public space ...

... and about pedestrians
and public transport
It is about bicycling
and public transport
It’s about joined-up thinking
It´s about what you create around transport hubs
Joined-up thinking to make for better quality of life…
It’s about
It’s about
everyone!
everyone!

It’s about
everyone….
Shifting the
Shifting the discourse in
discourse in a
a time of scarcity
time of scarcity
It’s about sustainability?
….”location close to transit!”
Reduction of CO2 by
locating workplaces
close to transit
stations has 10 times
more effect
than insulating new
buildings from the
normal standard to a
higher level.

”The role of the cities in the climate strategy”
Byernes rolle i klimastrategien, Frederikshavn Kommune, Sønderborg
Kommune, Albertslund Kommune og COWI A/S 2009
Reduction of C02 by further
insulation of new buildings
0,08 ton/year/workplace
(From The Danish Building Code
standards to the level below a zero
energy house called “klasse 1”)

”The role of the cities in the climate strategy”
Byernes rolle i klimastrategien, Frederikshavn Kommune, Sønderborg
Kommune, Albertslund Kommune og COWI A/S 2009
Reduction of C02 by building close
to transit-stations =10 x larger effect
0,70 ton/year/workplace
(Moving the buildings with in 7-8

minutes walking distance)

”The role of the cities in the climate strategy”
Byernes rolle i klimastrategien, Frederikshavn Kommune, Sønderborg
Kommune, Albertslund Kommune og COWI A/S 2009
There is nothing so useless as doing efficiently
what should not be done at all
– Peter Drucker
Shifting the discourse
We need both simultaneously

Sustainability is about the
viatality of the planet
tomorrow:
A global issue

Livability is about the
lifestyle of people today:
A local issue
Good for You

Good for the Planet
Gehl Approach
Cultures are different…
Climates are different…
But the way People inhabit and use Space is universal
“Man is man’s greatest joy”
(Old Icelandic saying)
PEOPLE ARE NOT IN THE CENTER OF THE
CURRENT PLANNING PROCESS

All cities have

- Traffic departments

-- Data on traffic volumes and needs
-- Prognoses for future traffic volumes

Few cities have
- Departments for pedestrians and public life
- Statistics for the use of public spaces
- Strategies for development of city life culture
Joined-up thinking
Designing
objects

Making places
(creating
opportunities
for place to
flourish)
Two key indicators to help city leaders make wiser
decisions about the city for people
• We count how many are
walking – Movement

• We log what they are
doing when they are
staying in a space Stationary activities
Our work is about the interaction between FORM
(buildings and infrastructure) and LIFE
Planning for a Liveable City

Not only is new quality criteria required - but also a new planning process

life

space

buildings
5 challenges

3.
Process rather
than product

1. Exemplify
change rather
than lobby for it
(New York City)

3.
What gets
measured gets
done

2.
Consider
Behaviour

4.
A smart city for
people (SF)
1. Exemplfy change rather than lobby for it – Urban prototyping as a way to
ensure effective use of resources, time and money
2. Consider behavior - Measure systems and characteristics of things or
measure people and outcomes (health, happiness, safety). Create design and
policy incentives that foster sustainable behavior
4. What gets measured gets done - What is the efficiency in which mobility,
accessibility to public space and the built environment delivers health and
well-being in the 21st century?
5. A smart city for people - Using technology to augment everyday urban
routines only increases the need for thoughtfully designed streets and public
spaces
1. Exemplify
change rather
than lobby for it
(New York City)

Urban prototyping as a way to ensure effective use
of resources, time and money
NEW YORK – WORLD CLASS STREETS
Measuring what matters
Quantifying impressions

A CITY OF
SCAFFOLDING
Framing the situation politically

Gehl Architects · Urban Quality Consultants · Gl. Kongevej 1, 4.tv · 1610 Copenhagen V · Denmark · www.gehlarchitects.dk
Times Square
Seeing places with fresh eyes
Broadway scheme
Access is allowed but
through traffic is prohibited

And space is reclaimed as the
‘Pearls on a String’ for Broadway
Herald Square - before
Herald Square - after
Herald Square - before
Herald Square - after
DOT used in-house staff and resources to deliver the project.
Estimated cost $1.5 million
New opportunities to experience the City

Gehl Architects · Urban Quality Consultants · Gl. Kongevej 1, 4.tv · 1610 Copenhagen V · Denmark · www.gehlarchitects.dk
Invitations to soak in the atmosphere – Times Square

Gehl Architects · Urban Quality Consultants · Gl. Kongevej 1, 4.tv · 1610 Copenhagen V · Denmark · www.gehlarchitects.dk
40% decrease in pedestrian injuries in Times Square
84% more people are lingering (eg. Reading, eating)
42% of NYC residents shop in Times Square more often
The percentage of area employees satisfied with the Times
Square experience increased by 72% (from 43% to 74% of
those surveyed)
74% of New Yorkers say Times Square has improved
dramatically
11% increase in pedestrian numbers
35% decrease in pedestrian injuries throughout project
17% improvements in travel time
63% decrease in injuries
Source: Sustainable streets index – 2010 NYC DOT
1. Exemplify
change rather
than lobby for it
(New York City)

Pilot Projects & Rapid Urban Prototyping
1. Should the temporary ever become
permanent? - or should it just evolve with
the fast changing cultural landscape ?
2. How do we shorten the time between
design and implementation of large
infrastructure projects like the CPH metro
(designed in the 90’s built up through
2018)
2.
Consider
Behaviour

Measure systems and characteristics of things
or measure people and outcomes
(health, happiness, safety).
Create design and policy incentives that foster
sustainable behavior
By 2030, energy efficiency and behavior change will offset more
CO2 than all the new wind, solar, and other alternative energy
generation methods combined

World Energy Outlook 2009

IEA/OECD
Measuring Systems and Things OR measuring People
and Relations

Measuring building focuses on
the sustainability of building
construction….

And doesn’t engage enough in
capitalising on some of the
human behavioral savings .
Investing in Sustainable Infrastructure?
Dehli Metro Rail Corporation

1/5 of Projected Use

Projected 2.2 million passengers per day
- Actually 450,000

Ridership

Proposed
Actual

Regular metro riders
are being subsidized
$712 USD/year
Average Income in
India is $510
USD/year
Investing in Sustainable Infrastructure?
Metroselskabet

1/2 of Projected Use

Flintholm hub projected at 13,270 but
only 7,500

Ridership
7.3 billion write off
of value of project
Proposed
Actual

Ridership expected
to fall an additional
15-23%
12 billion kr.
Extension under
construction
Inviting a new user group…

…locals
A place more accessible for all

Gehl Architects · Urban Quality Consultants · Gl. Kongevej 1, 4.tv · 1610 Copenhagen V · Denmark · www.gehlarchitects.dk
Copenhagen Municipal Vision

Copenhagen has a vision
We will become the world’s most liveable
city: a sustainable city with urban space
inviting people to a unique and varied urban
life. We will become a metropolis for people.
Copenhagen Municipal Vision
The Portland Plan

Gehl Architects · Urban Quality Consultants · Gl. Kongevej 1, 4.tv · 1610 Copenhagen V · Denmark · www.gehlarchitects.dk
The Portland Plan

Gehl Architects · Urban Quality Consultants · Gl. Kongevej 1, 4.tv · 1610 Copenhagen V · Denmark · www.gehlarchitects.dk
The Portland Plan

Gehl Architects · Urban Quality Consultants · Gl. Kongevej 1, 4.tv · 1610 Copenhagen V · Denmark · www.gehlarchitects.dk
Copenhagen
Copenhagen’s Bicycle Account
Every second year from 1995

The Copenhagen Bicycle
Account 2013
Why do Danes cycle?
Is it because of the environment?

5%
state that it is
because of the
environment

Copenhagen Bicycle
Account 2010

Copenhageners cycling
save over 90.000 t
CO2 annually
A larger percentage bike for financial reasons ….

15%
state that it is
because it is cheap

Copenhagen Bicycle
Account 2010
Even more because cycling is part of a healthy lifestyle ...

17%
state that it is
because of the
exercise

Copenhagen Bicycle
Account 2010
But most people bike because it is the most convenient, fast, direct
and pleasurable way to move through the city!

63%
state that it is
because it is
convenient and fast
and most direct
and pleasurable?

Copenhagen Bicycle
Account 2010
People don’t change their behavior when you tell them to;

Copenhagen Modal Split

63% of those who bike do so out of convenience

People change when the context compels them to
Investment works

København and Amsterdam: Investment per. capita approx. 180
per year, share of trips +30%
Holland: Investment per. capita approx. 180 per year, share of
trips around. 30%
Capital Region: Investment per. capita 82 per year, share of trips
17%
2.
Consider
Behaviour

How can we promote or ’nudge’ people
to align their habits with the needs of
the planet?
•Investing in public transport is only
worthwhile if it people choose to use it.
•A building is only sustainable if it is
part of a sustainable network
•Investment in green technology is only
sustainable if people behave the way
we predict they will
3.
What gets
measured gets
done

What is the efficiency at which mobility,
accessibility to public space, and the built
environment delivers health and well-being in
the 21st century?
Learning from use and adapting
The Third Generation of Pilot Projects places the bicycle lane next to parked cars
Efficiently using
scarce public
resources
50% earned in 7 extra
years of productive life
20% saved on fewer
days of illness
30% on health care
savings
Safety in numbers…..

As the number of
cyclists in the city
increased
The number of
serious accidents
decreased
Safety in numbers…..
INCENTIVES, BARRIERS, SOCIAL NORMS

Refine

Measure

Test
3.
What gets
measured gets
done

1. Can we capture the social and
cultural value of investments made
in mobility as well as the economic
and environmental ones
2. Can we create a quality criteria
for mobility based on comfort,
convenience, and quality of
experience
4.
A smart city for
people

Using technology to augment everyday
urban routines only increases the need for
thoughtfully designed streets and public spaces
and networks
BETTER MARKET
STREET
APPROACH
VISION – A NEW SYNERGY
5 Thematic issues
1. Public Space
2. Street Life
3. Bicycle Facility
4. Public Transit
5. Private vehicle circulation
PUBLIC SPACE
PUBLIC SPACE

City Space

District Scale

Local Node
STREETLIFE
THE STREETLIFE ZONE
THE STREETLIFE ZONE CONNECTOR
THE STREETLIFE ZONE NODE
A SERIES OF NEW EXPERIENCES
BICYCLE FACILITY
BICYCLE FACILITY
TRADE-OFFS

A cycletrack reduces conflicts between
vehicles and bicyclists but increases
potential conflicts with commercial and
passenger loading activity, including
accessible services.

A shared bicycle lane retains conflicts with
vehicles and boarding activity but reduces
these with pedestrians.
However, vehicle conflicts would be reduced
with more vehicle restrictions.
PUBLIC TRANSIT
IMPROVING THE EXPERIENCE
FINDING PERFORMANCE MEASURES

The RFP just stipulates
•15% improvement in travel time
•50% increase in transit capacity
As success criterias this is incredibly limiting – starts
with the technical problem, rather than a vision that
we work toward achieving.
PRIVATE VEHICLE CIRCULATION
PRIVATE AUTO CIRCULATION OPTIONS
AUTO RESTRICTIONS
4.
A smart city for
people

1. How can we invite the people that
work, live, and visit places like Market
Street to meet, linger, collaborate and
share knowledge?
2. What types of physical infrastructure,
urban design and land uses will facilitate
spontaneous or planned interaction?
3. How can smart city technology
augment interaction, collaboration,
mobility,
Think Mobility
rather
than transit

Gehl Approach

Shifting the
discourse in a
time of scarcity

1. Exemplify
change rather
than lobby for it
(New York City)

3.
What gets
measured gets
done

2.
Consider
Behaviour

4.
A smart city for
people (SF)
the starting point is people

The starting point
is people
the starting point is people

The starting point
is people

Thank you.

1 allison dutoit

  • 1.
    Changing the urban designparadigm: Mobility oriented planning Allison Dutoit Head of Gehl Studio, Gehl Architects Architect; BFA, M. Arch
  • 2.
    Think Mobility rather than transit GehlApproach Shifting the discourse in a time of scarcity 1. Exemplify change rather than lobby for it (New York City) 3. What gets measured gets done 2. Consider Behaviour 4. A smart city for people (SF)
  • 3.
  • 4.
    It’s not justabout transit…
  • 5.
    It’s about theexperience of mobility
  • 6.
    And everything thatcomes in between
  • 7.
  • 10.
    Mobility…. It is aboutbicycling and public space ... ... and about pedestrians and public transport
  • 11.
    It is aboutbicycling and public transport
  • 12.
  • 14.
    It´s about whatyou create around transport hubs
  • 15.
    It´s about whatyou create around transport hubs
  • 16.
    Joined-up thinking tomake for better quality of life…
  • 17.
  • 18.
    Shifting the Shifting thediscourse in discourse in a a time of scarcity time of scarcity
  • 19.
  • 20.
    ….”location close totransit!” Reduction of CO2 by locating workplaces close to transit stations has 10 times more effect than insulating new buildings from the normal standard to a higher level. ”The role of the cities in the climate strategy” Byernes rolle i klimastrategien, Frederikshavn Kommune, Sønderborg Kommune, Albertslund Kommune og COWI A/S 2009
  • 21.
    Reduction of C02by further insulation of new buildings 0,08 ton/year/workplace (From The Danish Building Code standards to the level below a zero energy house called “klasse 1”) ”The role of the cities in the climate strategy” Byernes rolle i klimastrategien, Frederikshavn Kommune, Sønderborg Kommune, Albertslund Kommune og COWI A/S 2009
  • 22.
    Reduction of C02by building close to transit-stations =10 x larger effect 0,70 ton/year/workplace (Moving the buildings with in 7-8 minutes walking distance) ”The role of the cities in the climate strategy” Byernes rolle i klimastrategien, Frederikshavn Kommune, Sønderborg Kommune, Albertslund Kommune og COWI A/S 2009
  • 23.
    There is nothingso useless as doing efficiently what should not be done at all – Peter Drucker
  • 24.
  • 25.
    We need bothsimultaneously Sustainability is about the viatality of the planet tomorrow: A global issue Livability is about the lifestyle of people today: A local issue
  • 26.
    Good for You Goodfor the Planet
  • 27.
  • 28.
  • 29.
  • 30.
    But the wayPeople inhabit and use Space is universal
  • 31.
    “Man is man’sgreatest joy” (Old Icelandic saying)
  • 32.
    PEOPLE ARE NOTIN THE CENTER OF THE CURRENT PLANNING PROCESS All cities have - Traffic departments -- Data on traffic volumes and needs -- Prognoses for future traffic volumes Few cities have - Departments for pedestrians and public life - Statistics for the use of public spaces - Strategies for development of city life culture
  • 33.
  • 34.
    Two key indicatorsto help city leaders make wiser decisions about the city for people • We count how many are walking – Movement • We log what they are doing when they are staying in a space Stationary activities
  • 35.
    Our work isabout the interaction between FORM (buildings and infrastructure) and LIFE
  • 36.
    Planning for aLiveable City Not only is new quality criteria required - but also a new planning process life space buildings
  • 37.
    5 challenges 3. Process rather thanproduct 1. Exemplify change rather than lobby for it (New York City) 3. What gets measured gets done 2. Consider Behaviour 4. A smart city for people (SF)
  • 38.
    1. Exemplfy changerather than lobby for it – Urban prototyping as a way to ensure effective use of resources, time and money 2. Consider behavior - Measure systems and characteristics of things or measure people and outcomes (health, happiness, safety). Create design and policy incentives that foster sustainable behavior 4. What gets measured gets done - What is the efficiency in which mobility, accessibility to public space and the built environment delivers health and well-being in the 21st century? 5. A smart city for people - Using technology to augment everyday urban routines only increases the need for thoughtfully designed streets and public spaces
  • 39.
    1. Exemplify change rather thanlobby for it (New York City) Urban prototyping as a way to ensure effective use of resources, time and money
  • 40.
    NEW YORK –WORLD CLASS STREETS
  • 41.
  • 42.
  • 43.
    Framing the situationpolitically Gehl Architects · Urban Quality Consultants · Gl. Kongevej 1, 4.tv · 1610 Copenhagen V · Denmark · www.gehlarchitects.dk
  • 44.
  • 45.
  • 49.
    Broadway scheme Access isallowed but through traffic is prohibited And space is reclaimed as the ‘Pearls on a String’ for Broadway
  • 50.
  • 51.
  • 52.
  • 53.
  • 54.
    DOT used in-housestaff and resources to deliver the project. Estimated cost $1.5 million
  • 56.
    New opportunities toexperience the City Gehl Architects · Urban Quality Consultants · Gl. Kongevej 1, 4.tv · 1610 Copenhagen V · Denmark · www.gehlarchitects.dk
  • 57.
    Invitations to soakin the atmosphere – Times Square Gehl Architects · Urban Quality Consultants · Gl. Kongevej 1, 4.tv · 1610 Copenhagen V · Denmark · www.gehlarchitects.dk
  • 59.
    40% decrease inpedestrian injuries in Times Square 84% more people are lingering (eg. Reading, eating) 42% of NYC residents shop in Times Square more often The percentage of area employees satisfied with the Times Square experience increased by 72% (from 43% to 74% of those surveyed) 74% of New Yorkers say Times Square has improved dramatically
  • 60.
    11% increase inpedestrian numbers 35% decrease in pedestrian injuries throughout project 17% improvements in travel time 63% decrease in injuries
  • 61.
    Source: Sustainable streetsindex – 2010 NYC DOT
  • 62.
    1. Exemplify change rather thanlobby for it (New York City) Pilot Projects & Rapid Urban Prototyping 1. Should the temporary ever become permanent? - or should it just evolve with the fast changing cultural landscape ? 2. How do we shorten the time between design and implementation of large infrastructure projects like the CPH metro (designed in the 90’s built up through 2018)
  • 63.
    2. Consider Behaviour Measure systems andcharacteristics of things or measure people and outcomes (health, happiness, safety). Create design and policy incentives that foster sustainable behavior
  • 64.
    By 2030, energyefficiency and behavior change will offset more CO2 than all the new wind, solar, and other alternative energy generation methods combined World Energy Outlook 2009 IEA/OECD
  • 65.
    Measuring Systems andThings OR measuring People and Relations Measuring building focuses on the sustainability of building construction…. And doesn’t engage enough in capitalising on some of the human behavioral savings .
  • 66.
    Investing in SustainableInfrastructure? Dehli Metro Rail Corporation 1/5 of Projected Use Projected 2.2 million passengers per day - Actually 450,000 Ridership Proposed Actual Regular metro riders are being subsidized $712 USD/year Average Income in India is $510 USD/year
  • 67.
    Investing in SustainableInfrastructure? Metroselskabet 1/2 of Projected Use Flintholm hub projected at 13,270 but only 7,500 Ridership 7.3 billion write off of value of project Proposed Actual Ridership expected to fall an additional 15-23% 12 billion kr. Extension under construction
  • 68.
    Inviting a newuser group… …locals
  • 69.
    A place moreaccessible for all Gehl Architects · Urban Quality Consultants · Gl. Kongevej 1, 4.tv · 1610 Copenhagen V · Denmark · www.gehlarchitects.dk
  • 71.
    Copenhagen Municipal Vision Copenhagenhas a vision We will become the world’s most liveable city: a sustainable city with urban space inviting people to a unique and varied urban life. We will become a metropolis for people.
  • 72.
  • 73.
  • 74.
  • 75.
    The Portland Plan GehlArchitects · Urban Quality Consultants · Gl. Kongevej 1, 4.tv · 1610 Copenhagen V · Denmark · www.gehlarchitects.dk
  • 76.
    The Portland Plan GehlArchitects · Urban Quality Consultants · Gl. Kongevej 1, 4.tv · 1610 Copenhagen V · Denmark · www.gehlarchitects.dk
  • 77.
    The Portland Plan GehlArchitects · Urban Quality Consultants · Gl. Kongevej 1, 4.tv · 1610 Copenhagen V · Denmark · www.gehlarchitects.dk
  • 78.
  • 79.
    Copenhagen’s Bicycle Account Everysecond year from 1995 The Copenhagen Bicycle Account 2013
  • 80.
    Why do Danescycle? Is it because of the environment? 5% state that it is because of the environment Copenhagen Bicycle Account 2010 Copenhageners cycling save over 90.000 t CO2 annually
  • 81.
    A larger percentagebike for financial reasons …. 15% state that it is because it is cheap Copenhagen Bicycle Account 2010
  • 82.
    Even more becausecycling is part of a healthy lifestyle ... 17% state that it is because of the exercise Copenhagen Bicycle Account 2010
  • 83.
    But most peoplebike because it is the most convenient, fast, direct and pleasurable way to move through the city! 63% state that it is because it is convenient and fast and most direct and pleasurable? Copenhagen Bicycle Account 2010
  • 84.
    People don’t changetheir behavior when you tell them to; Copenhagen Modal Split 63% of those who bike do so out of convenience People change when the context compels them to
  • 85.
    Investment works København andAmsterdam: Investment per. capita approx. 180 per year, share of trips +30% Holland: Investment per. capita approx. 180 per year, share of trips around. 30% Capital Region: Investment per. capita 82 per year, share of trips 17%
  • 87.
    2. Consider Behaviour How can wepromote or ’nudge’ people to align their habits with the needs of the planet? •Investing in public transport is only worthwhile if it people choose to use it. •A building is only sustainable if it is part of a sustainable network •Investment in green technology is only sustainable if people behave the way we predict they will
  • 88.
    3. What gets measured gets done Whatis the efficiency at which mobility, accessibility to public space, and the built environment delivers health and well-being in the 21st century?
  • 89.
    Learning from useand adapting
  • 90.
    The Third Generationof Pilot Projects places the bicycle lane next to parked cars
  • 92.
    Efficiently using scarce public resources 50%earned in 7 extra years of productive life 20% saved on fewer days of illness 30% on health care savings
  • 95.
    Safety in numbers….. Asthe number of cyclists in the city increased The number of serious accidents decreased
  • 96.
  • 97.
    INCENTIVES, BARRIERS, SOCIALNORMS Refine Measure Test
  • 98.
    3. What gets measured gets done 1.Can we capture the social and cultural value of investments made in mobility as well as the economic and environmental ones 2. Can we create a quality criteria for mobility based on comfort, convenience, and quality of experience
  • 99.
    4. A smart cityfor people Using technology to augment everyday urban routines only increases the need for thoughtfully designed streets and public spaces and networks
  • 103.
  • 104.
  • 105.
    VISION – ANEW SYNERGY
  • 106.
    VISION – ANEW SYNERGY
  • 107.
    5 Thematic issues 1.Public Space 2. Street Life 3. Bicycle Facility 4. Public Transit 5. Private vehicle circulation
  • 108.
  • 109.
  • 110.
  • 111.
  • 112.
  • 113.
  • 114.
  • 115.
    A SERIES OFNEW EXPERIENCES
  • 116.
  • 117.
  • 118.
    TRADE-OFFS A cycletrack reducesconflicts between vehicles and bicyclists but increases potential conflicts with commercial and passenger loading activity, including accessible services. A shared bicycle lane retains conflicts with vehicles and boarding activity but reduces these with pedestrians. However, vehicle conflicts would be reduced with more vehicle restrictions.
  • 119.
  • 120.
  • 121.
    FINDING PERFORMANCE MEASURES TheRFP just stipulates •15% improvement in travel time •50% increase in transit capacity As success criterias this is incredibly limiting – starts with the technical problem, rather than a vision that we work toward achieving.
  • 122.
  • 123.
  • 124.
  • 125.
    4. A smart cityfor people 1. How can we invite the people that work, live, and visit places like Market Street to meet, linger, collaborate and share knowledge? 2. What types of physical infrastructure, urban design and land uses will facilitate spontaneous or planned interaction? 3. How can smart city technology augment interaction, collaboration, mobility,
  • 126.
    Think Mobility rather than transit GehlApproach Shifting the discourse in a time of scarcity 1. Exemplify change rather than lobby for it (New York City) 3. What gets measured gets done 2. Consider Behaviour 4. A smart city for people (SF)
  • 127.
    the starting pointis people The starting point is people
  • 128.
    the starting pointis people The starting point is people Thank you.