Download as PDF, PPTX
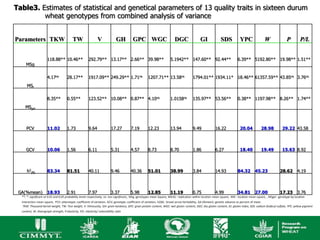
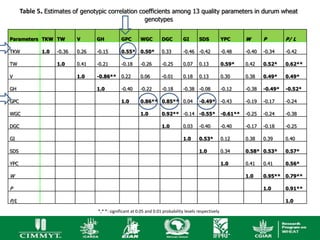
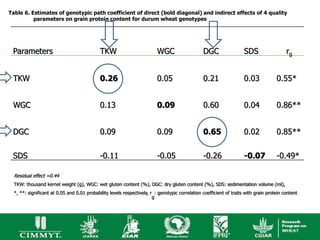


The document assesses the quality parameters of Ethiopian durum wheat genotypes for pasta production, focusing on their genetic performance and quality traits. The study evaluates 16 genotypes under specific growing conditions, analyzing statistical differences in traits such as protein content, gluten strength, and yellow pigment content. Results are significant for improving durum wheat quality, which is essential for meeting food security and agro-industrial demands in Ethiopia.


![11.[1 13]adoption of modern agricultural production technologies by farm hous...](https://cdn.slidesharecdn.com/ss_thumbnails/11-1-13adoptionofmodernagriculturalproductiontechnologiesbyfarmhouseholdsinghana-120512235429-phpapp02-thumbnail.jpg?width=640&height=640&fit=bounds)


