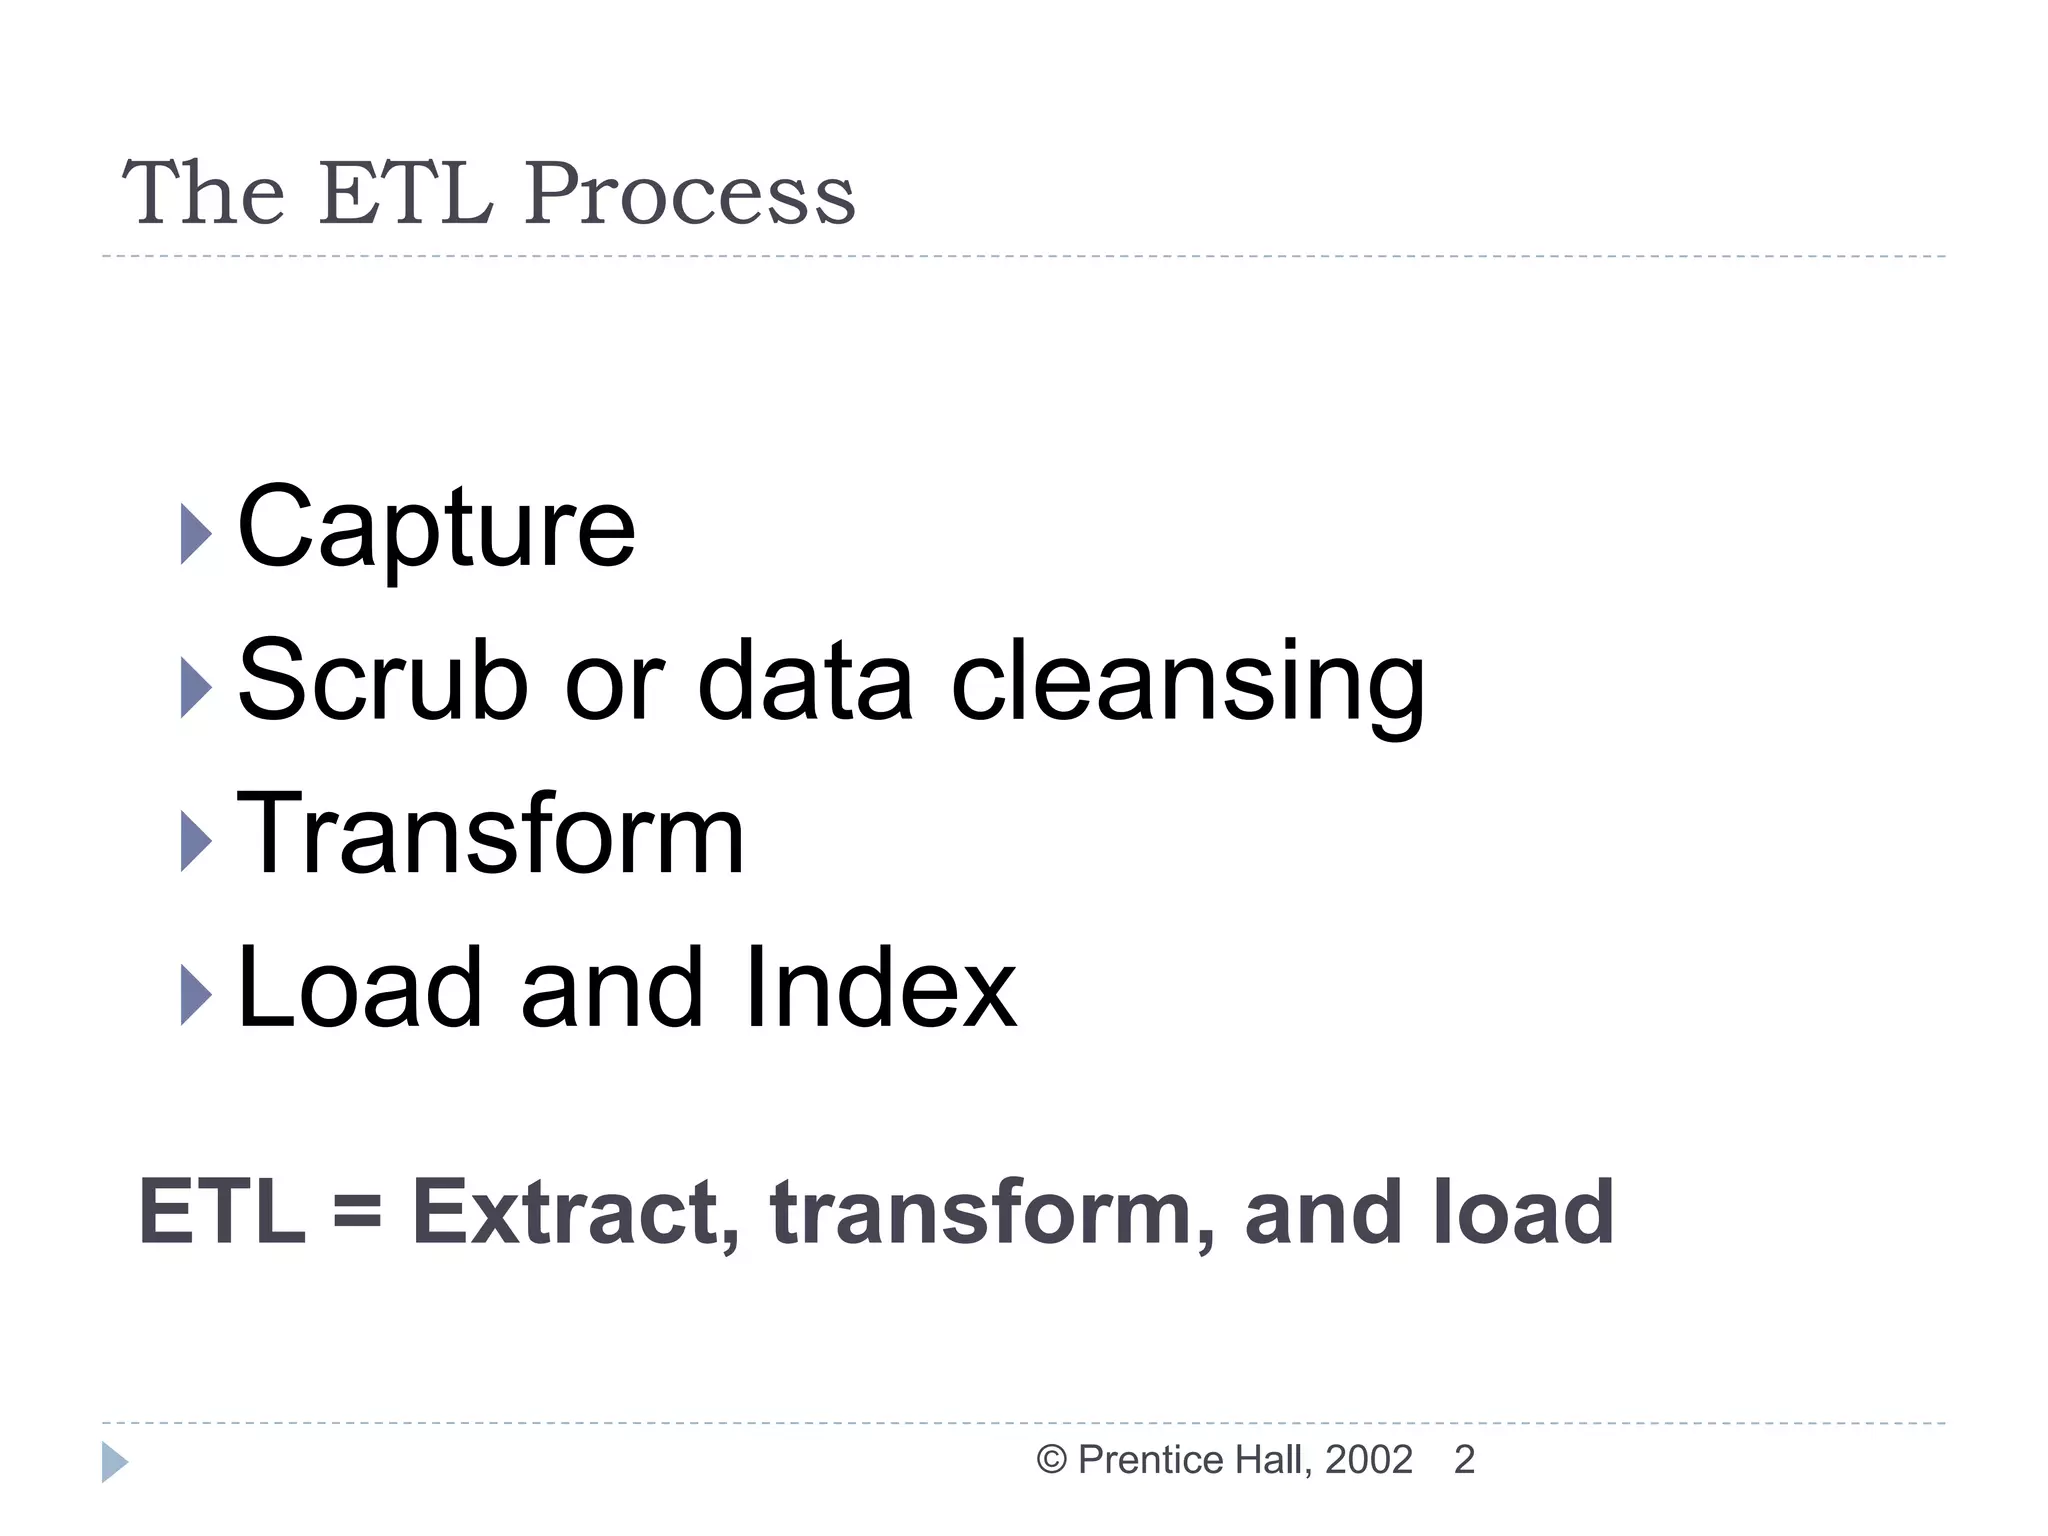
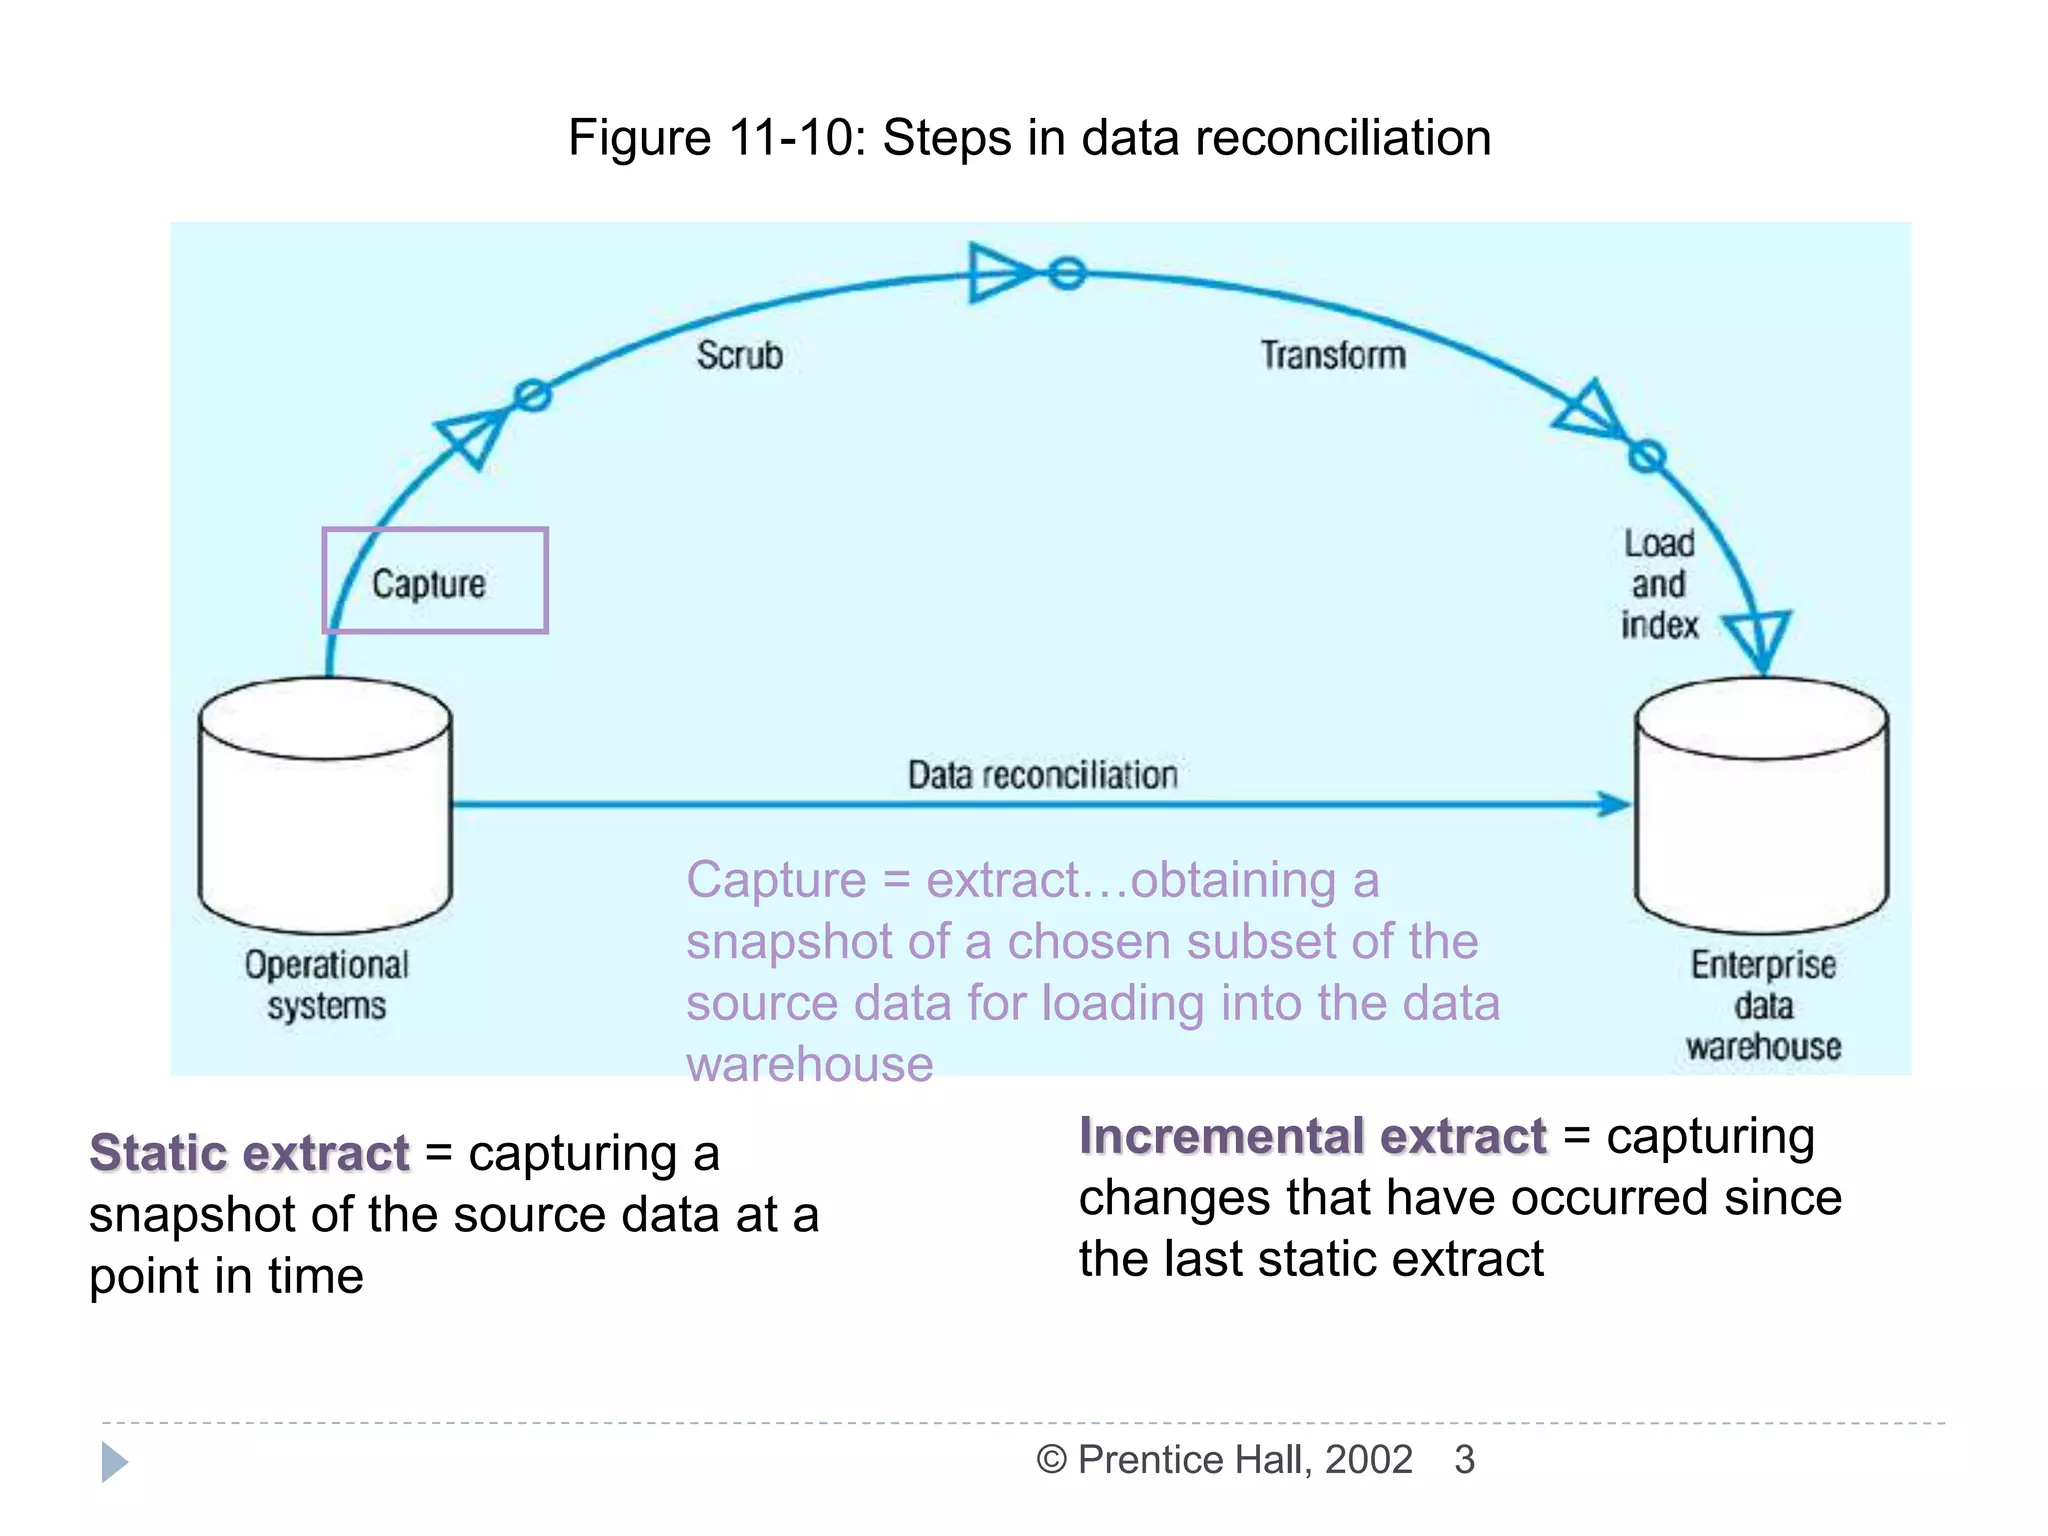
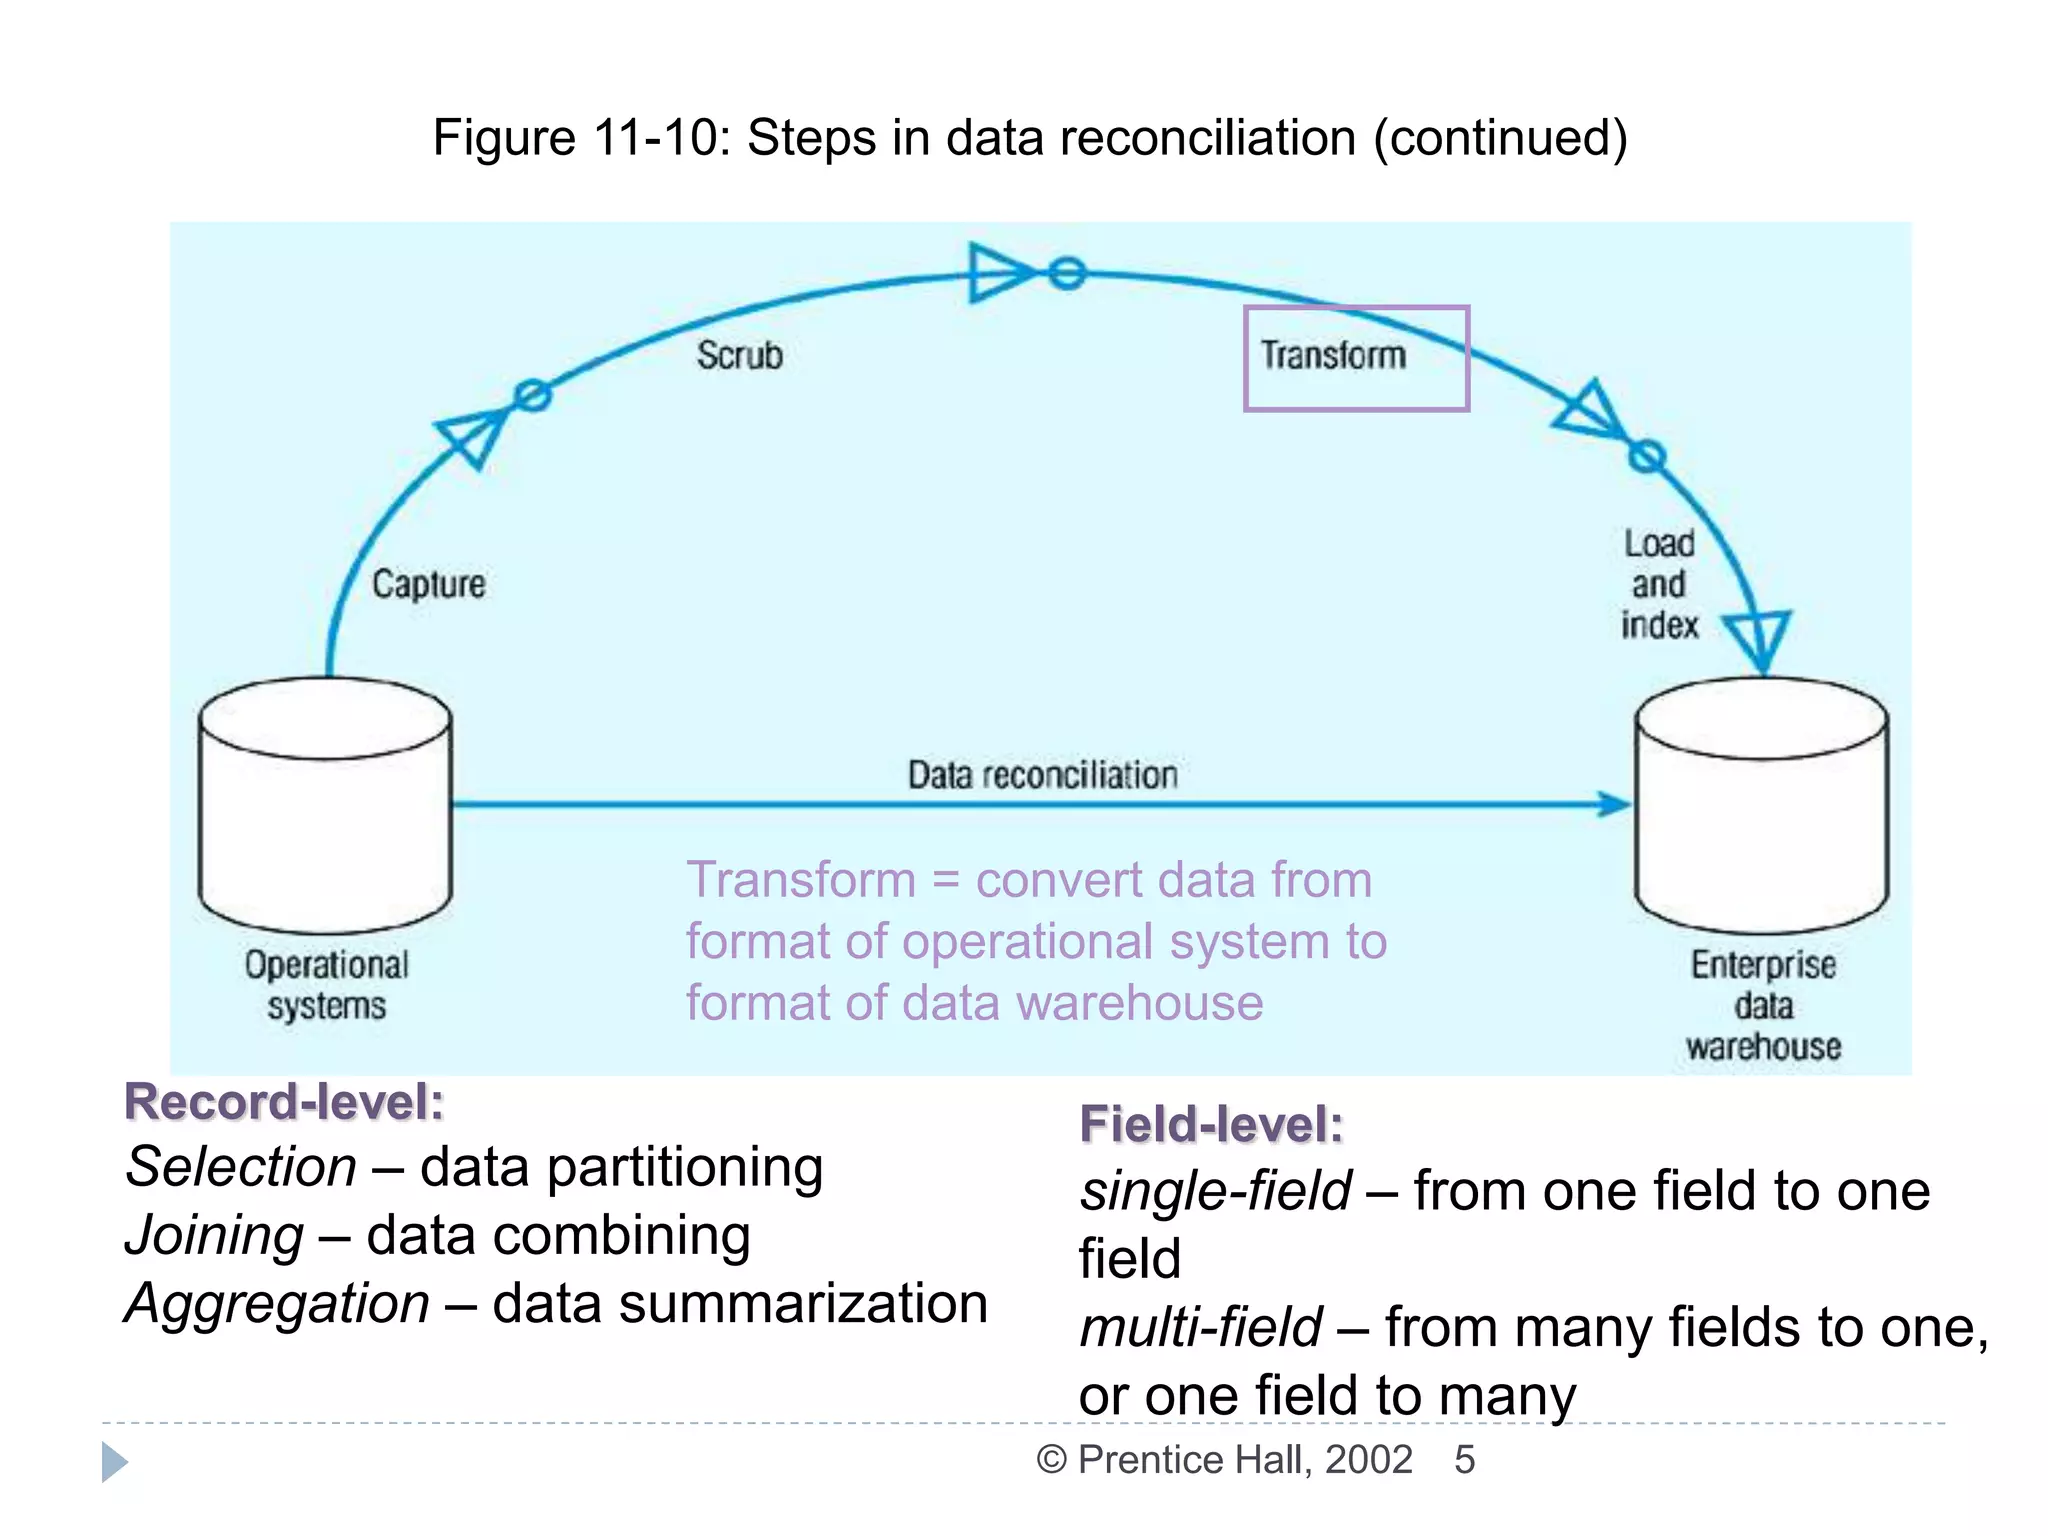
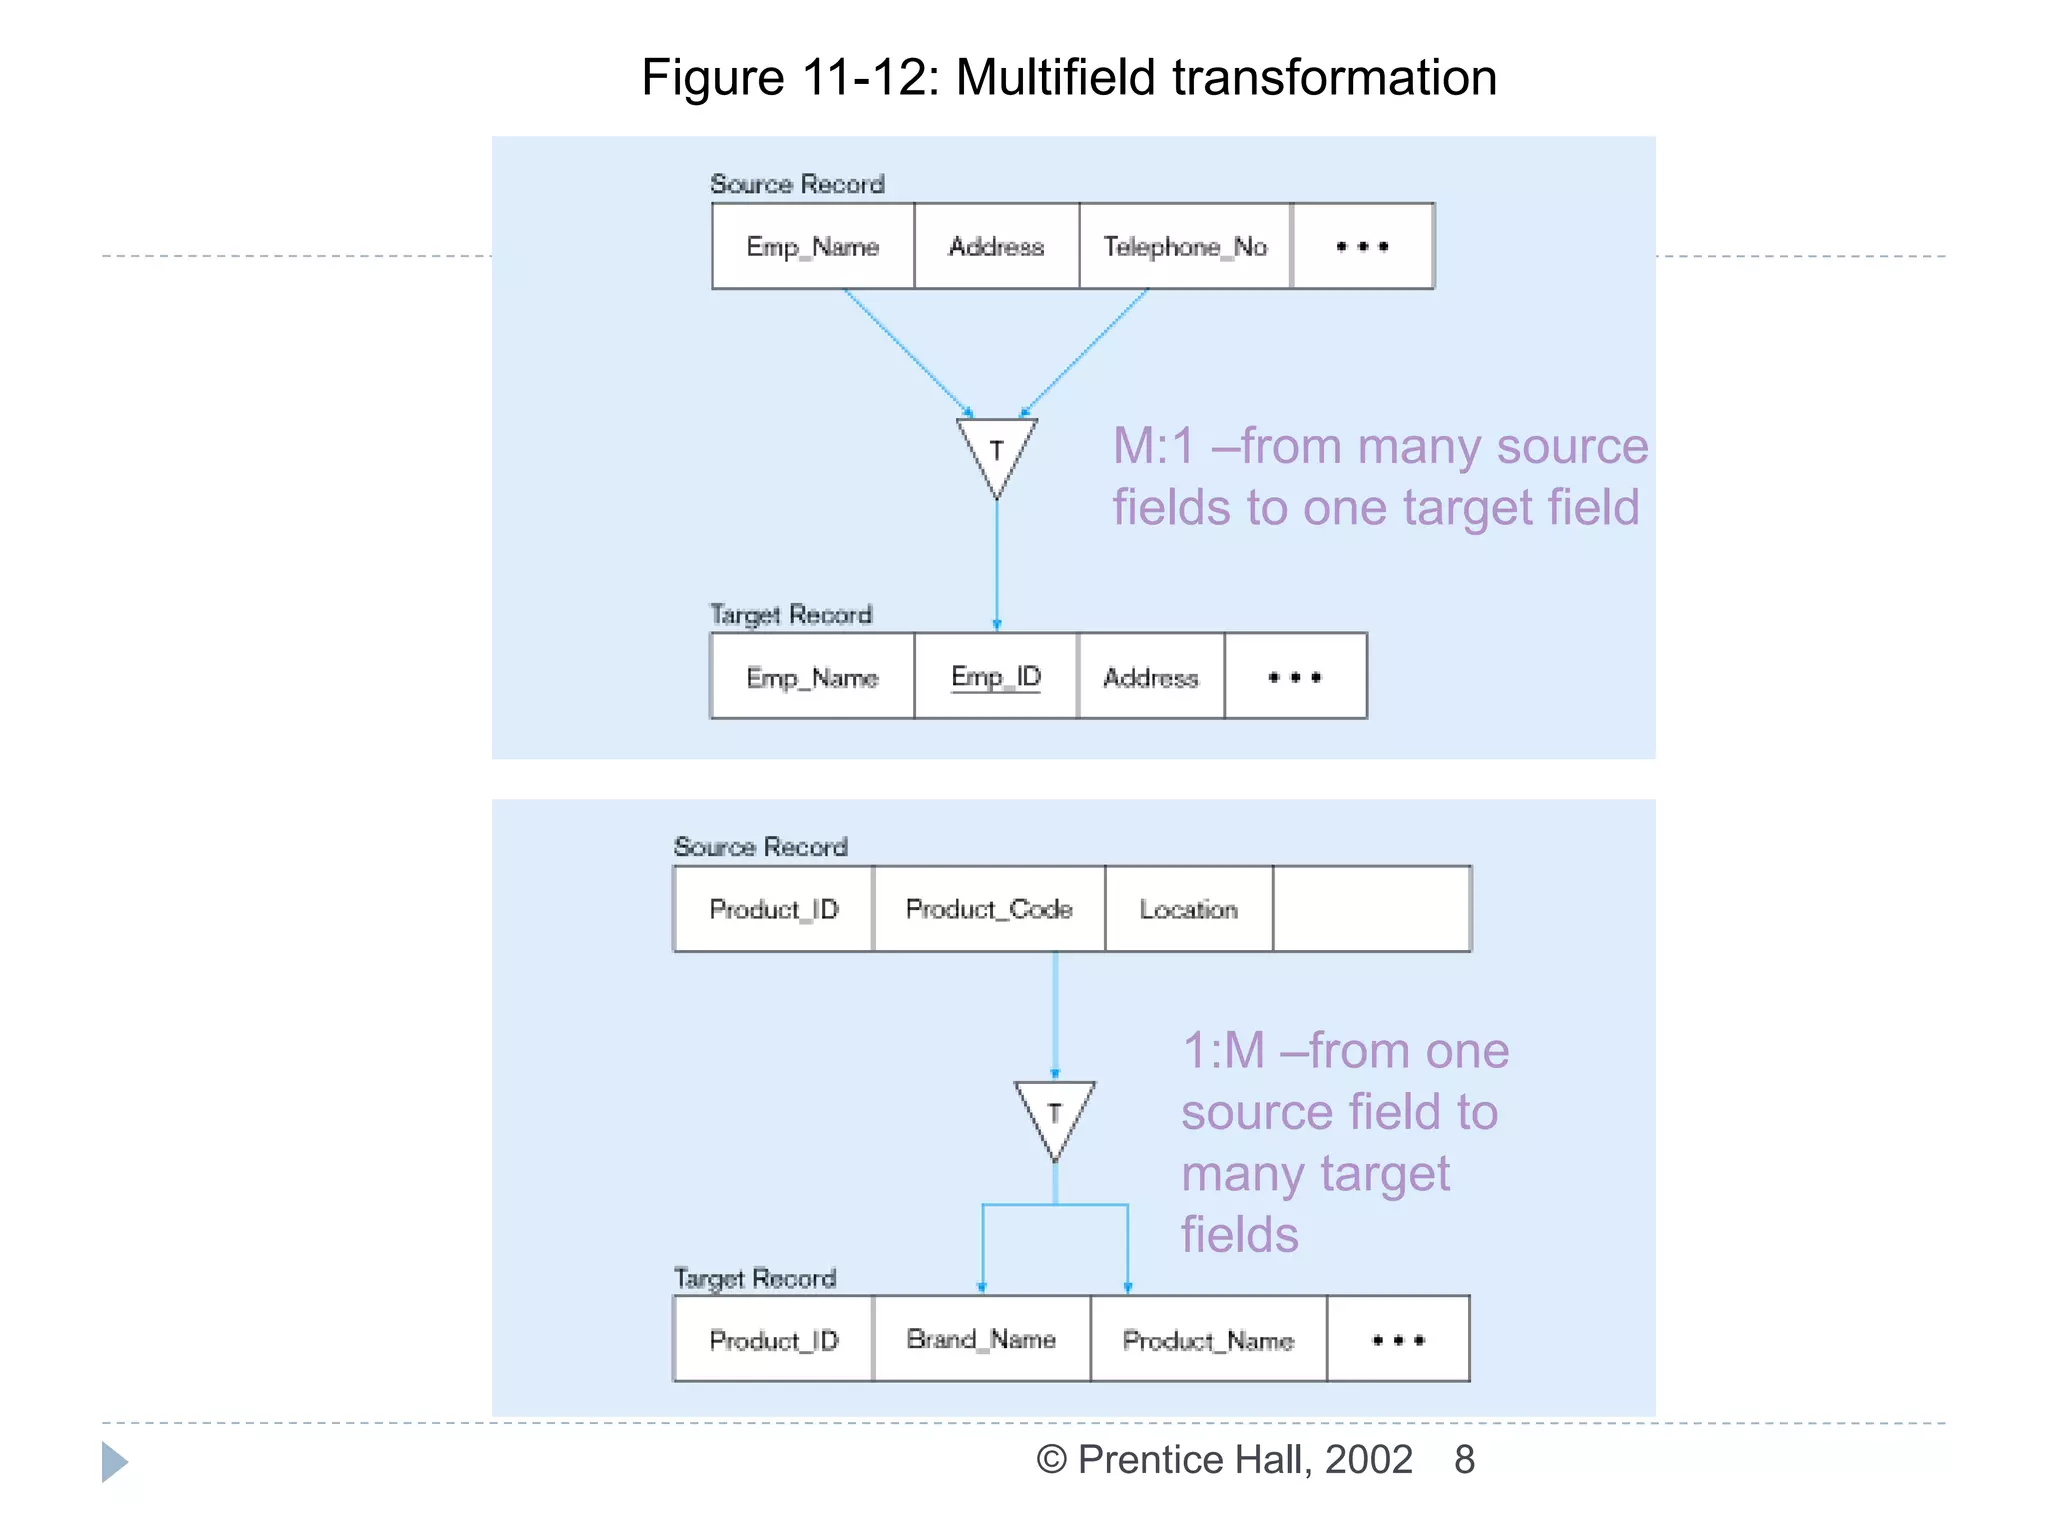
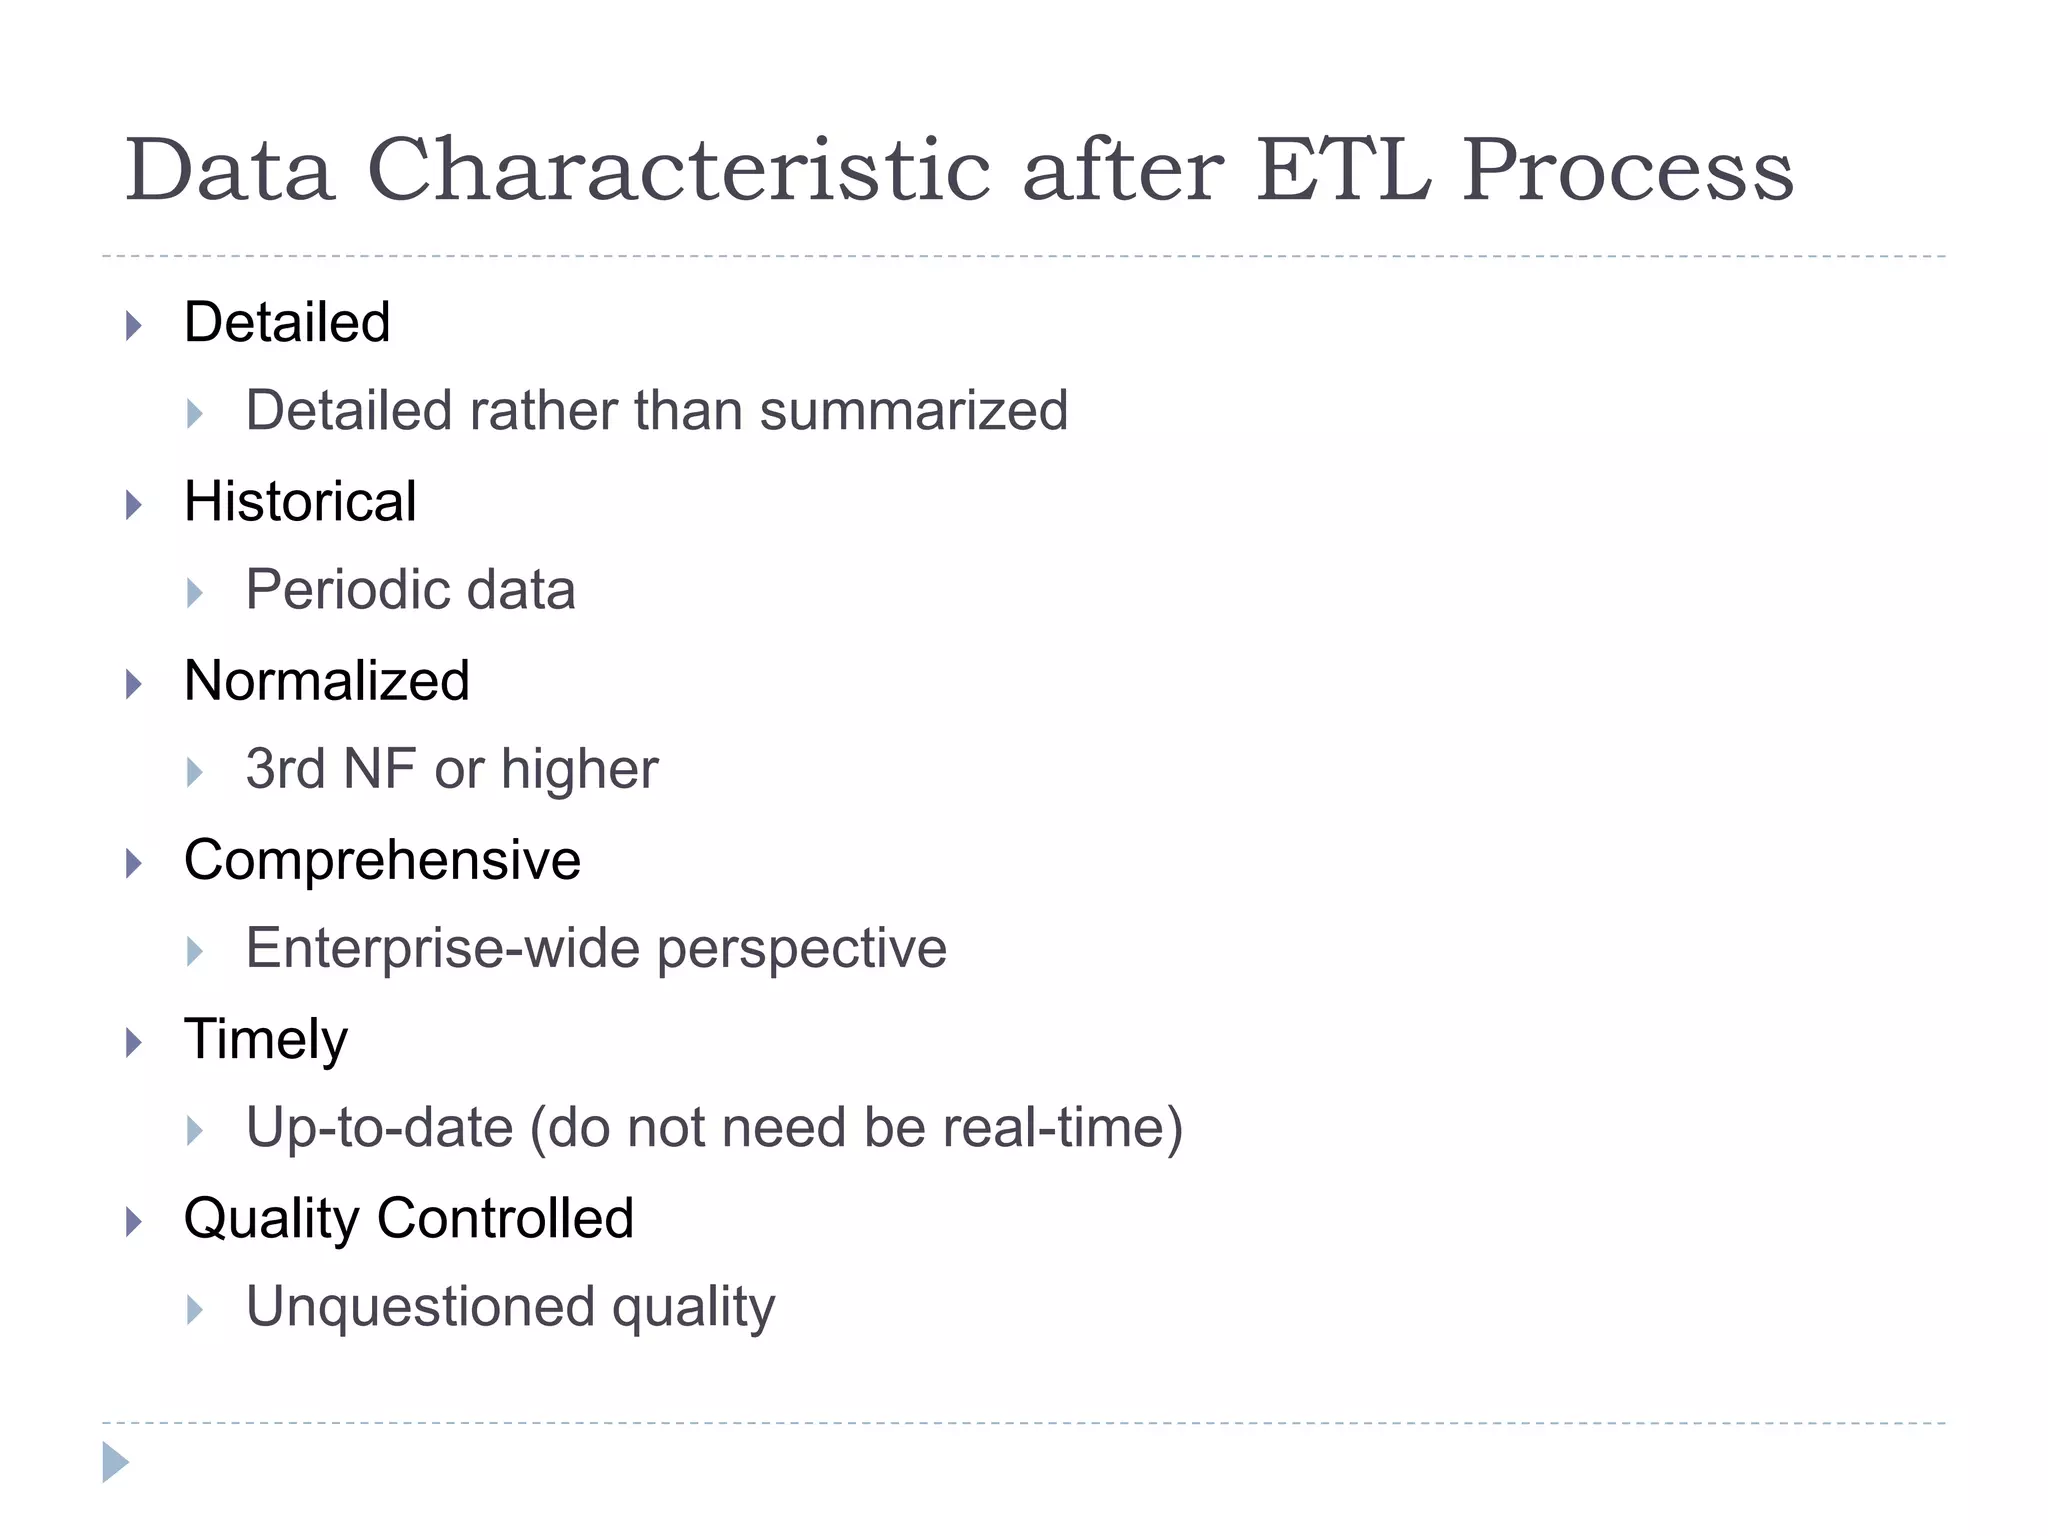
The ETL (Extract-Transform-Load)
Process
Data Warehousing and Data Mining
2
© Prentice Hall, 2002
The ETL Process
 Capture
 Scrub or data cleansing
 Transform
 Load and Index
ETL = Extract, transform, and load
3
© Prentice Hall, 2002
Figure 11-10: Steps in data reconciliation
Static extract = capturing a
snapshot of the source data at a
point in time
Incremental extract = capturing
changes that have occurred since
the last static extract
Capture = extract…obtaining a
snapshot of a chosen subset of the
source data for loading into the data
warehouse
4
© Prentice Hall, 2002
Figure 11-10: Steps in data reconciliation (continued)
Scrub = cleanse…uses pattern
recognition and AI techniques to
upgrade data quality
Fixing errors: misspellings,
erroneous dates, incorrect field
usage, mismatched addresses,
missing data, duplicate data,
inconsistencies
Also: decoding, reformatting, time
stamping, conversion, key
generation, merging, error
detection/logging, locating missing
data
5
© Prentice Hall, 2002
Figure 11-10: Steps in data reconciliation (continued)
Transform = convert data from
format of operational system to
format of data warehouse
Record-level:
Selection – data partitioning
Joining – data combining
Aggregation – data summarization
Field-level:
single-field – from one field to one
field
multi-field – from many fields to one,
or one field to many
6
© Prentice Hall, 2002
Figure 11-10: Steps in data reconciliation (continued)
Load/Index= place transformed data
into the warehouse and create
indexes
Refresh mode: bulk rewriting of
target data at periodic intervals
Update mode: only changes in
source data are written to data
warehouse
7
© Prentice Hall, 2002
Figure 11-11: Single-field transformation
In general – some transformation
function translates data from old form to
new form
Algorithmic transformation uses
a formula or logical expression
Table lookup
– another
approach
8
© Prentice Hall, 2002
Figure 11-12: Multifield transformation
M:1 –from many source
fields to one target field
1:M –from one
source field to
many target
fields
Data Characteristic after ETL Process
 Detailed
 Detailed rather than summarized
 Historical
 Periodic data
 Normalized
 3rd NF or higher
 Comprehensive
 Enterprise-wide perspective
 Timely
 Up-to-date (do not need be real-time)
 Quality Controlled
 Unquestioned quality
10
© Prentice Hall, 2002
Derived Data
 Objectives
 Ease of use for decision support applications
 Fast response to predefined user queries
 Customized data for particular target audiences
 Ad-hoc query support
 Data mining capabilities
  Characteristics
 Detailed (mostly periodic) data
 Aggregate (for summary)
 Distributed (to departmental servers)
Most common data model = star schema
(also called “dimensional model”)
11
© Prentice Hall, 2002
Figure 11-13: Components of a star schema
Fact tables contain
factual or quantitative
data
Dimension tables
contain descriptions
about the subjects of the
business
1:N relationship
between dimension
tables and fact
tables
Excellent for ad-hoc queries,
but bad for online transaction processing
Dimension tables
are denormalized to
maximize
performance
12
© Prentice Hall, 2002
Figure 11-14: Star schema example
Fact table provides statistics for sales
broken down by product, period and
store dimensions
13
© Prentice Hall, 2002
Figure 11-15: Star schema with sample data

06_The ETL (Extract-Transform-Load) Process.ppt

  • 1.
  • 2.
    2 © Prentice Hall,2002 The ETL Process  Capture  Scrub or data cleansing  Transform  Load and Index ETL = Extract, transform, and load
  • 3.
    3 © Prentice Hall,2002 Figure 11-10: Steps in data reconciliation Static extract = capturing a snapshot of the source data at a point in time Incremental extract = capturing changes that have occurred since the last static extract Capture = extract…obtaining a snapshot of a chosen subset of the source data for loading into the data warehouse
  • 4.
    4 © Prentice Hall,2002 Figure 11-10: Steps in data reconciliation (continued) Scrub = cleanse…uses pattern recognition and AI techniques to upgrade data quality Fixing errors: misspellings, erroneous dates, incorrect field usage, mismatched addresses, missing data, duplicate data, inconsistencies Also: decoding, reformatting, time stamping, conversion, key generation, merging, error detection/logging, locating missing data
  • 5.
    5 © Prentice Hall,2002 Figure 11-10: Steps in data reconciliation (continued) Transform = convert data from format of operational system to format of data warehouse Record-level: Selection – data partitioning Joining – data combining Aggregation – data summarization Field-level: single-field – from one field to one field multi-field – from many fields to one, or one field to many
  • 6.
    6 © Prentice Hall,2002 Figure 11-10: Steps in data reconciliation (continued) Load/Index= place transformed data into the warehouse and create indexes Refresh mode: bulk rewriting of target data at periodic intervals Update mode: only changes in source data are written to data warehouse
  • 7.
    7 © Prentice Hall,2002 Figure 11-11: Single-field transformation In general – some transformation function translates data from old form to new form Algorithmic transformation uses a formula or logical expression Table lookup – another approach
  • 8.
    8 © Prentice Hall,2002 Figure 11-12: Multifield transformation M:1 –from many source fields to one target field 1:M –from one source field to many target fields
  • 9.
    Data Characteristic afterETL Process  Detailed  Detailed rather than summarized  Historical  Periodic data  Normalized  3rd NF or higher  Comprehensive  Enterprise-wide perspective  Timely  Up-to-date (do not need be real-time)  Quality Controlled  Unquestioned quality
  • 10.
    10 © Prentice Hall,2002 Derived Data  Objectives  Ease of use for decision support applications  Fast response to predefined user queries  Customized data for particular target audiences  Ad-hoc query support  Data mining capabilities   Characteristics  Detailed (mostly periodic) data  Aggregate (for summary)  Distributed (to departmental servers) Most common data model = star schema (also called “dimensional model”)
  • 11.
    11 © Prentice Hall,2002 Figure 11-13: Components of a star schema Fact tables contain factual or quantitative data Dimension tables contain descriptions about the subjects of the business 1:N relationship between dimension tables and fact tables Excellent for ad-hoc queries, but bad for online transaction processing Dimension tables are denormalized to maximize performance
  • 12.
    12 © Prentice Hall,2002 Figure 11-14: Star schema example Fact table provides statistics for sales broken down by product, period and store dimensions
  • 13.
    13 © Prentice Hall,2002 Figure 11-15: Star schema with sample data