1. The document describes methods developed to assess brown rot resistance in peach fruits, including an orchard spray-based method and a laboratory drop-based method.
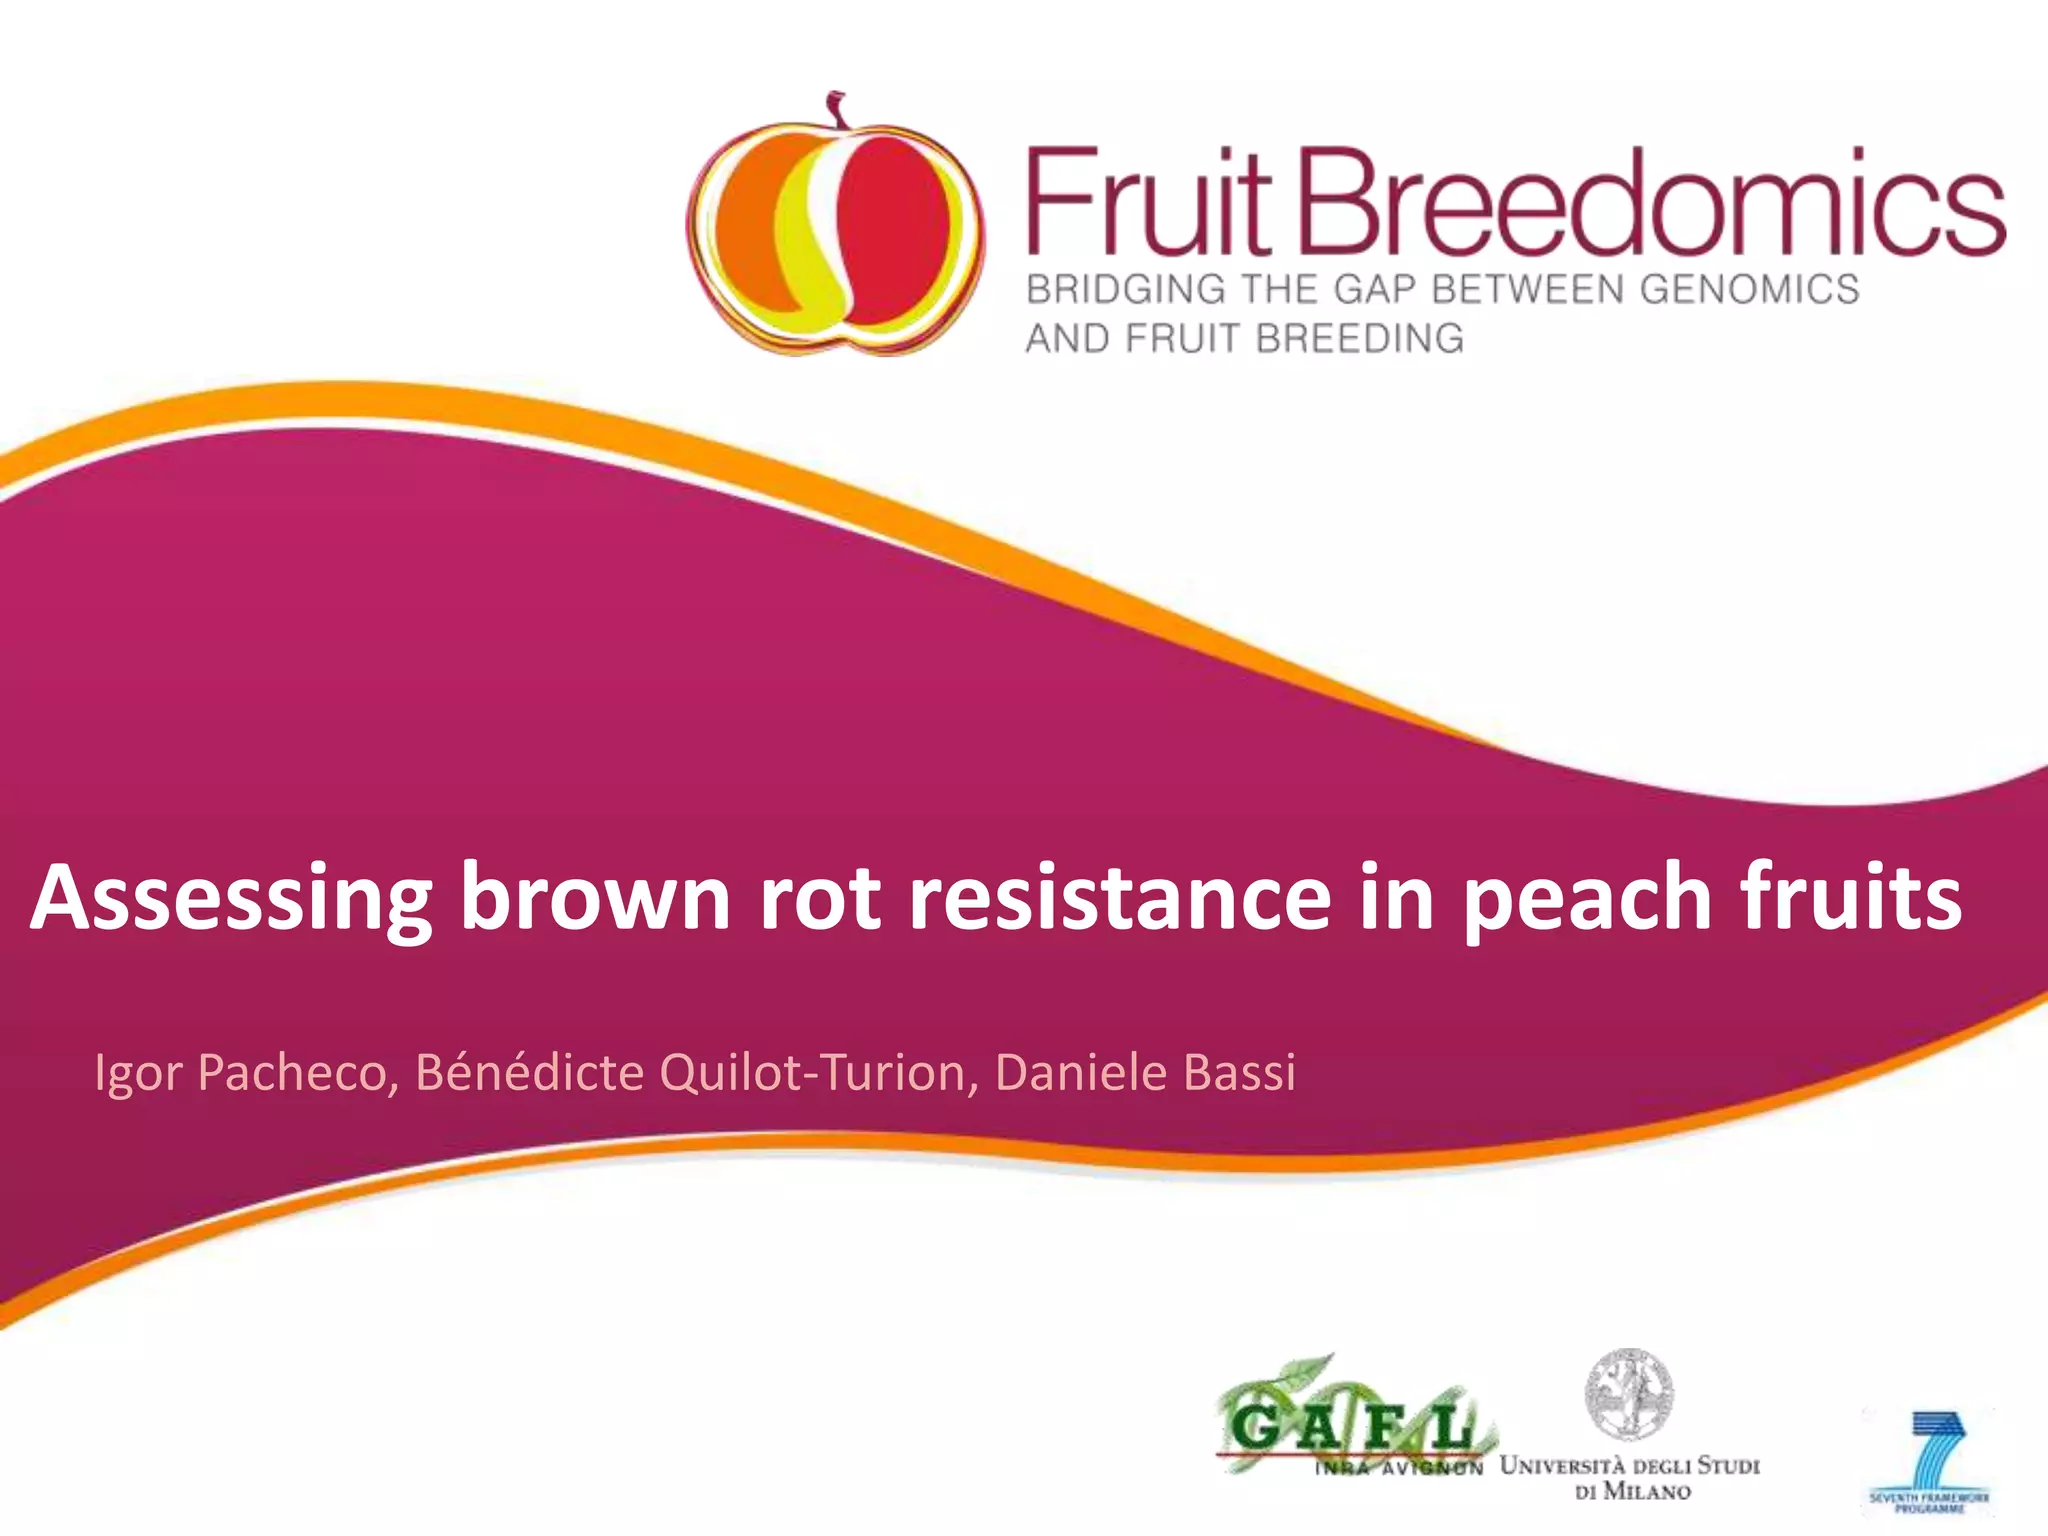
2. Phenotypic data on infection probability and rot progression was collected from multiple populations over two years using these methods. Sub-traits associated with resistance like cuticular conductance, stomatal density, and fruit size effects were also analyzed.
3. The results provide insights on factors influencing infection probability and rot progression to inform breeding for improved brown rot resistance by combining favorable sub-traits.
![YOUR LOGO
Paper-protected fruit clusters
+3fruit clusters containing 3-6
fruits each
Fruit cluster inoculation
of Monilinia laxa
(105 spores/ml until runoff)
incubation time
(e.g. 7 days in dry
environment; 3 days
in moist environment)
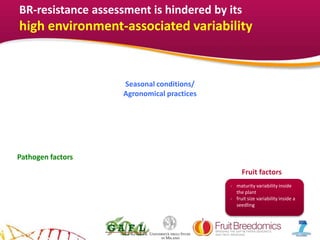
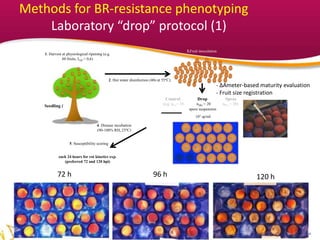
Methods for BR-resistance phenotyping
Orchard spray test
Register number of infected and
healthy fruits
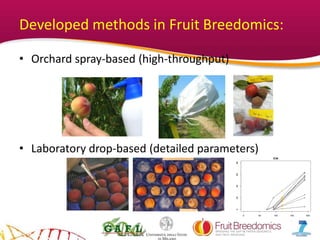
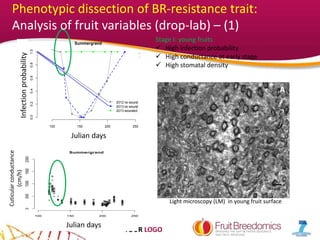
Infection probability - Drop 2014 (lab)
Infection probability
Numberofgenotypes
0.0 0.2 0.4 0.6 0.8 1.0
01020304050
Infection probability - Spray 2014 (orchard)
Infection probability
Numberofgenotypes
0.0 0.2 0.4 0.6 0.8 1.0
010203040
• BC2 (Zephir x [(Summergrand x P.davidiana) x Summergrand]; 98 to
118 individuals in 2013 and 2014. INRA-Av
• Bolinha-self. Around 90 individuals in 2013 and 2014. INRA-Av
• Contender x Elegant Lady F2. 120 individuals in 2012 and 2013. UMIL](https://image.slidesharecdn.com/06pacheco-150817073459-lva1-app6892/85/06-pacheco-4-320.jpg)
![YOUR LOGO
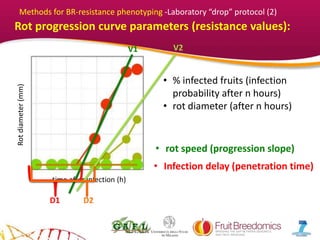
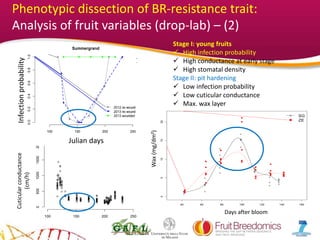
Phenotyped material (Drop-lab)
• BC2 (Zephir x [(Summergrand x P.davidiana) x Summergrand]; 98 to 118 individuals
in 2013 and 2014.
• Bolero x OroA. 80-120 individuals in 2012 and 2014.
• Contender x Elegant Lady. 50 individuals in 2013-2014
Infection minimal lead time
(hour)
Numberofgenotypes
50 100 150 200
0510152025
Infection maximal lead time
(hour)
Numberofgenotypes
50 100 150 200
05101520
Maximal speed of progress
of infection diameter
(mm/h)
Numberofgenotypes
0.0 0.5 1.0 1.5 2.0 2.5 3.0
05101520253035
Infection diameter at 120 hours after drop deposit
(mm/h)
Numberofgenotypes
0 10 20 30 40 50 60 70
0510152025
0.0 0.2 0.4 0.6 0.8 1.0
0.00.20.40.60.81.0
probaSpray13
probaSpray14
C206
C208
C212
C213
C216
C221
C226
C227
C231
C232
C234 C235
C247
E1
E10
E14
E17
E18
E19
E20
E21
E22
E25
E26
E31
E33
E34
E35
E36
E37E38
E43
E44
E45
E46
E6
E8
F101
F102F104 F105 F107
F109
F110
F111
F114
F117 F118
F120
F121
F123
F127
F128
F129
F143F146
F147
F149
F152
F153F160
F162
F163
F82
F83
F94
F95
F96
F97
F98H153
H157
H162
H163
H165
H167
H179
H182
H186
H189
H191
H192 H193
H194
H195
H196
H197
H218
H226
11 génotypes avec proba Spray = 0 les 2 années
aov 0.00848 corr 0.28 pval 0.00848
0.0 0.2 0.4 0.6 0.8
0.00.20.40.60.8
probaDrop13
probaDrop14
C199
C202
C208
C212C213
C216
C224
C227
C231
C232
C235
C238
C243
E1
E10
E12
E14 E17 E18
E19
E20E21
E23
E25
E26
E30
E31
E33
E34
E36
E37E38
E41
E43
E44
E45
E46
E49 E5
E6
E8
E9F100F102
F104
F105
F106
F107
F109
F110
F111
F114F115
F117
F118F126
F128
F129
F135
F143 F146
F147
F149
F151
F152
F153
F160
F162
F163
F168
F82
F83
F94
F95
F96
F97
F98
H153
H158
H160
H163
H167
H168
H171
H174
H175
H179
H182
H184
H186
H187
H189
H190
H192
H193
H194
H195
H197
H199
H207
H218
H221H224
14 génotypes avec proba Drop = 0 les 2 années
aov 0.00111 corr 0.32 pval 0.00111aov 0.00111 corr 0.32 pval 0.00111
r2 = 0,28 p = 0,0084
2013
2014
2013
2014
r2 = 0,32 p = 0,0011
Spray - orchard Drop - Lab](https://image.slidesharecdn.com/06pacheco-150817073459-lva1-app6892/85/06-pacheco-7-320.jpg)
![YOUR LOGO
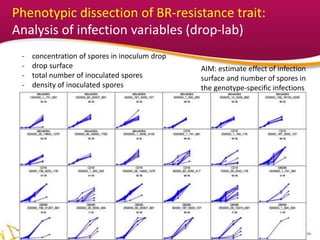
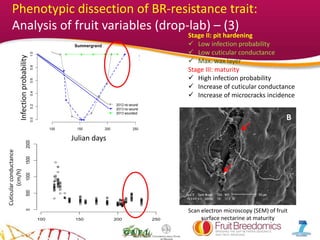
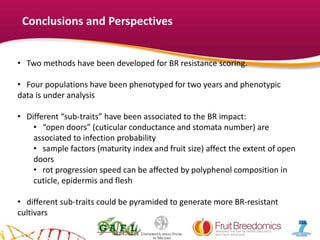
• Fungal inhibition proportional to compound concentration
• Inhibitor effect (in function of concentration): FA > PCA > CA
• Related with rot progression speed??
*
*
*7
9
11
13
15
17
19
21
Colonydiameter(mm)
eau stérile
1% éthanol
CA
PCA
FA
0,1 0,5 1 2
Concentration (mM)
72 hours after inoculation
Caffeic acid [CA]
p-coumaric acid [PCA]
Ferulic acid [AF]
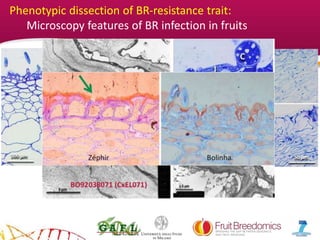
Phenotypic dissection of BR-resistance trait:
Antifungal activity of polyphenolic compounds](https://image.slidesharecdn.com/06pacheco-150817073459-lva1-app6892/85/06-pacheco-15-320.jpg)


![Polymer [ बहुलक ] Chemistry Notes PDF - Irfanullah Mehar - JJ Sir Chemistry.pdf](https://cdn.slidesharecdn.com/ss_thumbnails/polymerchemistrynotespdf-irfanullahmehar-jjsirchemistry-260210172118-3f9b37f7-thumbnail.jpg?width=640&height=640&fit=bounds)


