Download to read offline
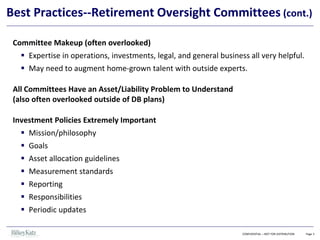
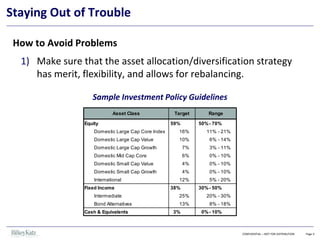
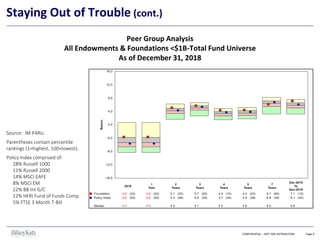
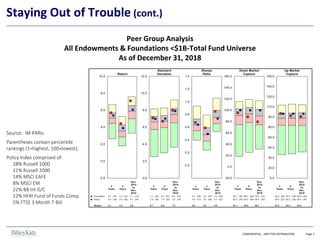

The document summarizes best practices for retirement oversight committees. It discusses committee makeup, importance of investment policies, asset/liability management, manager selection, cost monitoring, and future trends like the growth of defined contribution plans and challenges providing guaranteed income. Sample investment policy guidelines and peer group investment returns are also presented.


