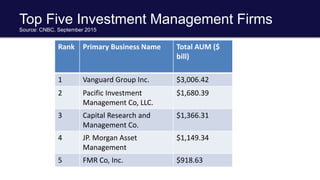
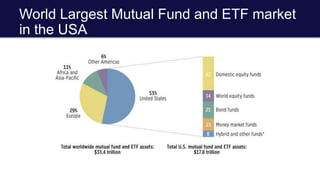
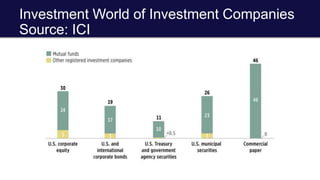
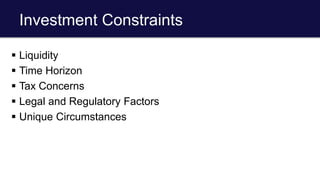
UConn Foundation
Investment Management
December 2015
Introduction
 Asset management is the service of professionally
investing money
 The largest segment of the asset management in the United States is
made up of registered investment companies.
 These companies managed $18.2 trillion in assets at year-end 2014,
largely on behalf of more than 90 million U.S. retail investors.
 The industry has experienced strong growth over the past quarter
century from asset appreciation and strong demand from households
due to rising household wealth, evolution of employer-based
retirement systems, and endowed assets, etc.
Top Five Investment Management Firms
Source: CNBC, September 2015
Rank Primary Business Name Total AUM ($
bill)
1 Vanguard Group Inc. $3,006.42
2 Pacific Investment
Management Co, LLC.
$1,680.39
3 Capital Research and
Management Co.
$1,366.31
4 JP. Morgan Asset
Management
$1,149.34
5 FMR Co, Inc. $918.63
World Largest Mutual Fund and ETF market
in the USA
Investment World of Investment Companies
Source: ICI
Who are the Investors?
Institutional Investors
 Pension Funds
 Defined-Benefit Plans
 Defined-Contribution Plans
 Hybrid and other Plans
 Foundations and Endowments
 Foundations
 Endowments
 The Insurance Industry
 Life Insurance Companies
 Non-Life Insurance Companies
 Banks and other Institutional Investors
Portfolio Management as a Process
 Portfolio management is an integrated set of steps undertaken in a consistent
manner to create and maintain appropriate combination of investment assets.
 Planning Step
 Investor’s Objectives and Constraints
 Investment Policy Statement (IPS)
 Forming Capital Market Expectations
 Creating Strategic Asset Allocation
 Execution Step
 Portfolio Construction and Revision
 Portfolio Optimization
 Tactical Asset Allocation
 The Feedback Step
 Monitoring and Rebalancing
 Performance Evaluation
Investment Objectives
 Risk Objective largely determines return objective
 How to measure risk?
 Absolute vs Relative
 Downside Risk: Value at Risk (VaR)
 What is the investor’s willingness to take risk? Institutional vs. Individual
 Investor’s ability to take risk?
 Return Objectives
 How is Return Measured? Total/Nominal/Real
 Stated Return Desire
 Required Return
Investment Constraints
 Liquidity
 Time Horizon
 Tax Concerns
 Legal and Regulatory Factors
 Unique Circumstances
Defined-Benefit (DB Plan)
 Plan sponsor is obligated in terms of the benefits to plan participants.
 Promise made by a plan sponsor generates a future financial liability or
“pension liability”.
 Return Objective
 To achieve returns that adequately fund pension liabilities
 Overhang of trillion dollars liabilities
 Risk:
 DB plans payout of the pension assets, which are invested in the
market.
 Market Risk
 Longevity Risk
 Liquidity Risk
 Funding status – under-funded/over-funded
 Overall low risk tolerance
Defined-Contribution (DC Plan)
 Plan sponsor is obligated in terms of contribution to
pension fund rather than benefits to plan participants.
 Promise for DC Plan is for the current stage – there is no future financial
liability.
 DC Plan sponsor bears the legal risk of investing
 DC plans are portable
Foundations
 Usually grant making institutions funded by gifts and investment
assets – usually created by single donor to fund philanthropic
goals.
 Investment portfolio provides the dominant source of revenue
 Purchasing power of its corpus is either maintained or not.
 US tax laws essentially mandate minimum level of annual
spending.
 Foundations can vary widely in their investment goals and time
horizon.
 Foundations, generally, don’t fundraise or reach out to donors.
 Risk & Return Objectives:
 Foundations can have higher risk tolerance
 Most Foundations want to preserve corpus and target returns accordingly
Endowments
 Long-term funds (inter-generational) generally owned by
non-profit institutions like universities, hospitals, museums
etc.
 Preserve purchasing power of the principal gift and to use
fraction of returns as spending for designated cause.
 Risk & Return Objectives:
 Return objective is to provide significant, stable, and sustainable flow of
funds to support designated programs.
 Risk is related to spending policy; Averaging rules dampen short term
volatility while striving for long term target returns.
 Risk tolerance depends on the endowment’s role in operating budget.
16
$Billions
1 Harvard 30.4
2 Yale 19.3
3 Stanford 17.0
4 Princeton 17.0
5 MIT 10.1
6 Columbia 7.7
7 Northwestern 7.1
8 Pennsylvania 6.8
9 Chicago 6.6
10 Notre Dame 6.3
Private Universities Ranked by June 30, 2012 Endowment Market Value
Fy12 Endowment Spending as a % of the
Market Value
Harvard
Dartmouth
Chicago
Yale
Johns Hopkins
Rice
Duke
Penn
MIT
Northwestern
USC
Princeton
Stanford
Vanderbilt
Emory
Wash U
Brown
5.5%
5.4%
5.2%
5.2%
5.1%
4.9%
4.9%
4.9%
4.9%
4.8%
4.6%
4.4%
4.4%
4.4%
4.4%
4.3%
4.3%
Risk Management as Process
• Risk management is a process involving:
– Identifying Risk factors
– Quantification of exposure to risk
– Map various risks in to risk estimation calculation
– Identify overall risk exposure
– Continuous measurement of exposure
– Adjustment to exposure according to agreed risk exposure limits
– Alteration based on new information
Portfolio Risk Universe
Systematic Risk: Influences large number of assets, difficult to diversify
Unsystematic risk: Influences small number of assets, manageable
Credit and Default Risk: Associated with Bonds and Stocks
Geo-political Risk: Related to policies and internal situation of a region or country
Foreign Exchange Risk: due to financial policies of various countries
Interest Rate Risk: Related to Fed policy
Market Risk: Related to market volatility
Headline Risk: Avoid Bad Publicity
Asset Class
Traditional Alternative
Stocks Hedge Funds
Bonds Private Equity
REITS Private Real Estate
Commodities Natural Resources
Asset Class Characteristics
Asset
Class/Strategy
Risk Characteristics
Public Equity Market beta/high Volatility High return/Growth
Private Equity Illiquid/high Volatility Higher return/Growth
Real Estate (REITS) Market beta/high Volatility High
return/Growth/Inflation
Protection
Real Estate (Private) Illiquid/regional/Volatile High return/Inflation
protection
Bonds Low Volatility Low return/Risk minimizing
TIPS Low Volatility Low return/Inflation
protection
Natural Resources/Real
Assets
Illiquid High Return/Inflation
protection
Portfolio Construction: Risk Reward Trade-off
 Rational portfolio choices based on the efficient risk (Modern Portfolio
Theory).
 Capital Markets Expectations
 Asset class and strategy diversification
 Use of quantitative methods in portfolio management
 Risk budgeting
20-years Asset-Class Returns
7-Year Asset Class Real Return Forecasts
24
Endowment Management
Investment Strategy Implementation
• Manager searches
• Manager evaluation
• Investment Portfolio Monitoring
• Portfolio risk management
• Performance measurement
• Performance reporting
• Performance and attribution analyses
• Capital markets monitoring
• Other
Investment Risk Management
360 degree risk management
Risk minimization is one of the three objectives
Investment decisions are based on better risk adjusted returns and
downside risk protection.
Investment portfolio is diversified across asset classes, markets, and
strategies to mitigate risk.
Manager selection is based on stringent quantitative and qualitative due-
diligence.
Risk reporting is part of the culture
Types of Risks
• Market Risk
• Manager Performance Risk
• Counter-party Risk
• Manager Business Risk
• Concentration Risk
• Style drift Risk
• Fraud Risk
Endowment Investment Return Goal
Return – Inflation – Spending – Admin fee > 0
- 2.5% - 4.25% - 2% > 0
?
UCONN Foundation
Managed Assets
Fiscal Year Net Return
2007 16.76%
2008 -5.55%
2009 -19.87%
2010 9.04%
2011 15.47%
2012 0.67%
2013 8.52%
2014 12.93%
2015 2.04%
FYTD 2016 2.95%
UCONN Foundation
Policy Benchmark Composition
Asset Benchmark Weight
Global Equities MSCI ACWI 31.5%
Private Capital PE Median TW 14%
Long Short Equities HFRI Equity Hedge Index 11.5%
Global Macro HFRI Macro Index 4%
Event Driven HFRI Event Driven Index 2%
Real Estate Weighted Public/Private Index 6%
TIPS TIPS 5%
Natural Resources Weighted Public/Private Index 16%
Investment Grade Barclay Aggregate 1%
Relative Value HFRI Relative Value Index 9%
PBM Composition
ML HY Master II MSCI ACWI
PE Median TW HFRI Equity Hedge Index
HFRI Macro Index HFRI Event Driven Index
Weighted Public/Private Index Weighted Public/Private Index
Barclay Aggregate HFRI Relative Value Index
The Policy Benchmark mirrors the target
portfolio allocation.
Indexes were chosen by consultants at
Wilshire Associates and approved by IC.
Liquidity
0.00%
5.00%
10.00%
15.00%
20.00%
25.00%
30.00%
35.00%
Public Equity Marketable
Alternatives
Private Equity Real Assets Fixed Income Cash
Liquidity Profile
Super Liquid (<2 Months) Liquid (2 to 6 Months) Illiquid
• The portfolio has a meaningful allocation to locked-up
investments, to capture an illiquidity premium.
• A large portion of the portfolio is super liquid and the majority
of these assets can be liquidated in under three days.
Q & A

Investment Management.pptx

  • 1.
  • 2.
    Introduction  Asset managementis the service of professionally investing money  The largest segment of the asset management in the United States is made up of registered investment companies.  These companies managed $18.2 trillion in assets at year-end 2014, largely on behalf of more than 90 million U.S. retail investors.  The industry has experienced strong growth over the past quarter century from asset appreciation and strong demand from households due to rising household wealth, evolution of employer-based retirement systems, and endowed assets, etc.
  • 3.
    Top Five InvestmentManagement Firms Source: CNBC, September 2015 Rank Primary Business Name Total AUM ($ bill) 1 Vanguard Group Inc. $3,006.42 2 Pacific Investment Management Co, LLC. $1,680.39 3 Capital Research and Management Co. $1,366.31 4 JP. Morgan Asset Management $1,149.34 5 FMR Co, Inc. $918.63
  • 4.
    World Largest MutualFund and ETF market in the USA
  • 5.
    Investment World ofInvestment Companies Source: ICI
  • 6.
    Who are theInvestors?
  • 7.
    Institutional Investors  PensionFunds  Defined-Benefit Plans  Defined-Contribution Plans  Hybrid and other Plans  Foundations and Endowments  Foundations  Endowments  The Insurance Industry  Life Insurance Companies  Non-Life Insurance Companies  Banks and other Institutional Investors
  • 8.
  • 9.
    Portfolio Management asa Process  Portfolio management is an integrated set of steps undertaken in a consistent manner to create and maintain appropriate combination of investment assets.  Planning Step  Investor’s Objectives and Constraints  Investment Policy Statement (IPS)  Forming Capital Market Expectations  Creating Strategic Asset Allocation  Execution Step  Portfolio Construction and Revision  Portfolio Optimization  Tactical Asset Allocation  The Feedback Step  Monitoring and Rebalancing  Performance Evaluation
  • 10.
    Investment Objectives  RiskObjective largely determines return objective  How to measure risk?  Absolute vs Relative  Downside Risk: Value at Risk (VaR)  What is the investor’s willingness to take risk? Institutional vs. Individual  Investor’s ability to take risk?  Return Objectives  How is Return Measured? Total/Nominal/Real  Stated Return Desire  Required Return
  • 11.
    Investment Constraints  Liquidity Time Horizon  Tax Concerns  Legal and Regulatory Factors  Unique Circumstances
  • 12.
    Defined-Benefit (DB Plan) Plan sponsor is obligated in terms of the benefits to plan participants.  Promise made by a plan sponsor generates a future financial liability or “pension liability”.  Return Objective  To achieve returns that adequately fund pension liabilities  Overhang of trillion dollars liabilities  Risk:  DB plans payout of the pension assets, which are invested in the market.  Market Risk  Longevity Risk  Liquidity Risk  Funding status – under-funded/over-funded  Overall low risk tolerance
  • 13.
    Defined-Contribution (DC Plan) Plan sponsor is obligated in terms of contribution to pension fund rather than benefits to plan participants.  Promise for DC Plan is for the current stage – there is no future financial liability.  DC Plan sponsor bears the legal risk of investing  DC plans are portable
  • 14.
    Foundations  Usually grantmaking institutions funded by gifts and investment assets – usually created by single donor to fund philanthropic goals.  Investment portfolio provides the dominant source of revenue  Purchasing power of its corpus is either maintained or not.  US tax laws essentially mandate minimum level of annual spending.  Foundations can vary widely in their investment goals and time horizon.  Foundations, generally, don’t fundraise or reach out to donors.  Risk & Return Objectives:  Foundations can have higher risk tolerance  Most Foundations want to preserve corpus and target returns accordingly
  • 15.
    Endowments  Long-term funds(inter-generational) generally owned by non-profit institutions like universities, hospitals, museums etc.  Preserve purchasing power of the principal gift and to use fraction of returns as spending for designated cause.  Risk & Return Objectives:  Return objective is to provide significant, stable, and sustainable flow of funds to support designated programs.  Risk is related to spending policy; Averaging rules dampen short term volatility while striving for long term target returns.  Risk tolerance depends on the endowment’s role in operating budget.
  • 16.
    16 $Billions 1 Harvard 30.4 2Yale 19.3 3 Stanford 17.0 4 Princeton 17.0 5 MIT 10.1 6 Columbia 7.7 7 Northwestern 7.1 8 Pennsylvania 6.8 9 Chicago 6.6 10 Notre Dame 6.3 Private Universities Ranked by June 30, 2012 Endowment Market Value
  • 17.
    Fy12 Endowment Spendingas a % of the Market Value Harvard Dartmouth Chicago Yale Johns Hopkins Rice Duke Penn MIT Northwestern USC Princeton Stanford Vanderbilt Emory Wash U Brown 5.5% 5.4% 5.2% 5.2% 5.1% 4.9% 4.9% 4.9% 4.9% 4.8% 4.6% 4.4% 4.4% 4.4% 4.4% 4.3% 4.3%
  • 18.
    Risk Management asProcess • Risk management is a process involving: – Identifying Risk factors – Quantification of exposure to risk – Map various risks in to risk estimation calculation – Identify overall risk exposure – Continuous measurement of exposure – Adjustment to exposure according to agreed risk exposure limits – Alteration based on new information
  • 19.
    Portfolio Risk Universe SystematicRisk: Influences large number of assets, difficult to diversify Unsystematic risk: Influences small number of assets, manageable Credit and Default Risk: Associated with Bonds and Stocks Geo-political Risk: Related to policies and internal situation of a region or country Foreign Exchange Risk: due to financial policies of various countries Interest Rate Risk: Related to Fed policy Market Risk: Related to market volatility Headline Risk: Avoid Bad Publicity
  • 20.
    Asset Class Traditional Alternative StocksHedge Funds Bonds Private Equity REITS Private Real Estate Commodities Natural Resources
  • 21.
    Asset Class Characteristics Asset Class/Strategy RiskCharacteristics Public Equity Market beta/high Volatility High return/Growth Private Equity Illiquid/high Volatility Higher return/Growth Real Estate (REITS) Market beta/high Volatility High return/Growth/Inflation Protection Real Estate (Private) Illiquid/regional/Volatile High return/Inflation protection Bonds Low Volatility Low return/Risk minimizing TIPS Low Volatility Low return/Inflation protection Natural Resources/Real Assets Illiquid High Return/Inflation protection
  • 22.
    Portfolio Construction: RiskReward Trade-off  Rational portfolio choices based on the efficient risk (Modern Portfolio Theory).  Capital Markets Expectations  Asset class and strategy diversification  Use of quantitative methods in portfolio management  Risk budgeting
  • 23.
  • 24.
    7-Year Asset ClassReal Return Forecasts 24
  • 25.
    Endowment Management Investment StrategyImplementation • Manager searches • Manager evaluation • Investment Portfolio Monitoring • Portfolio risk management • Performance measurement • Performance reporting • Performance and attribution analyses • Capital markets monitoring • Other
  • 26.
    Investment Risk Management 360degree risk management Risk minimization is one of the three objectives Investment decisions are based on better risk adjusted returns and downside risk protection. Investment portfolio is diversified across asset classes, markets, and strategies to mitigate risk. Manager selection is based on stringent quantitative and qualitative due- diligence. Risk reporting is part of the culture
  • 27.
    Types of Risks •Market Risk • Manager Performance Risk • Counter-party Risk • Manager Business Risk • Concentration Risk • Style drift Risk • Fraud Risk
  • 28.
    Endowment Investment ReturnGoal Return – Inflation – Spending – Admin fee > 0 - 2.5% - 4.25% - 2% > 0 ?
  • 29.
  • 30.
  • 31.
    Fiscal Year NetReturn 2007 16.76% 2008 -5.55% 2009 -19.87% 2010 9.04% 2011 15.47% 2012 0.67% 2013 8.52% 2014 12.93% 2015 2.04% FYTD 2016 2.95%
  • 32.
  • 33.
    Policy Benchmark Composition AssetBenchmark Weight Global Equities MSCI ACWI 31.5% Private Capital PE Median TW 14% Long Short Equities HFRI Equity Hedge Index 11.5% Global Macro HFRI Macro Index 4% Event Driven HFRI Event Driven Index 2% Real Estate Weighted Public/Private Index 6% TIPS TIPS 5% Natural Resources Weighted Public/Private Index 16% Investment Grade Barclay Aggregate 1% Relative Value HFRI Relative Value Index 9% PBM Composition ML HY Master II MSCI ACWI PE Median TW HFRI Equity Hedge Index HFRI Macro Index HFRI Event Driven Index Weighted Public/Private Index Weighted Public/Private Index Barclay Aggregate HFRI Relative Value Index The Policy Benchmark mirrors the target portfolio allocation. Indexes were chosen by consultants at Wilshire Associates and approved by IC.
  • 34.
    Liquidity 0.00% 5.00% 10.00% 15.00% 20.00% 25.00% 30.00% 35.00% Public Equity Marketable Alternatives PrivateEquity Real Assets Fixed Income Cash Liquidity Profile Super Liquid (<2 Months) Liquid (2 to 6 Months) Illiquid • The portfolio has a meaningful allocation to locked-up investments, to capture an illiquidity premium. • A large portion of the portfolio is super liquid and the majority of these assets can be liquidated in under three days.
  • 35.