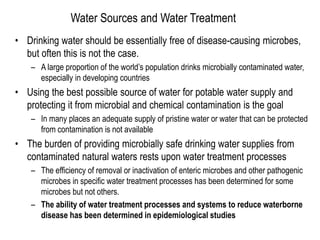
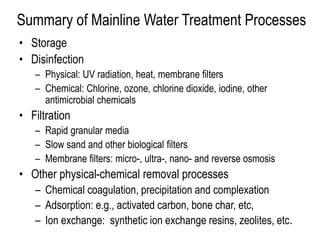
This document discusses various water treatment processes for removing microbes from drinking water sources. It covers:
1) Storage processes like reservoirs and aquifers that can reduce microbe levels over time through natural die-off. Studies found enteric virus reductions of 400-1000-fold after 6-7 months of storage.
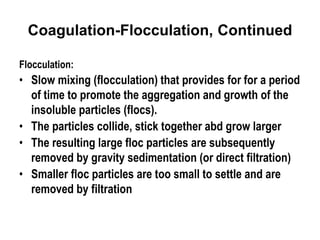
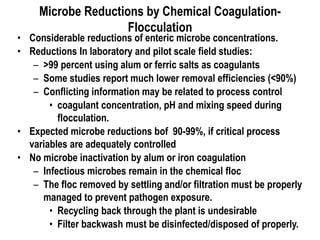
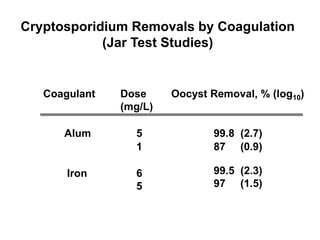
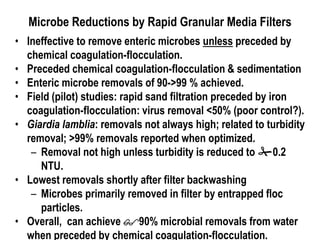
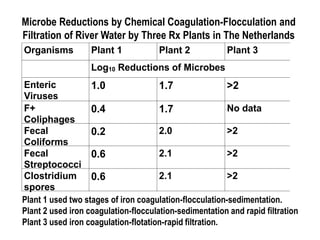
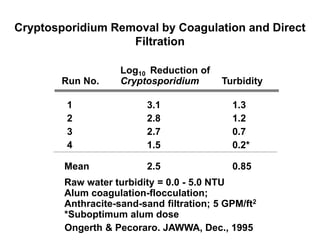
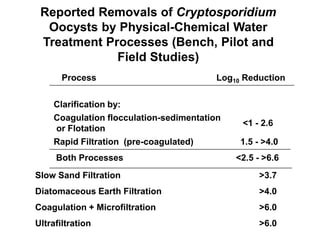
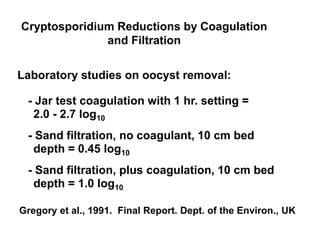
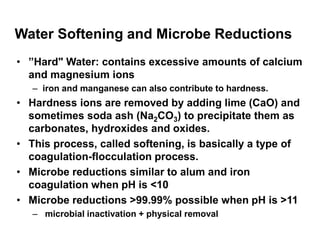
2) Chemical coagulation and flocculation that uses chemicals like alum to destabilize particles and microbes, causing them to clump together and be removed by sedimentation or filtration. Studies found this process can achieve over 99% removal of enteric microbes.
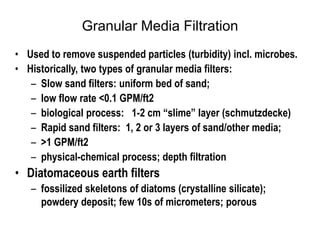
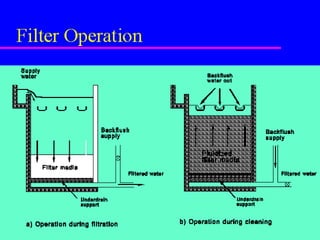
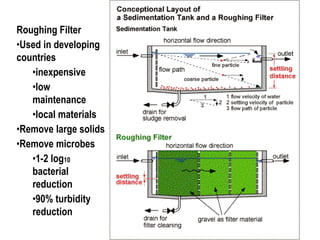
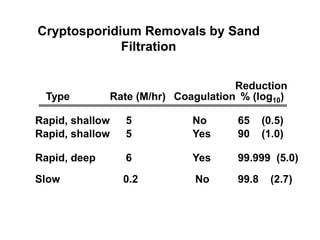
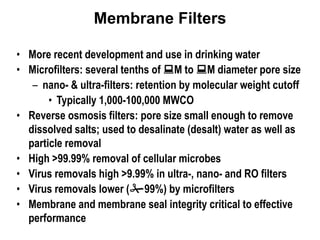
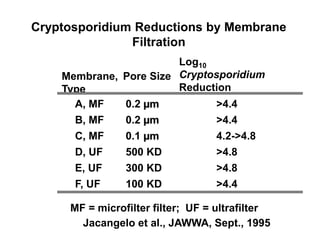
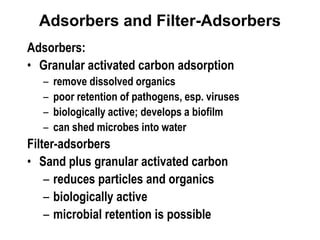
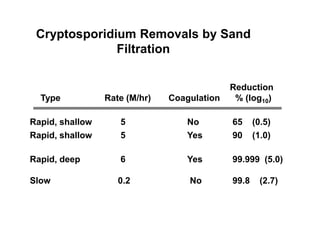
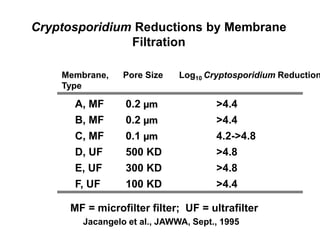
3) Filtration processes like slow sand filters, rapid sand filters, and membrane filters that can achieve high