Download to read offline


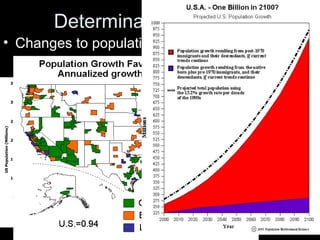
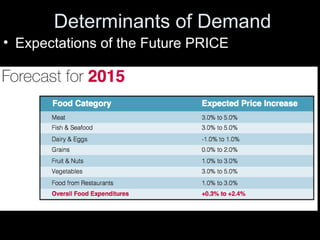


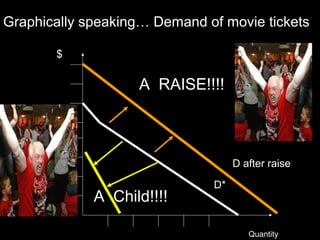


The document discusses the economic concept of demand, including the determinants of demand and how demand curves shift in response to changes in price and other factors. It specifically addresses how demand for a good is affected by changes in the prices of substitutes and complements, as well as by changes in consumer tastes, income, population, and expectations about future prices. Graphs and examples are provided to illustrate these concepts.


![Lesson 6--demand[1]](https://cdn.slidesharecdn.com/ss_thumbnails/lesson-6-demand1-130409195933-phpapp01-thumbnail.jpg?width=640&height=640&fit=bounds)


