Download to read offline
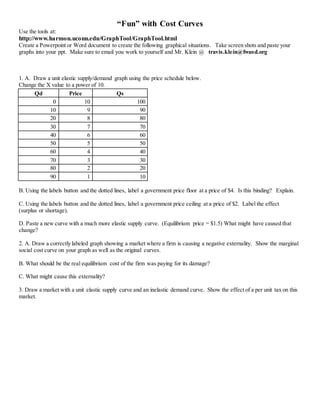
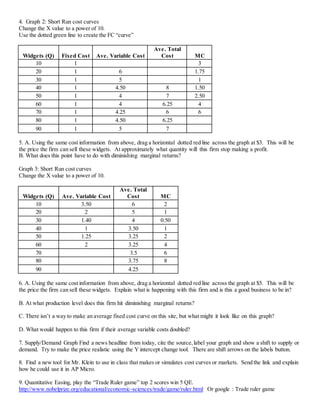

This document provides instructions for creating graphs using an online graphing tool to illustrate various microeconomics concepts related to supply and demand, costs of production, and market equilibrium. Students are asked to create graphs showing: a unit elastic supply/demand curve with price controls; a market with negative externalities; the effect of a per unit tax; short-run cost curves and break-even analysis; and supply/demand shifts in response to current events. The final questions provide an additional economics game and a request for new classroom tools.


