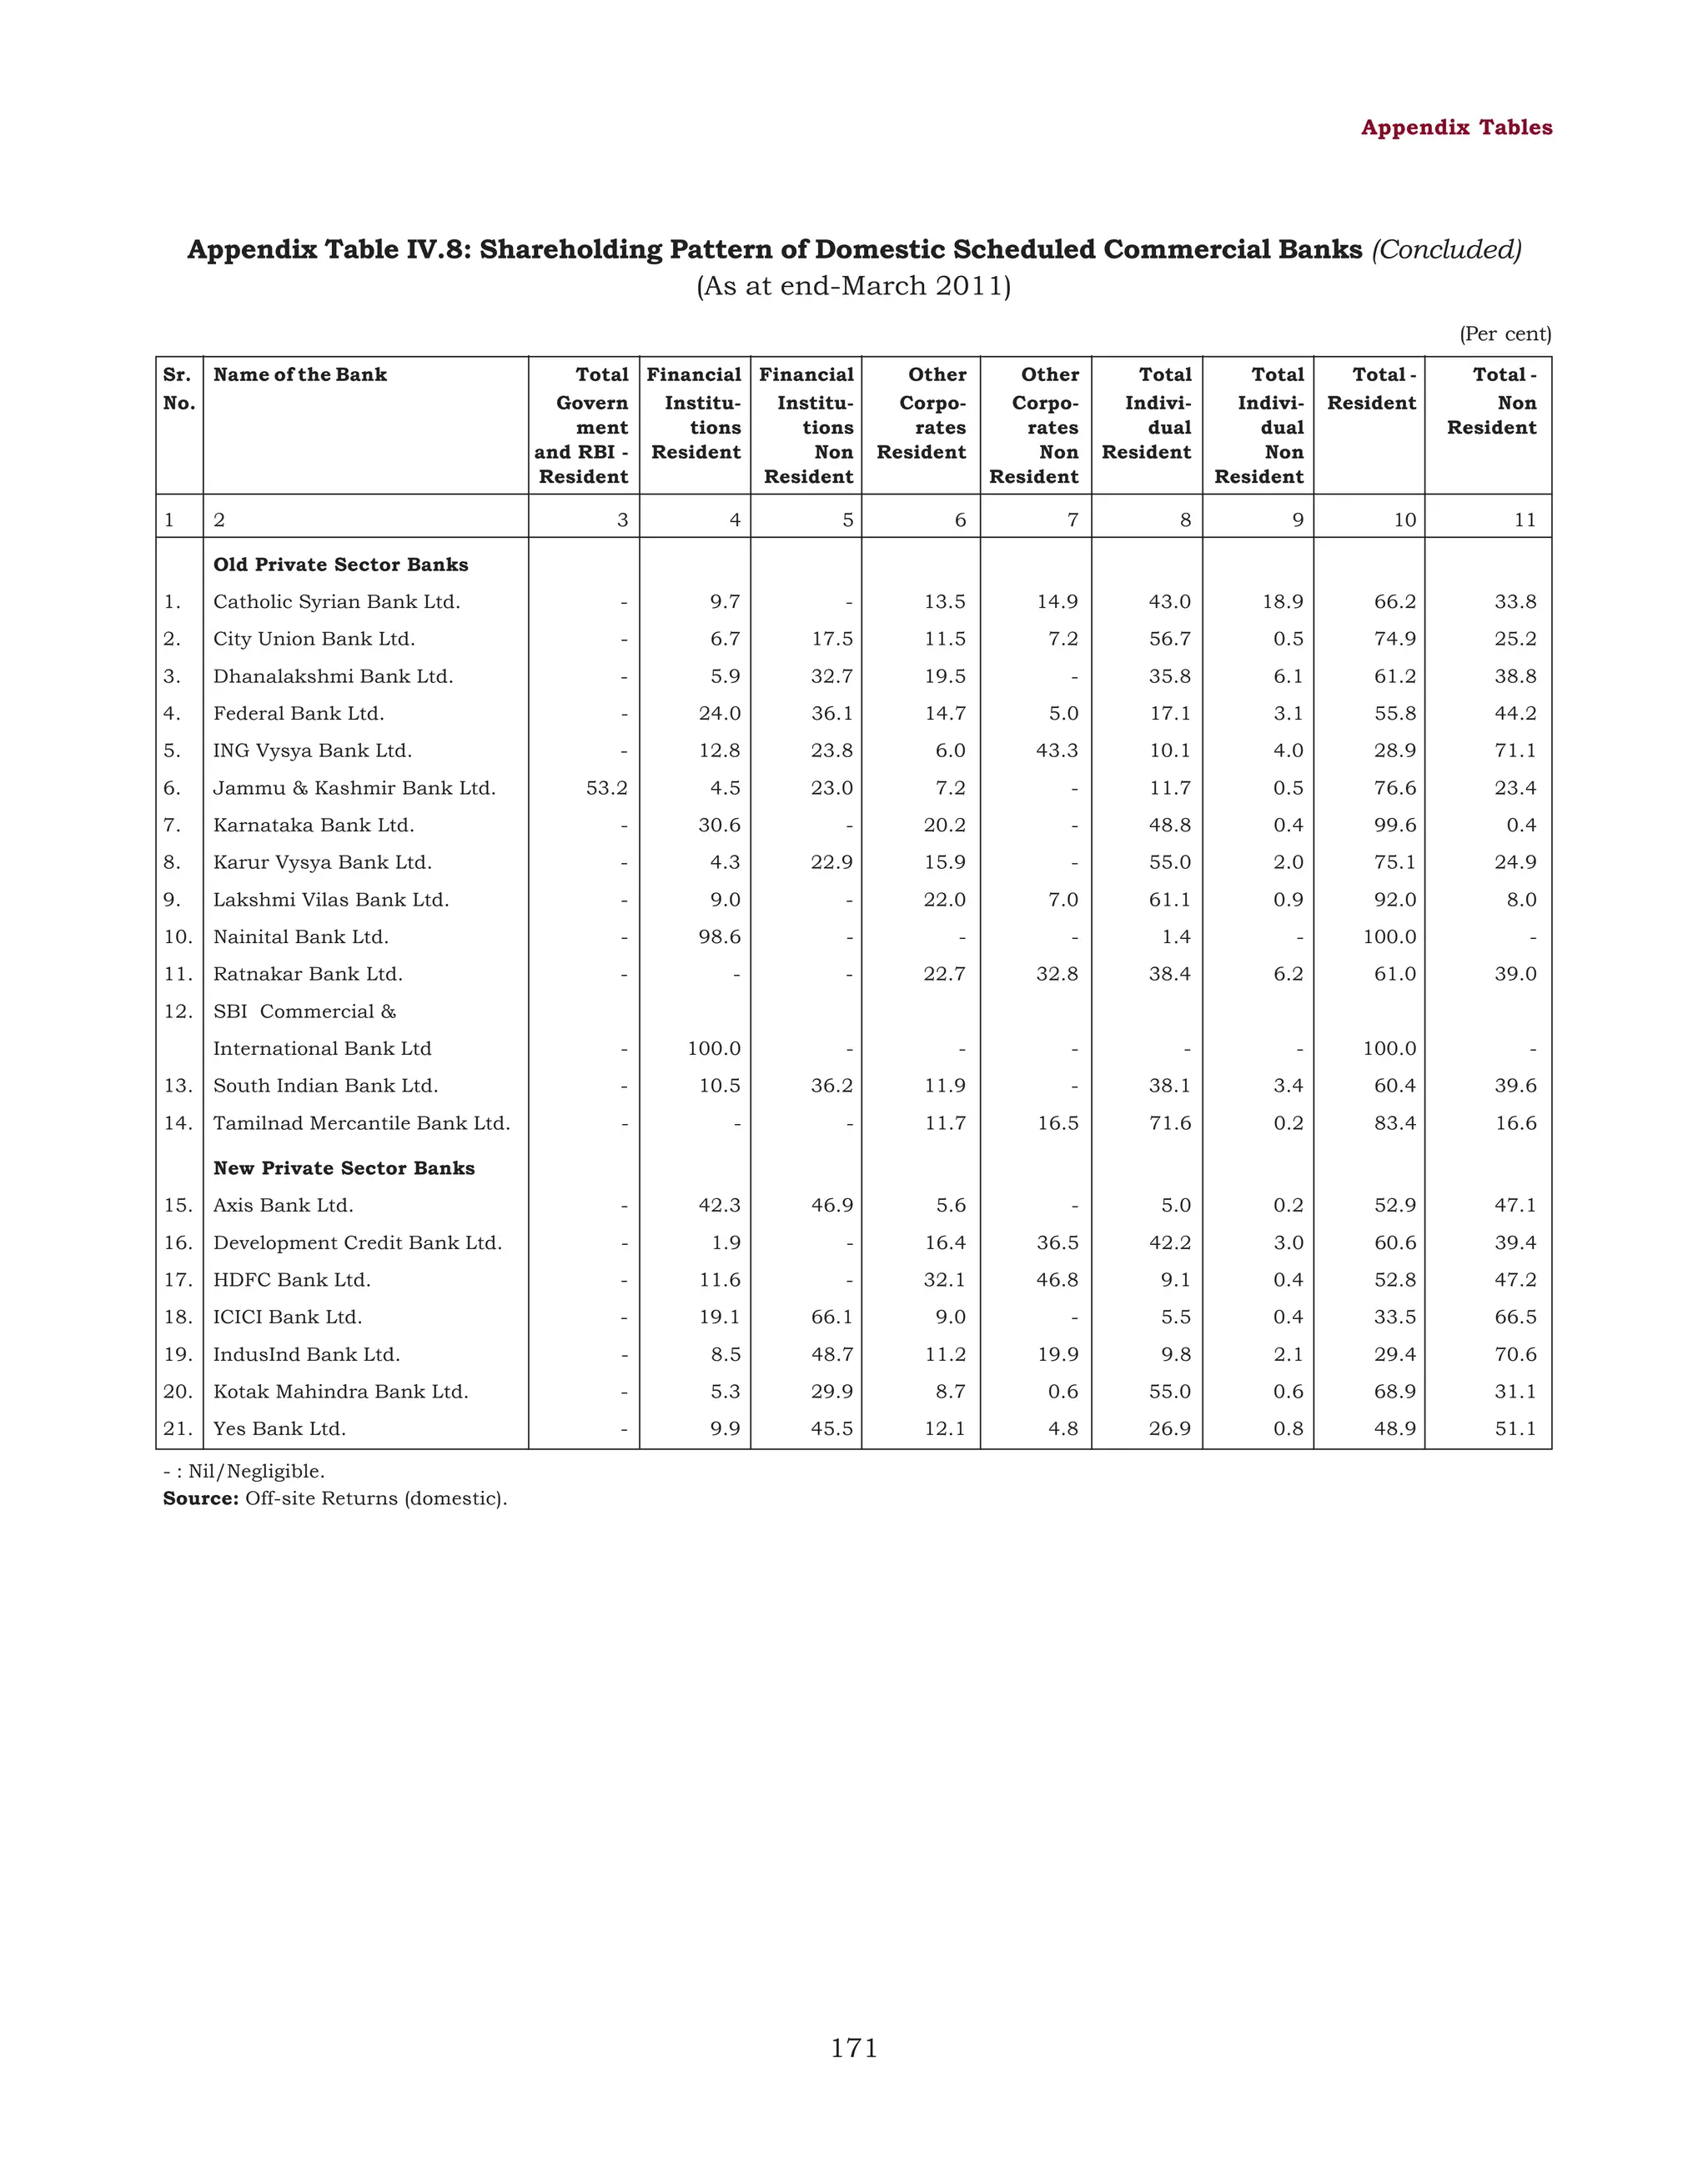
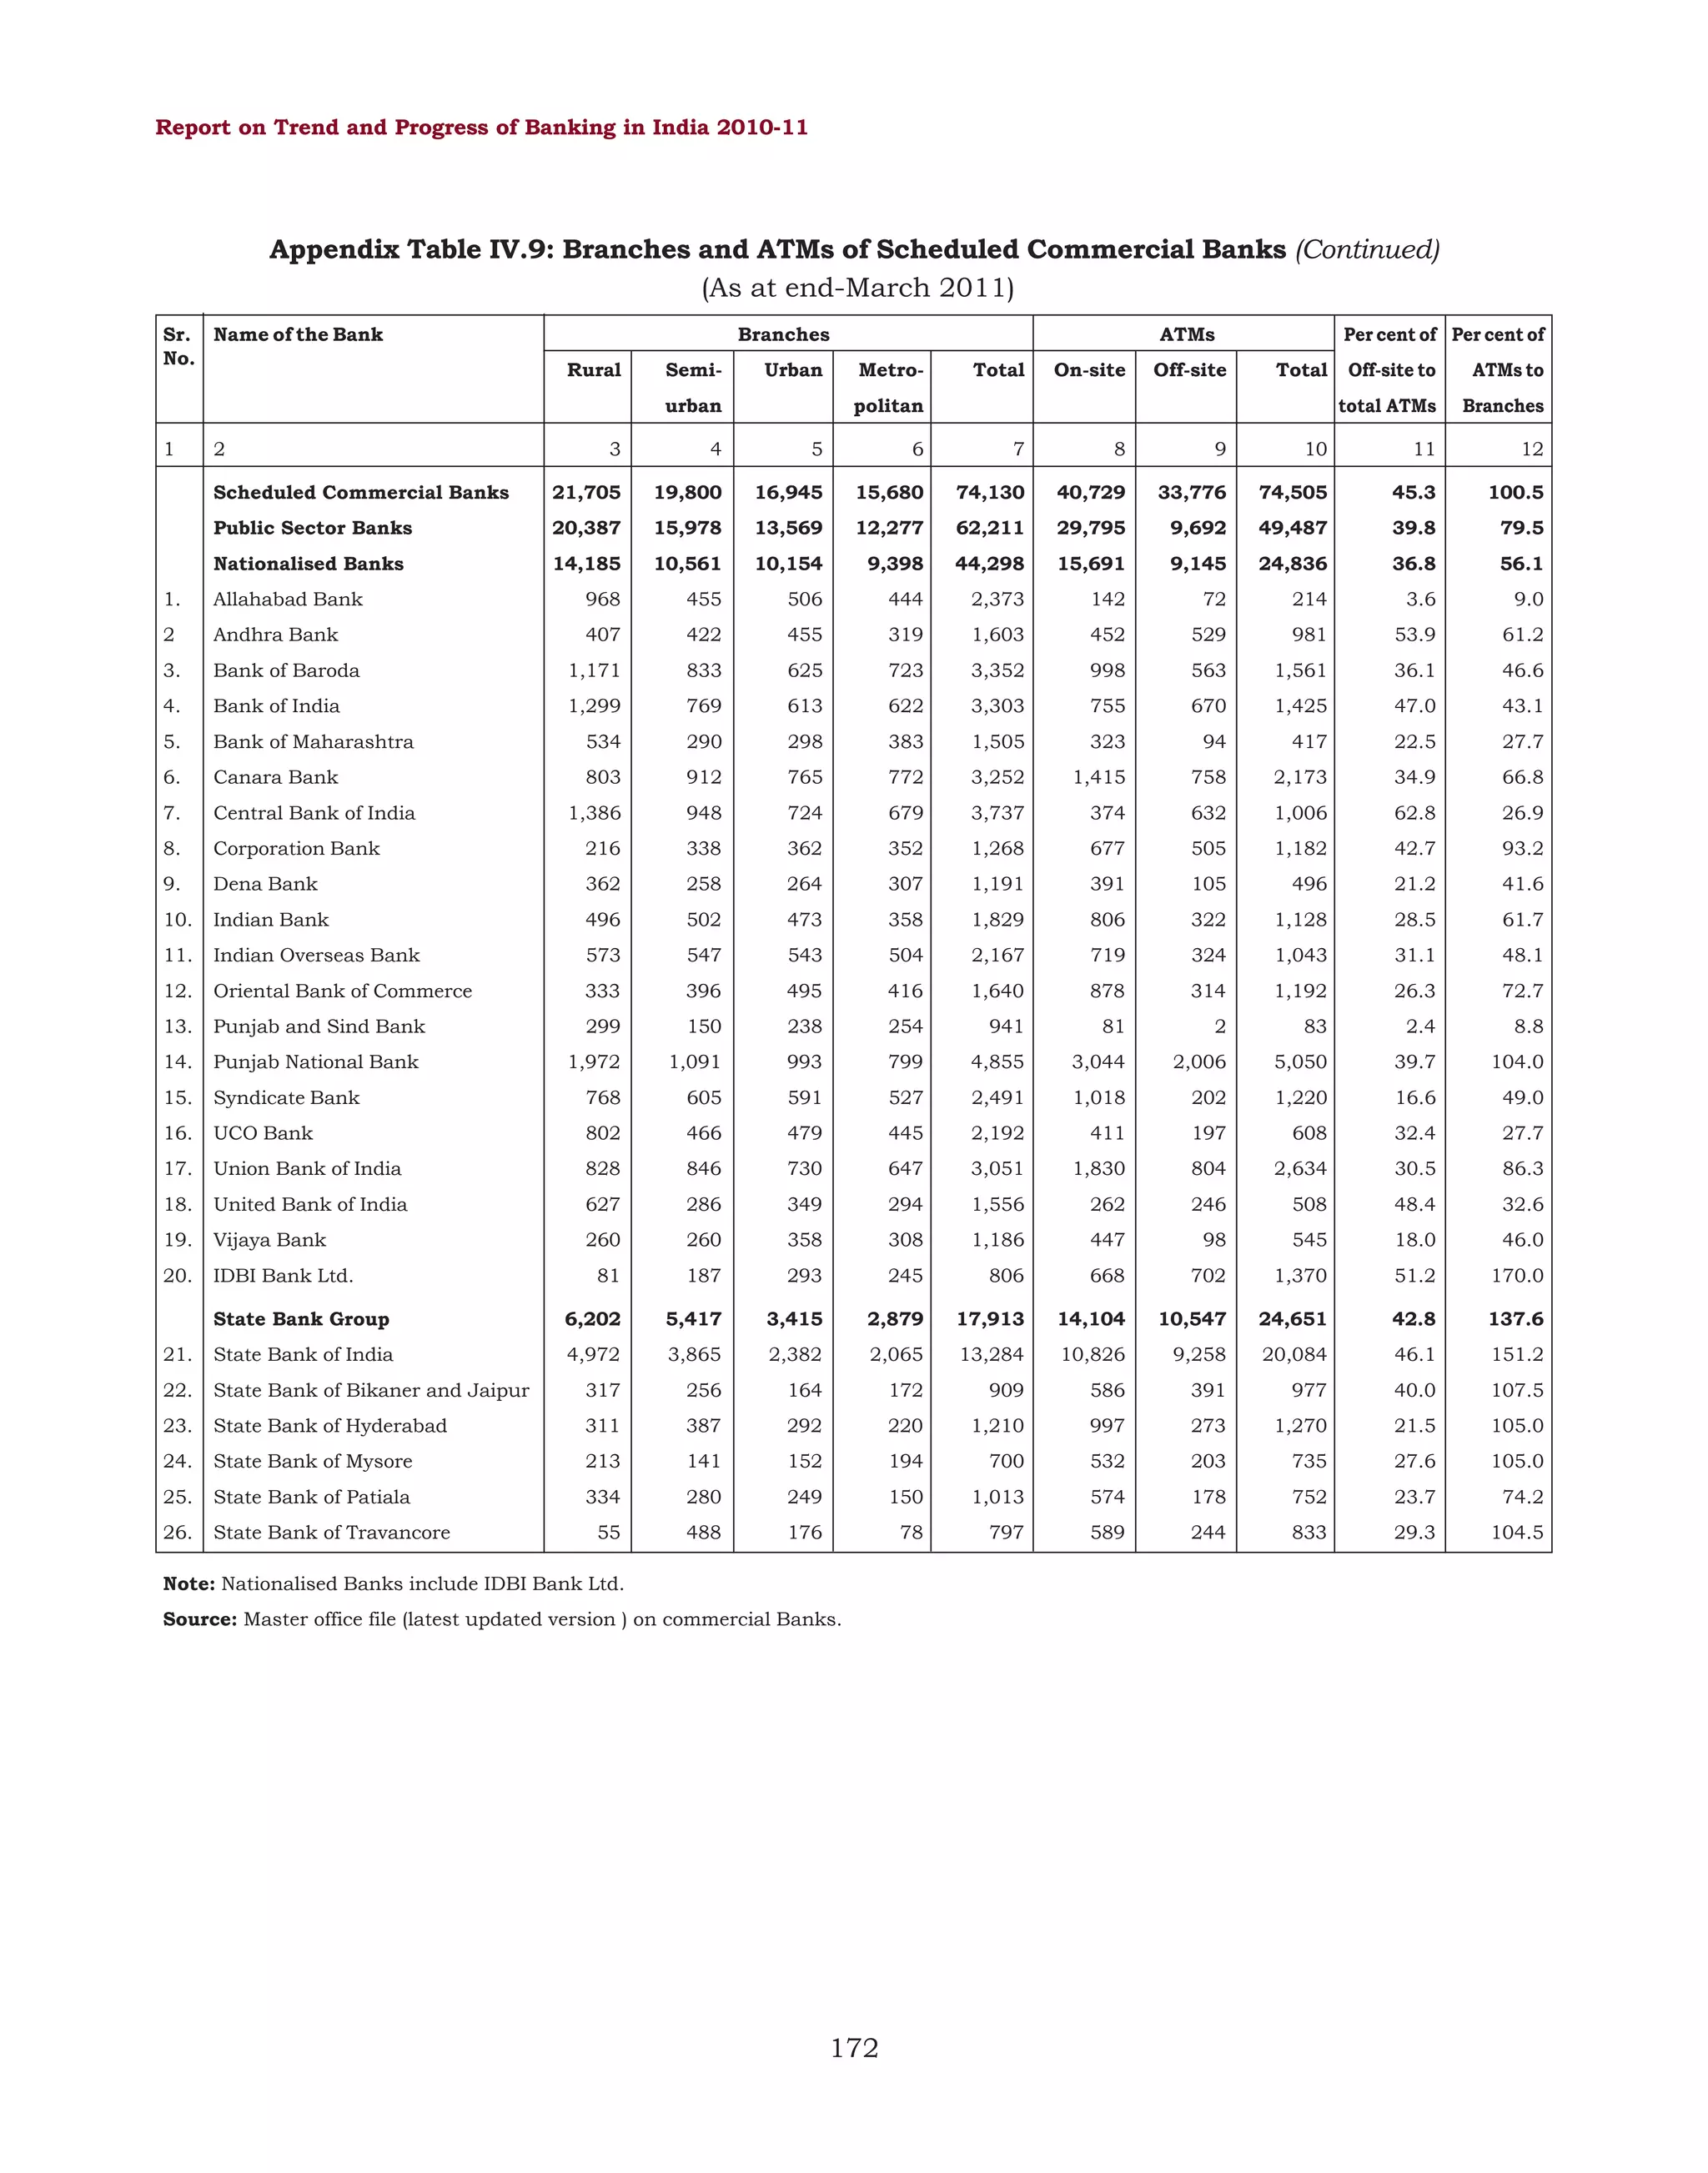
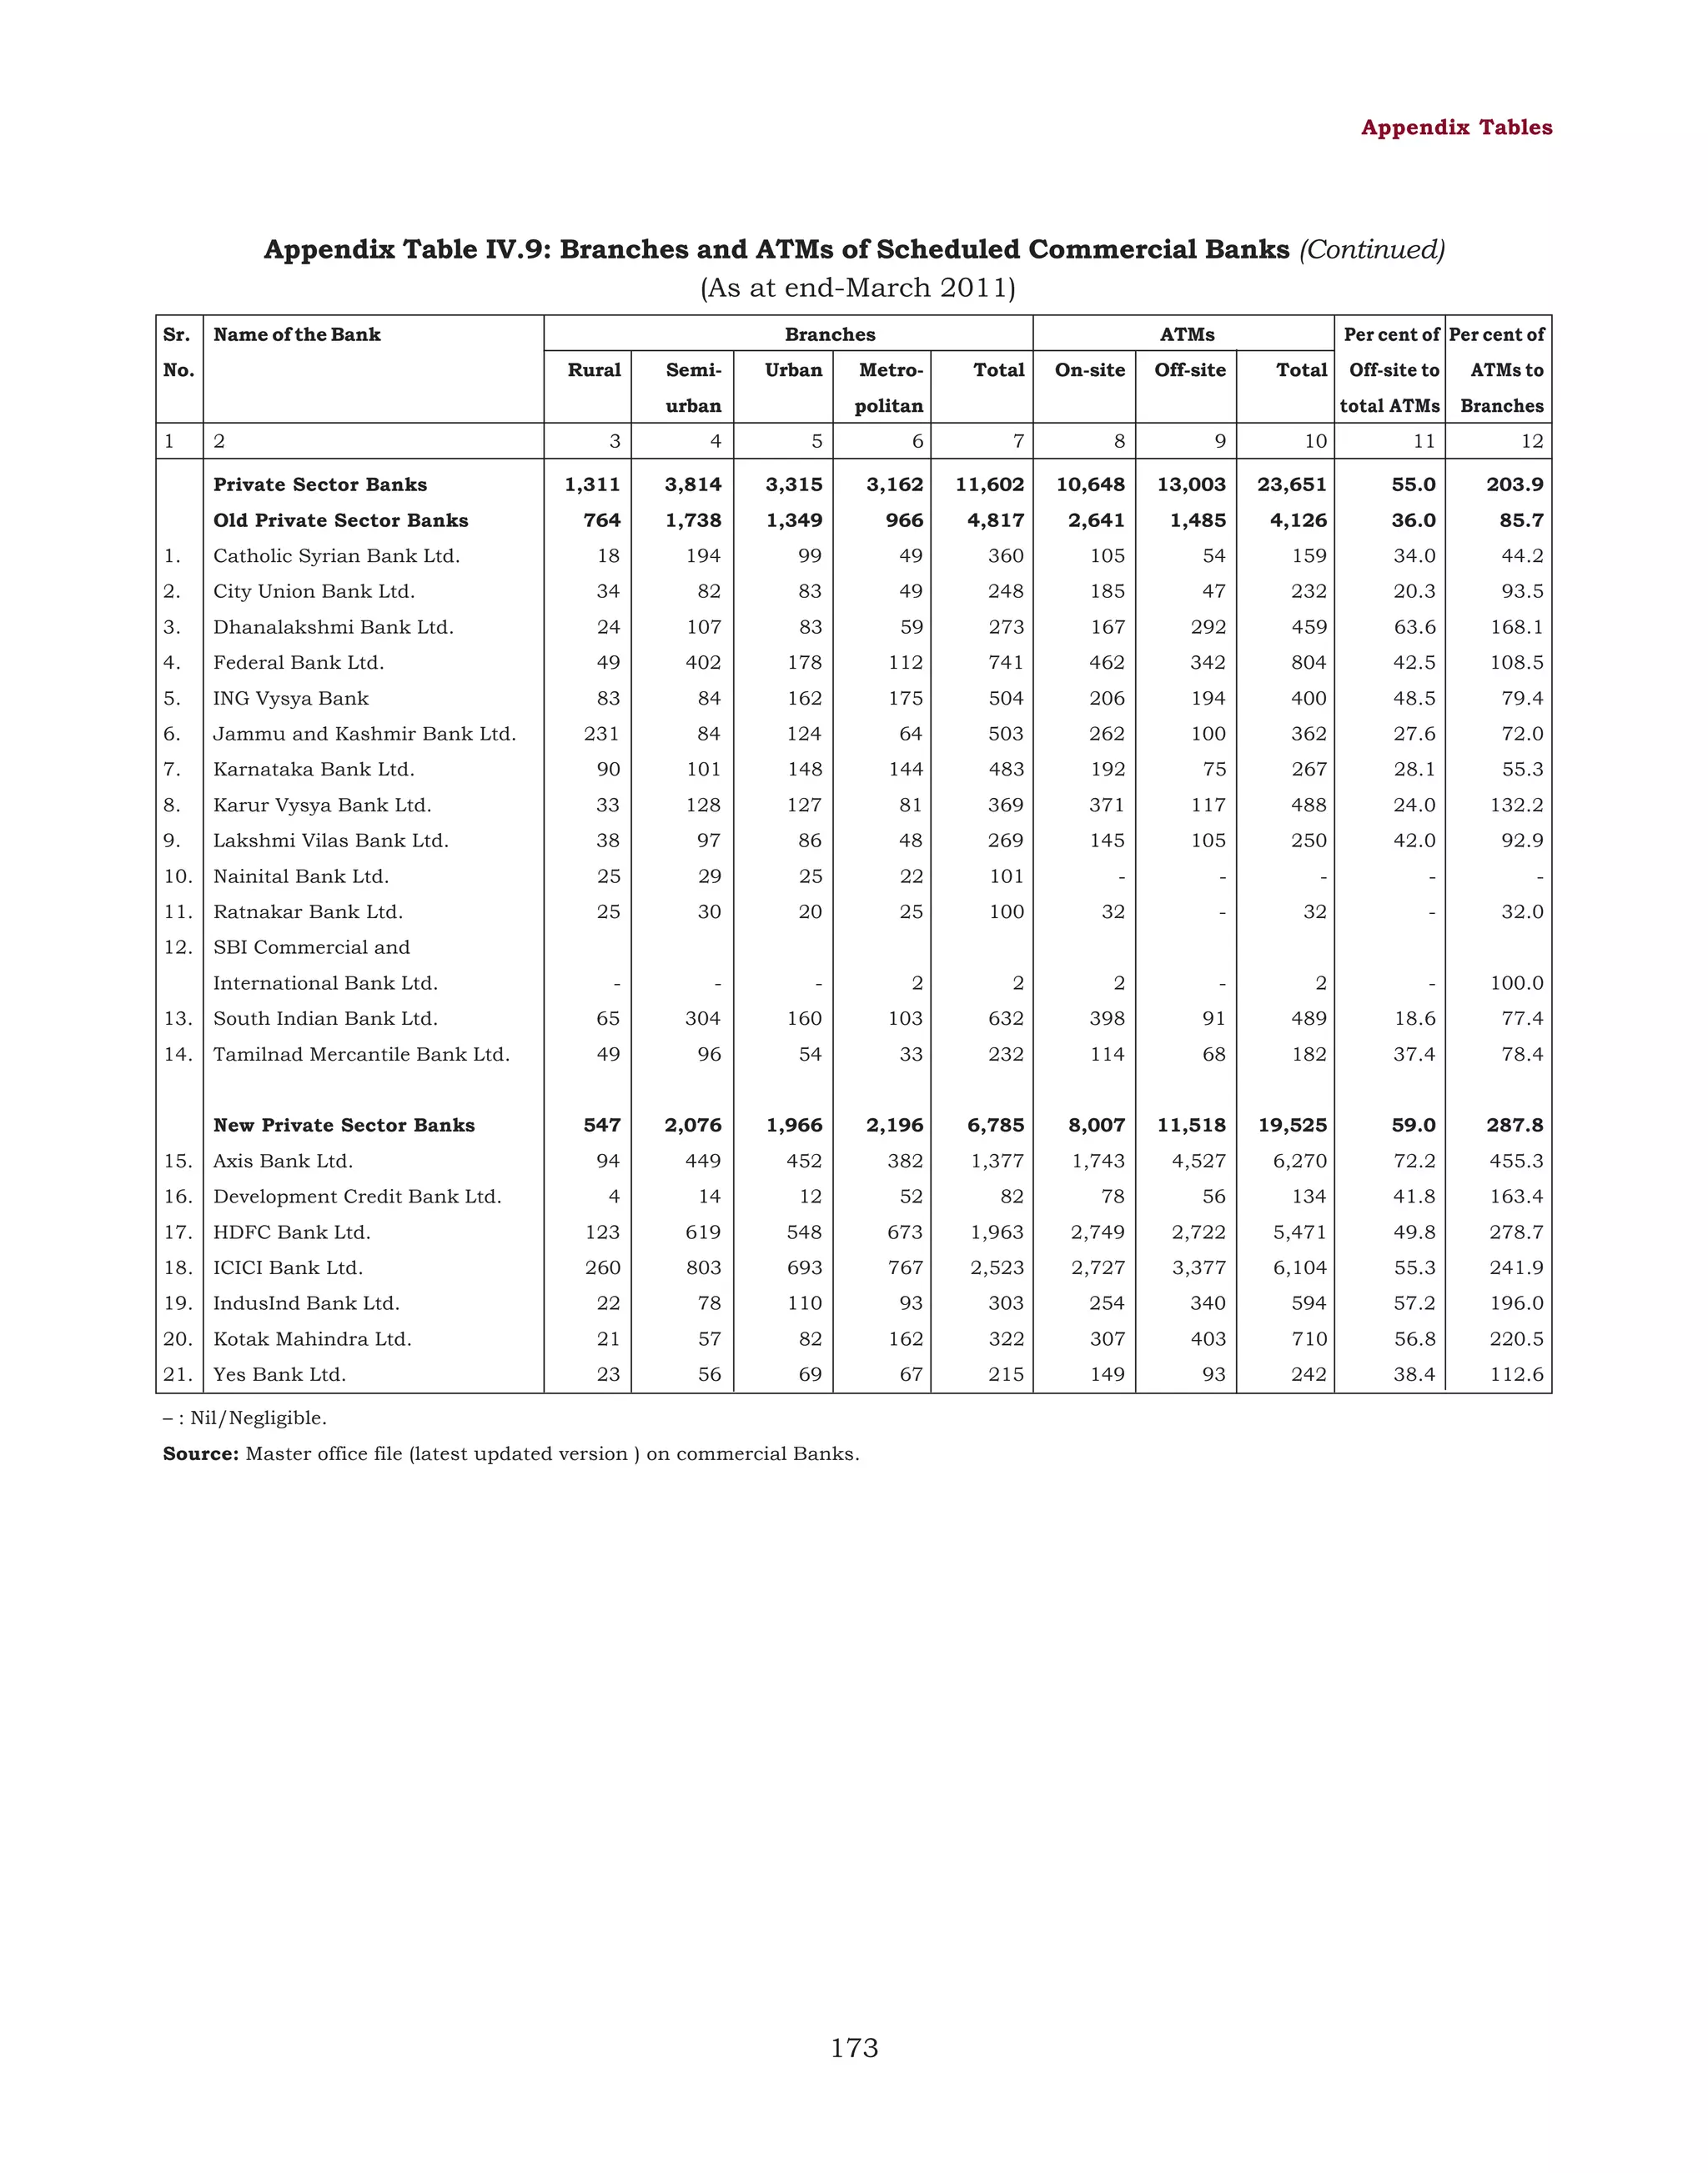
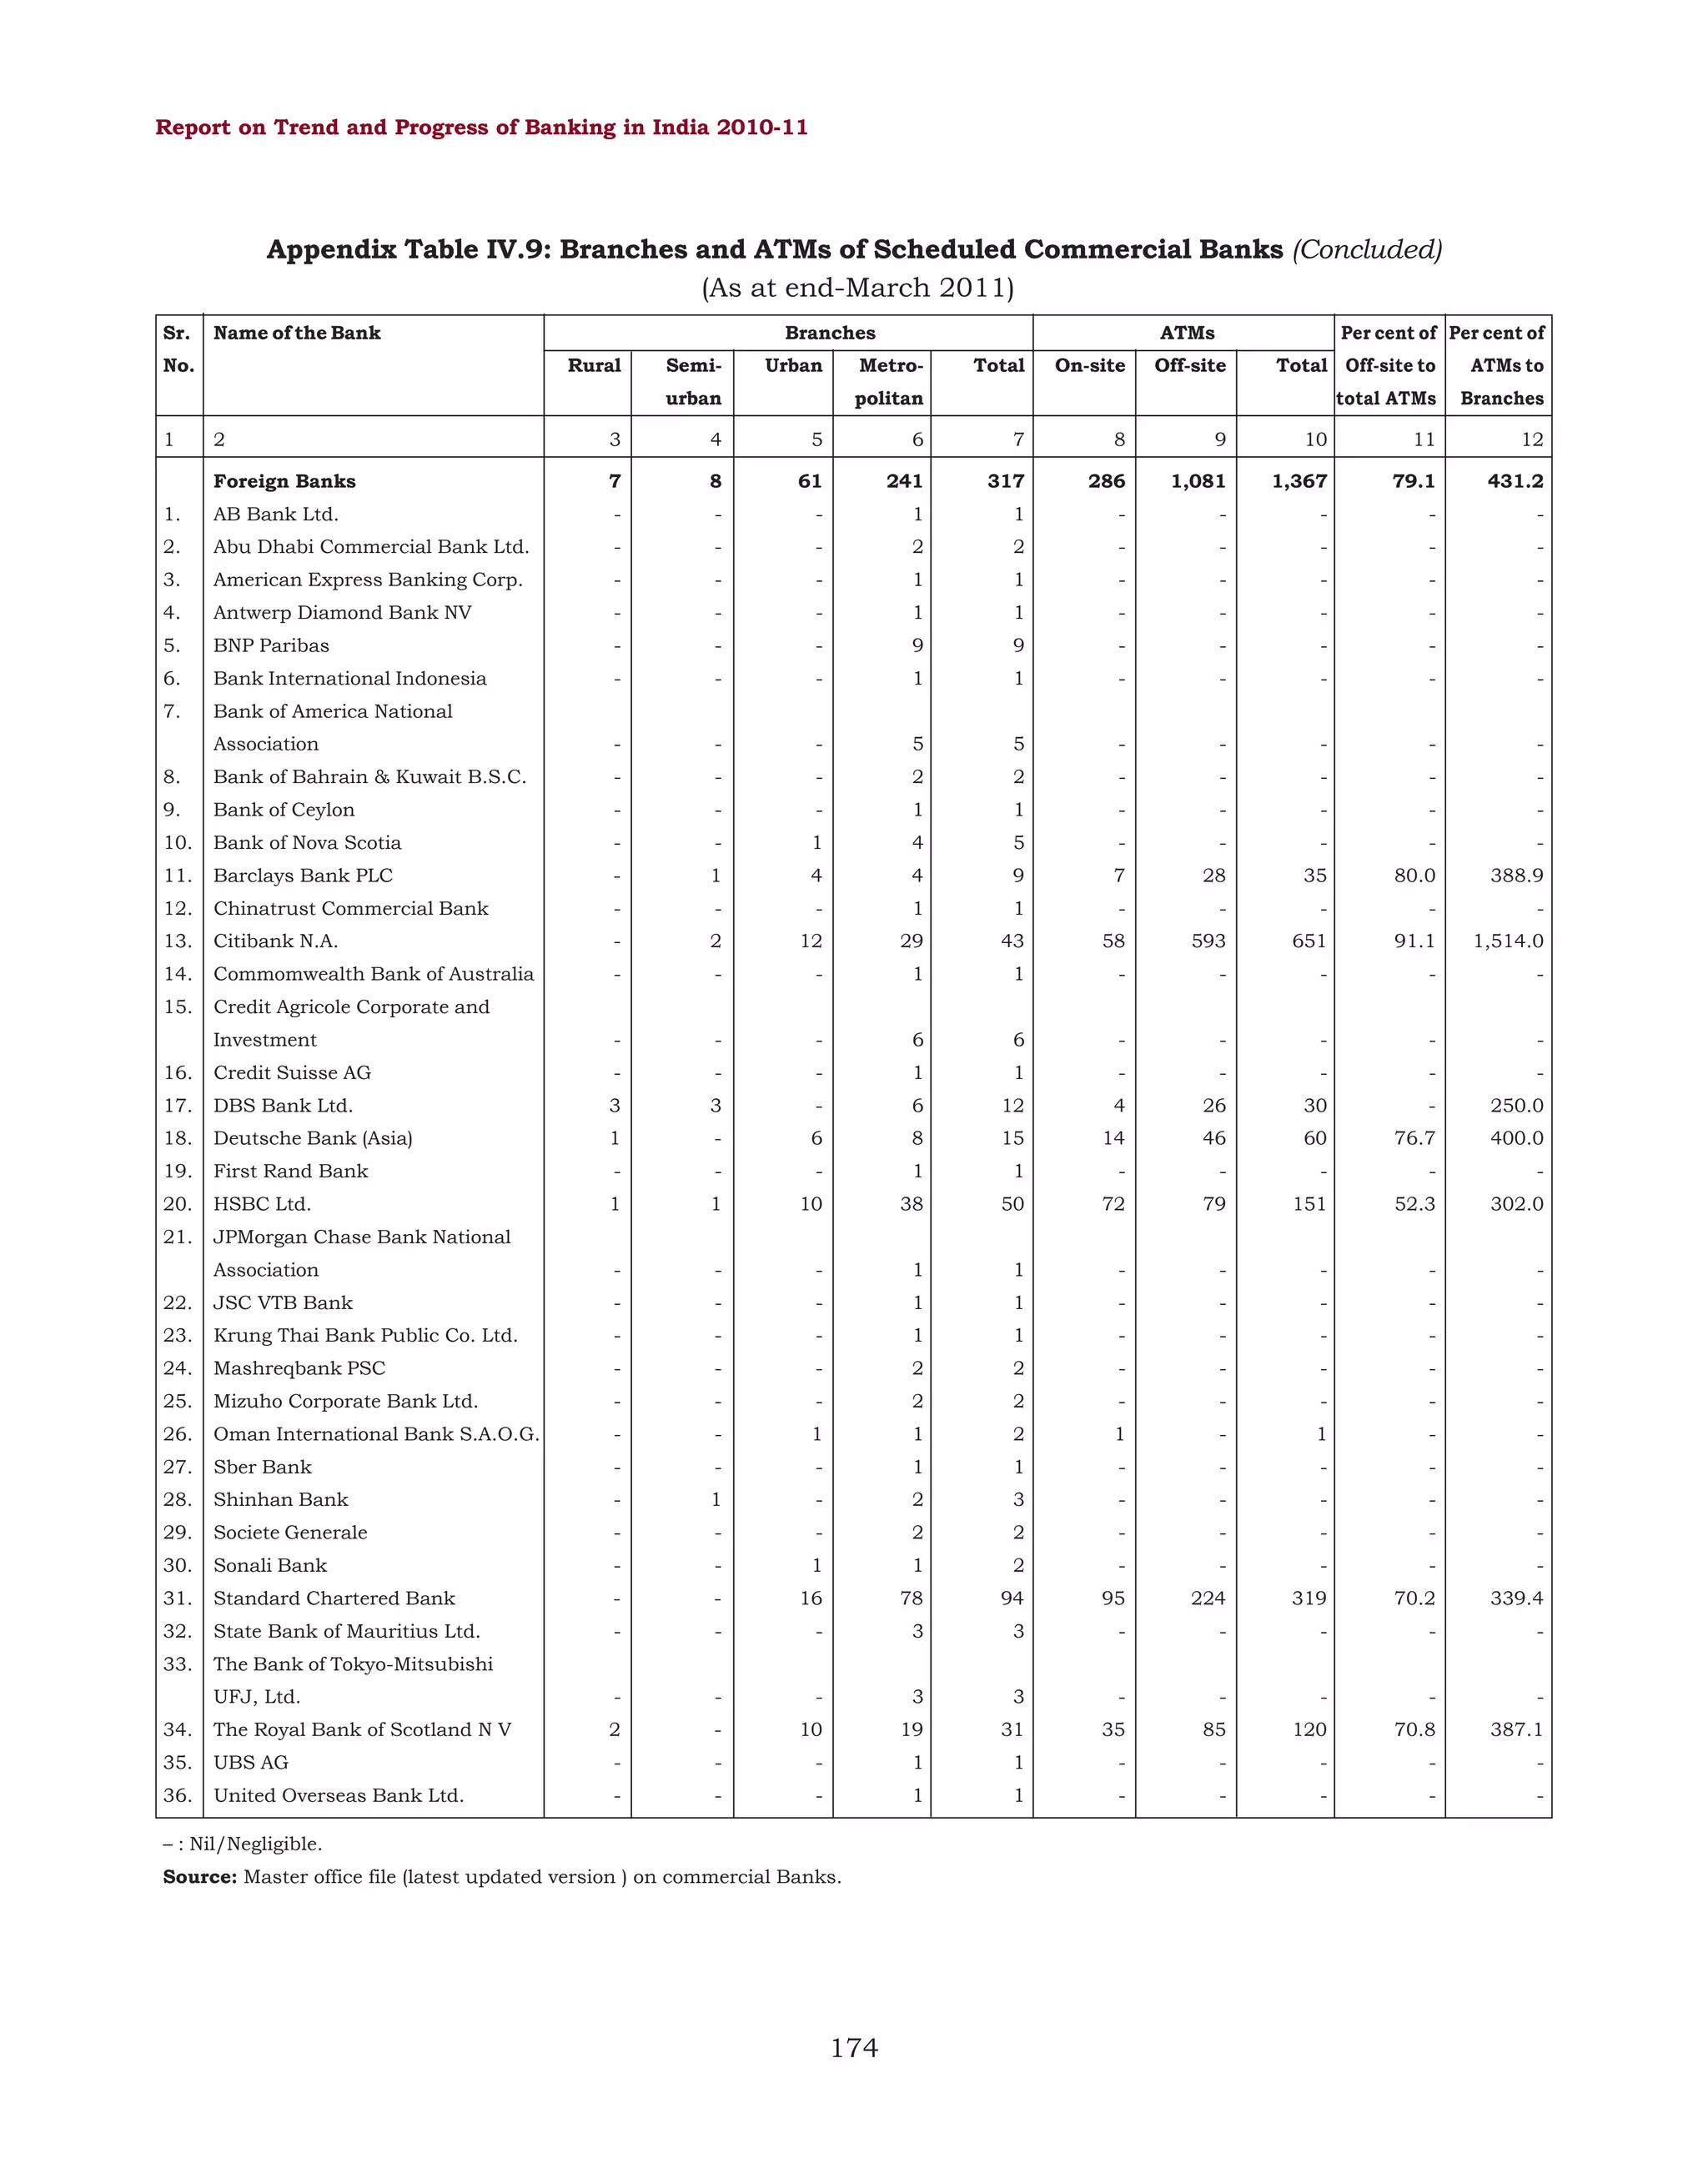
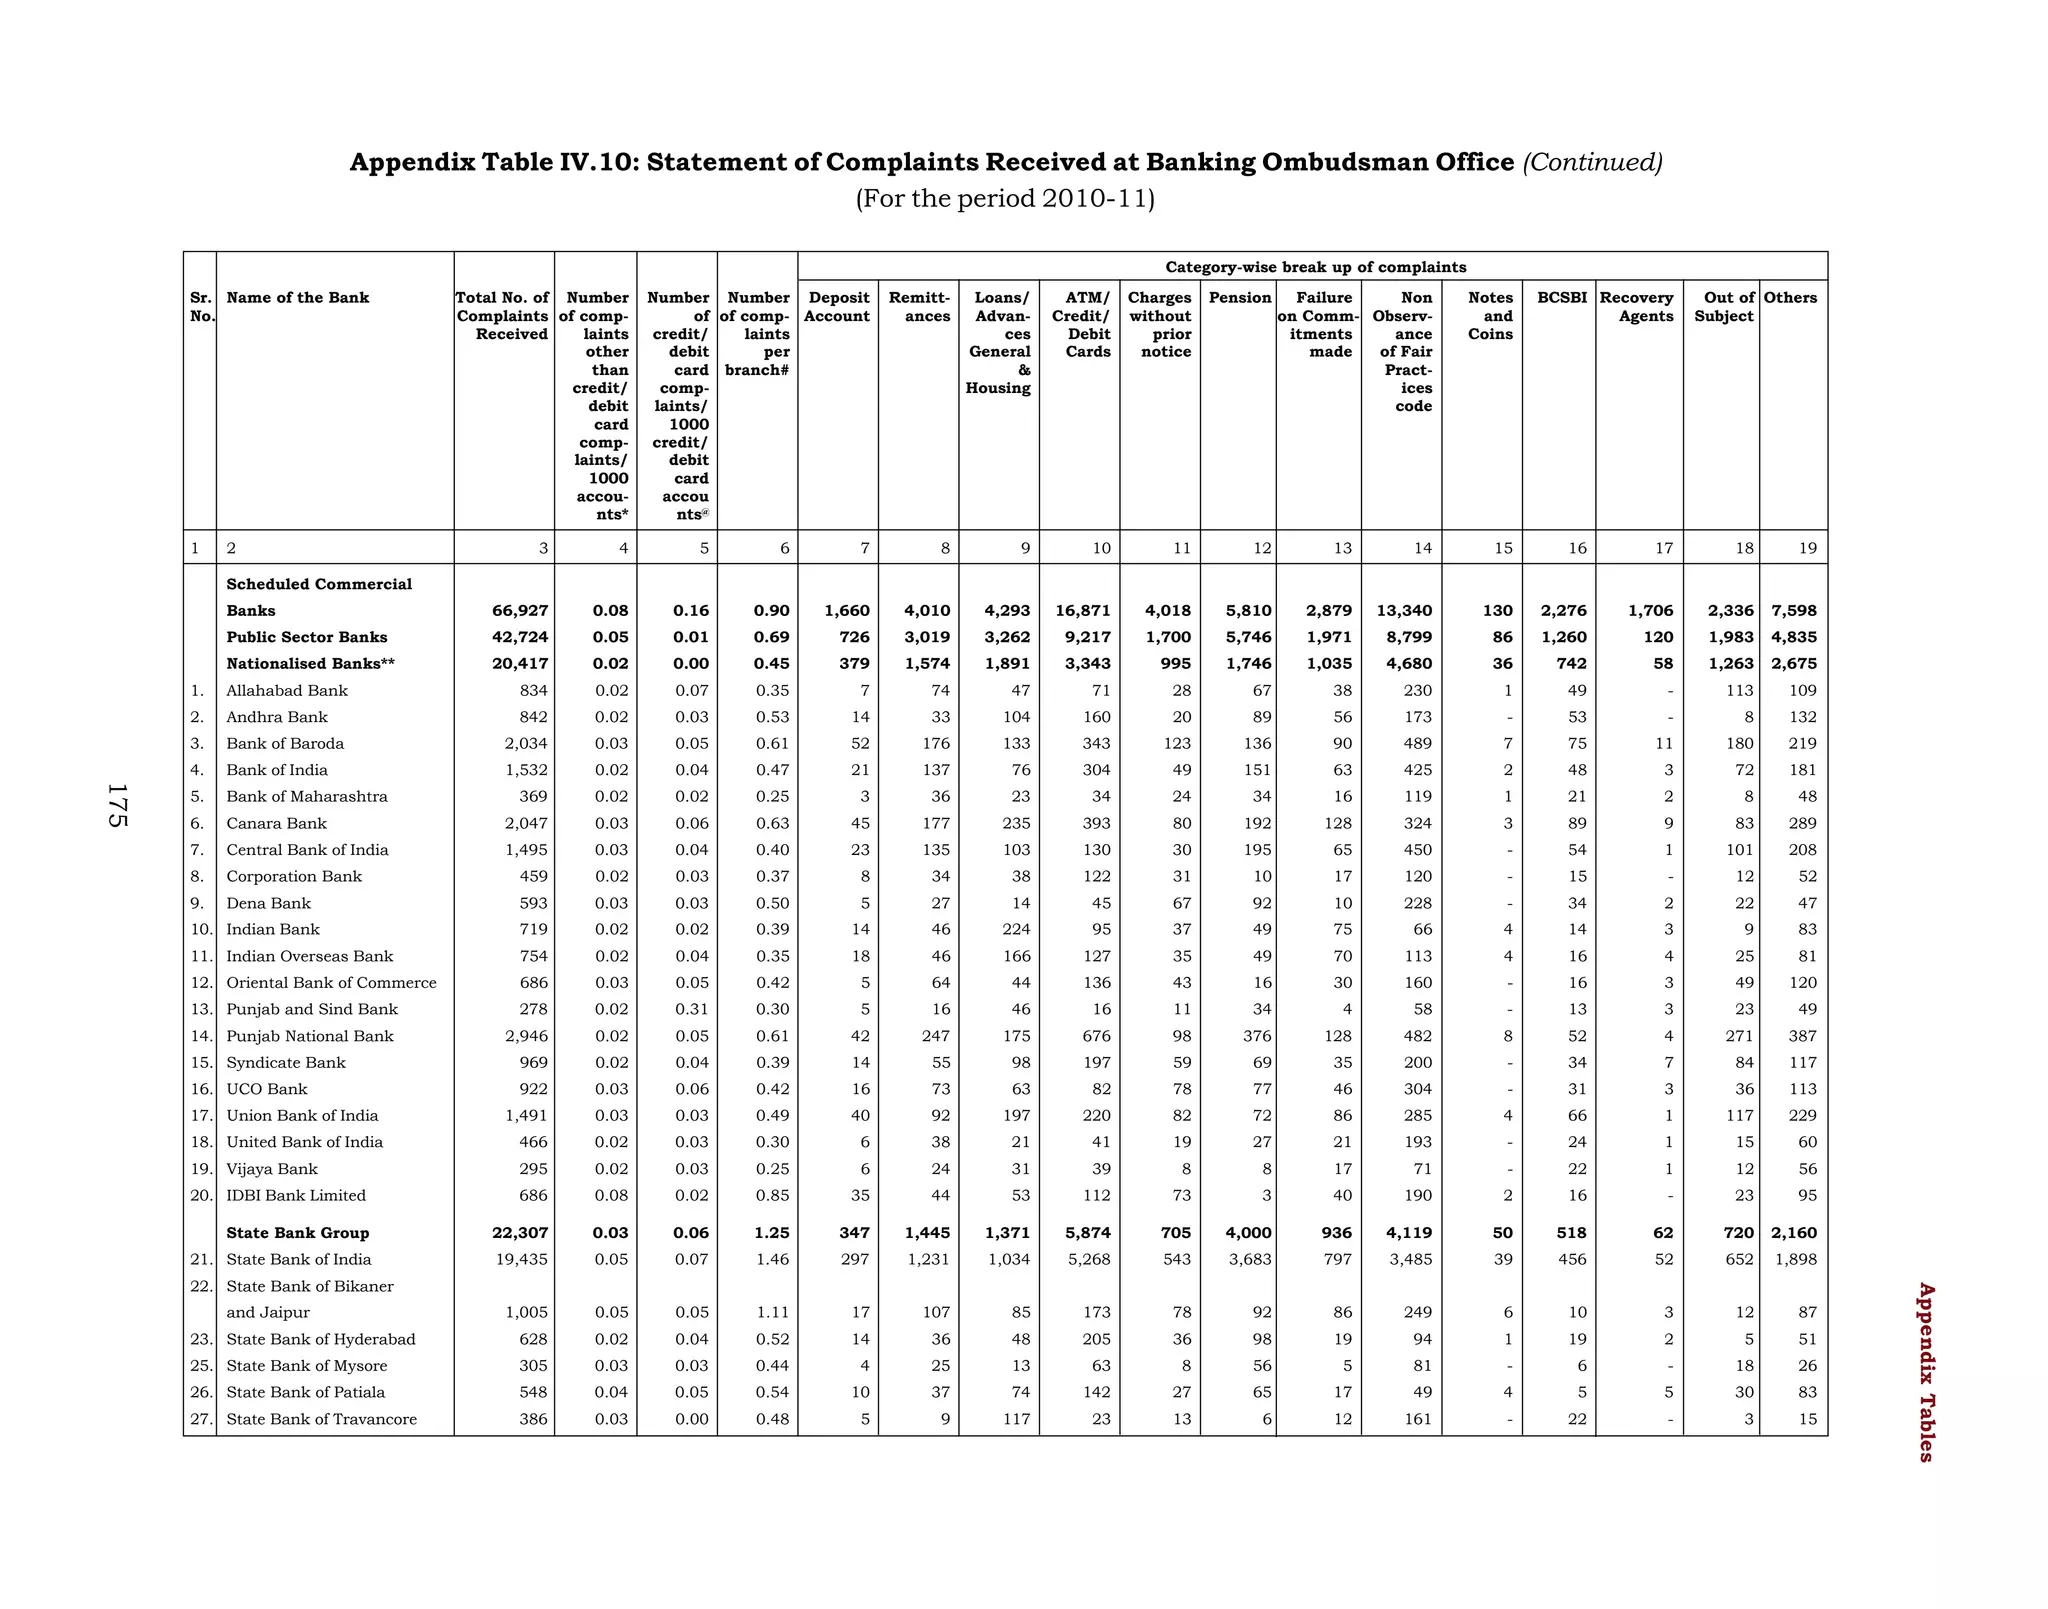
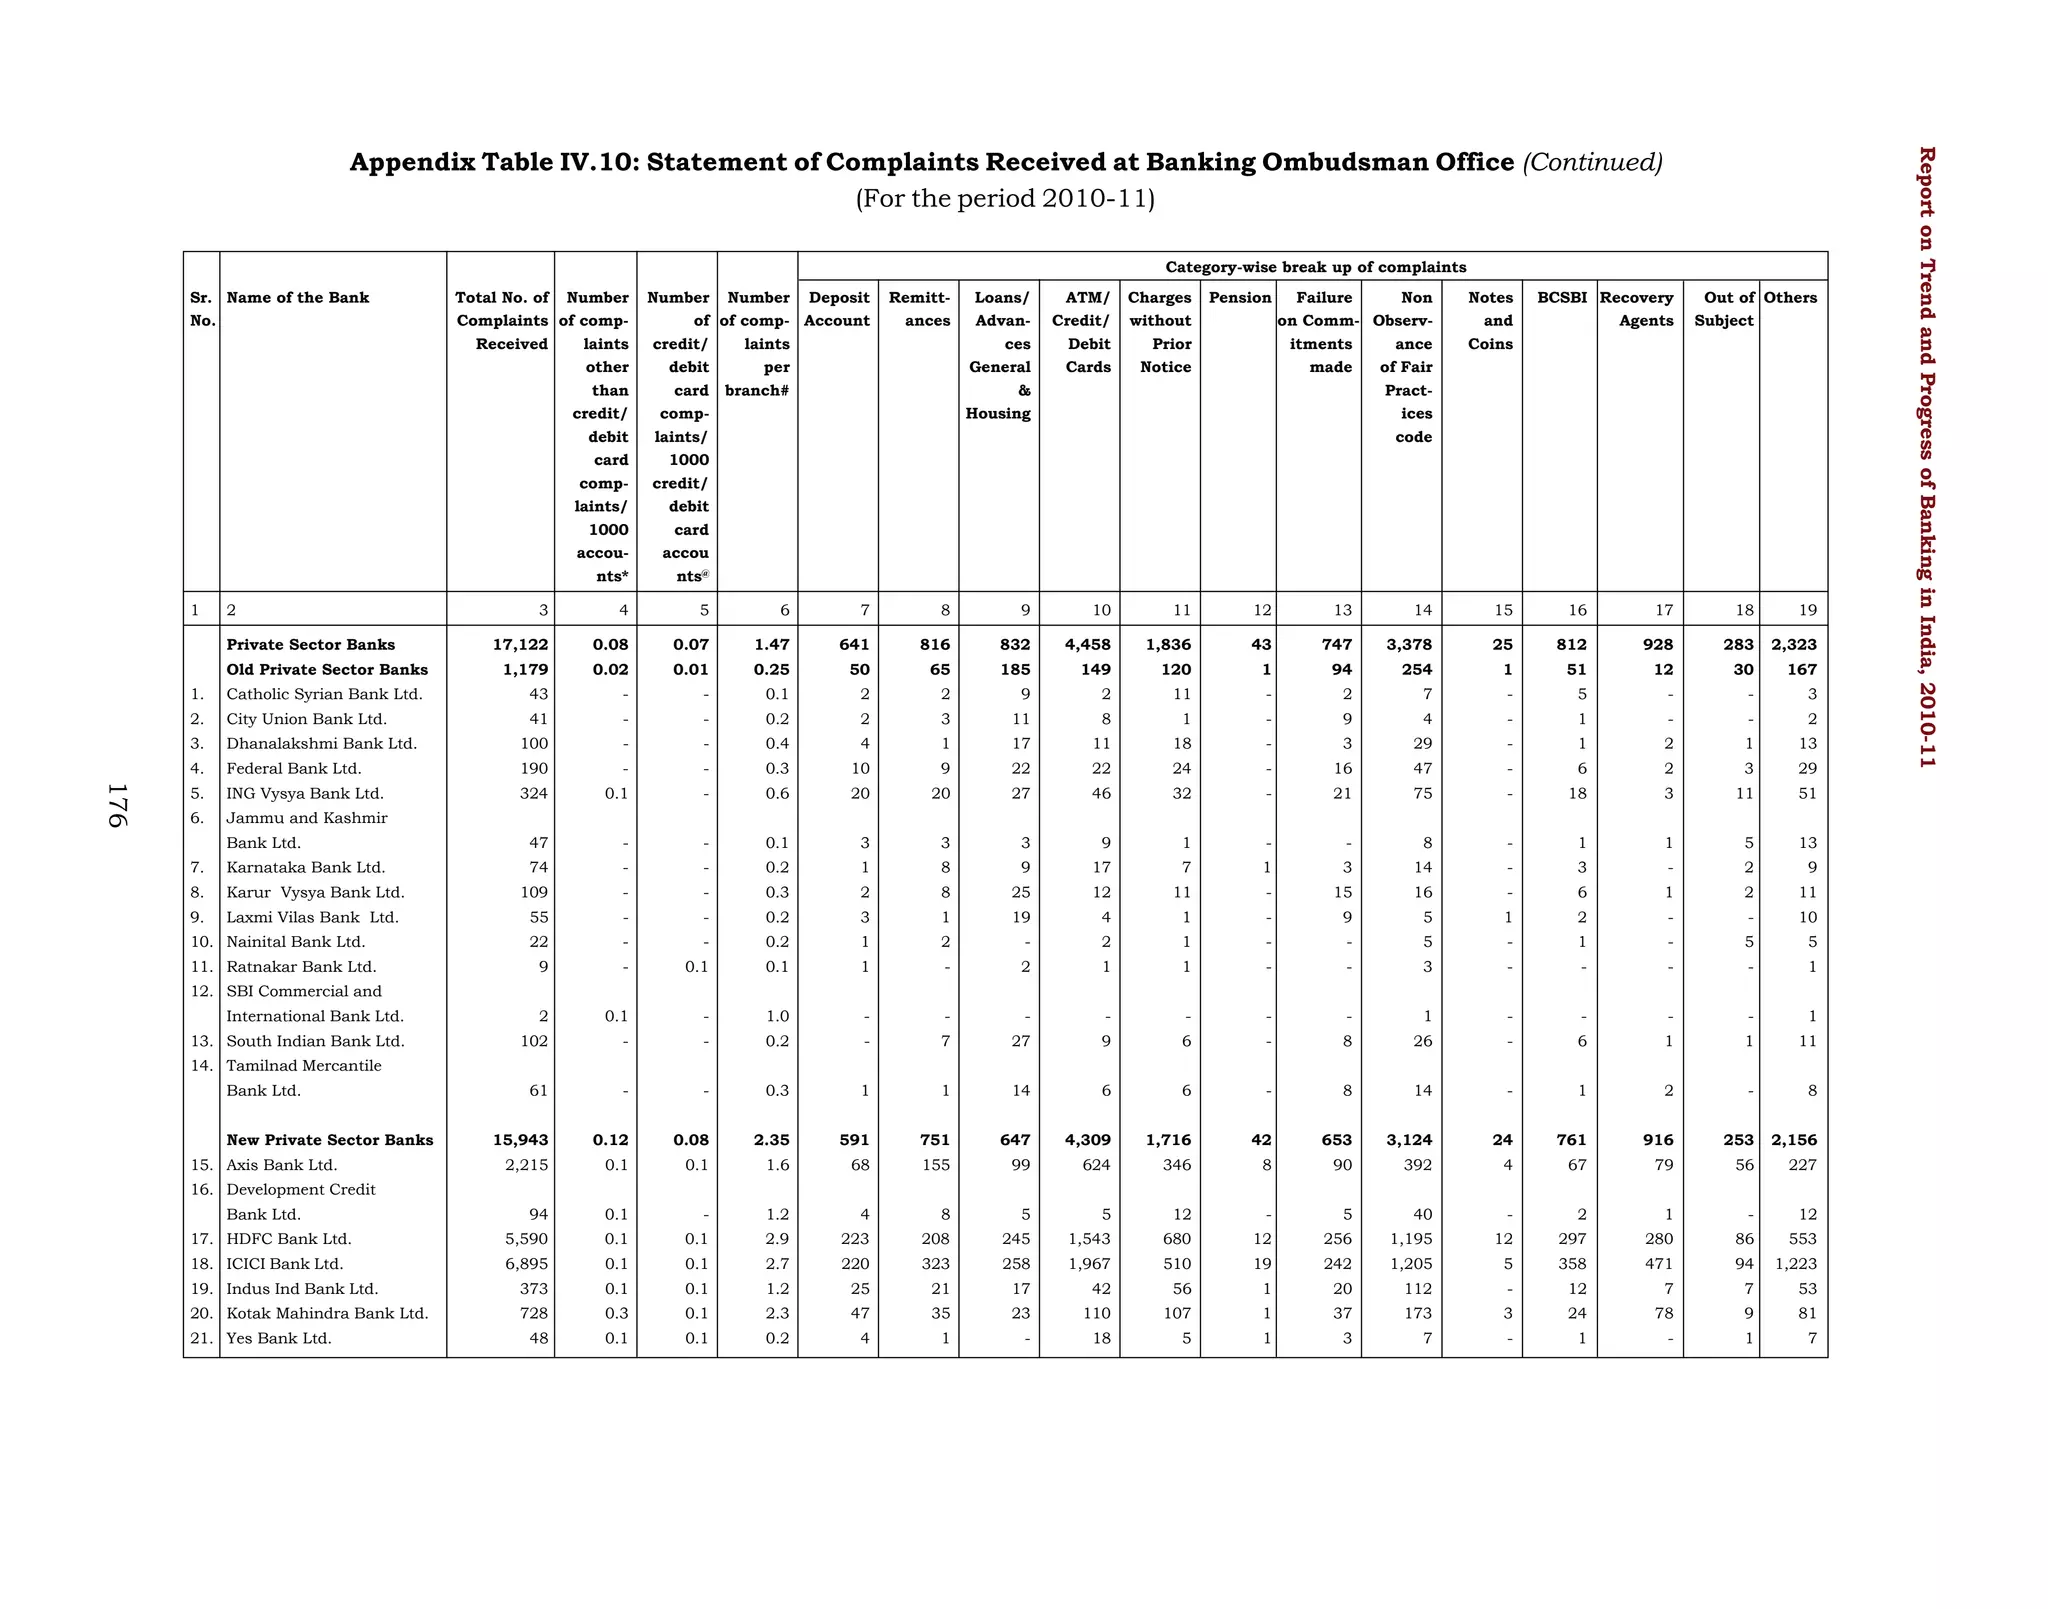
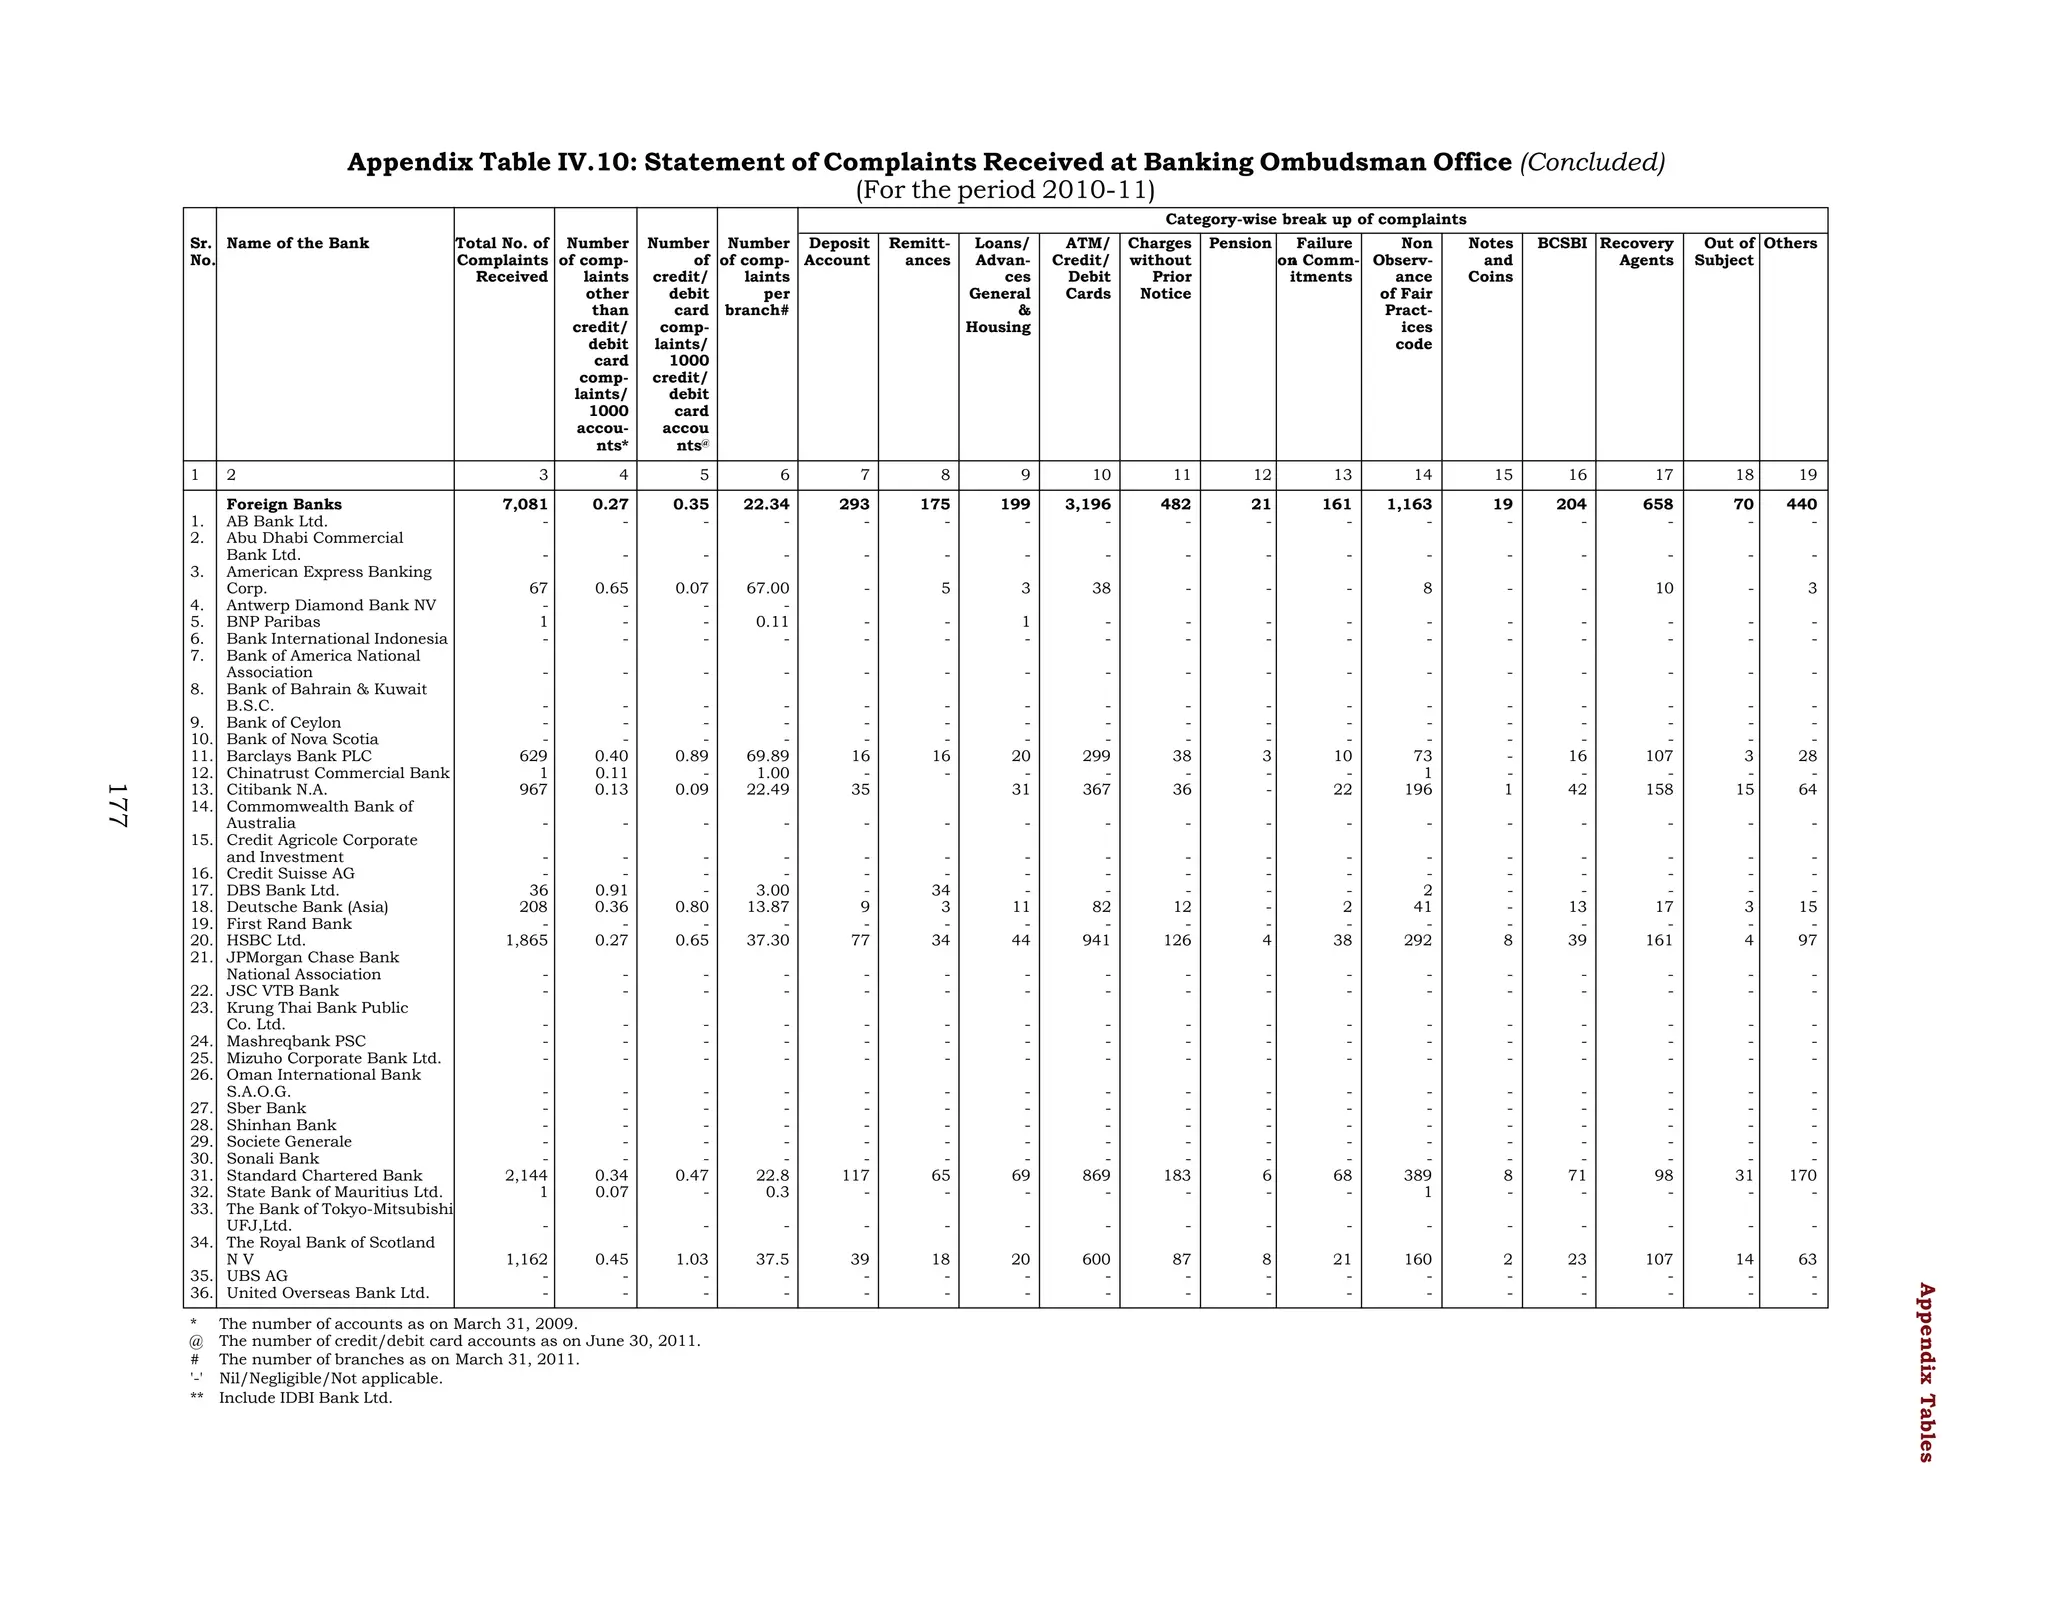
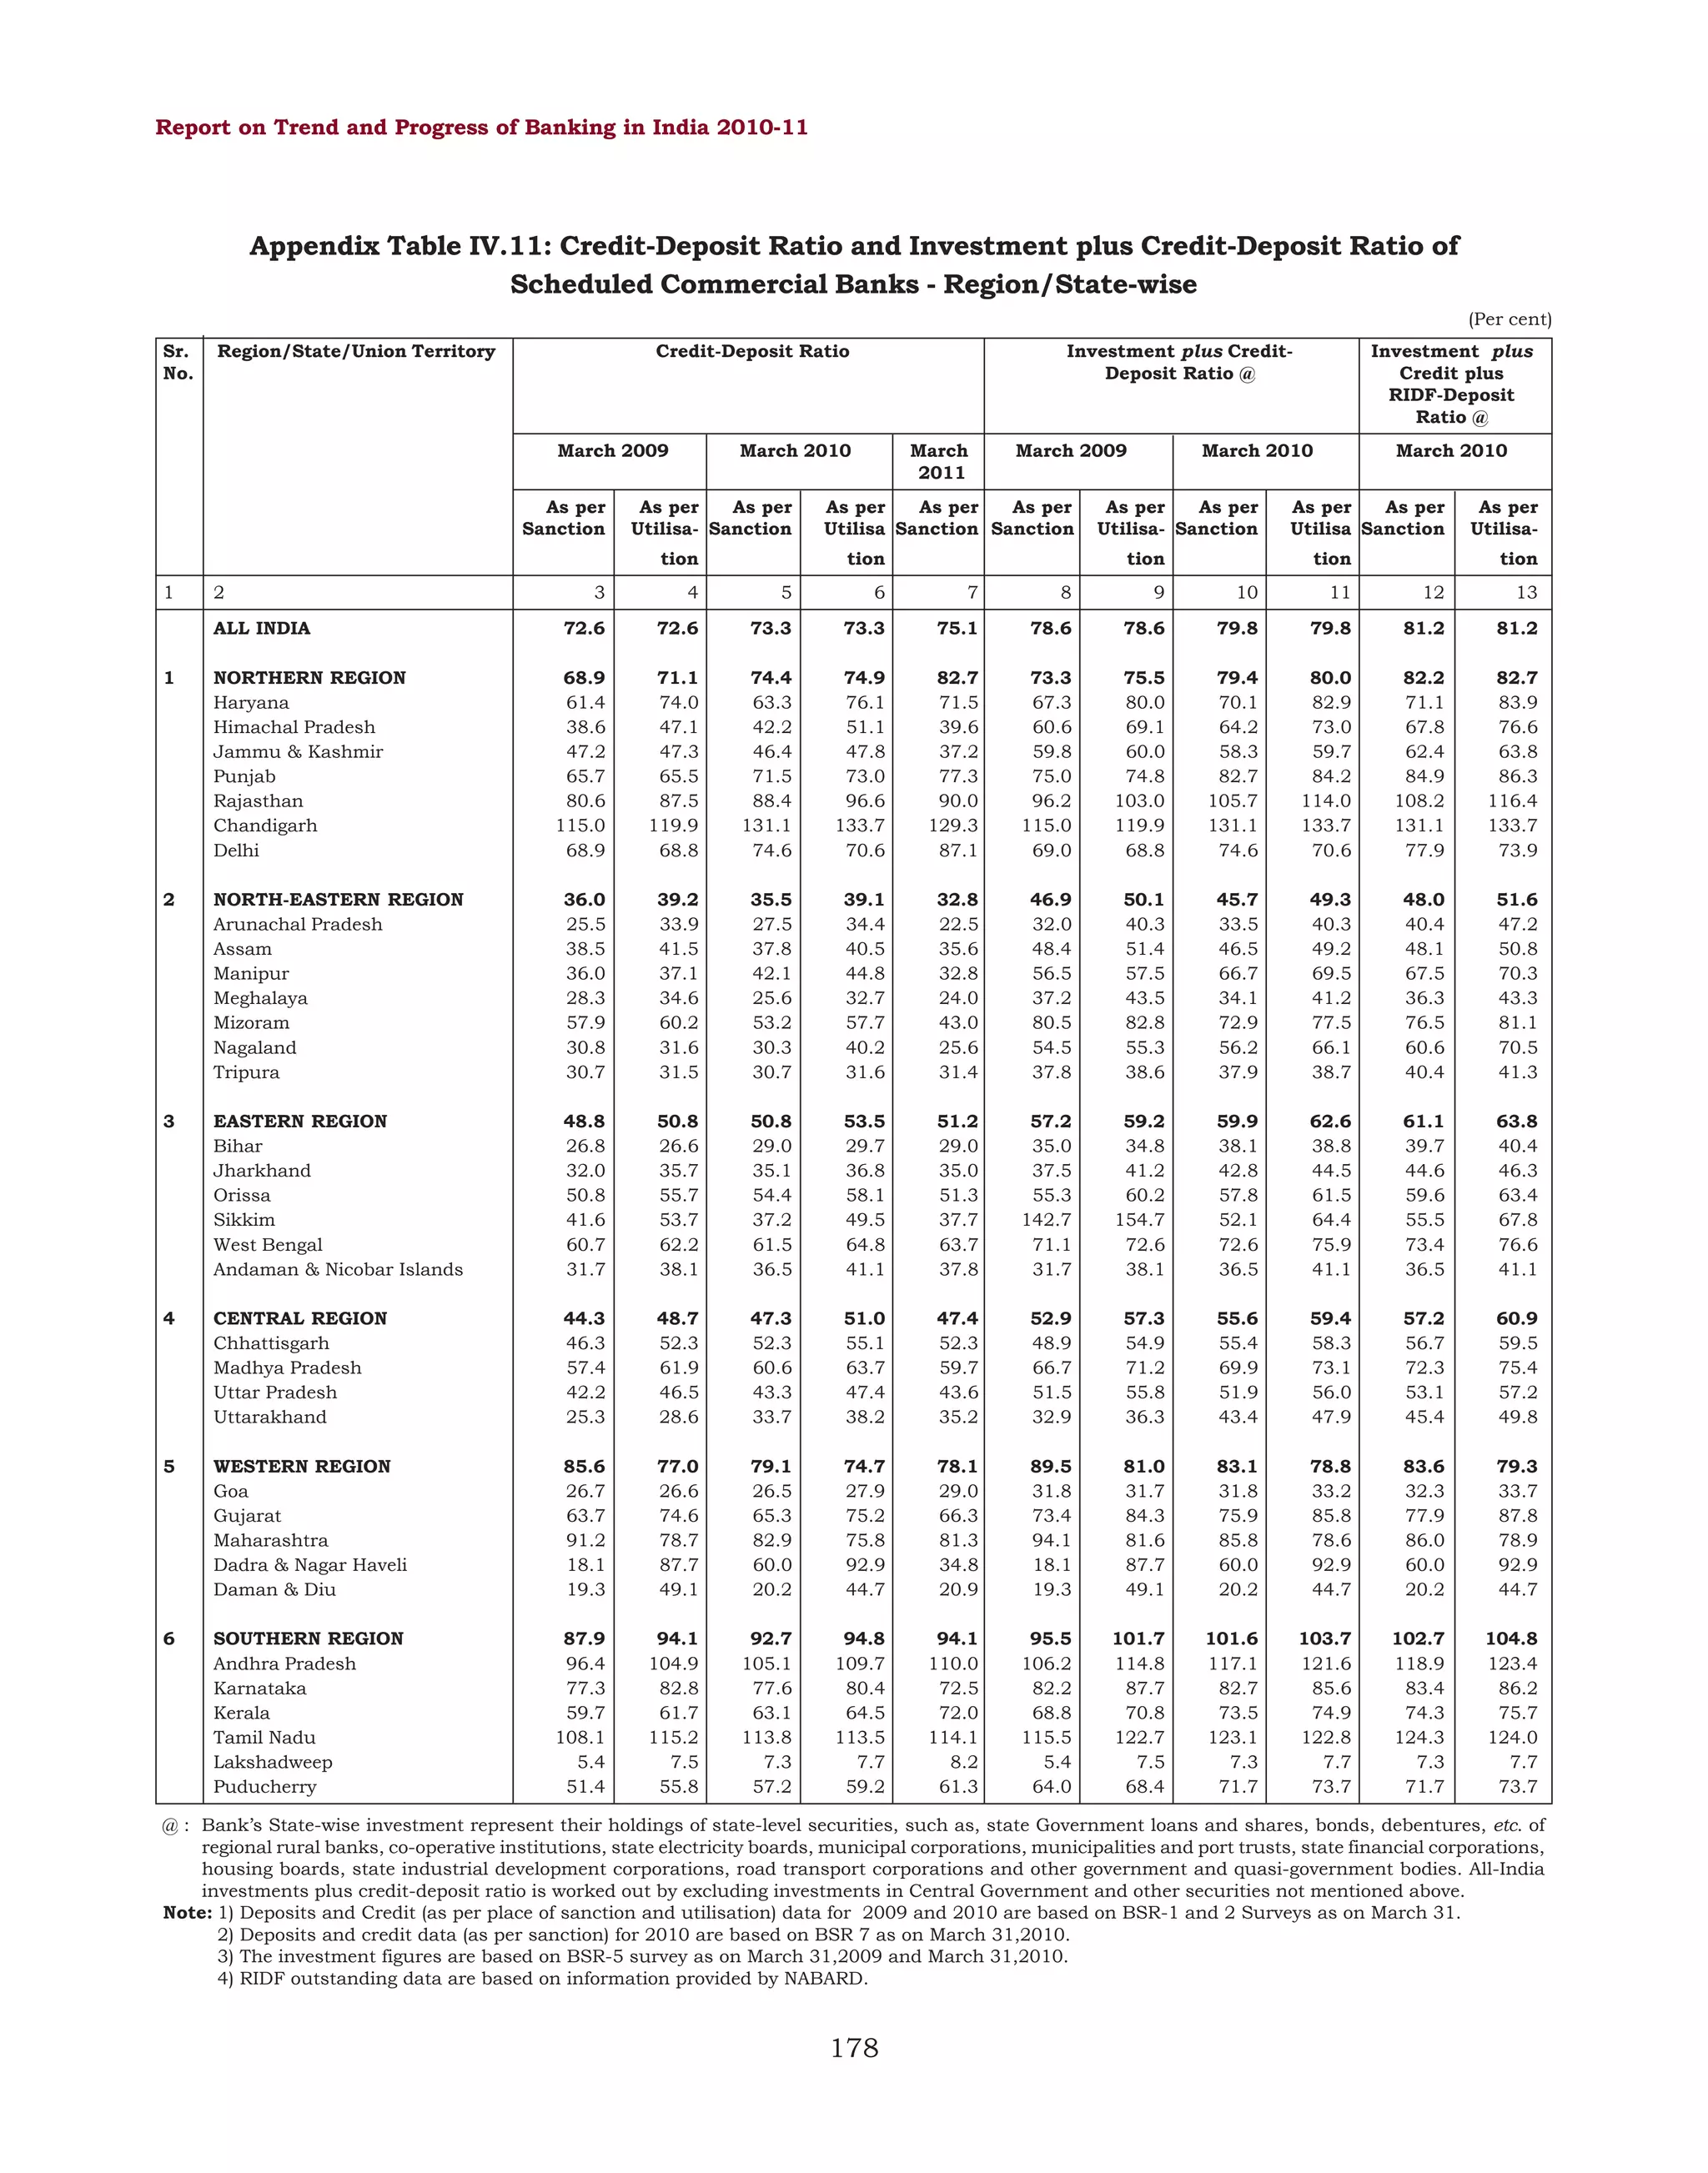
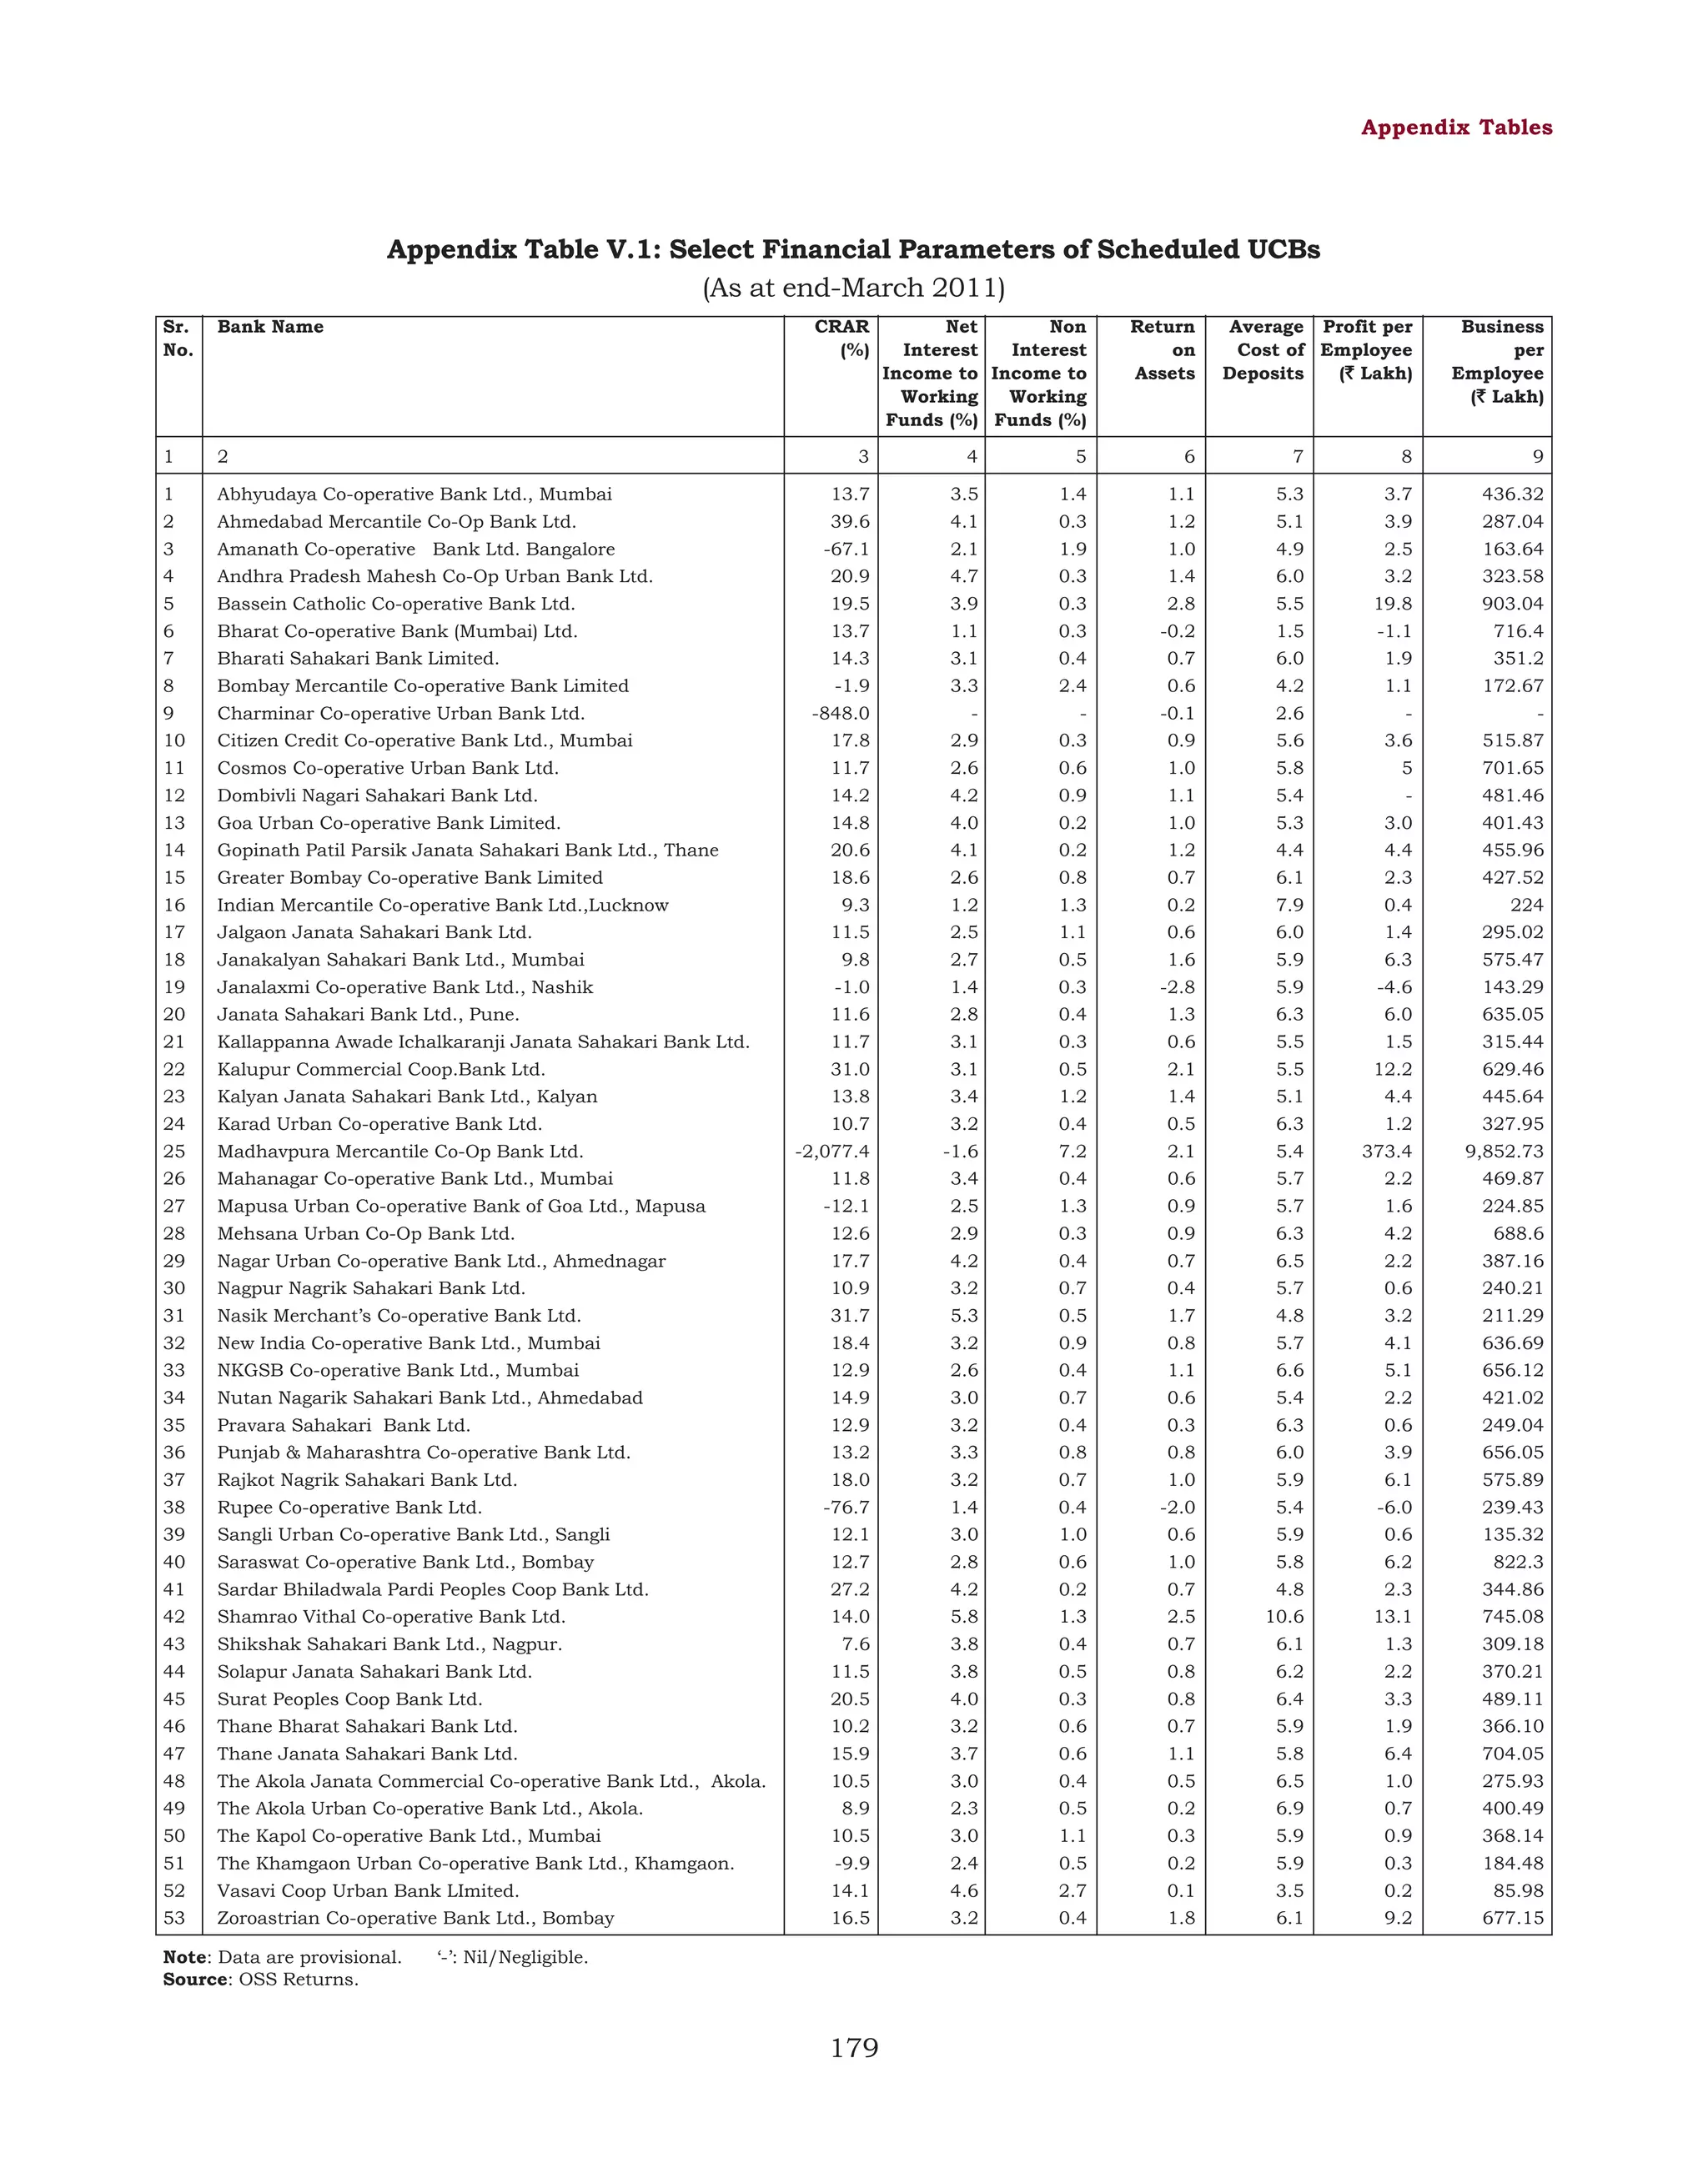
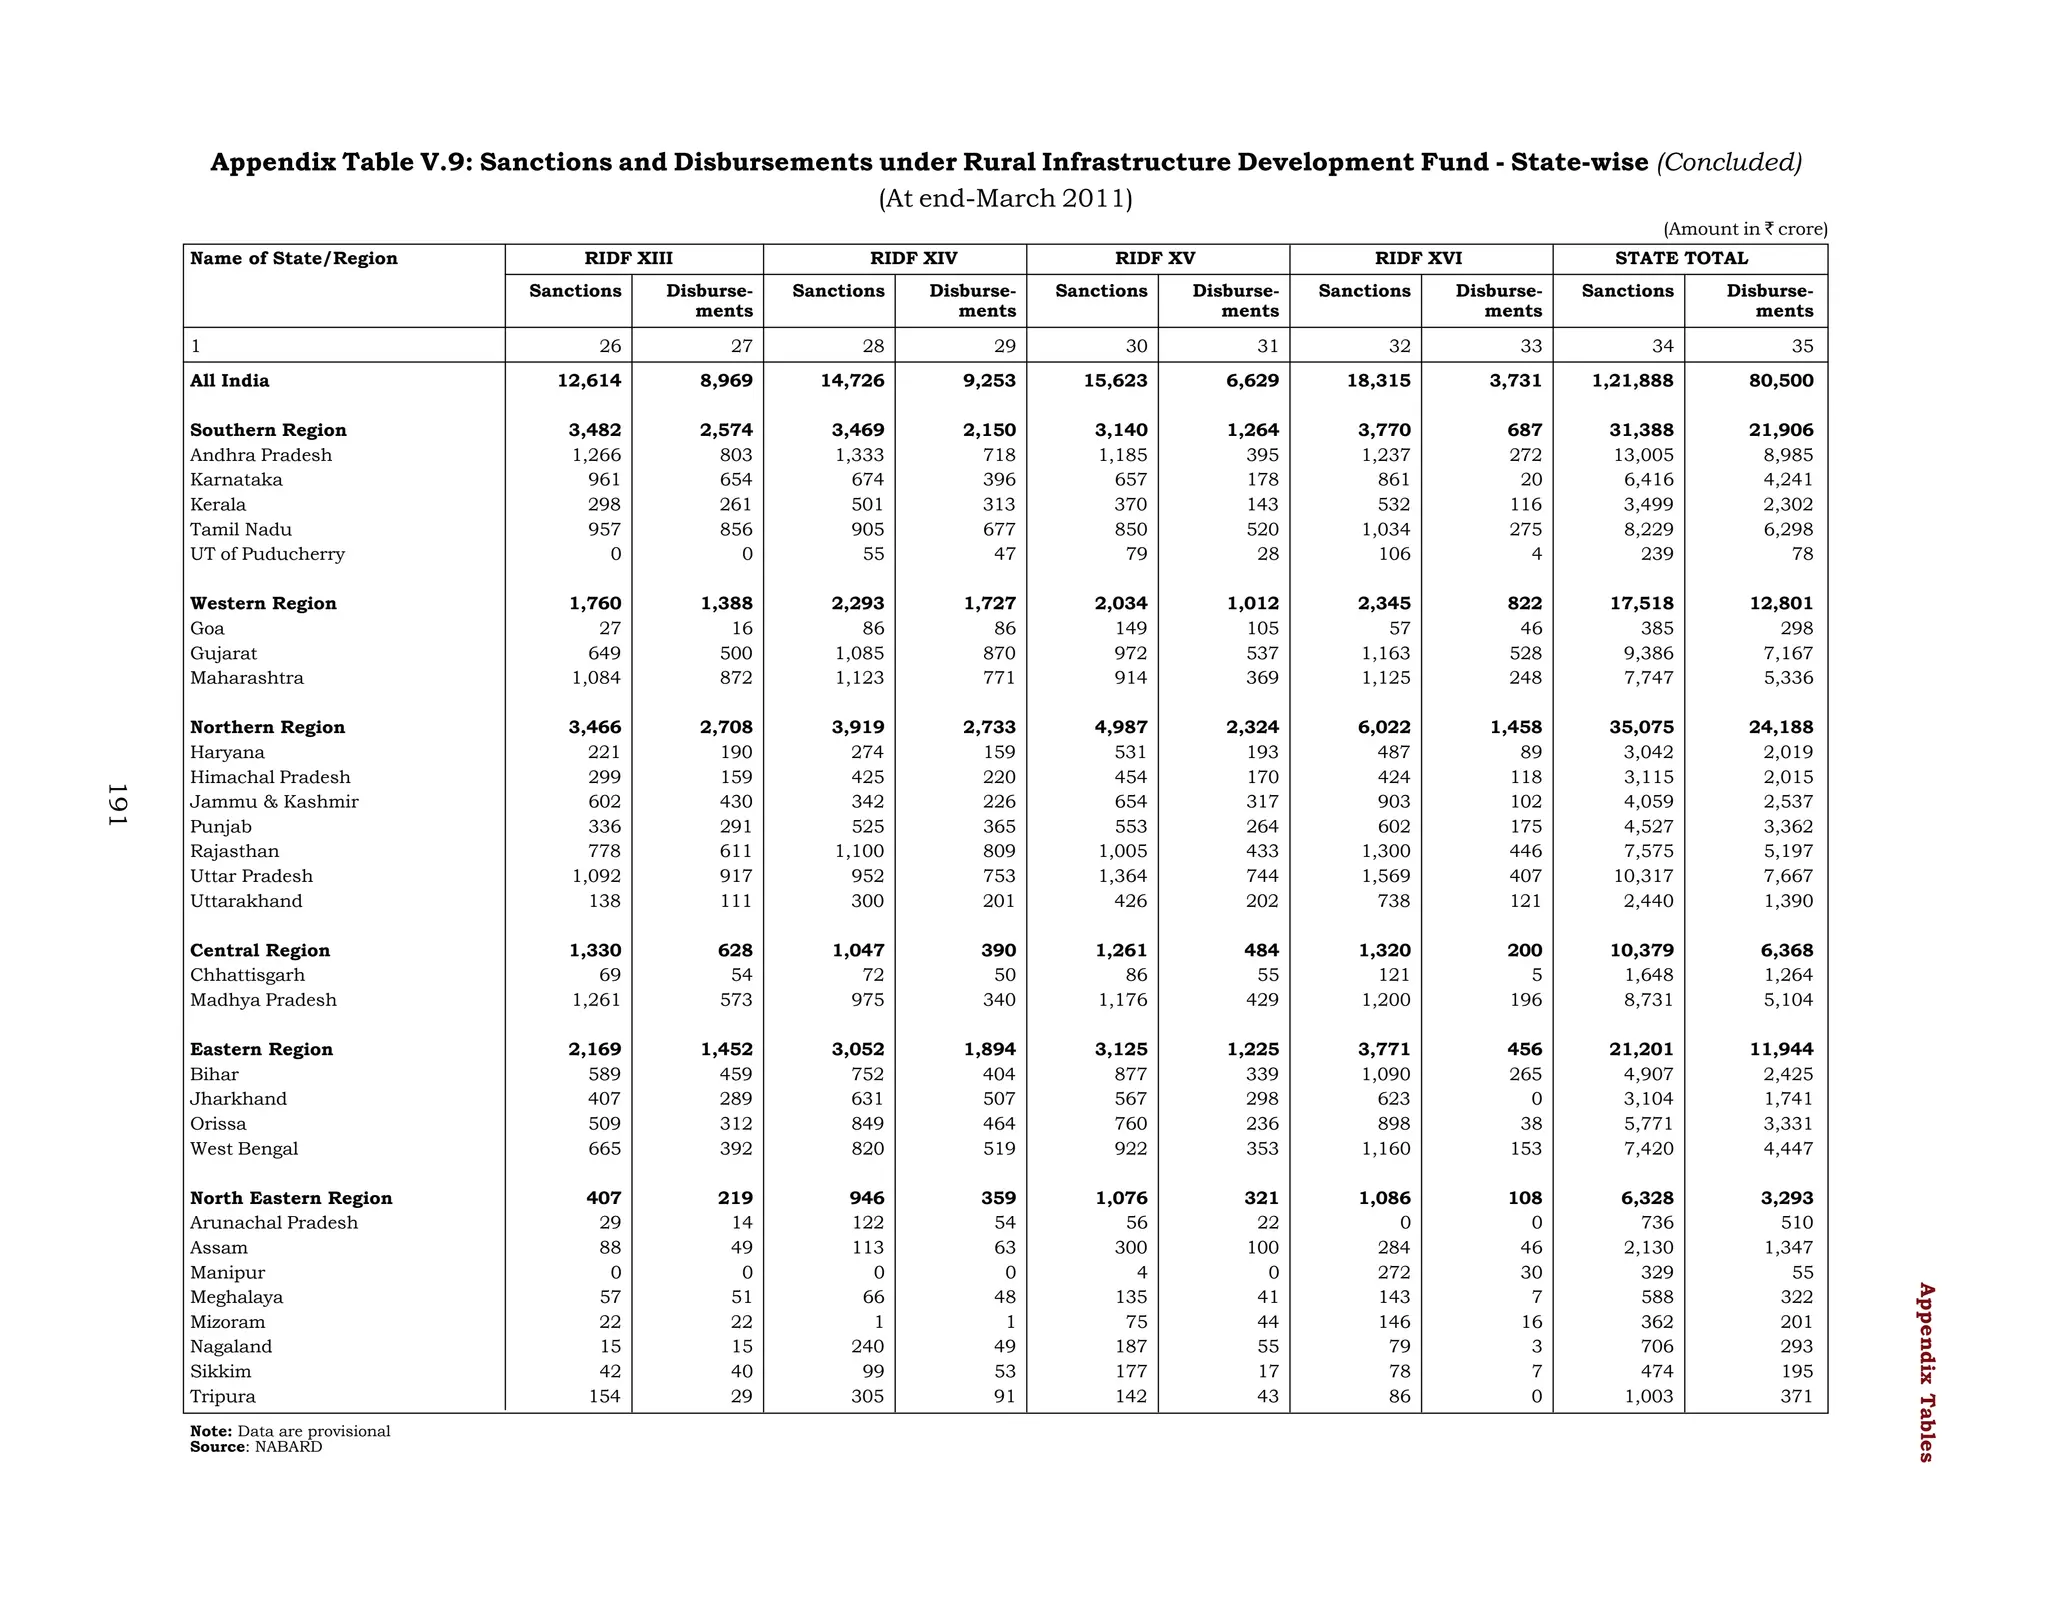
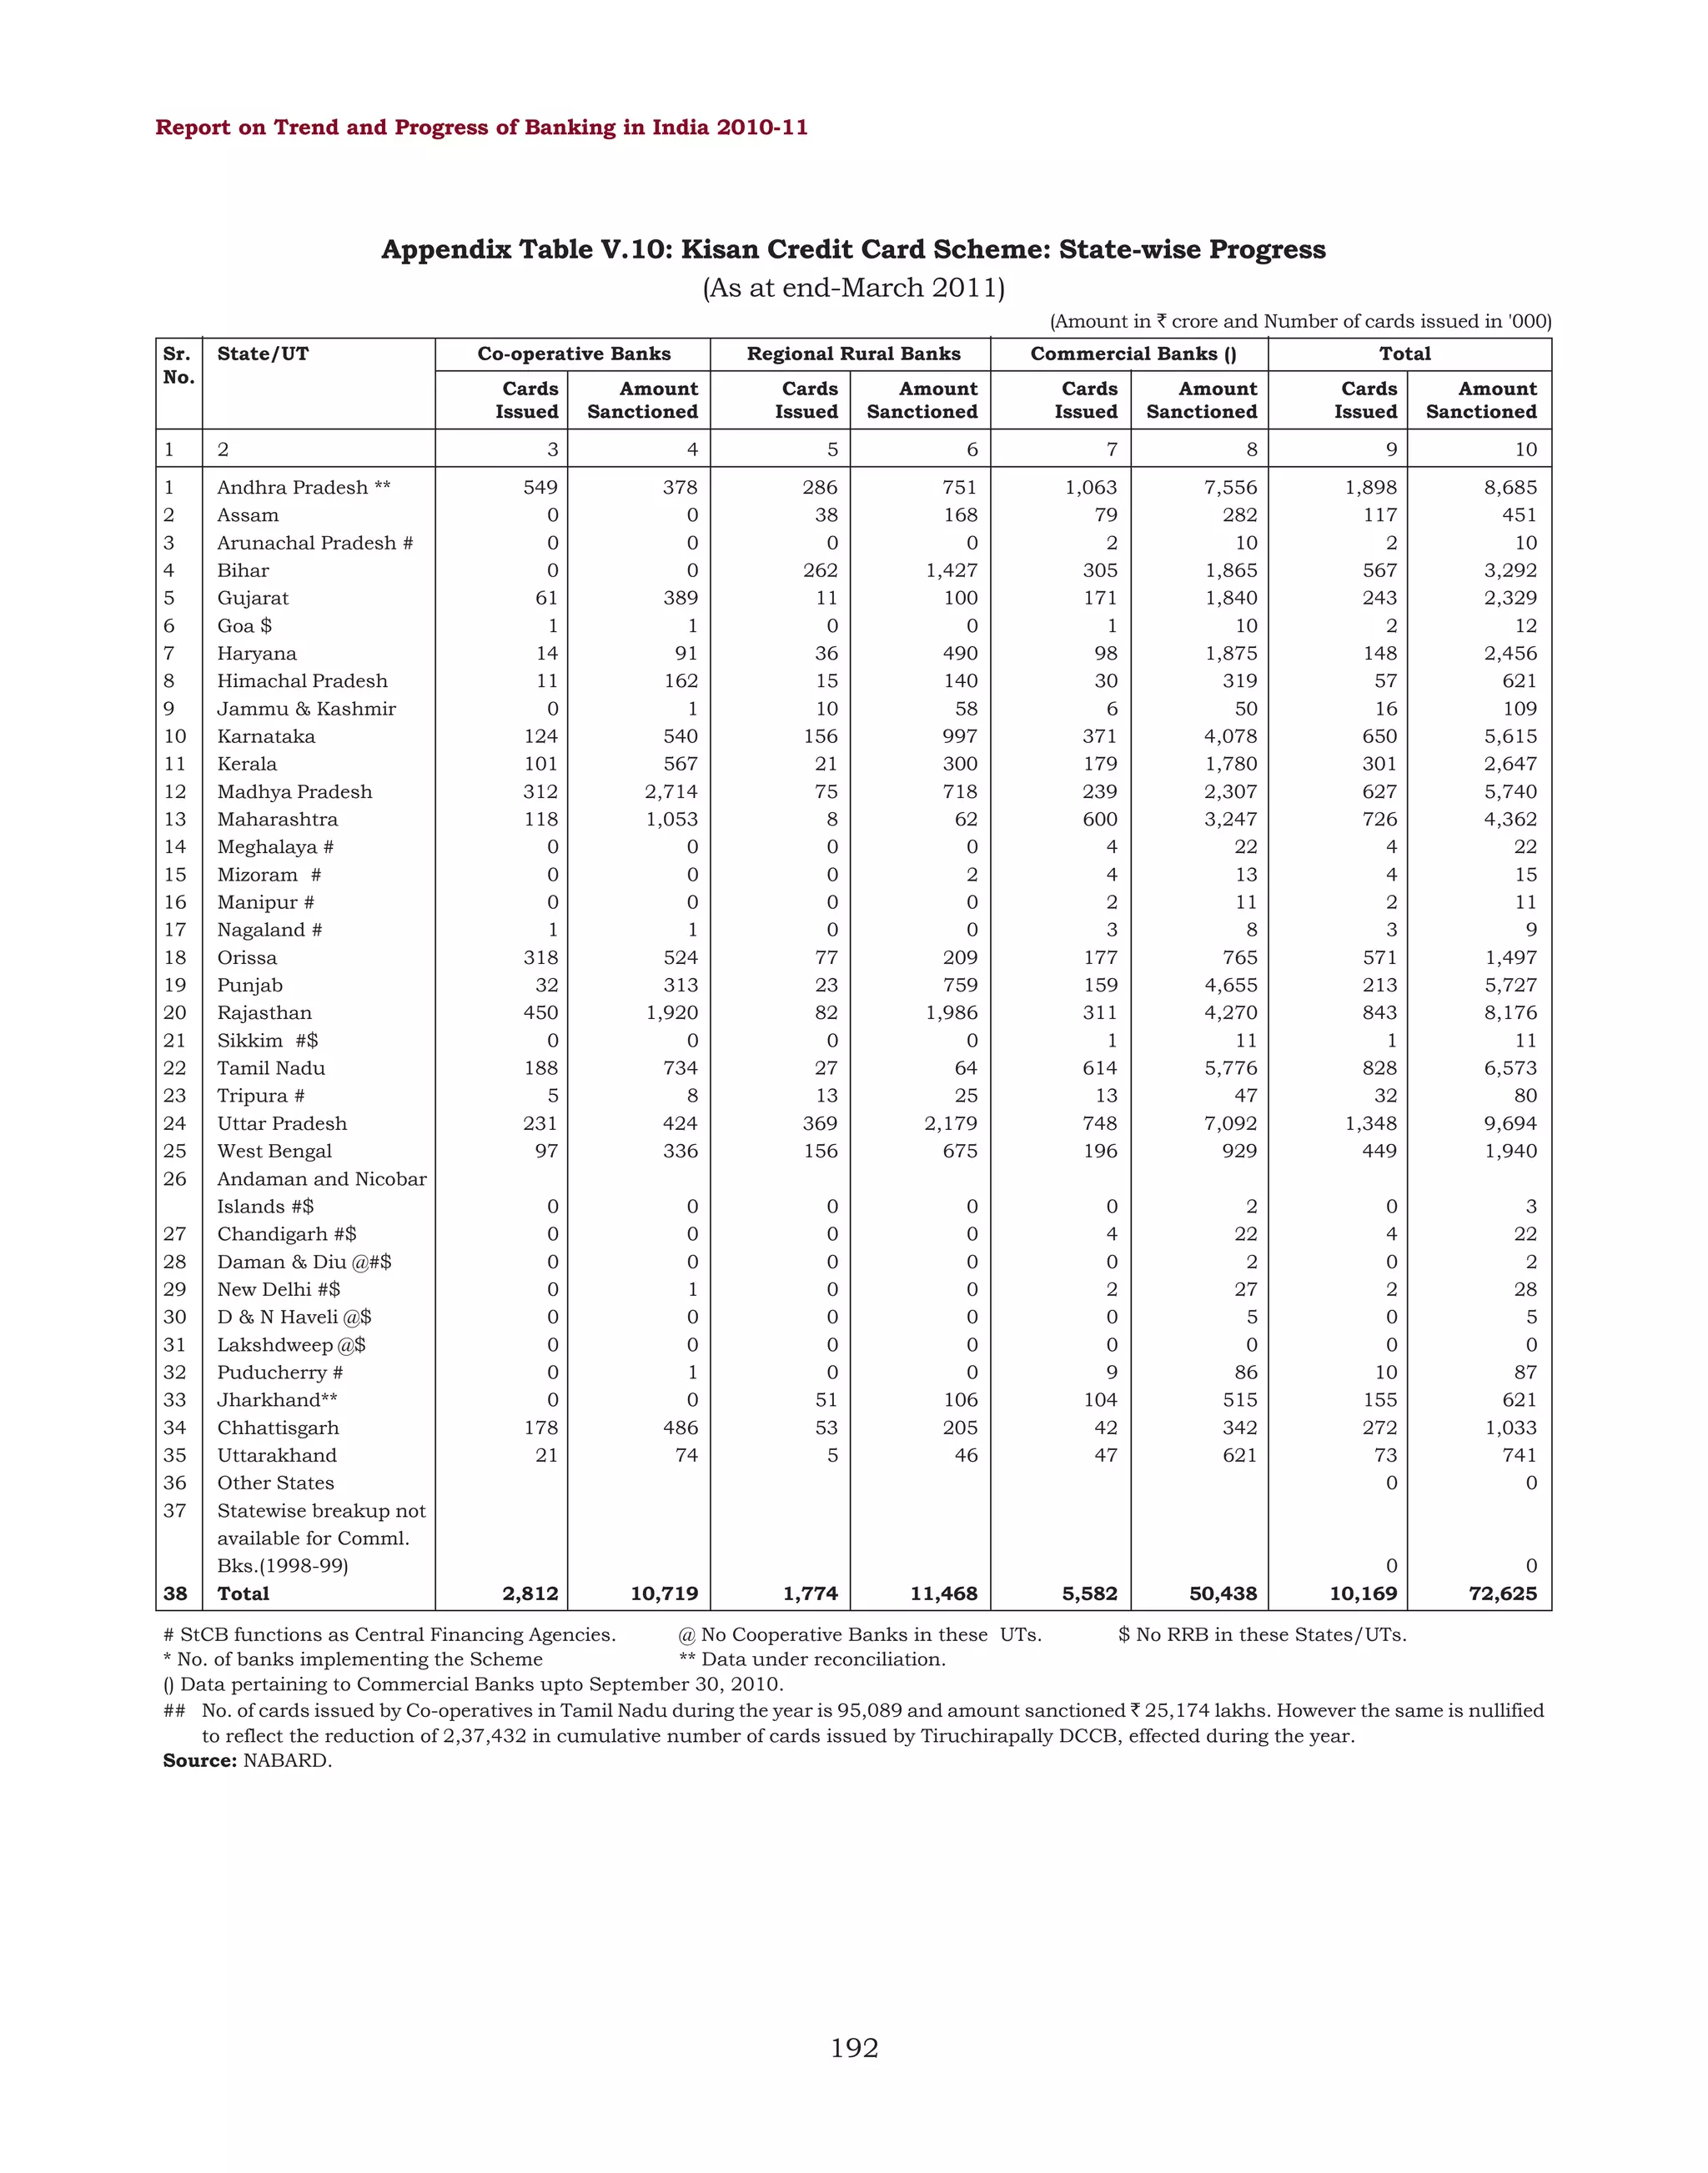
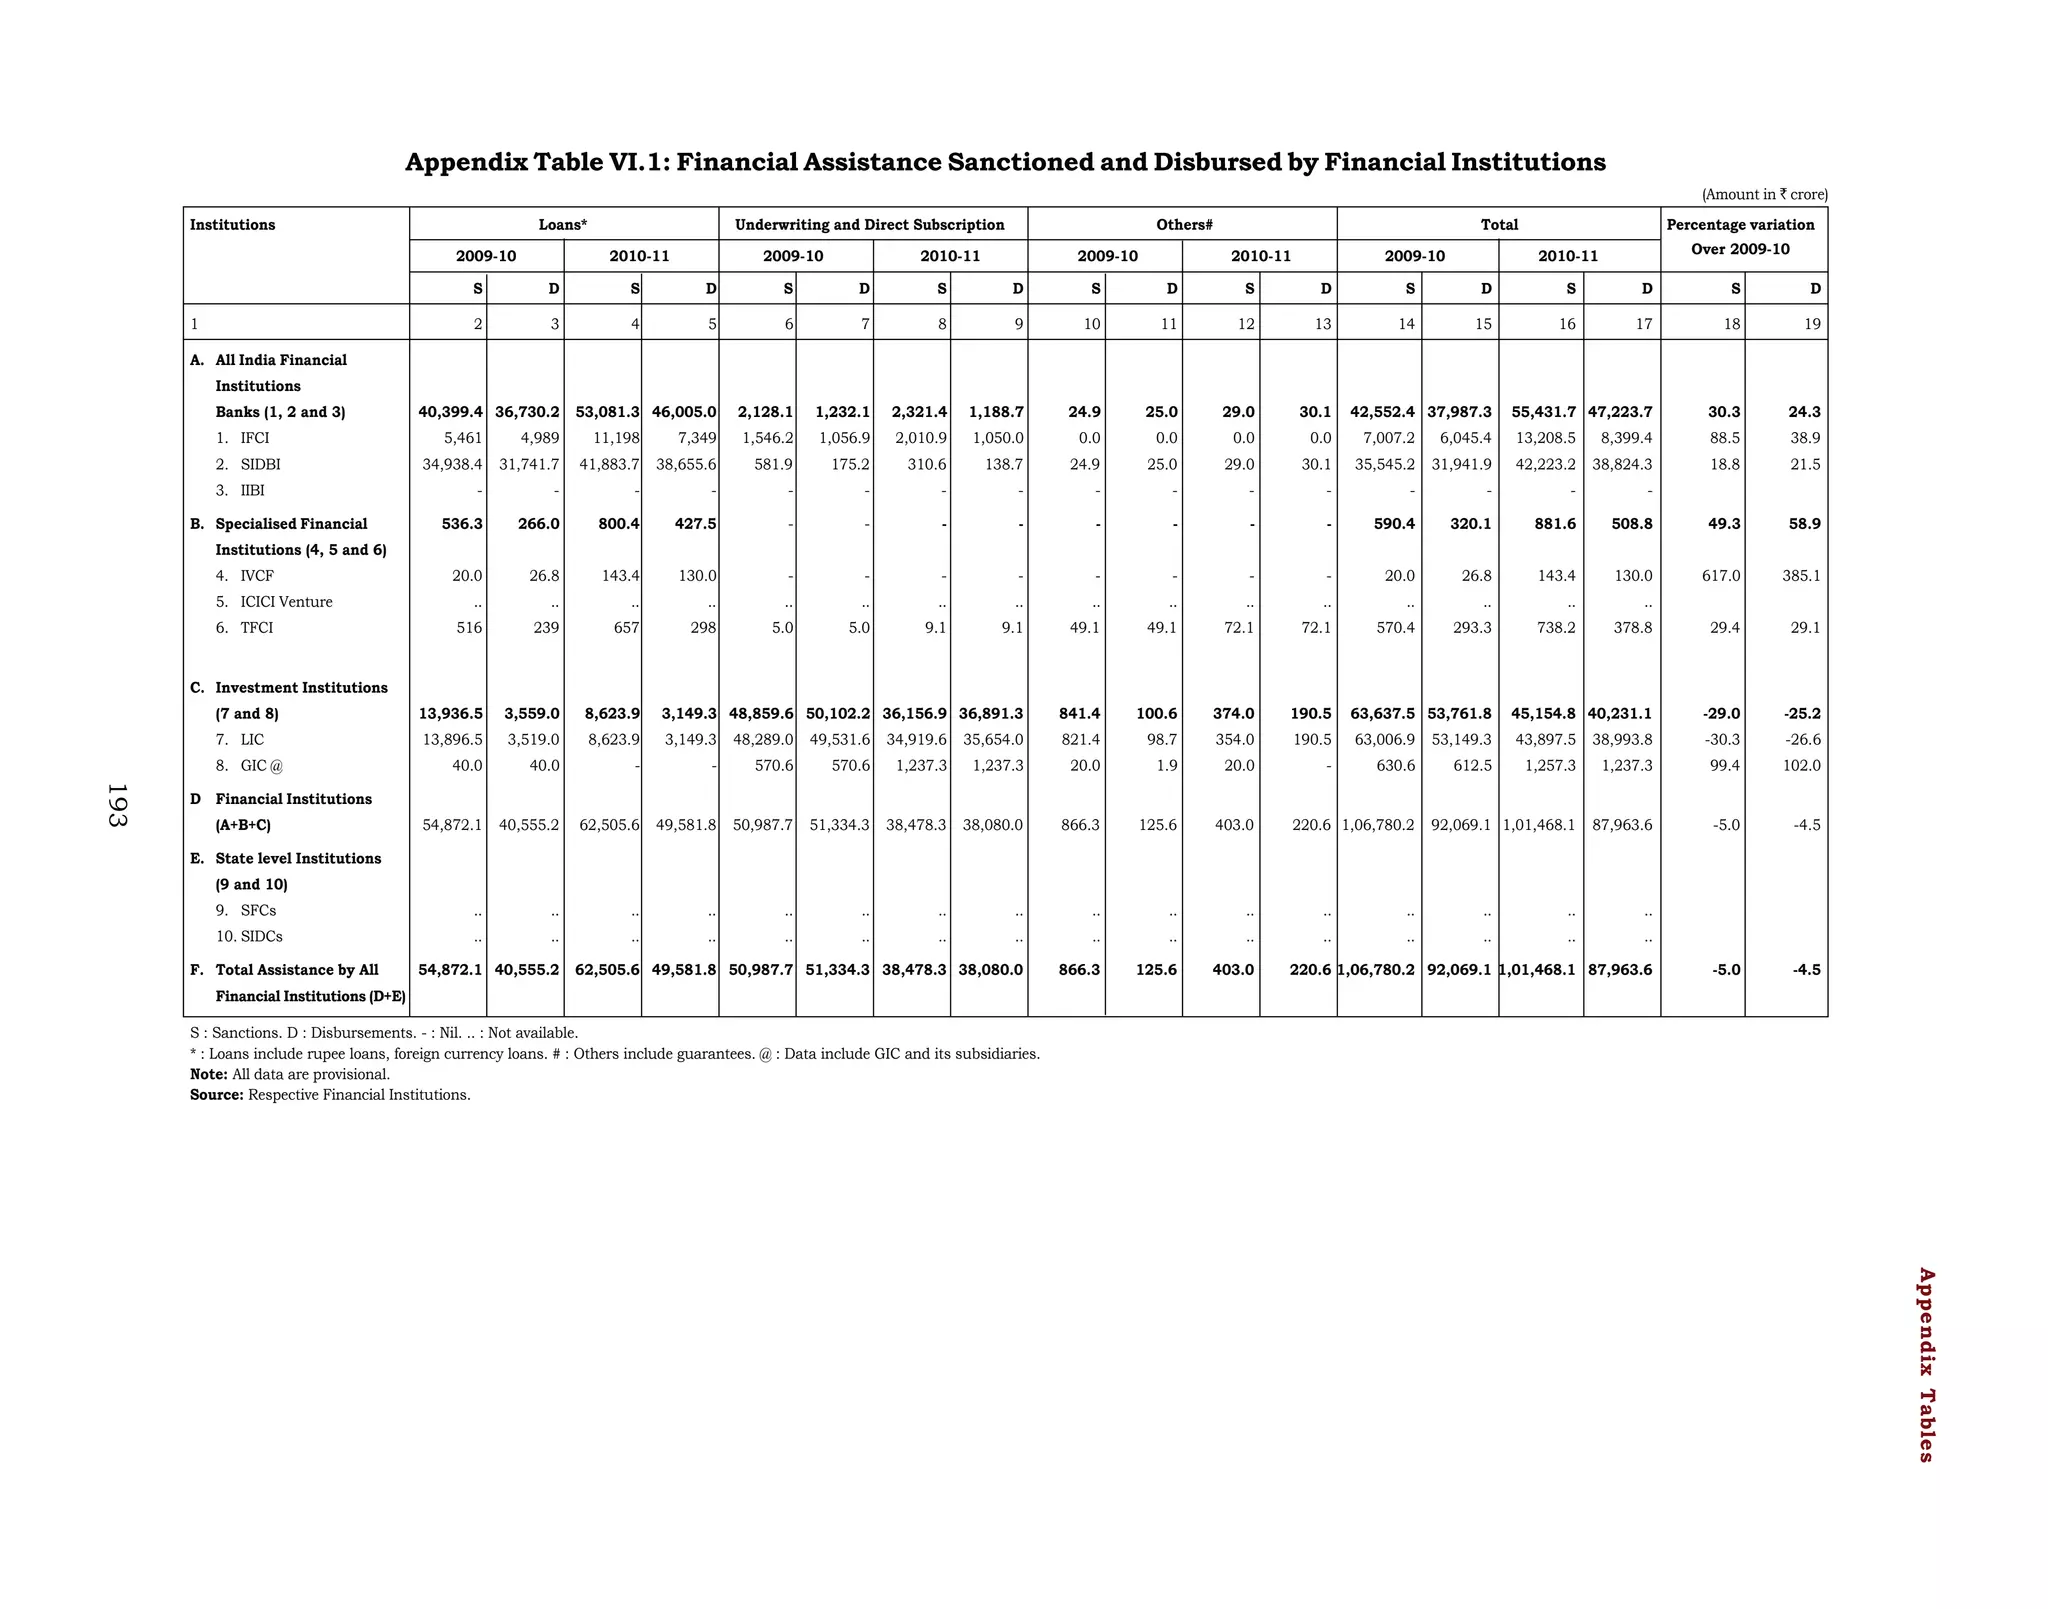
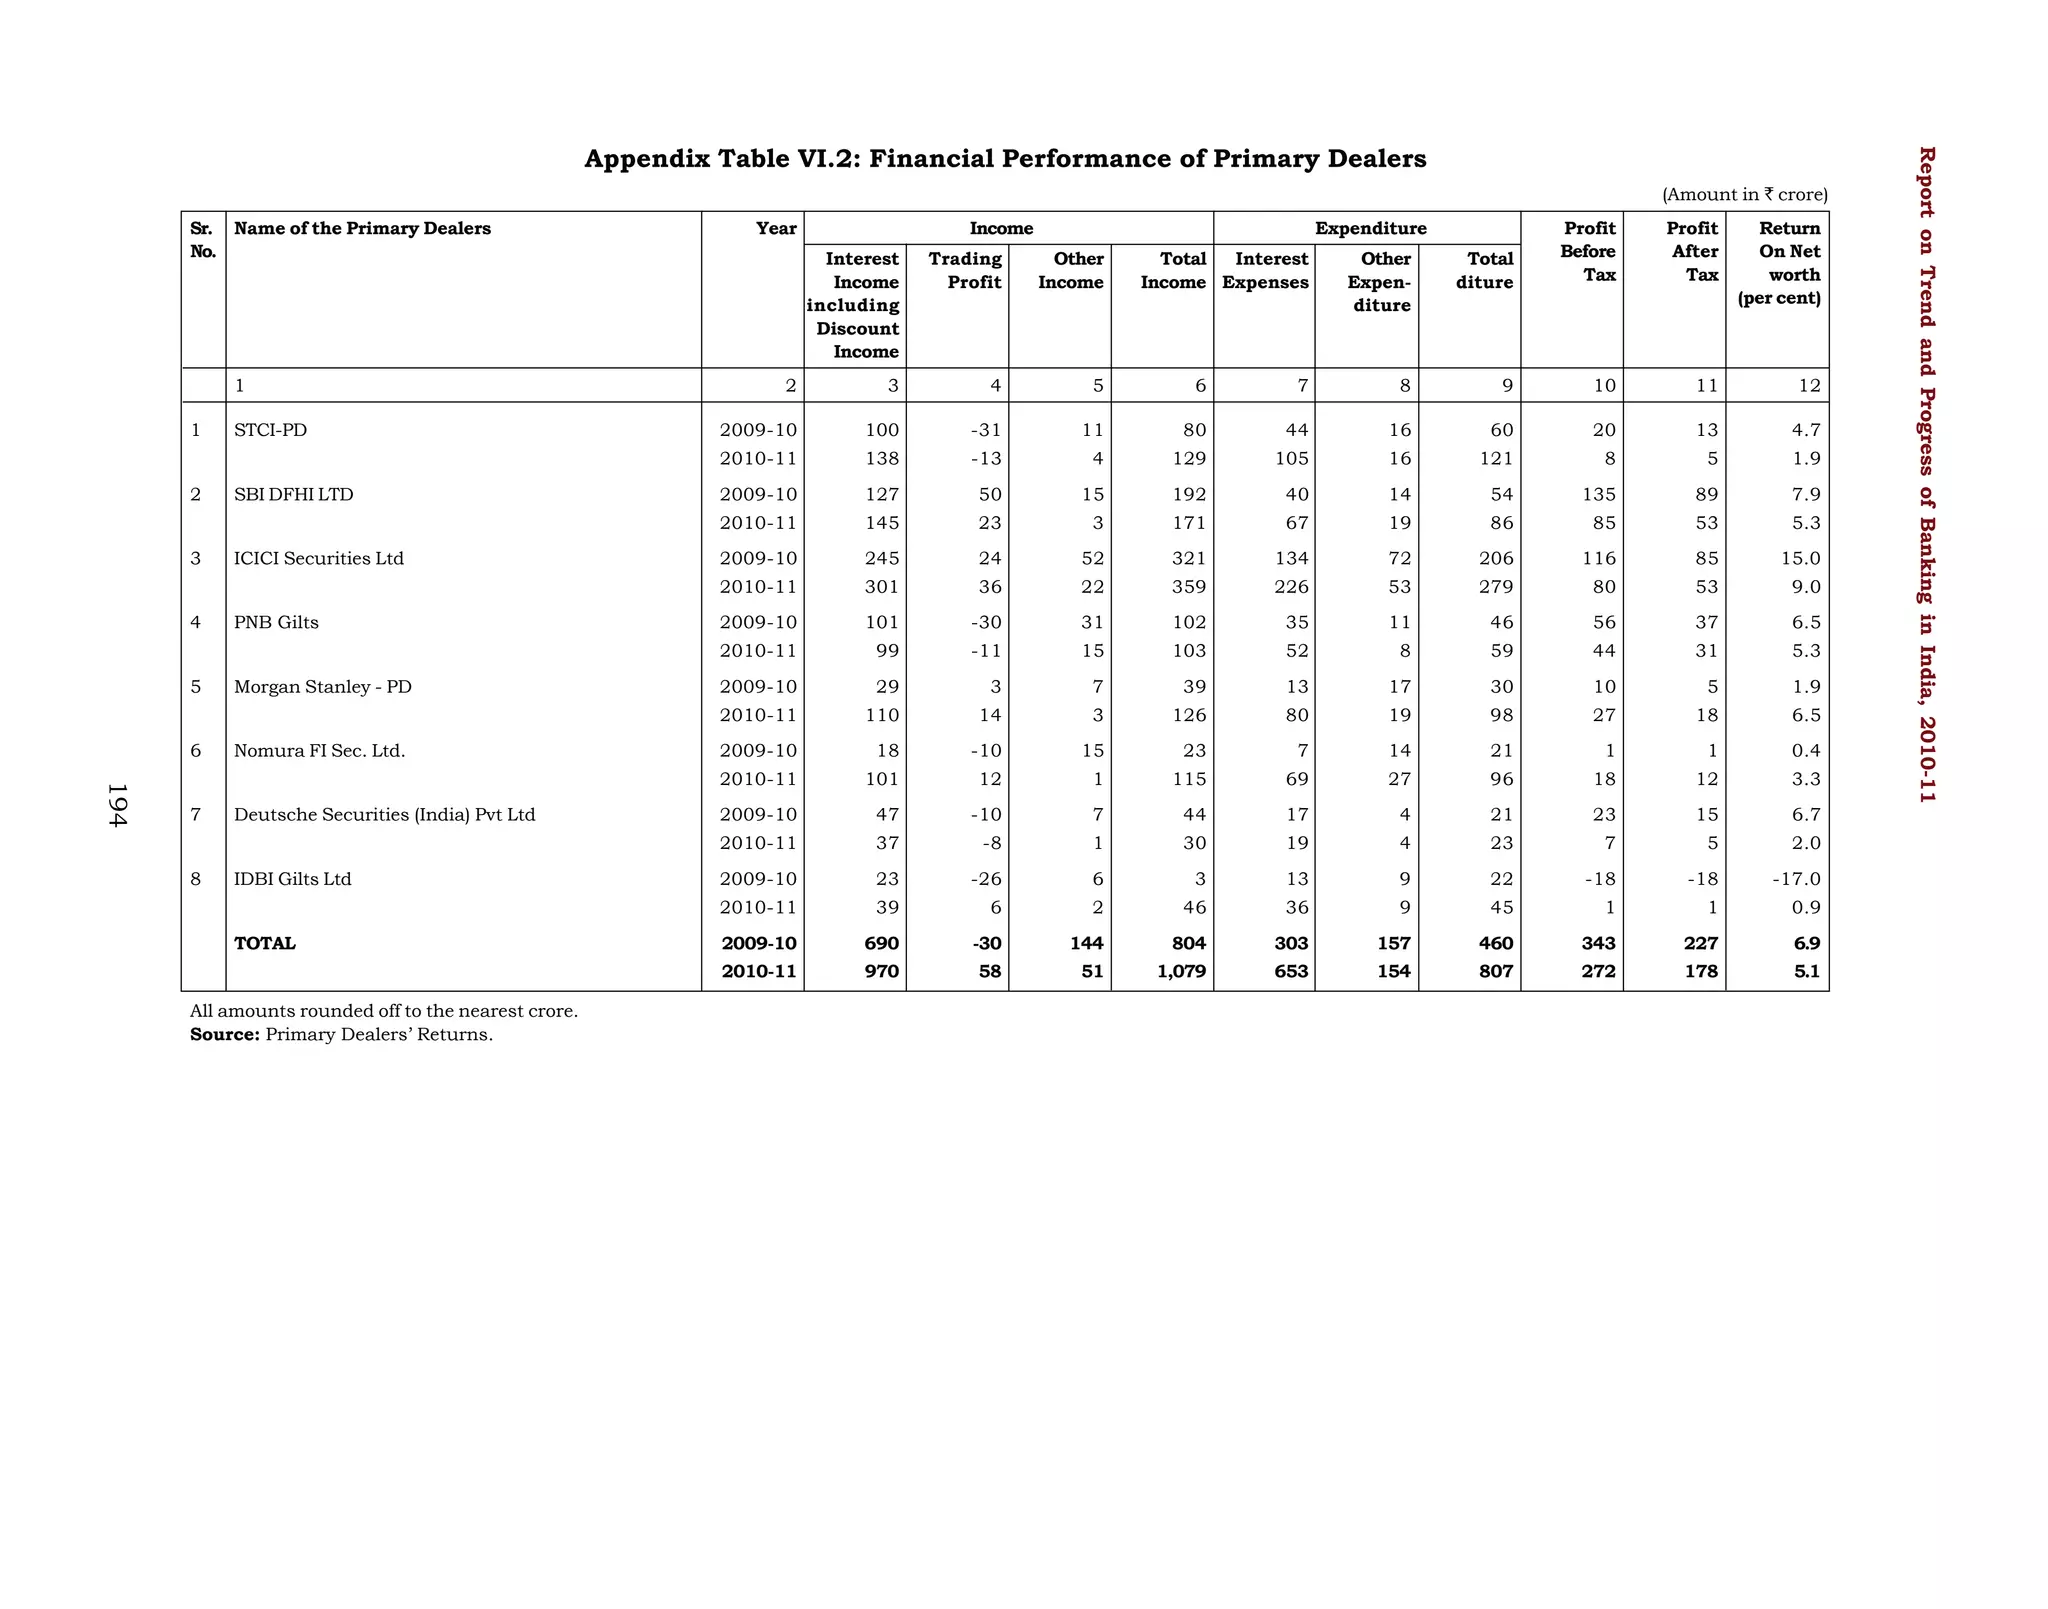
Download to read offline


![Operations and Performance of Commercial Banks
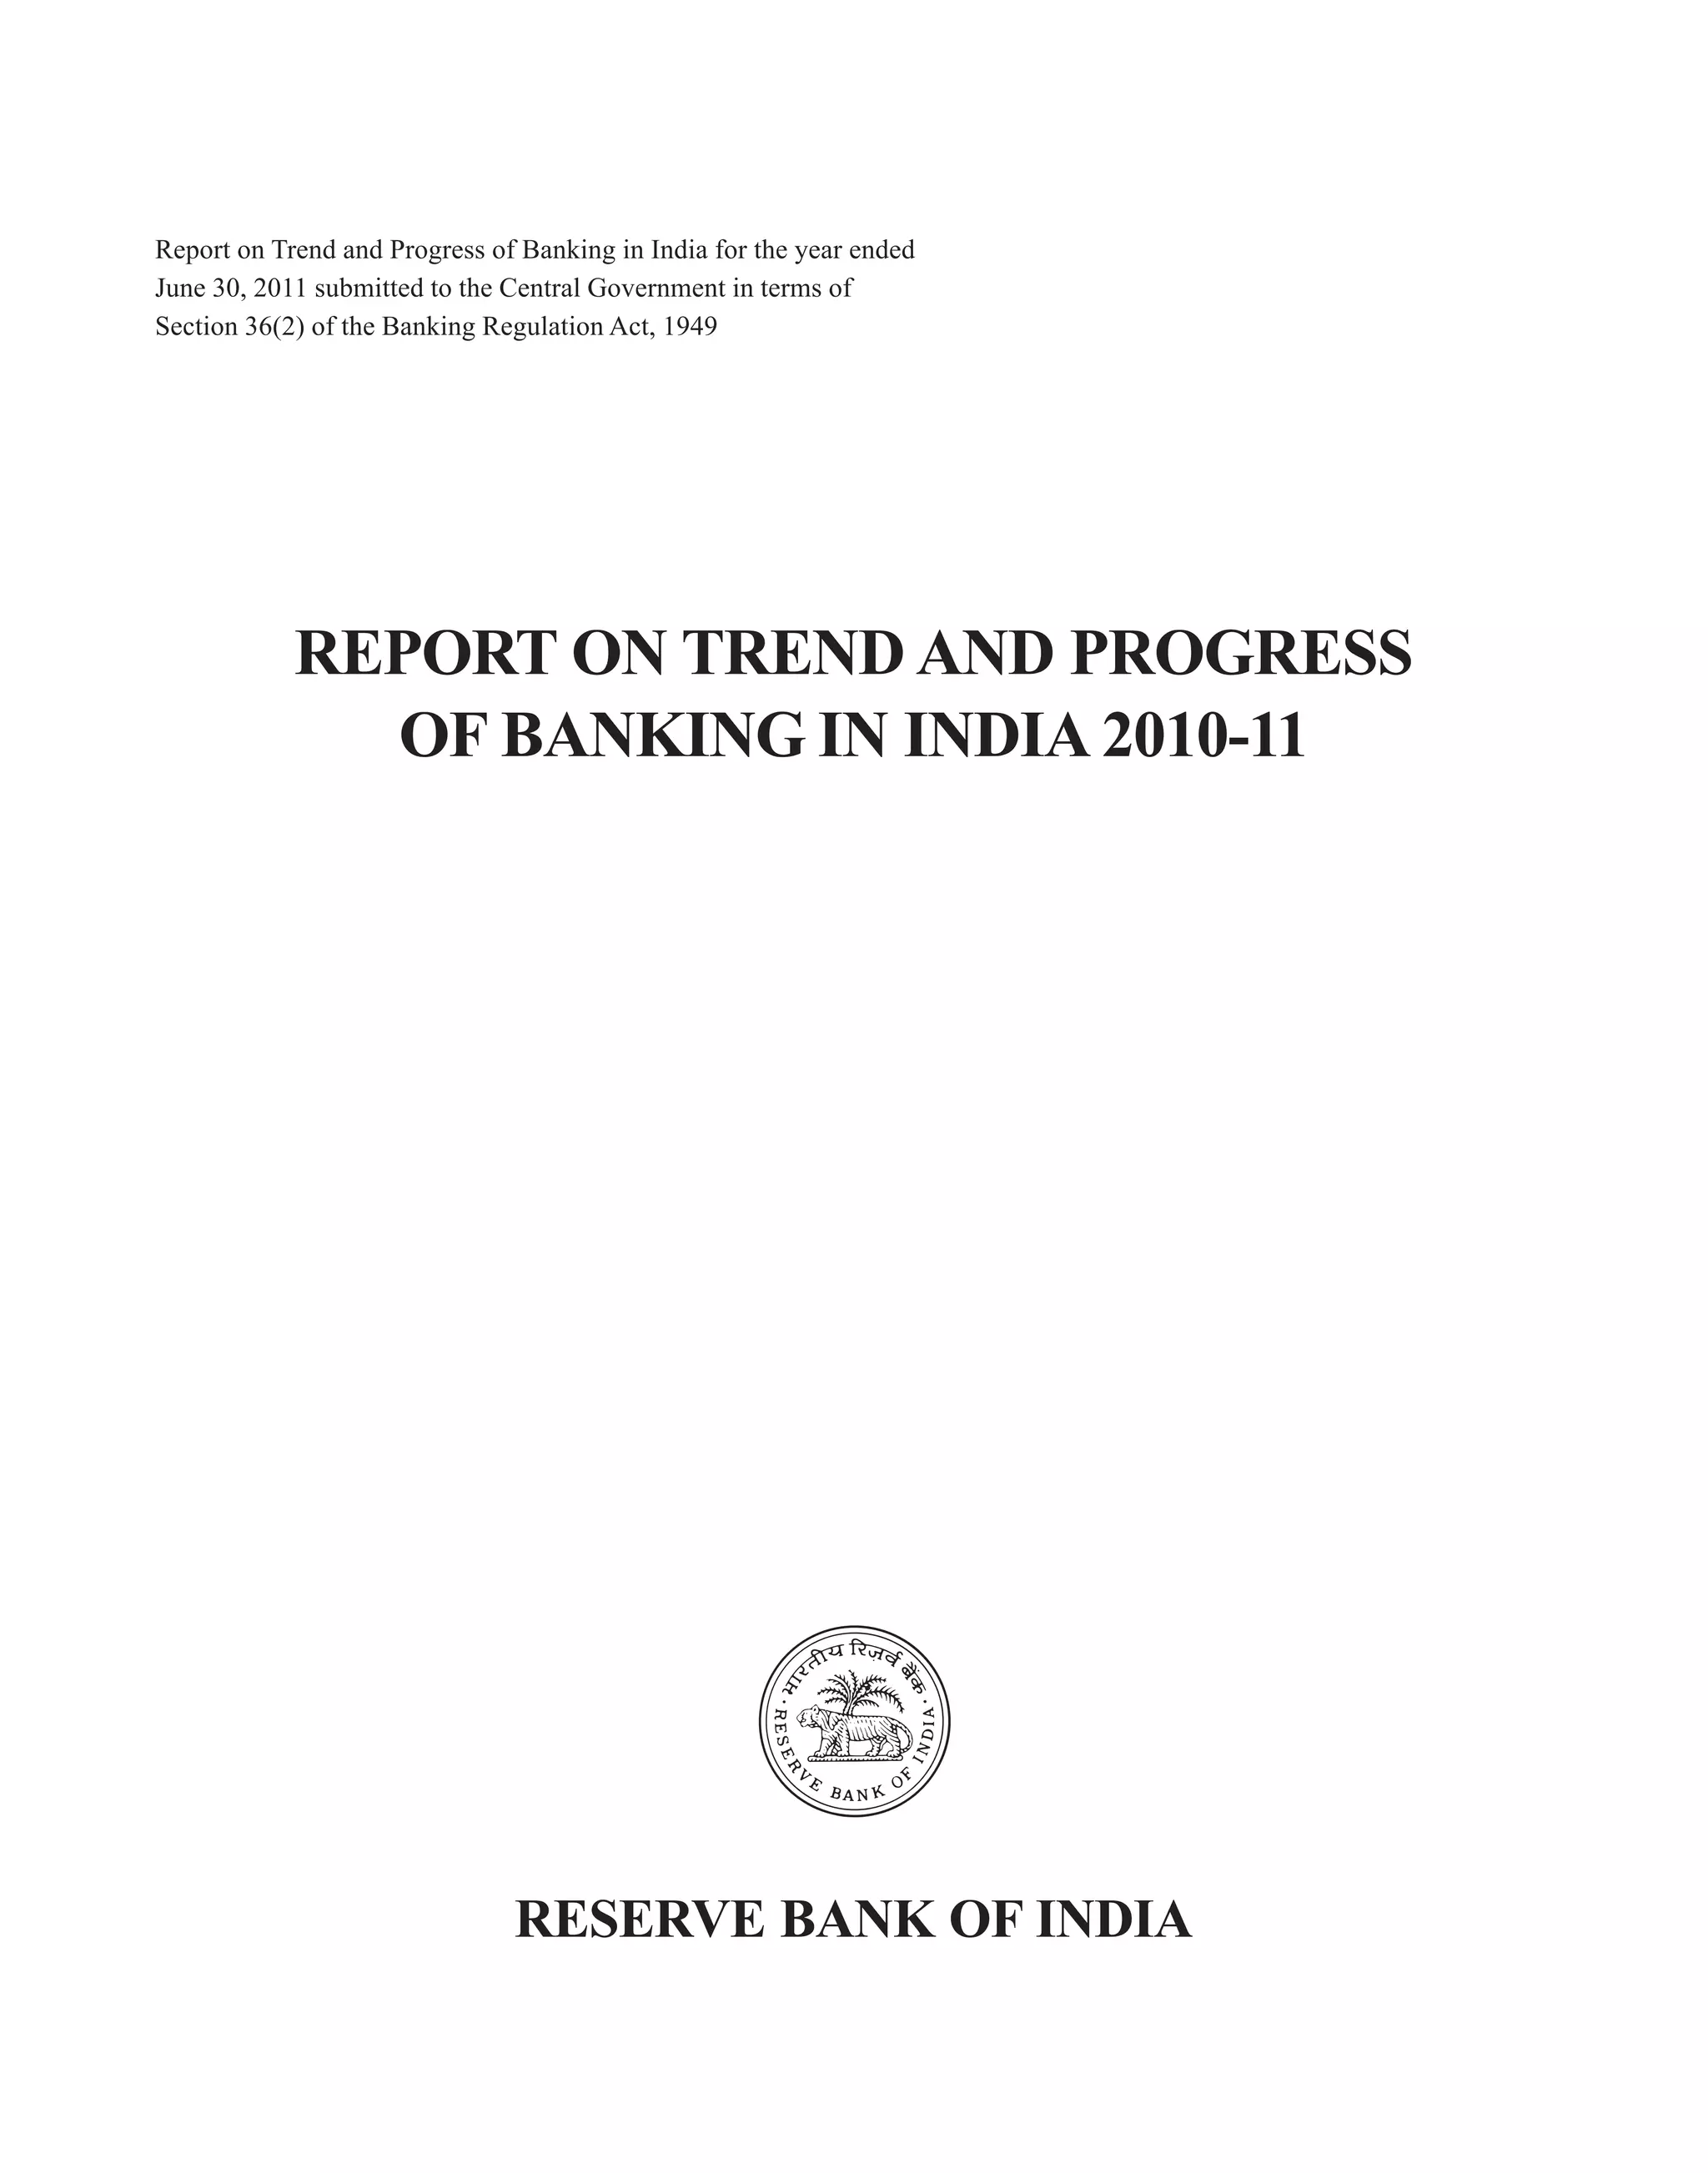
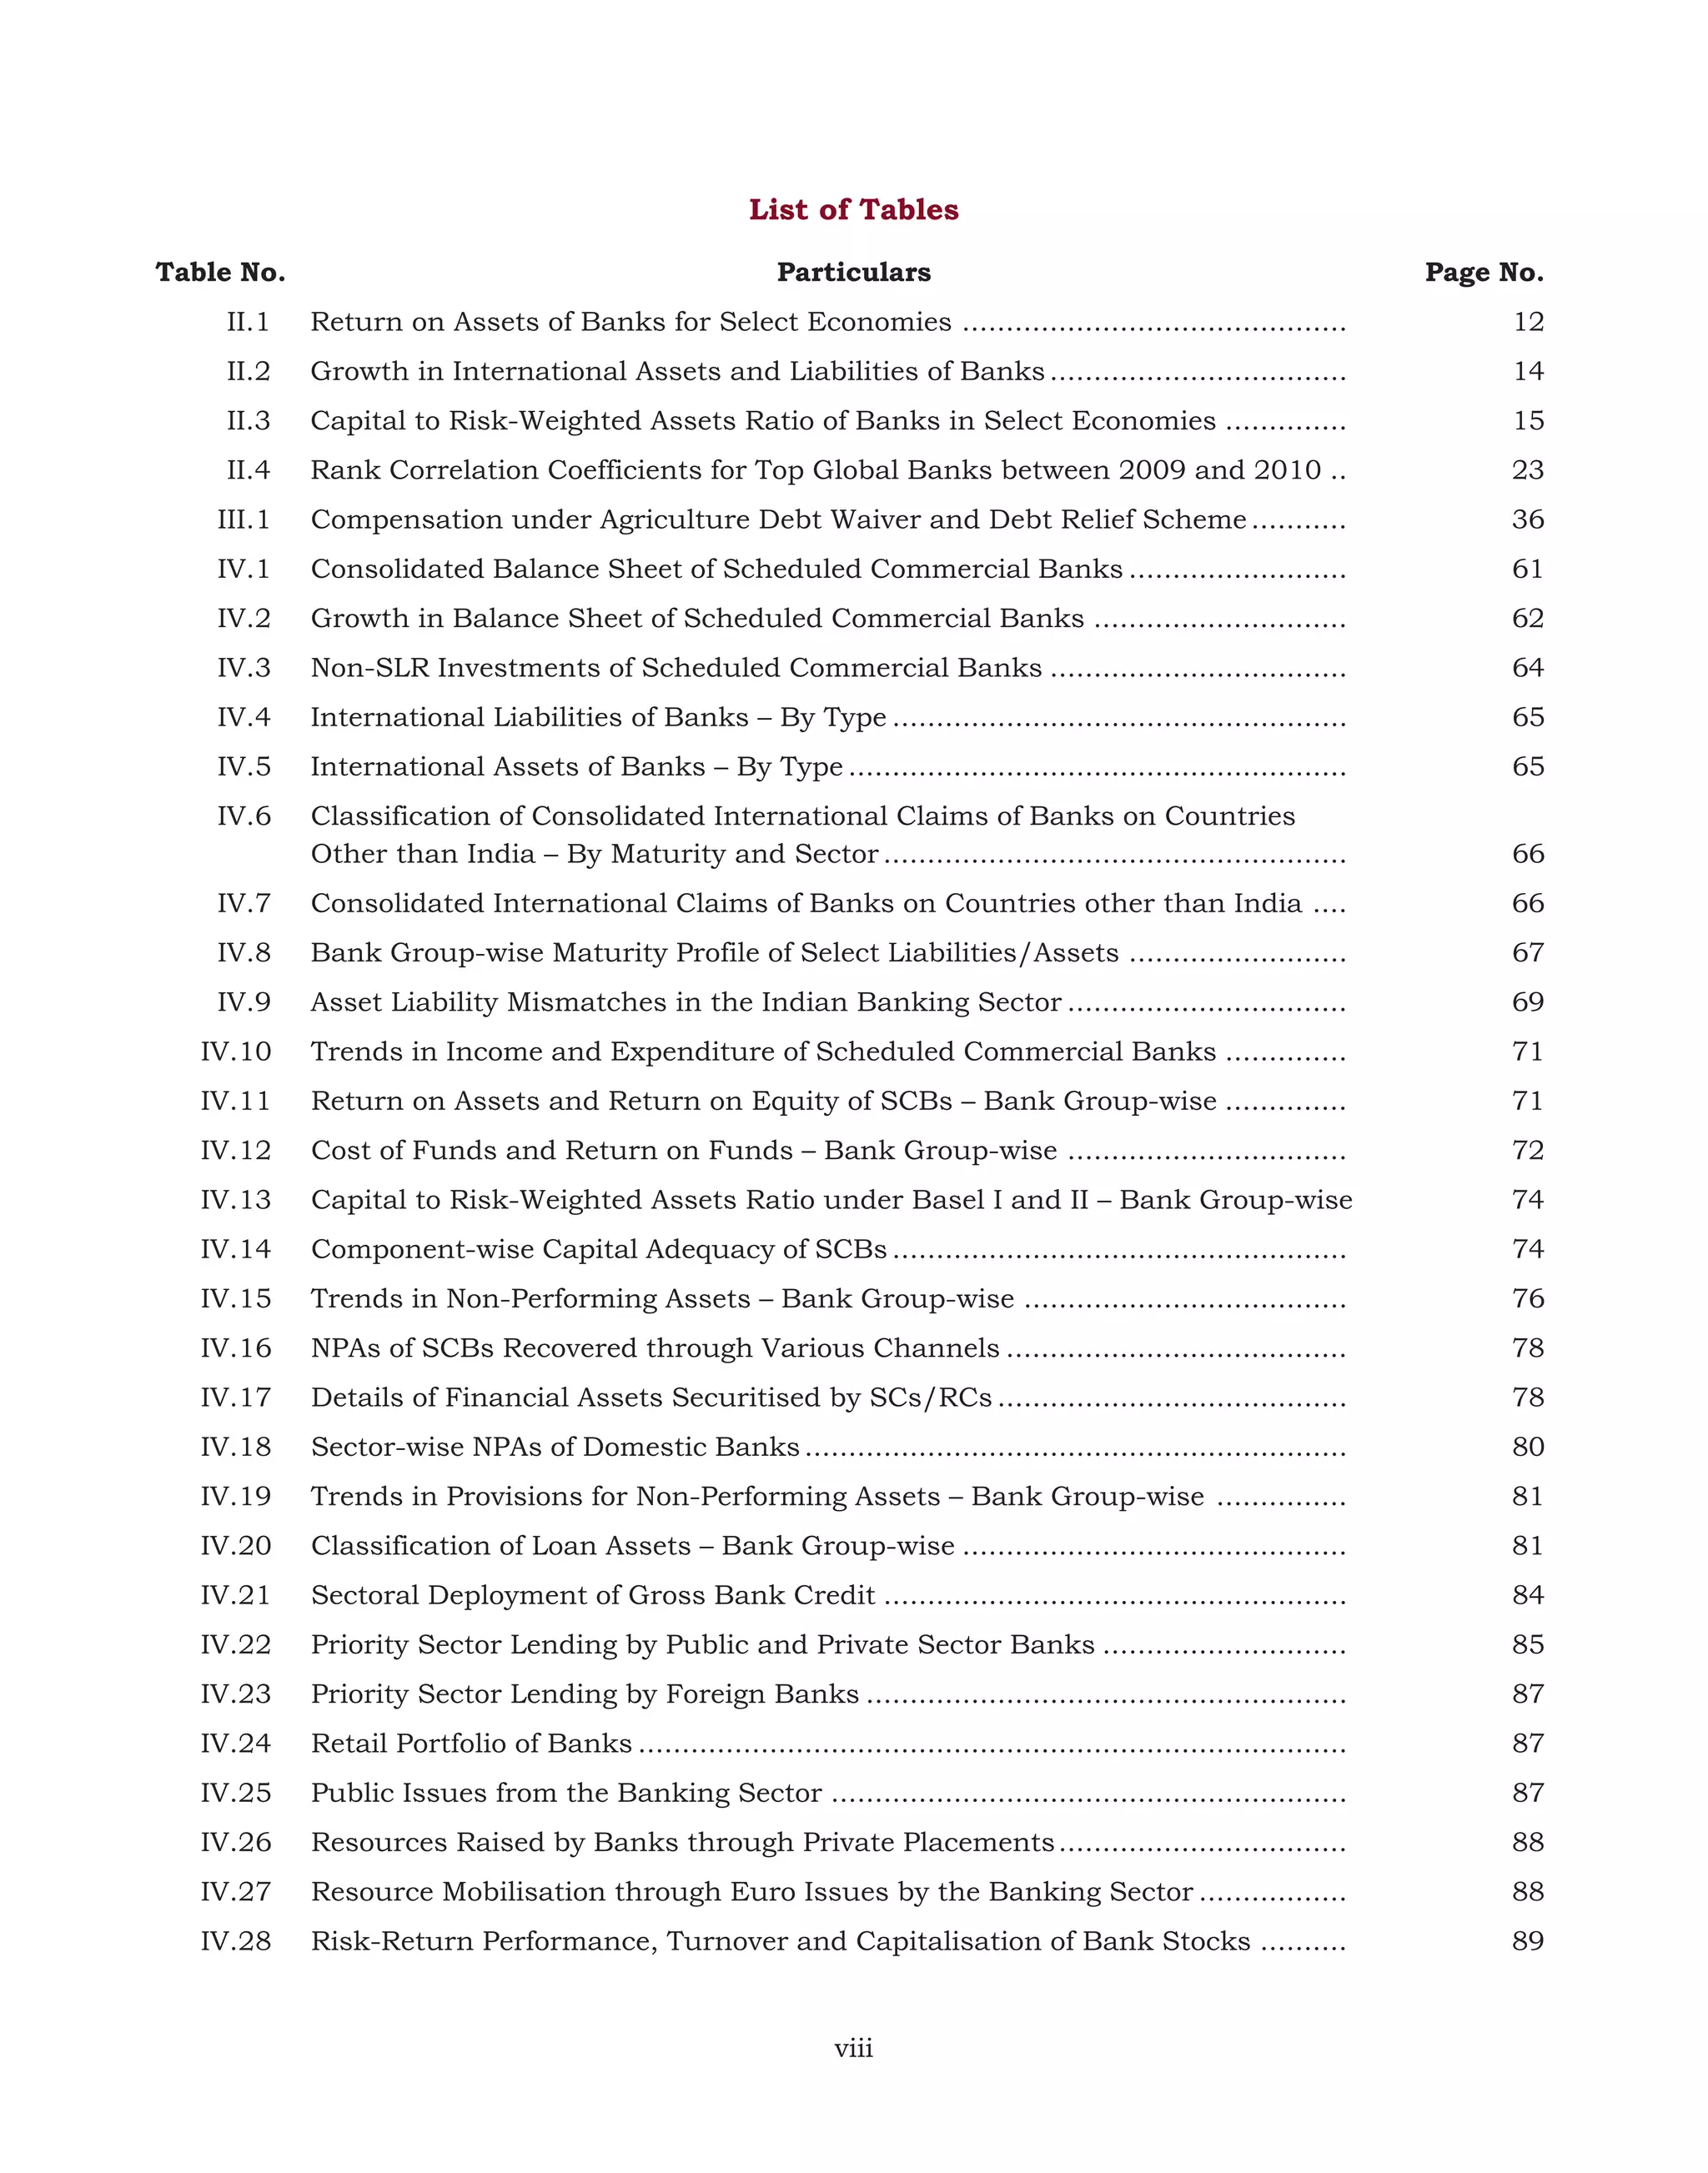
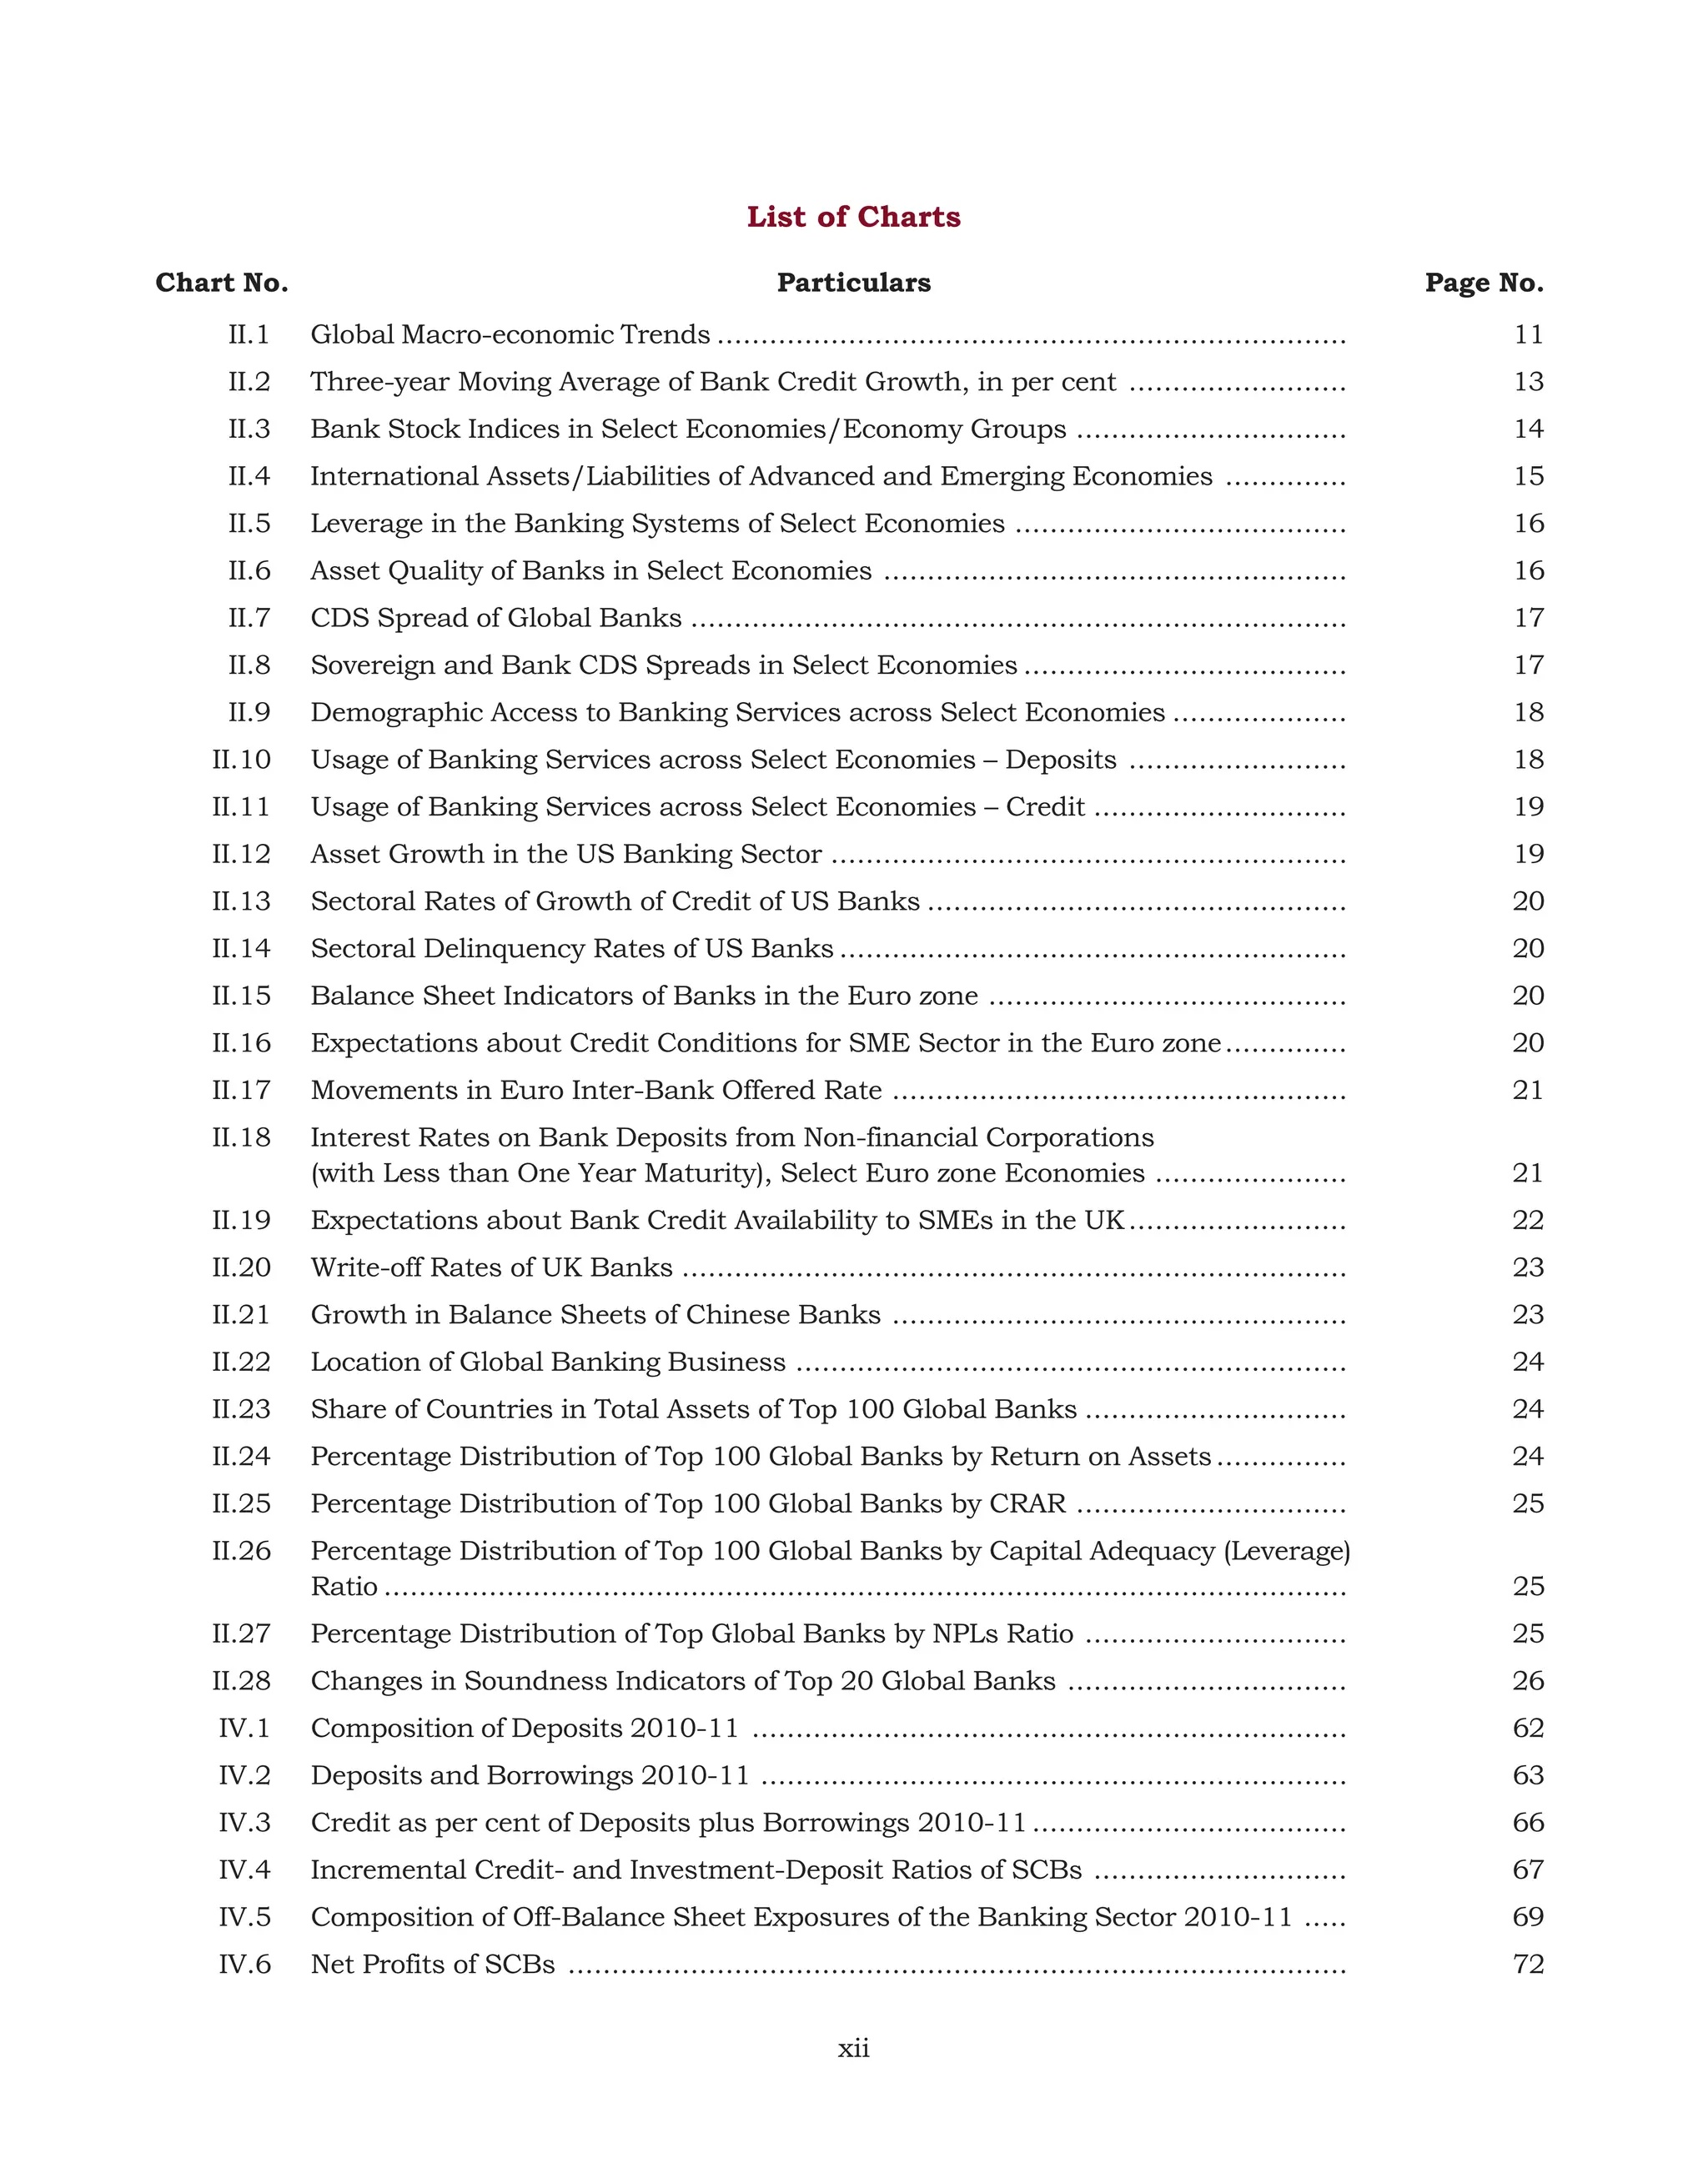
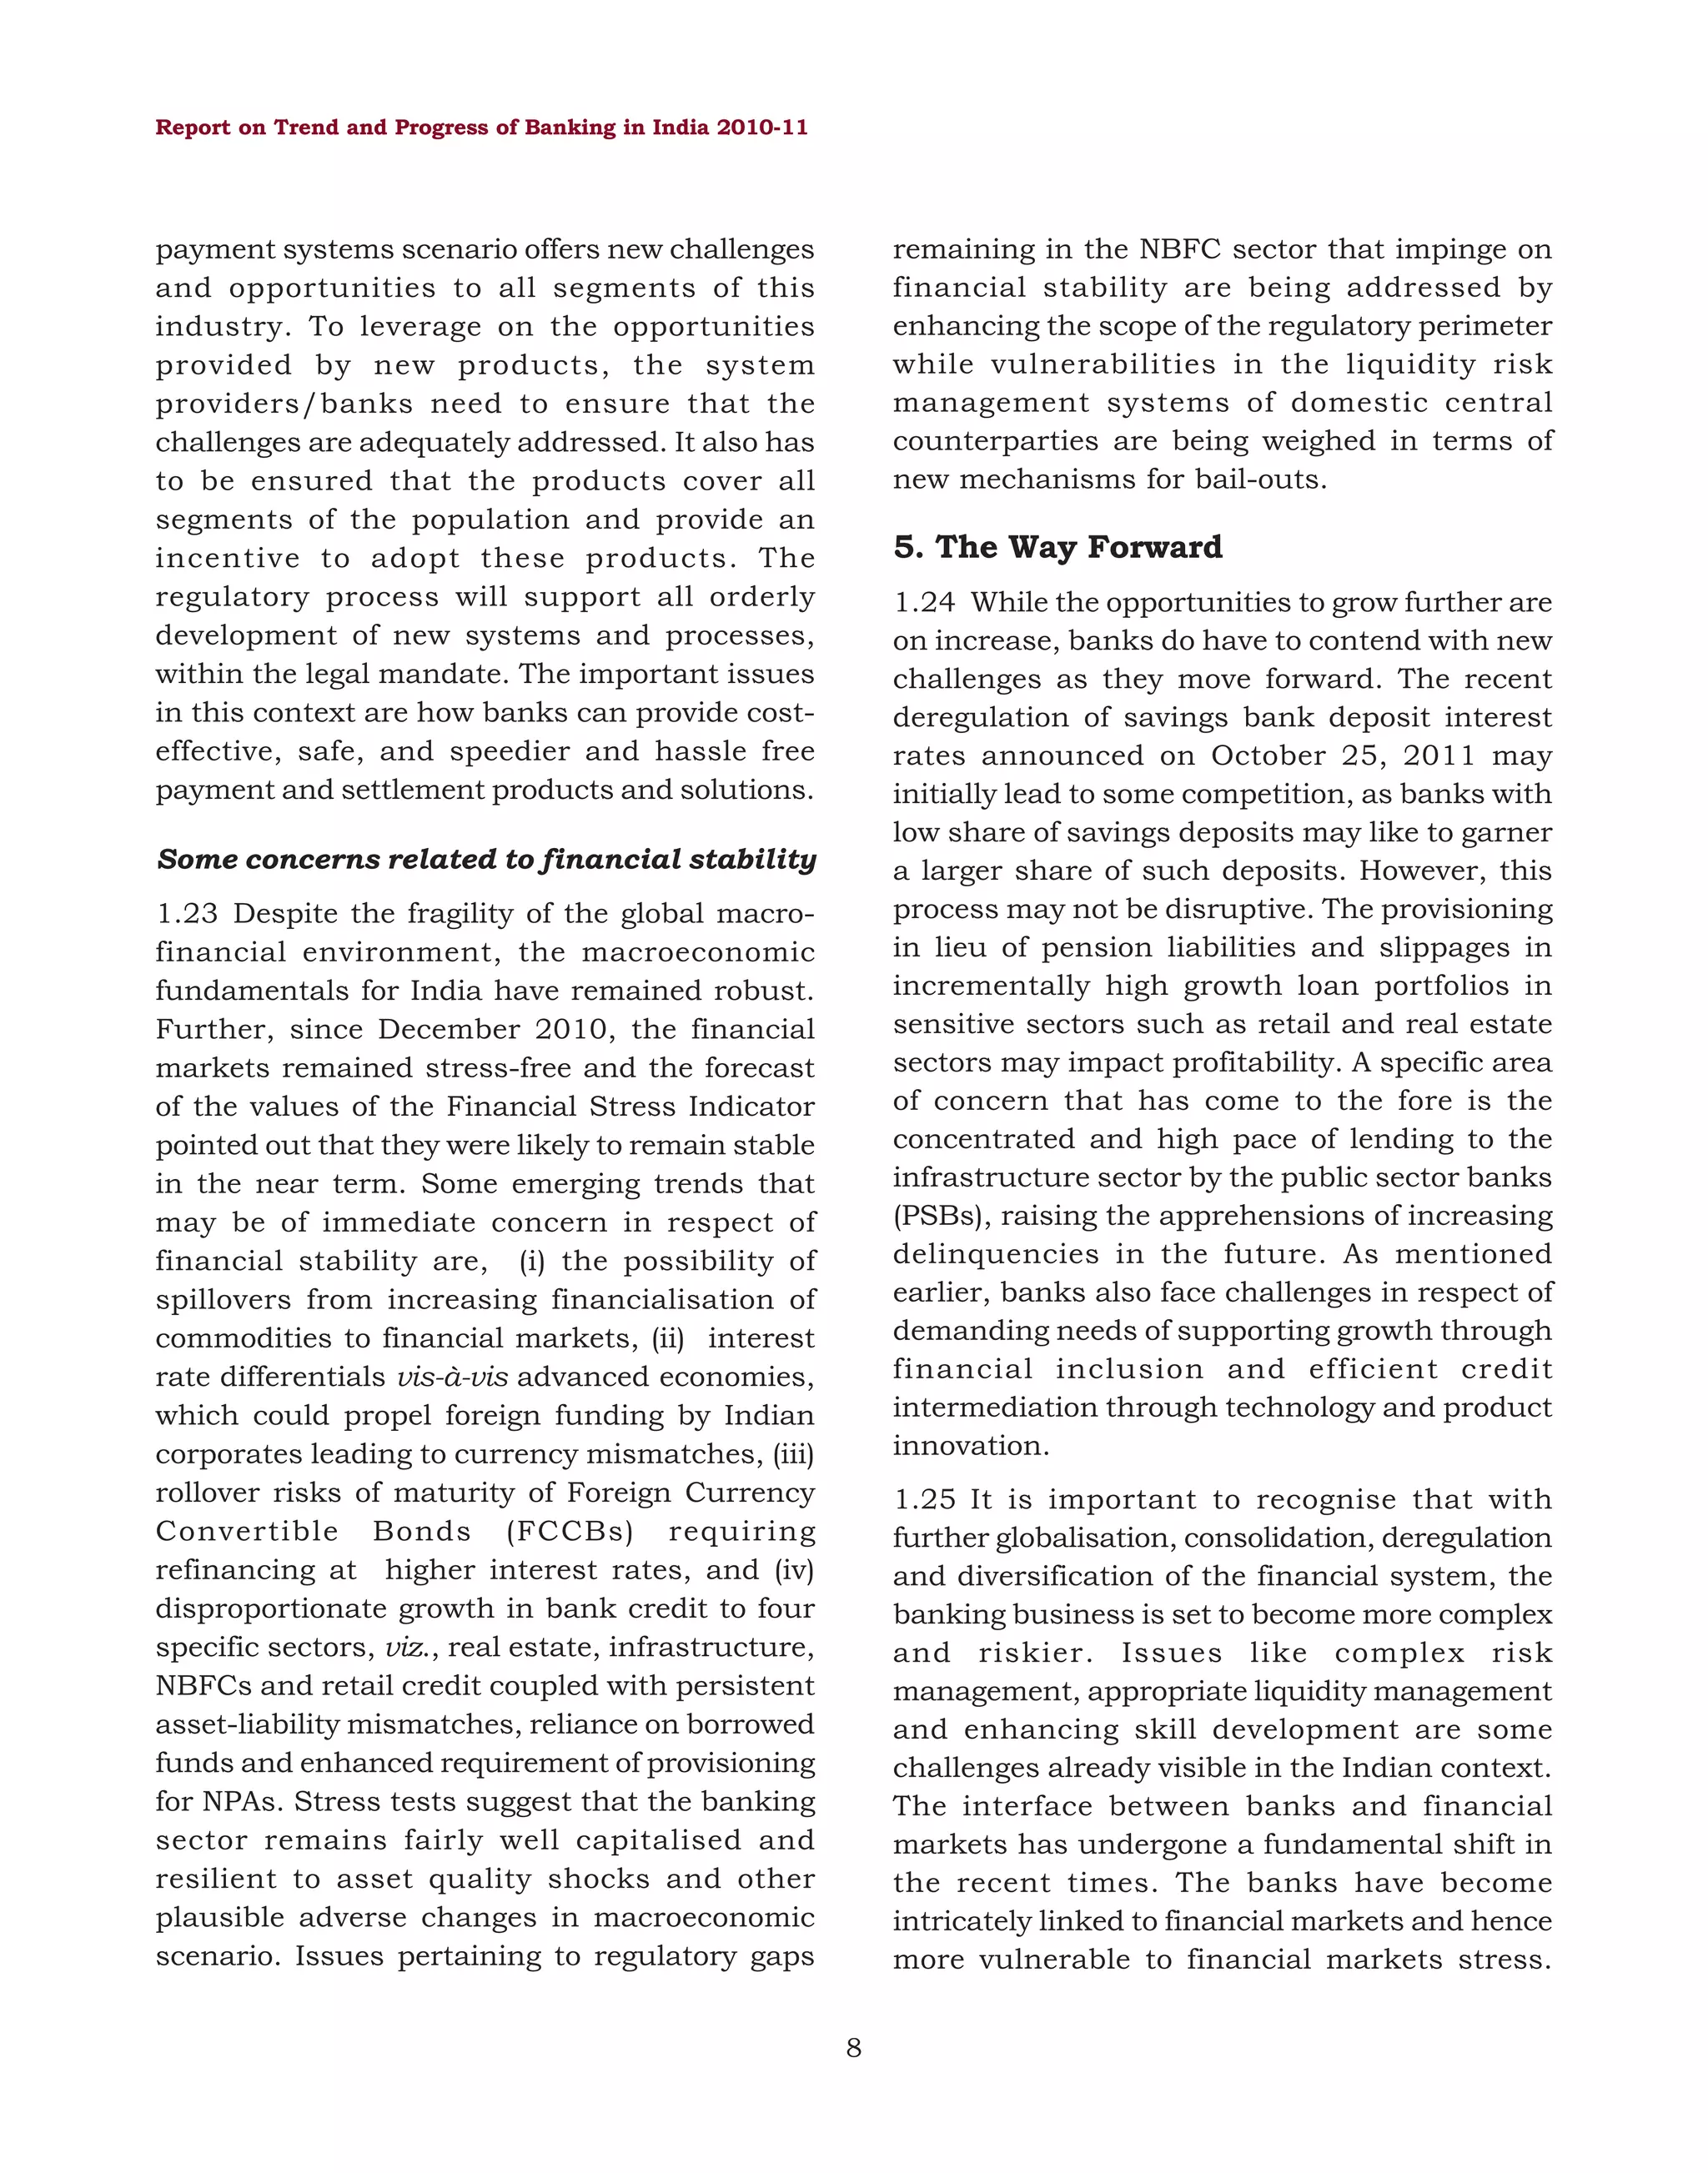
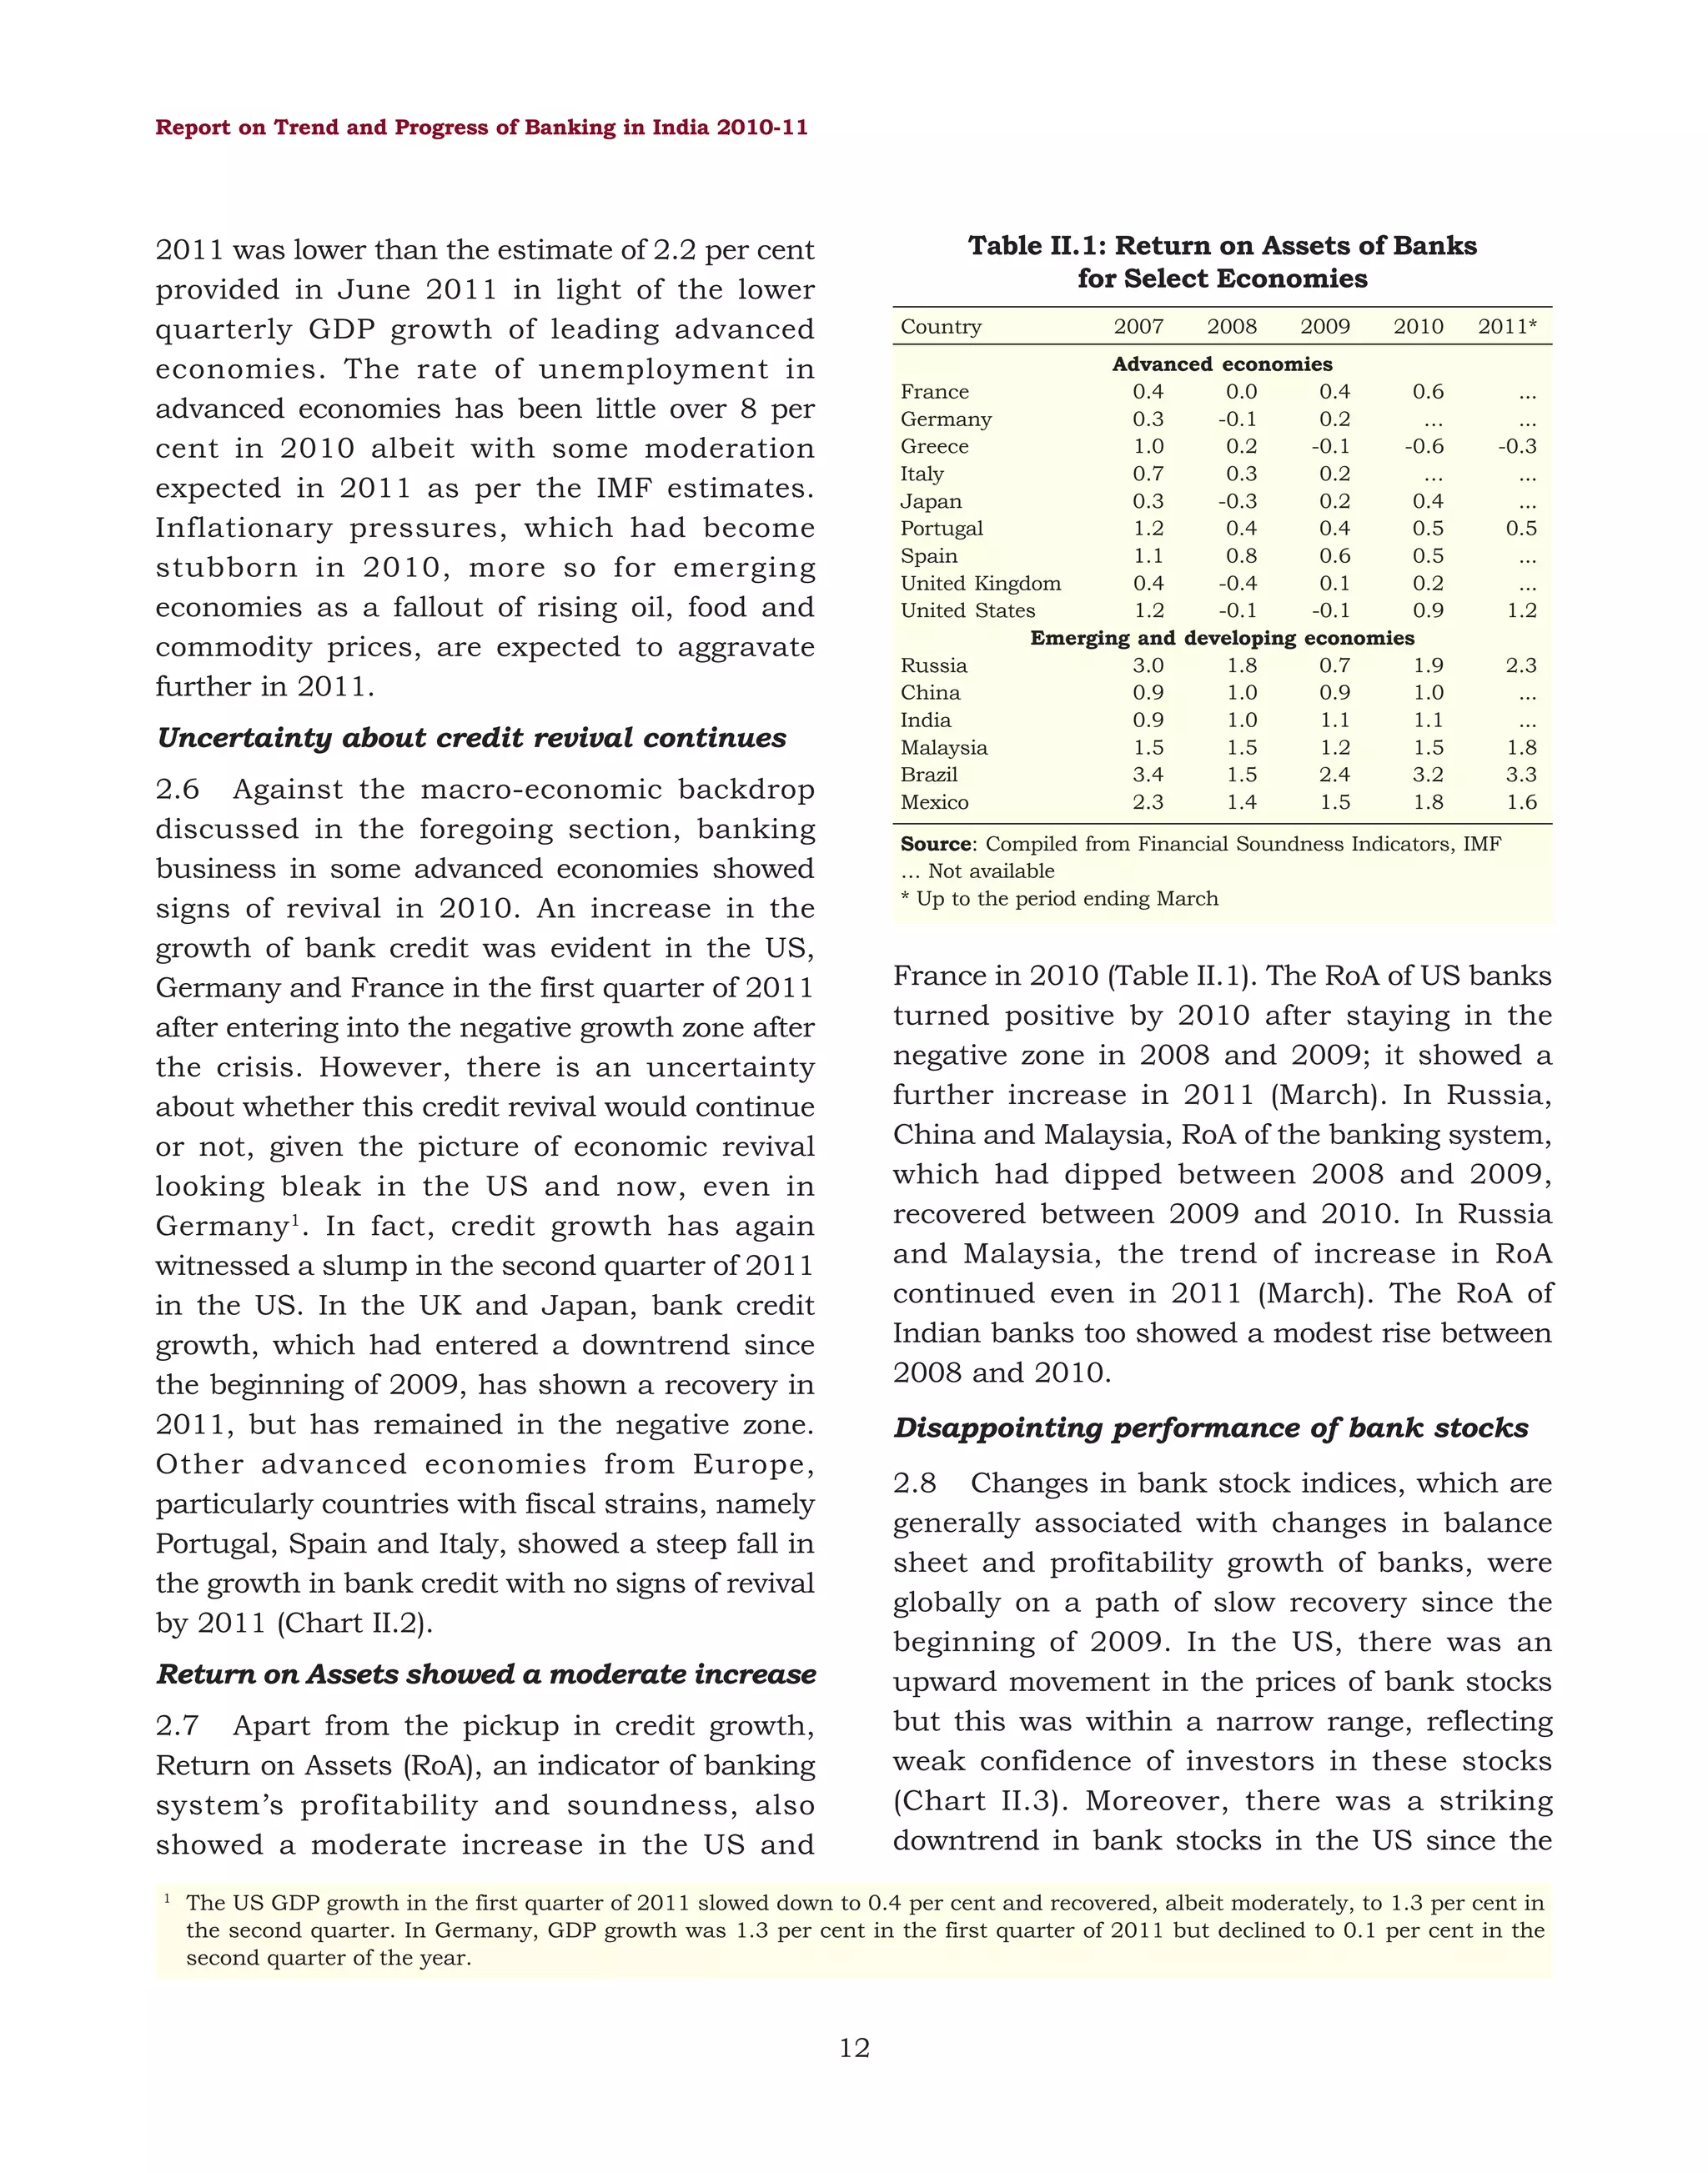
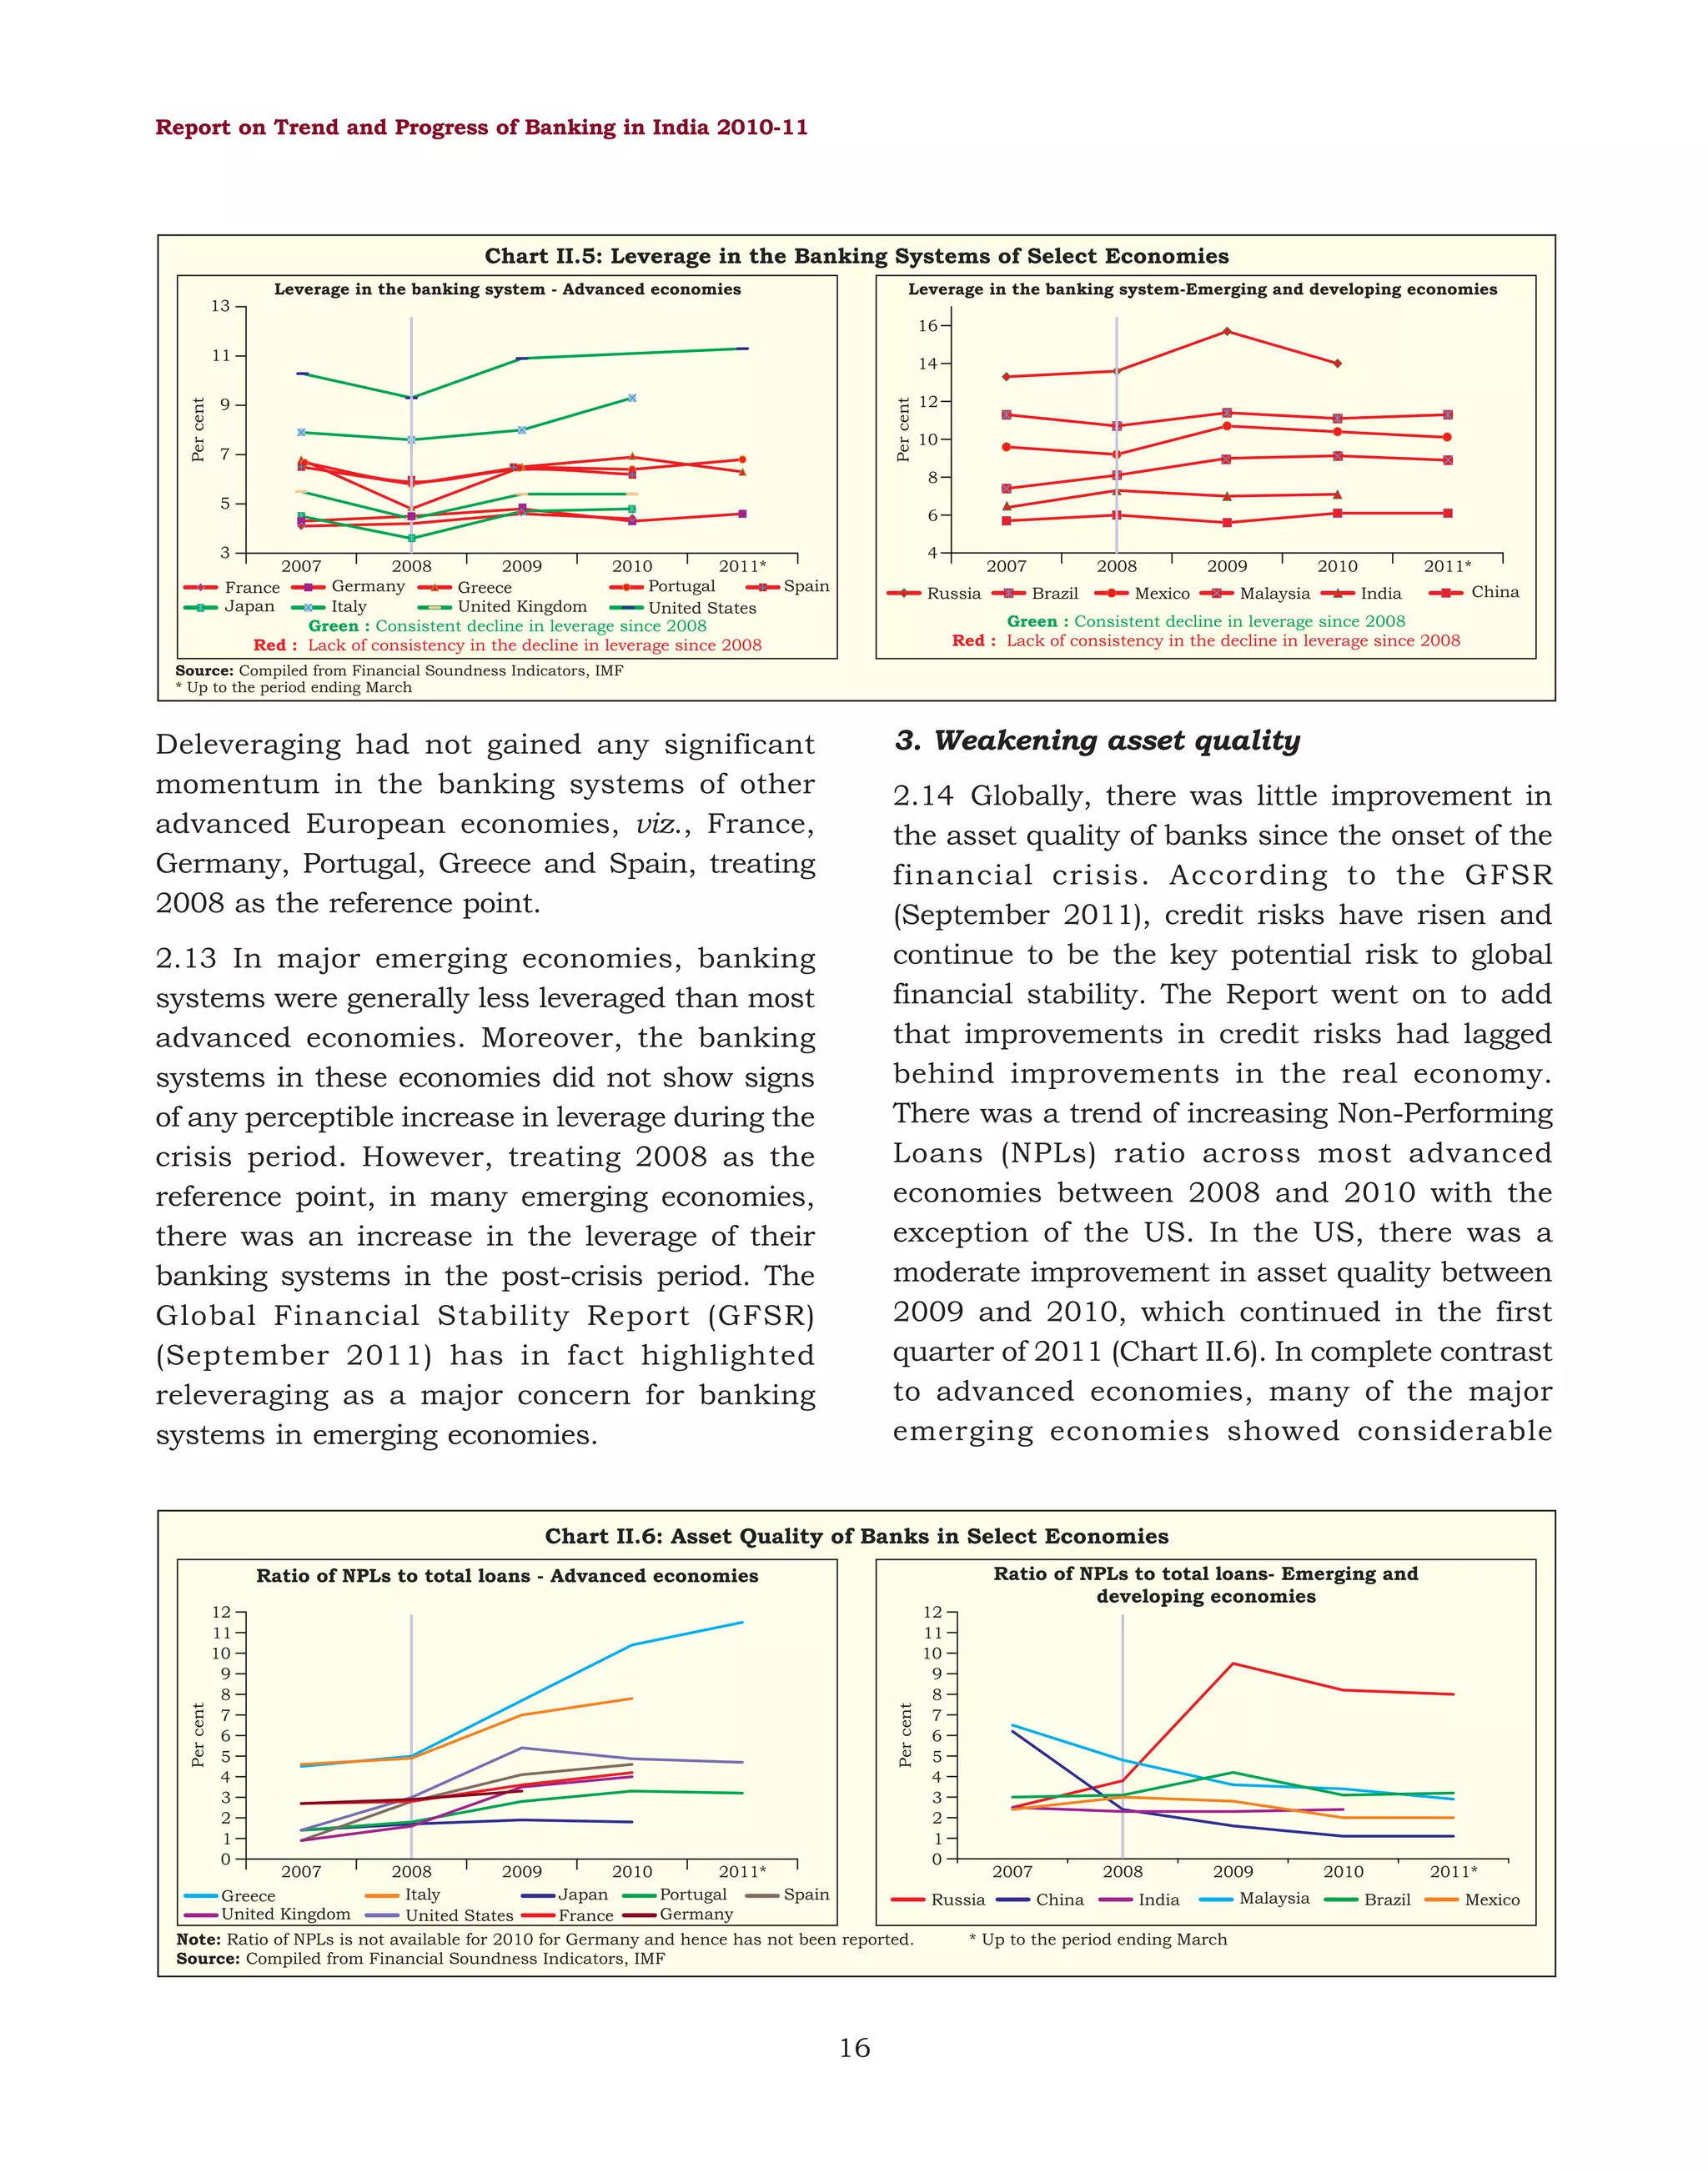
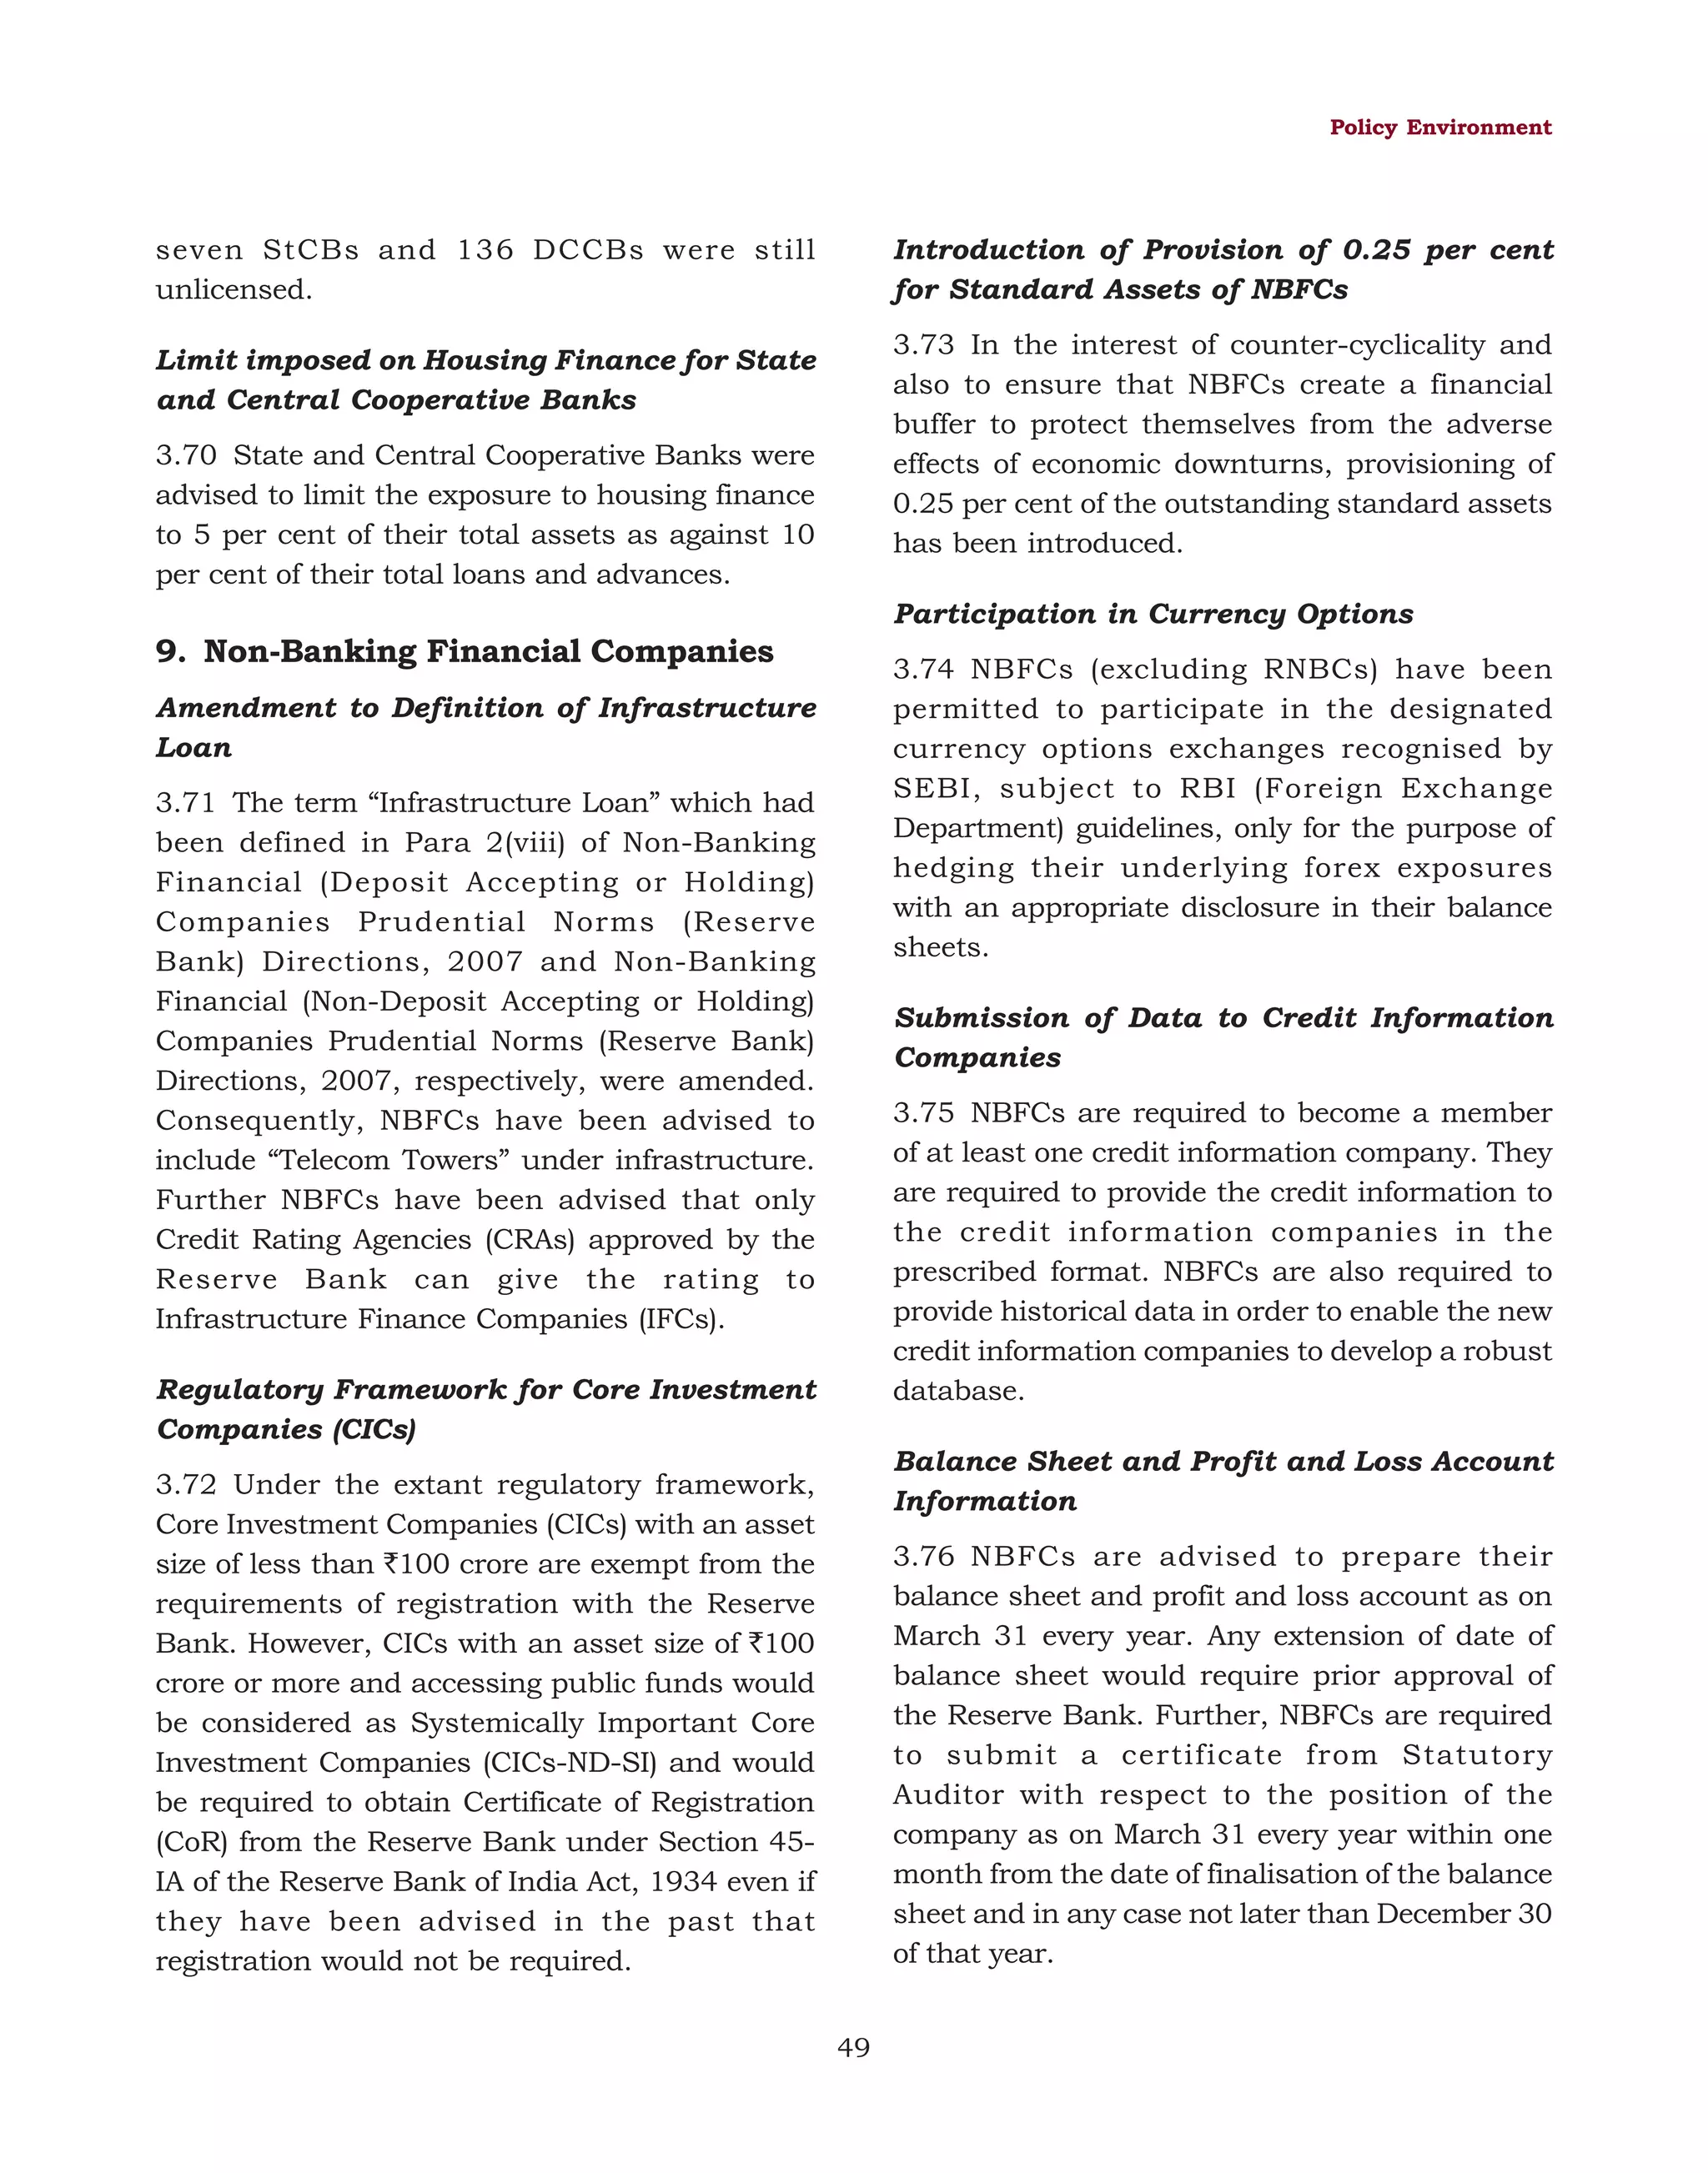
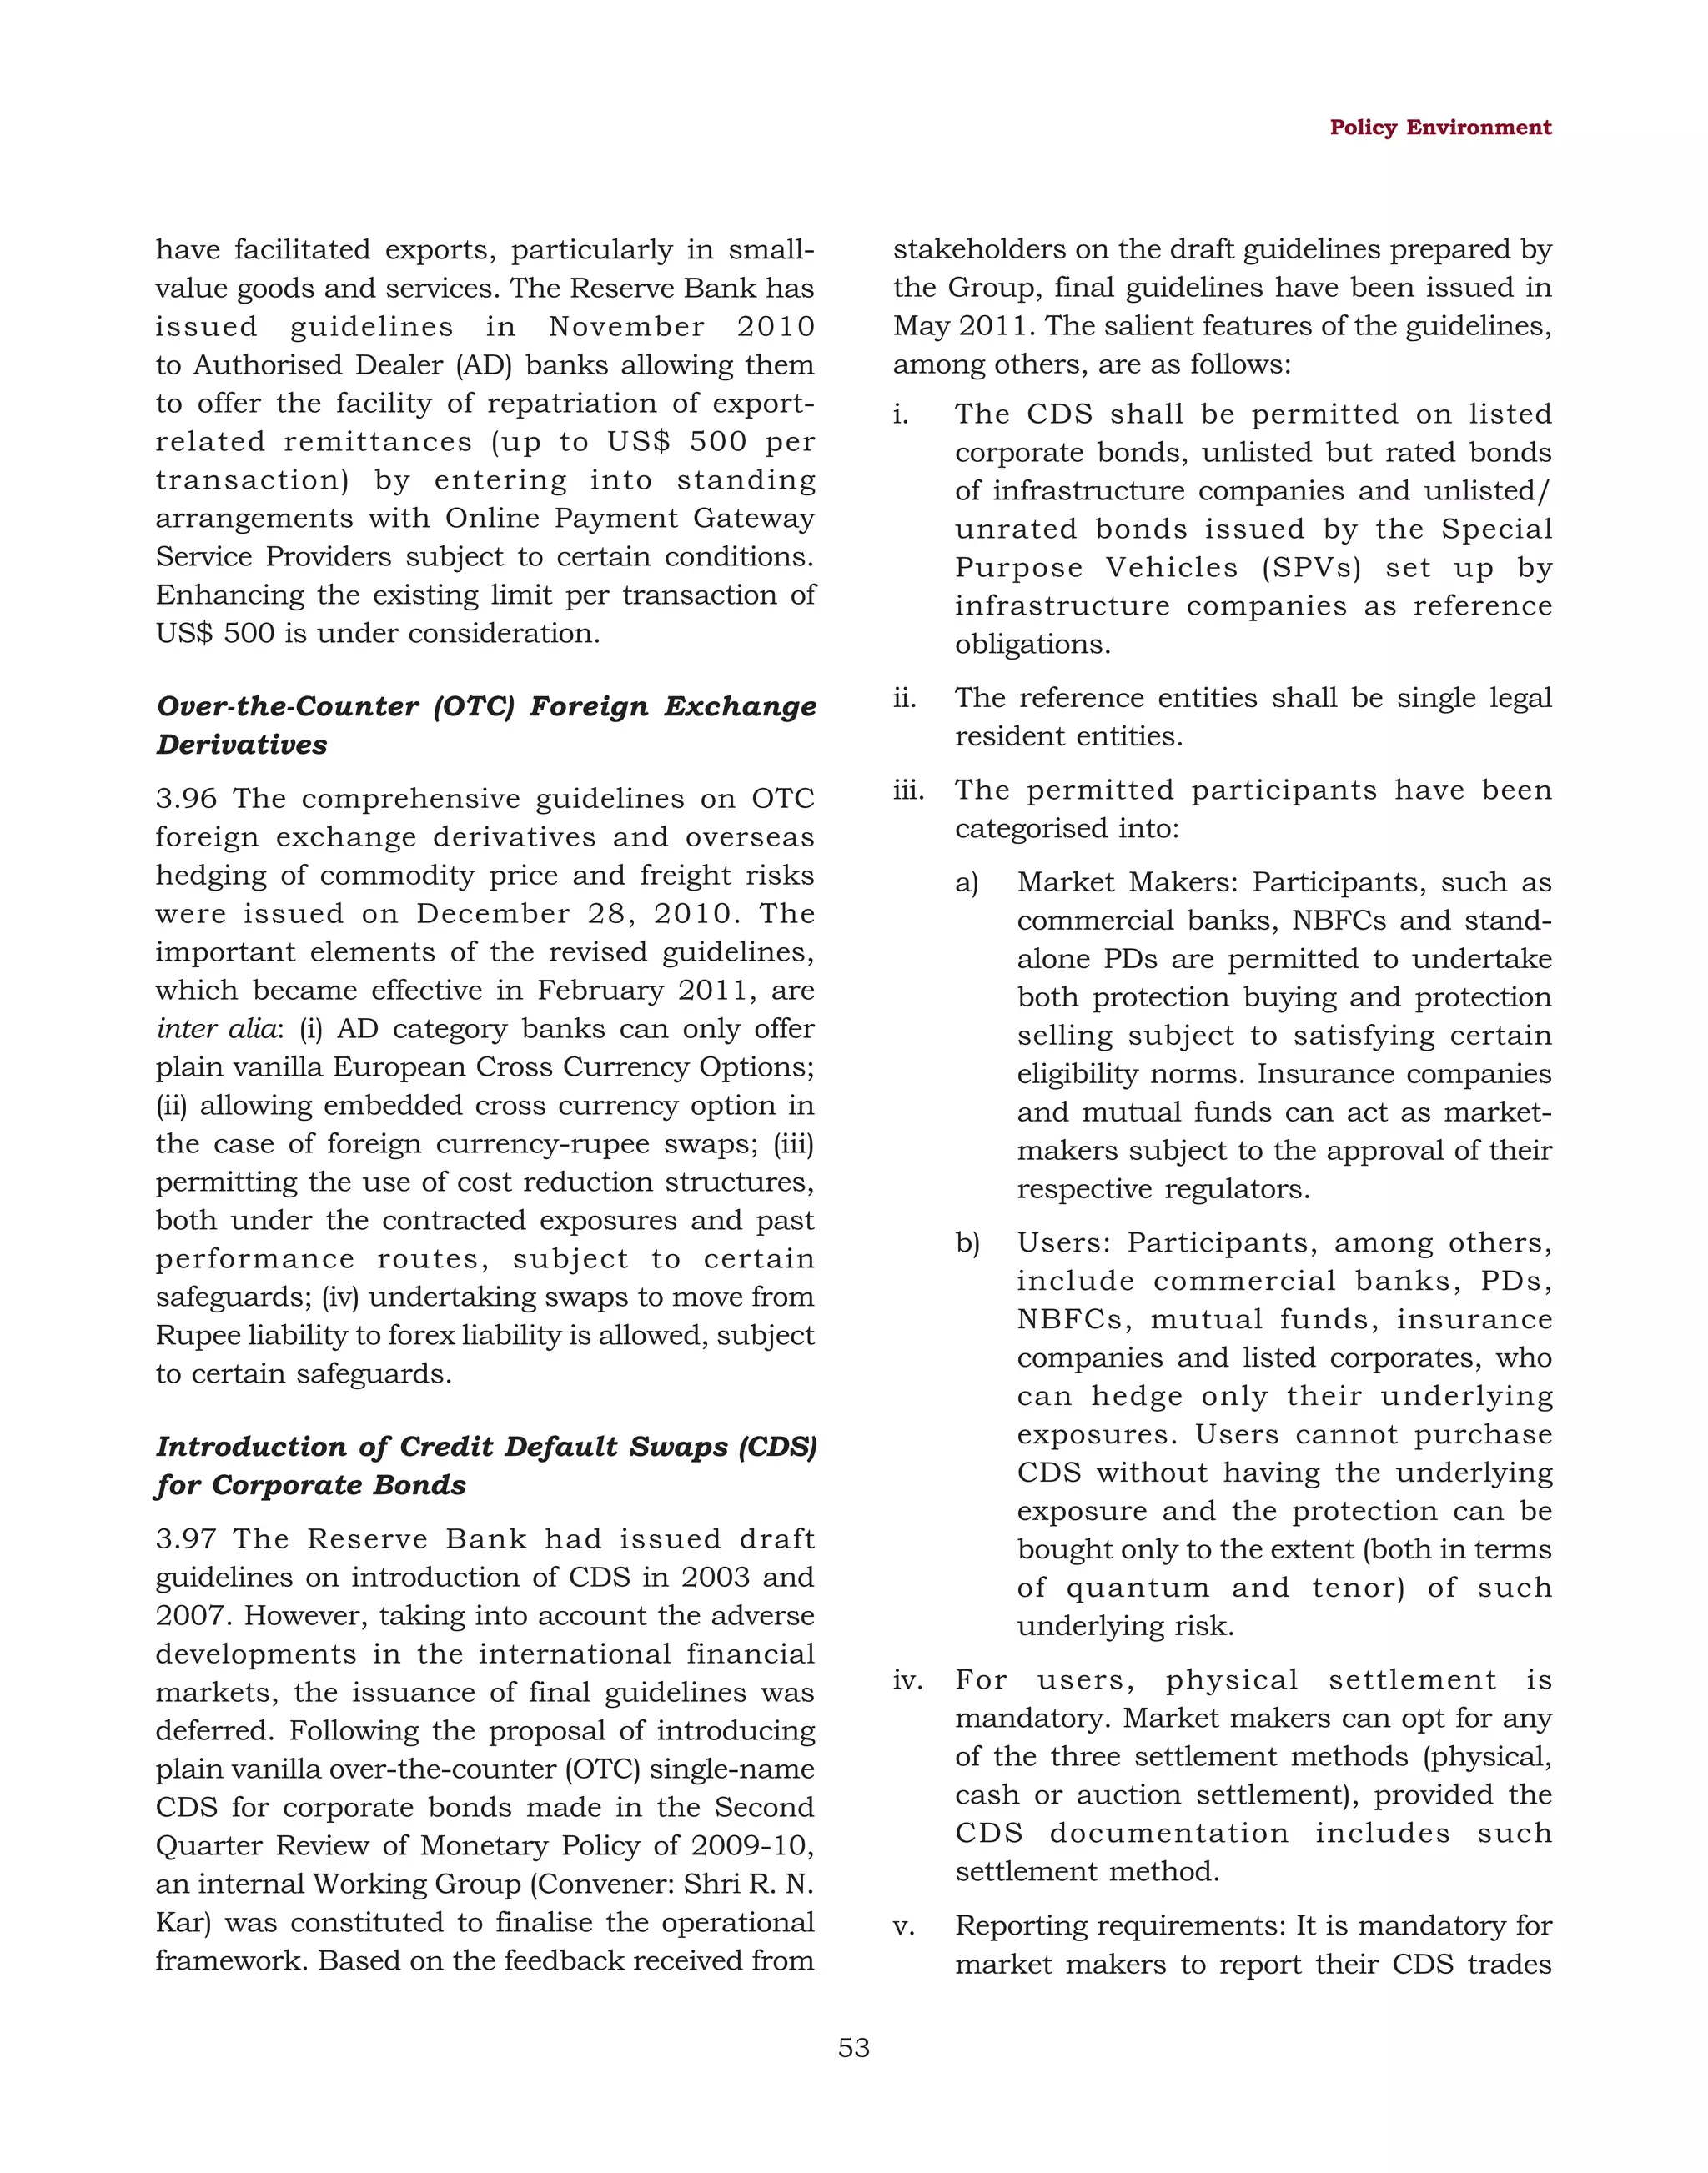
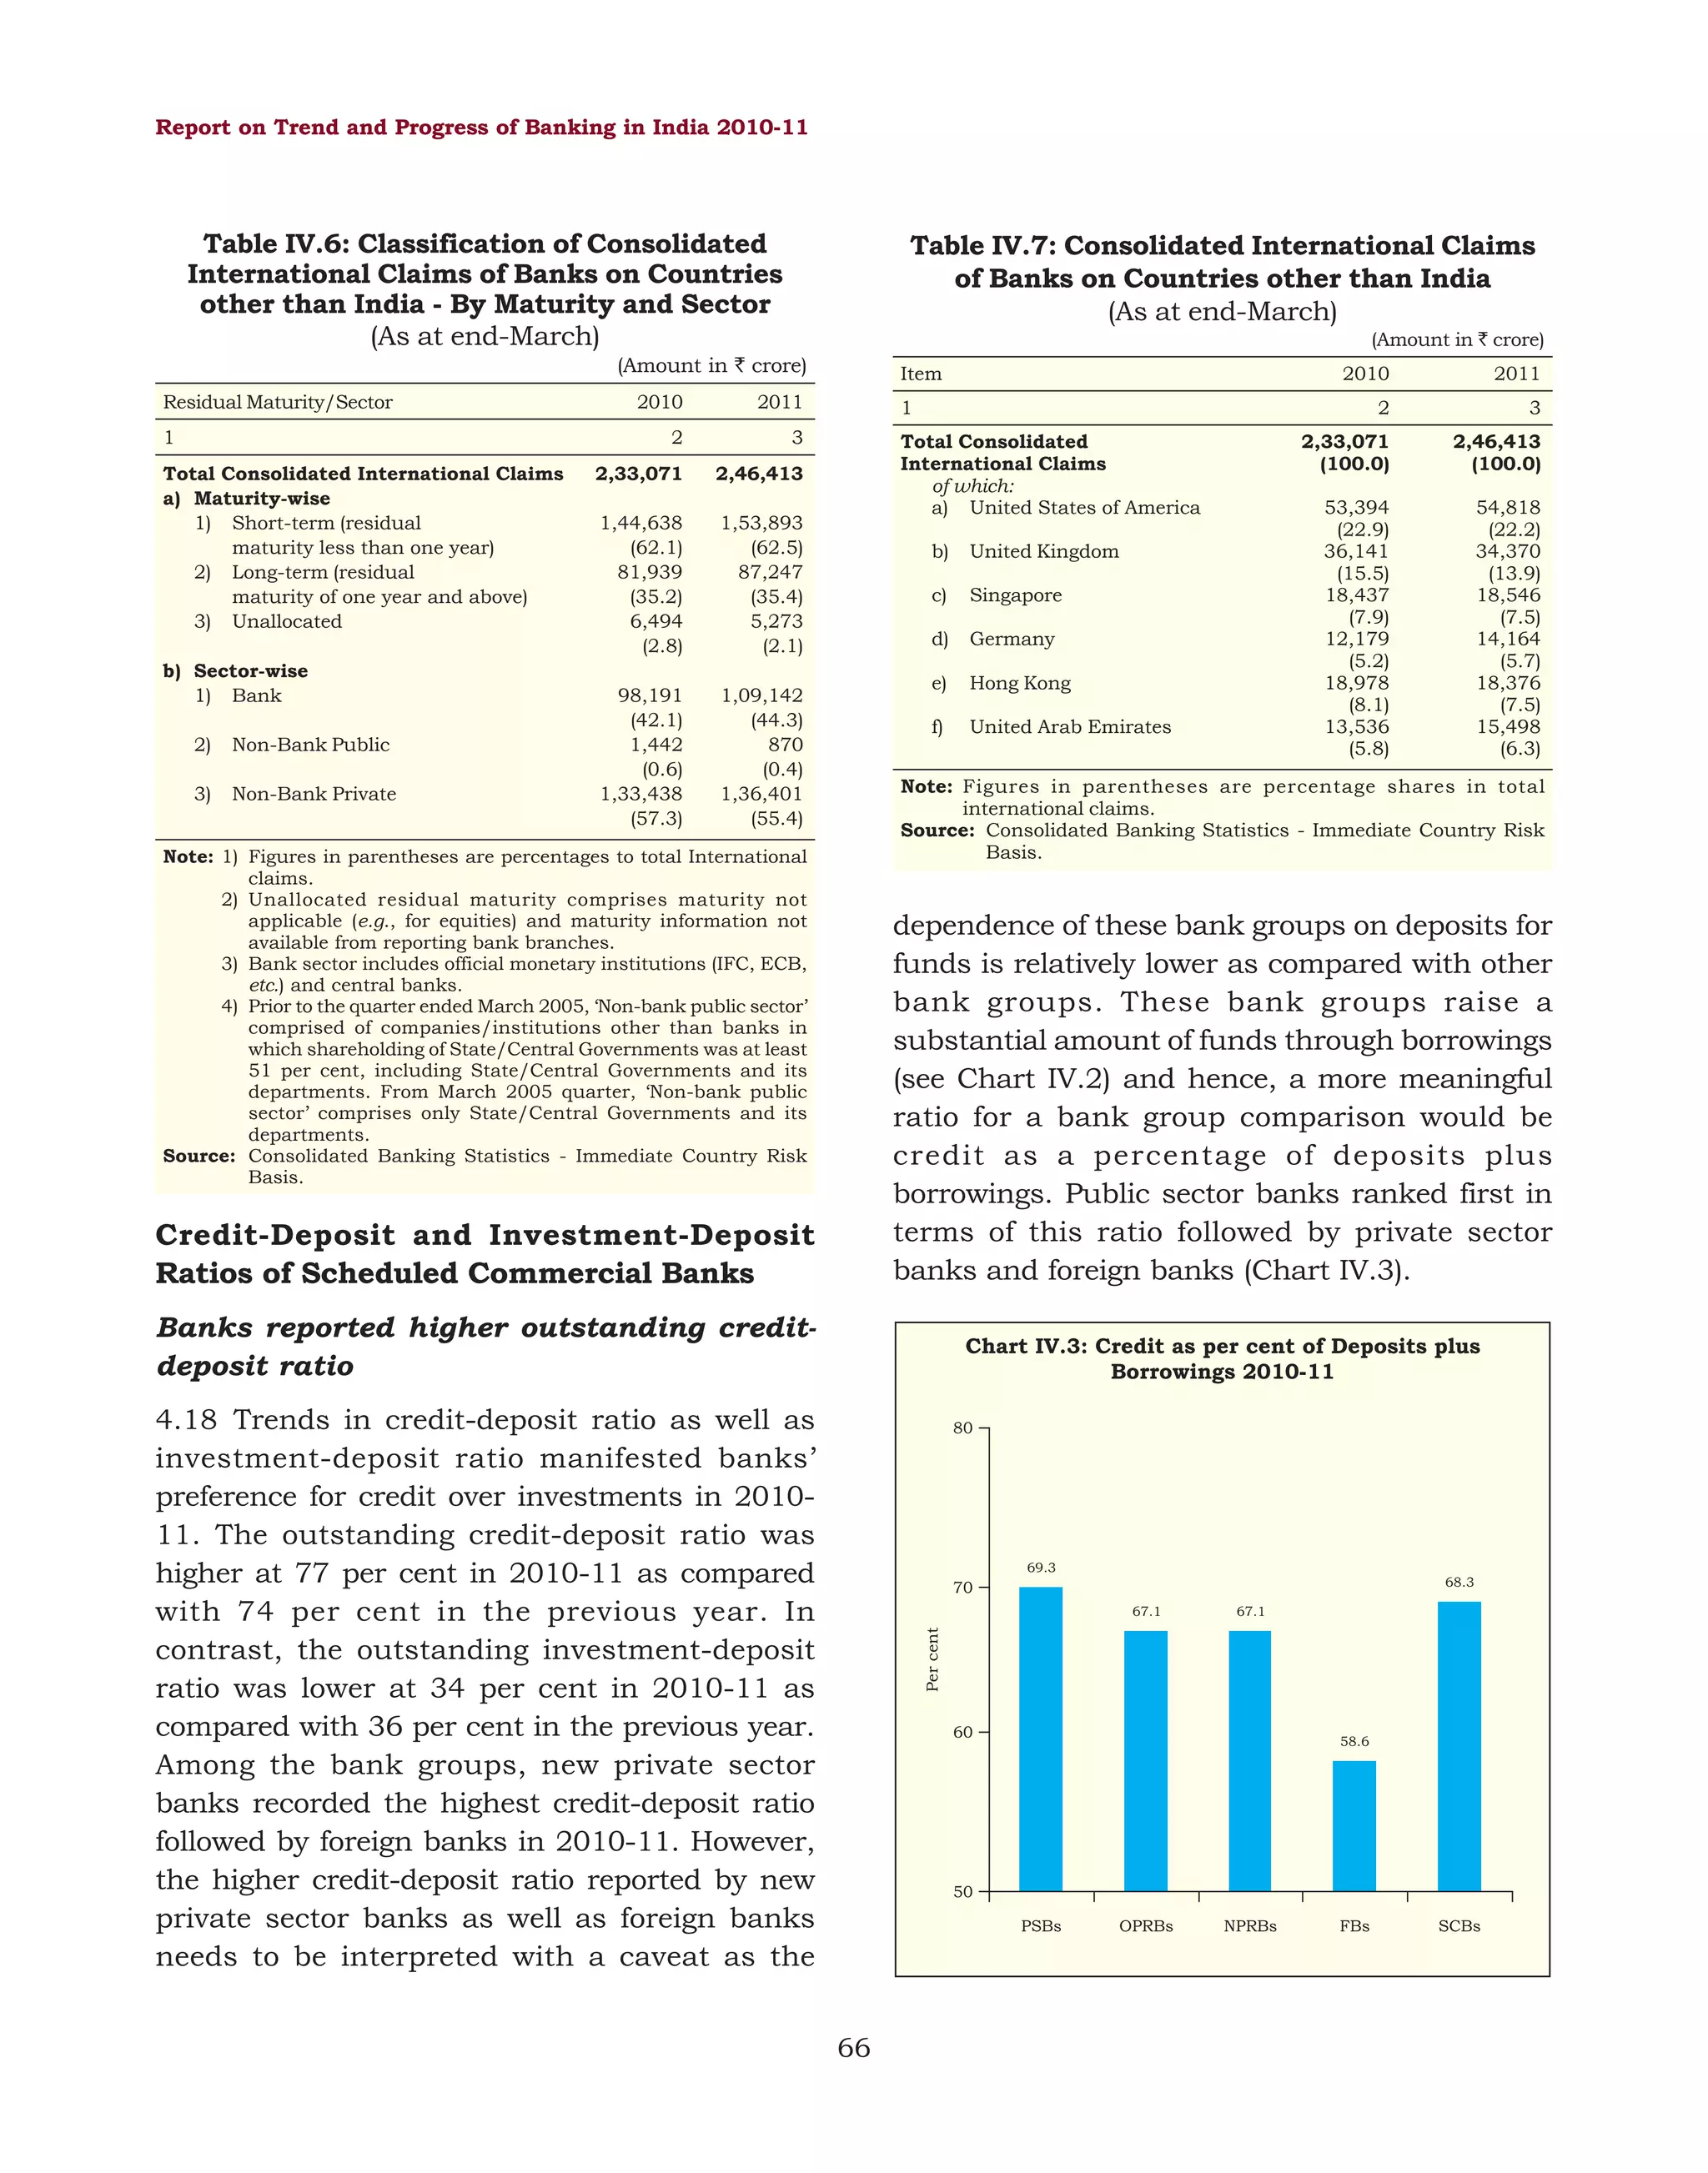
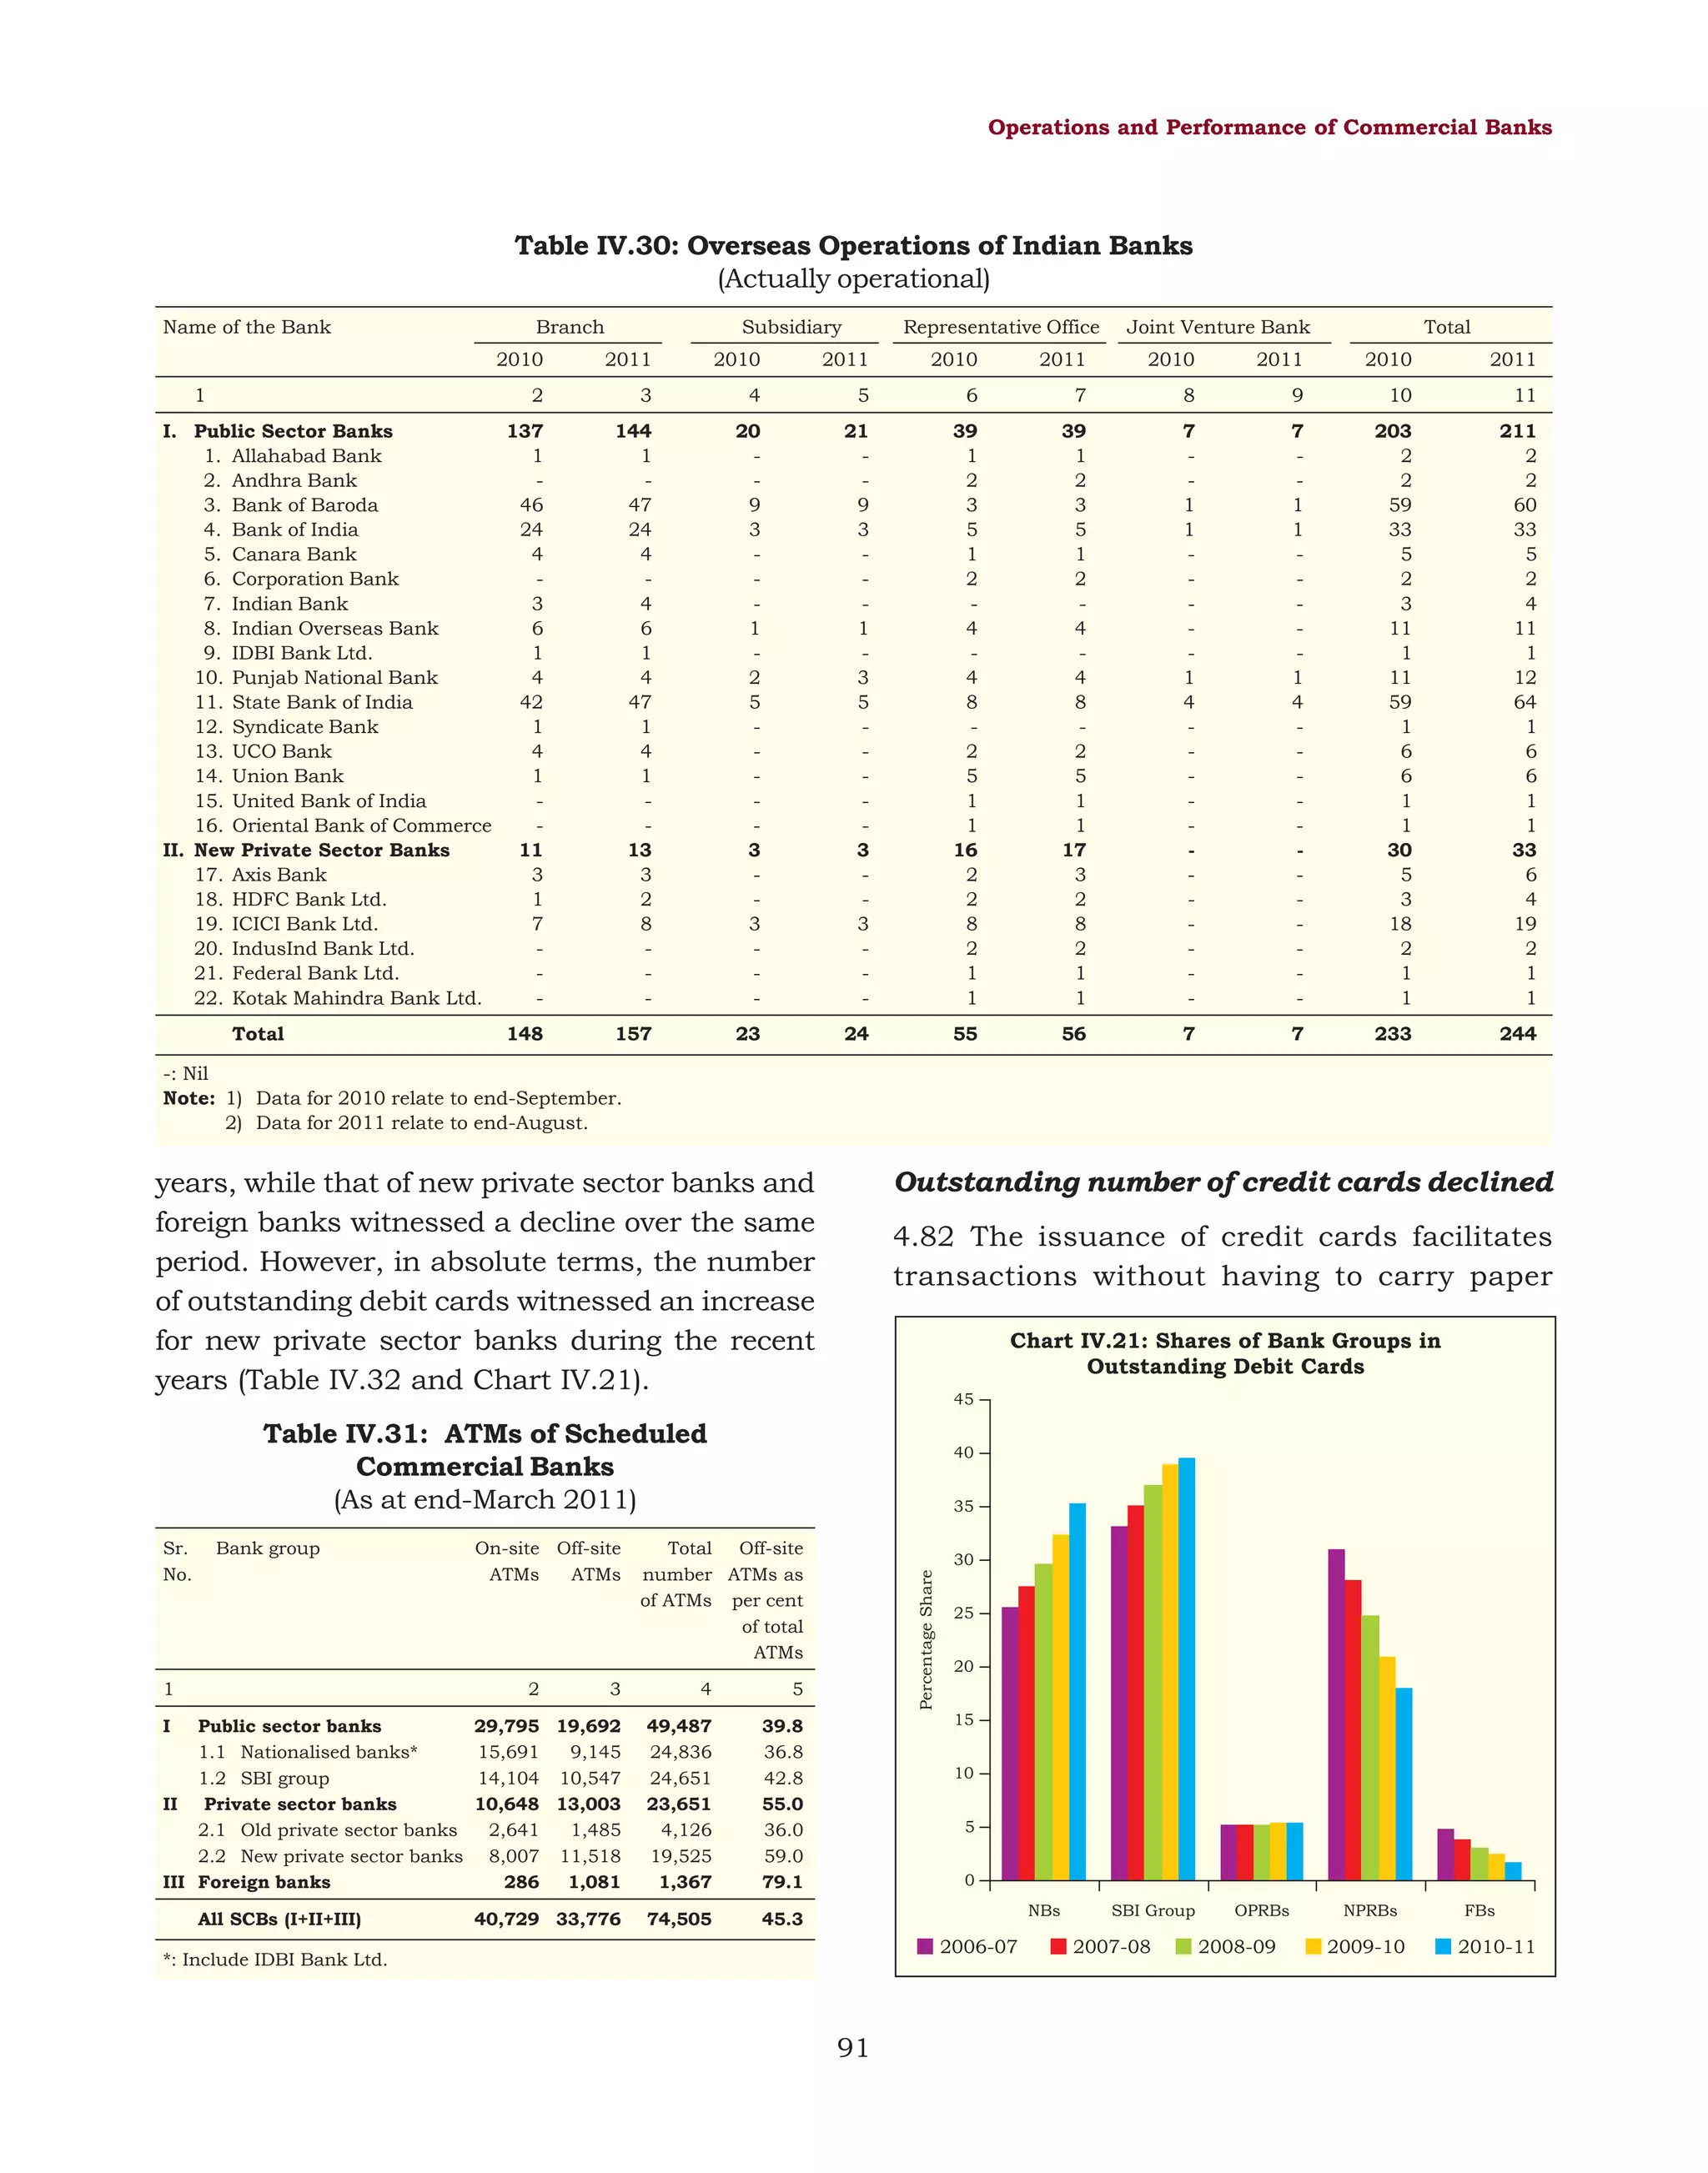
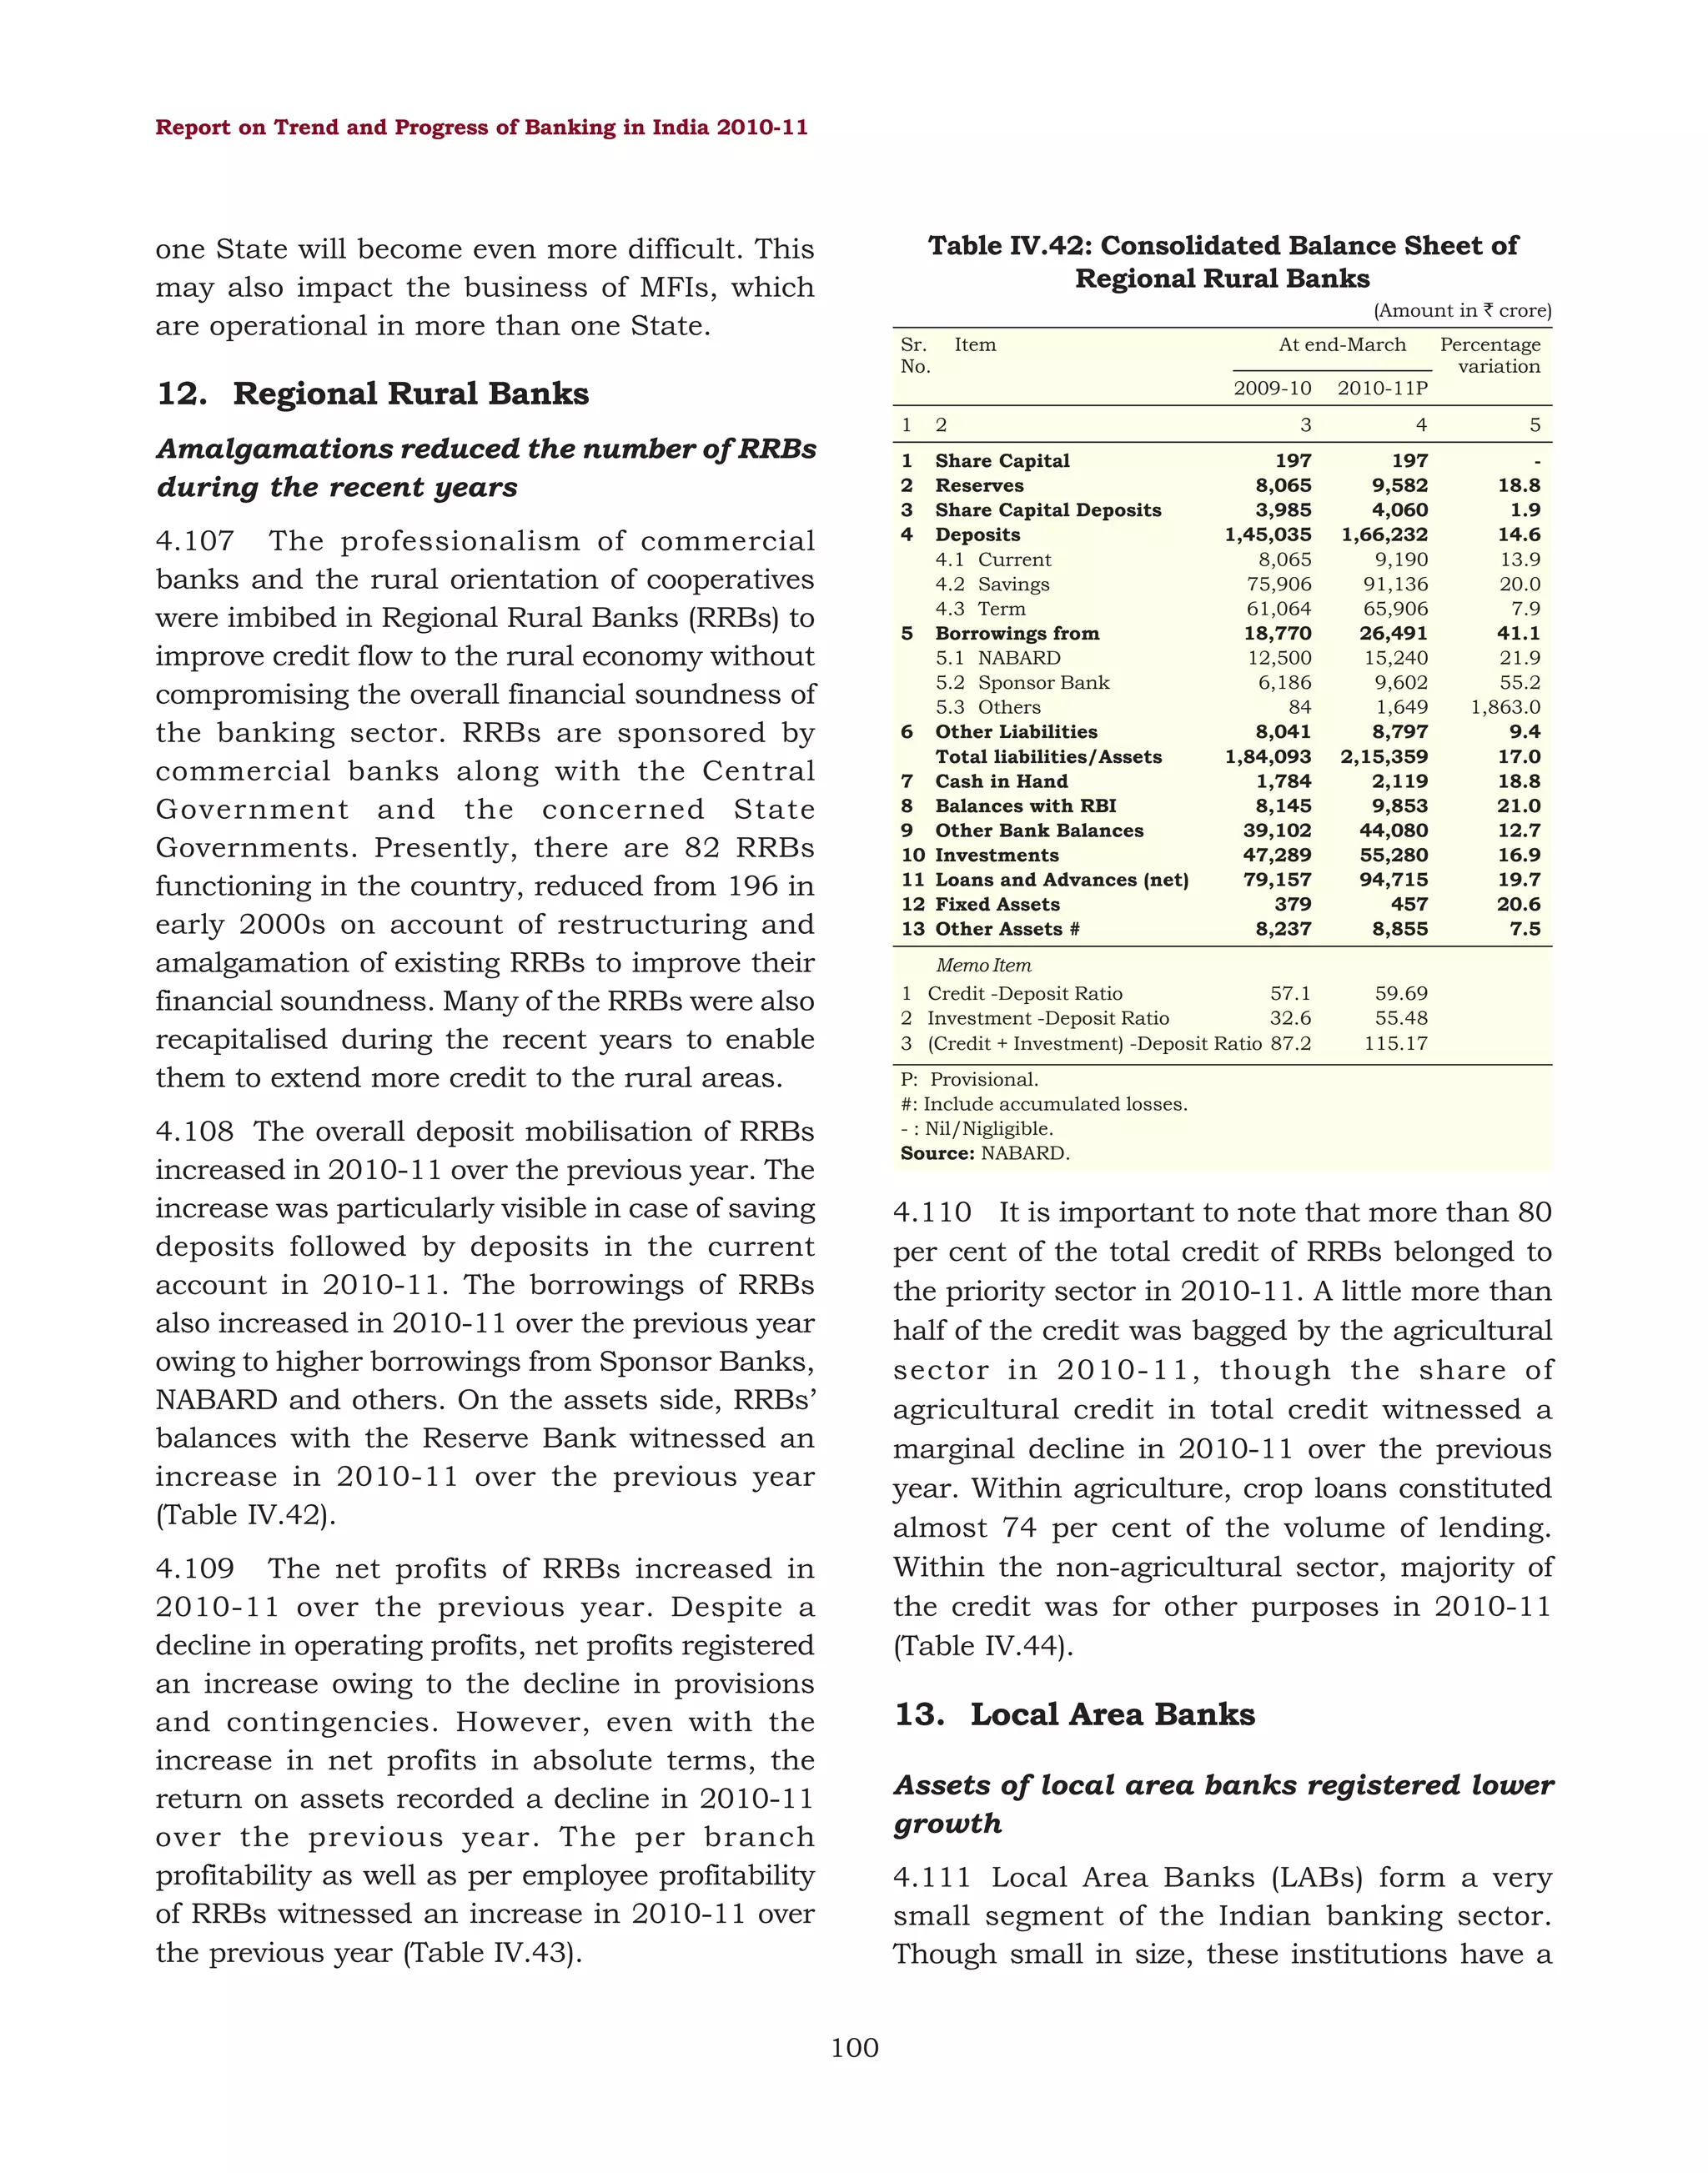
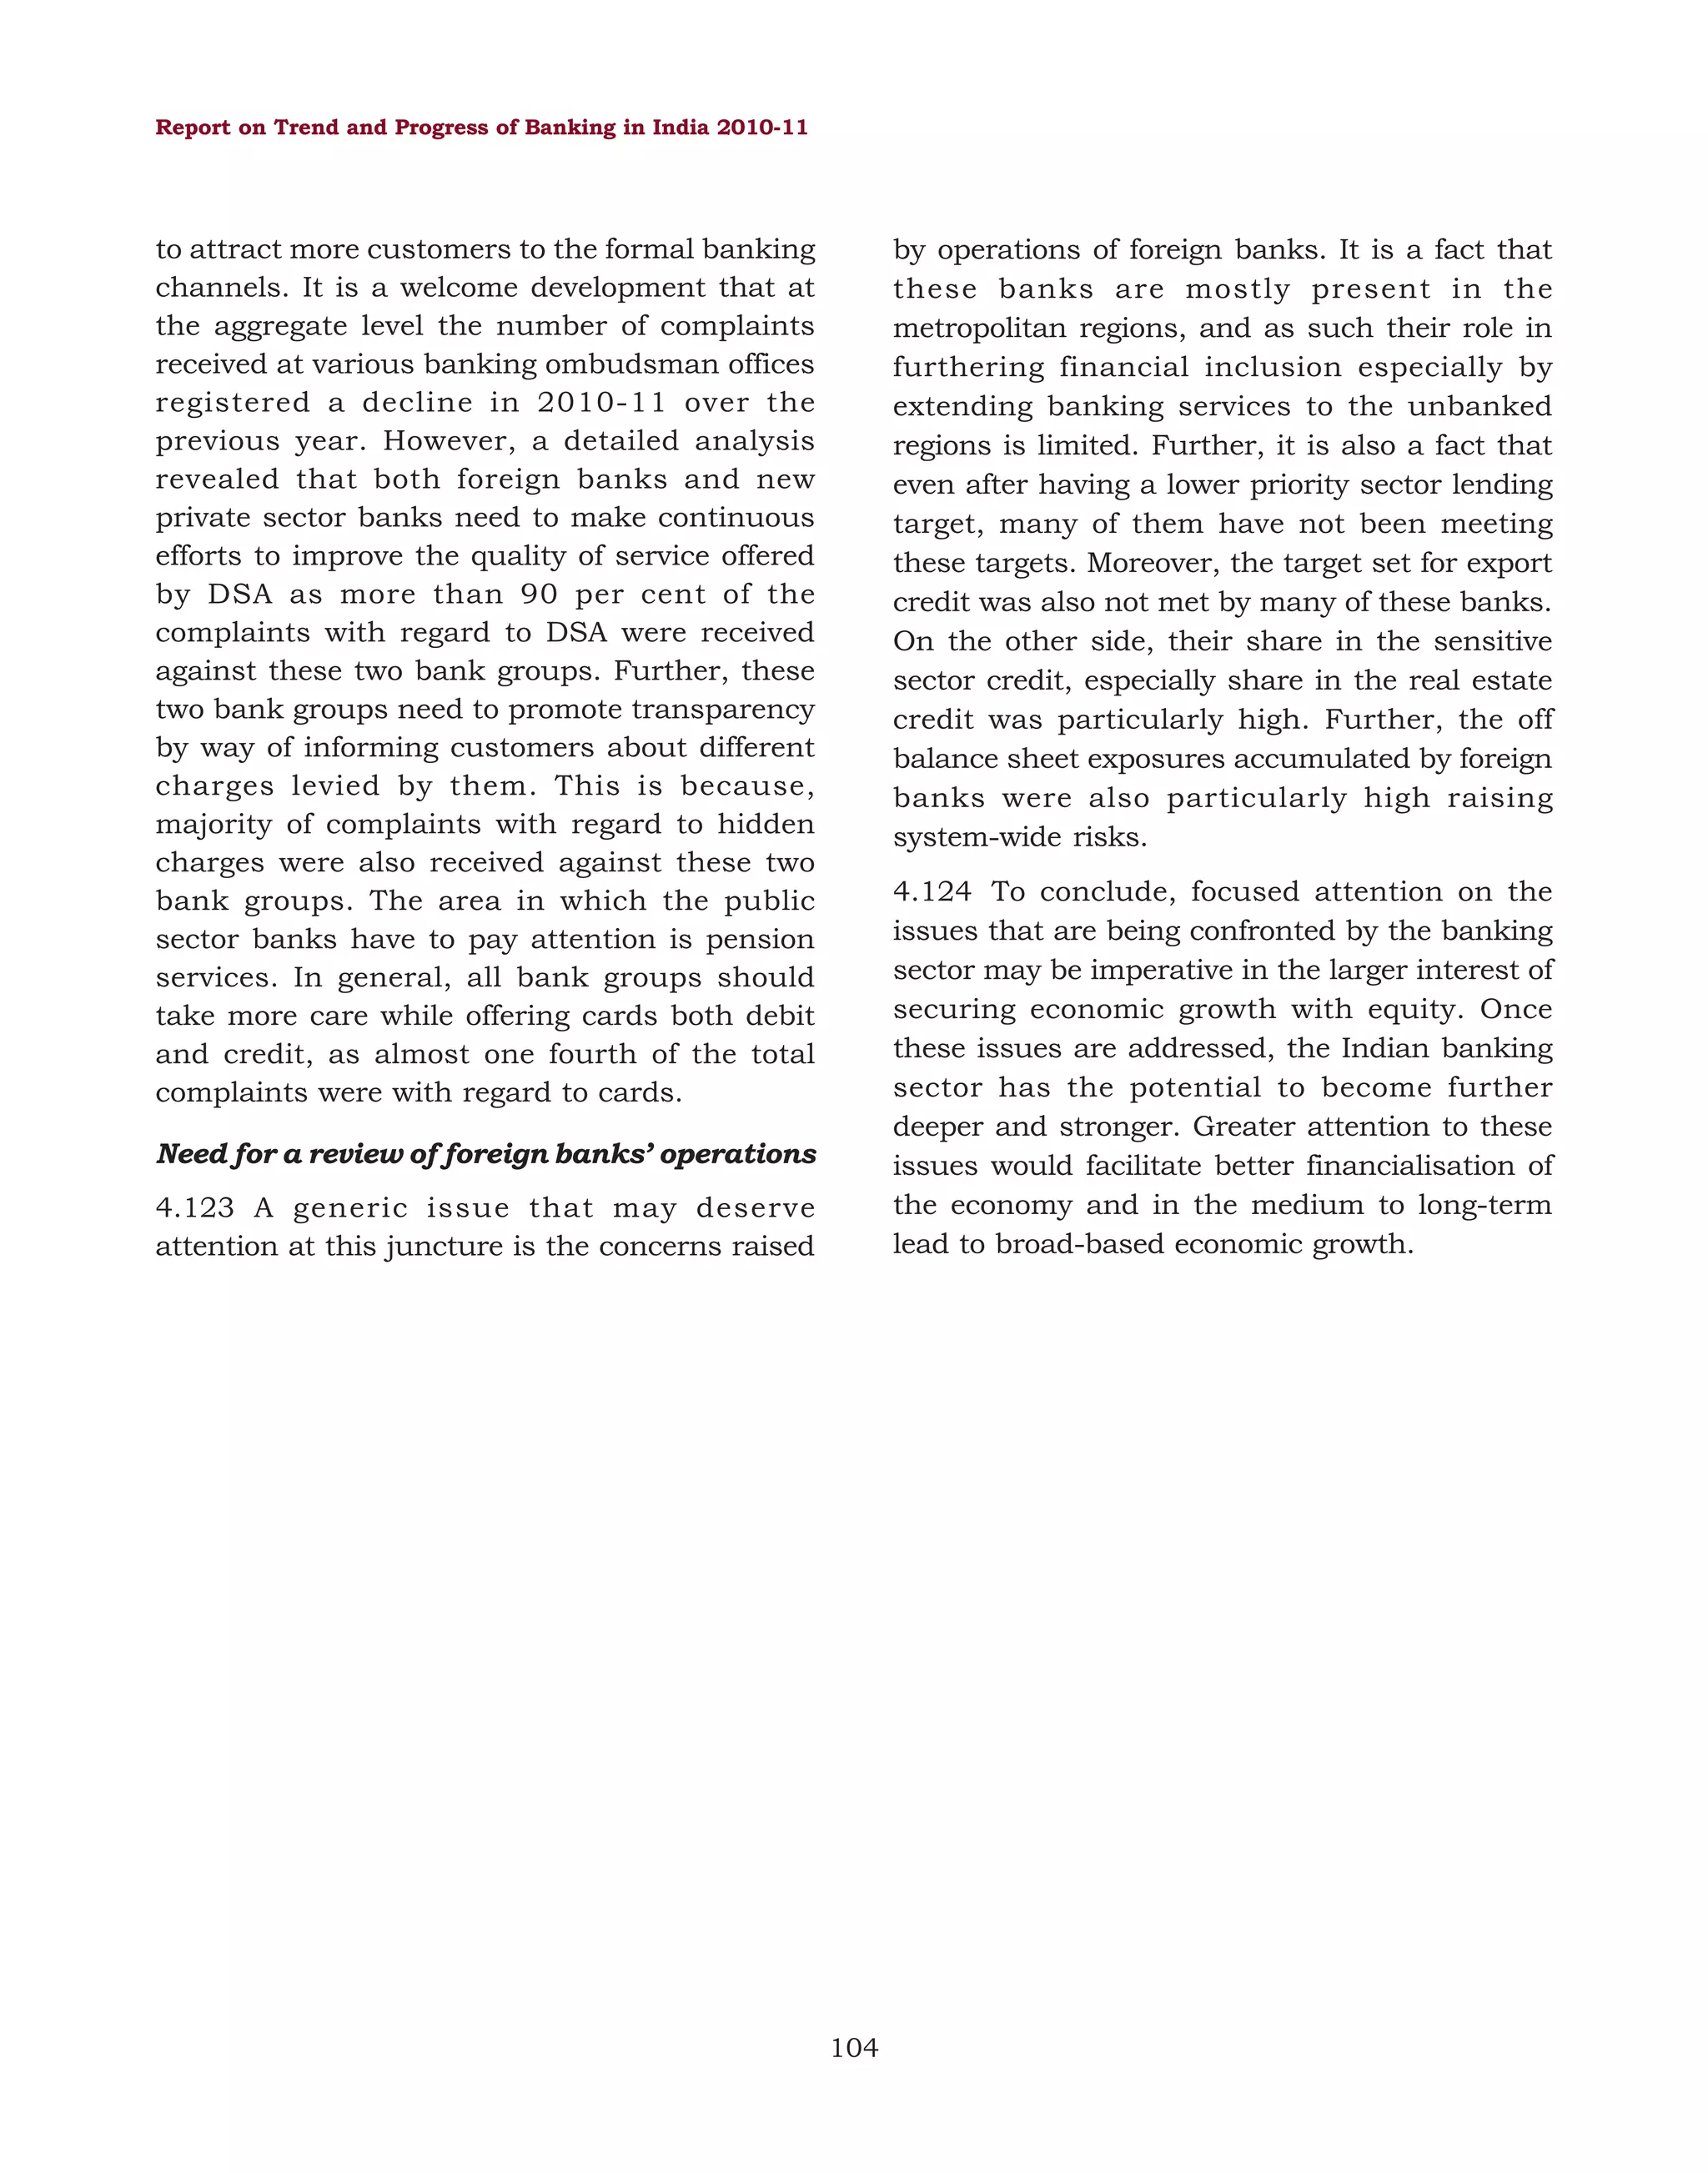
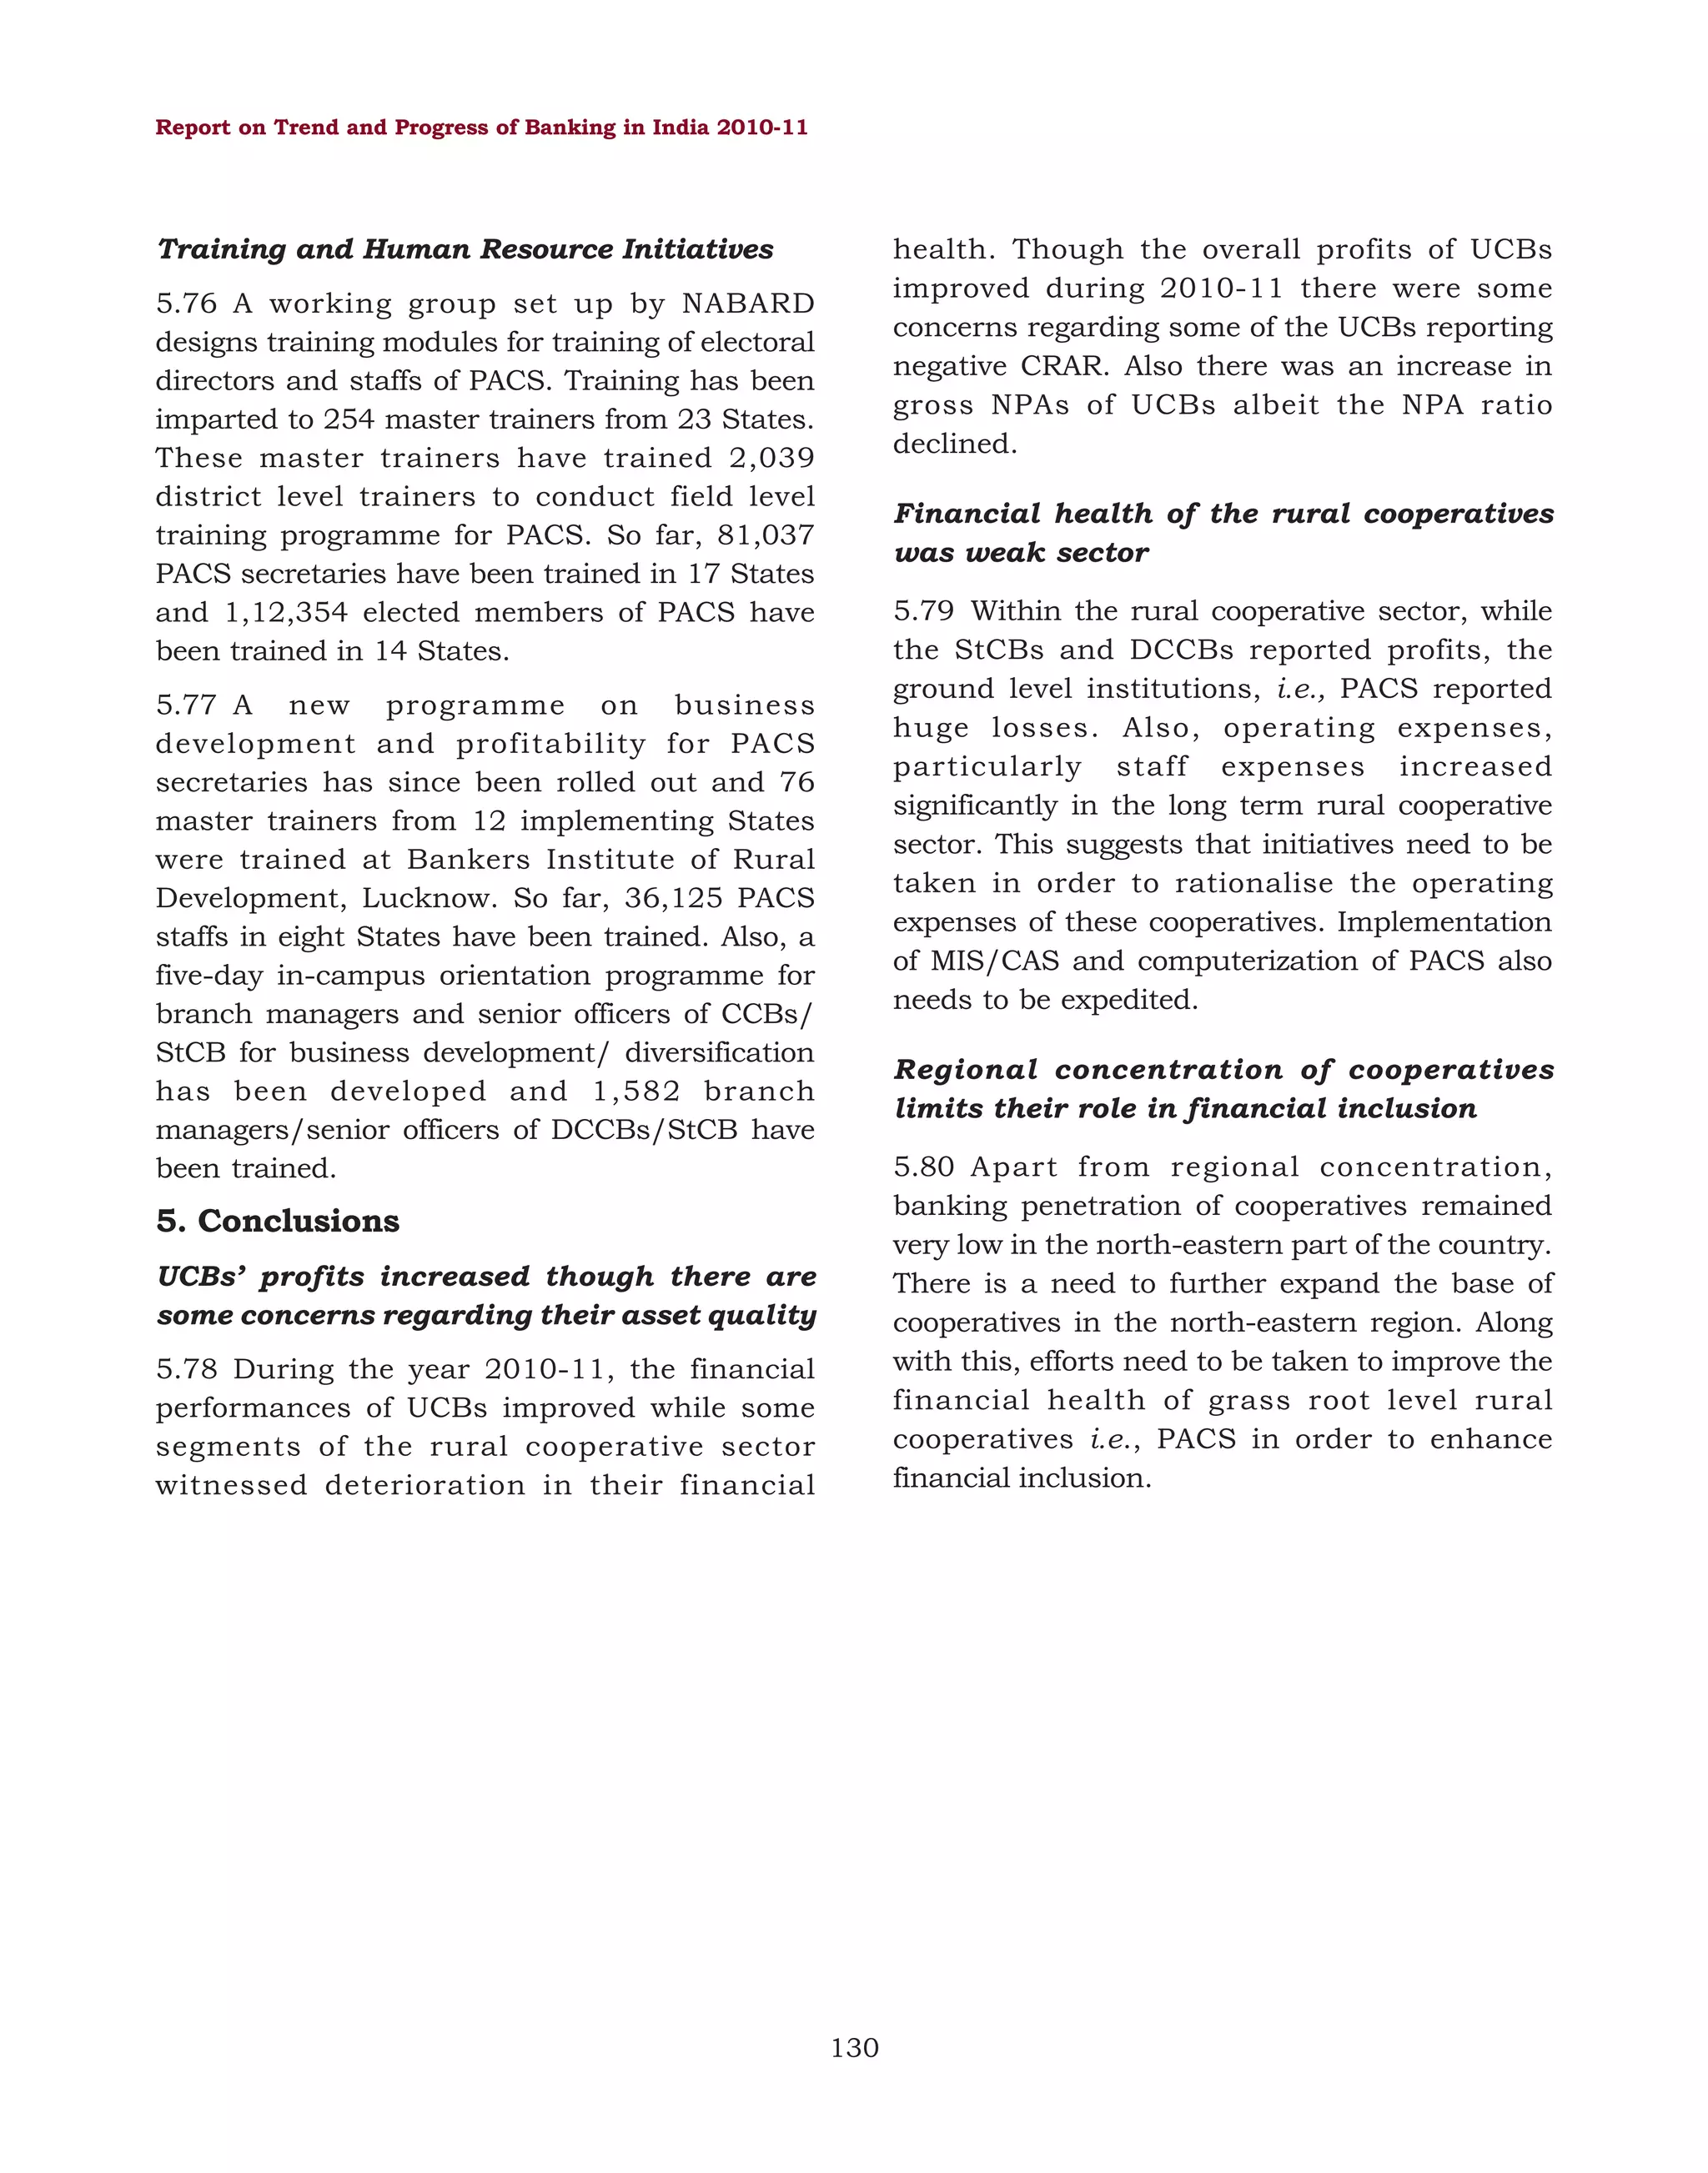
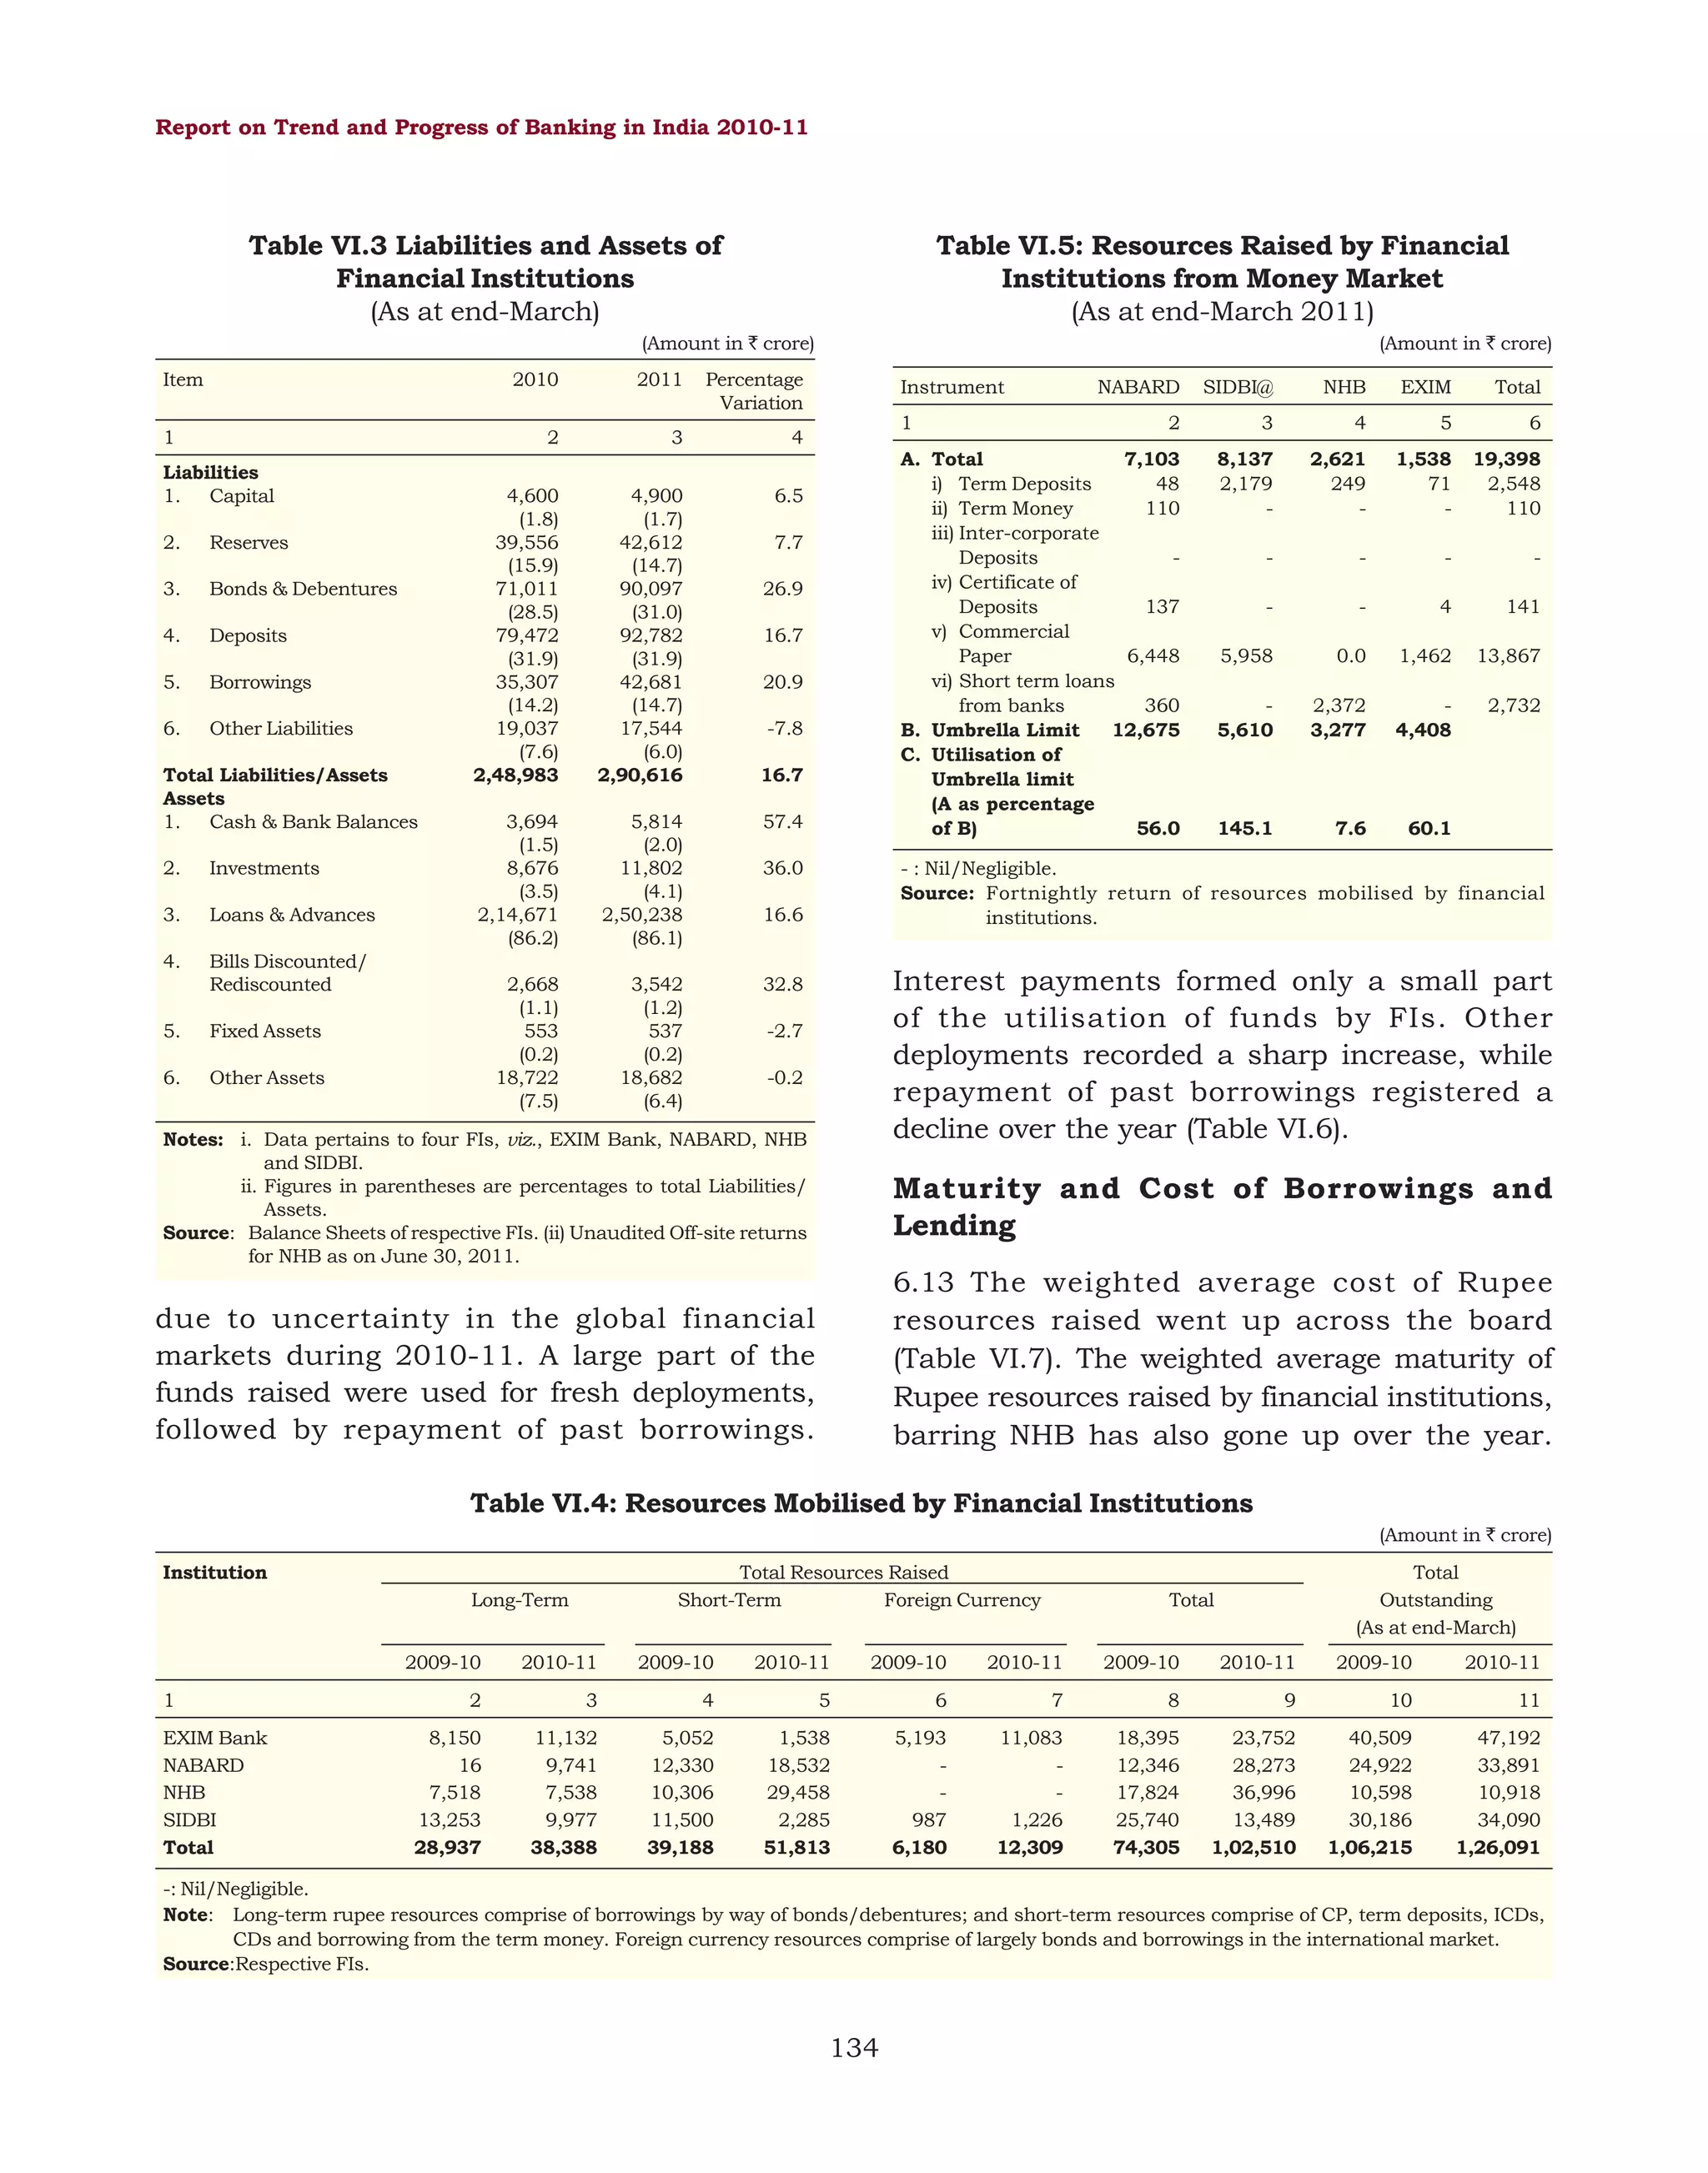
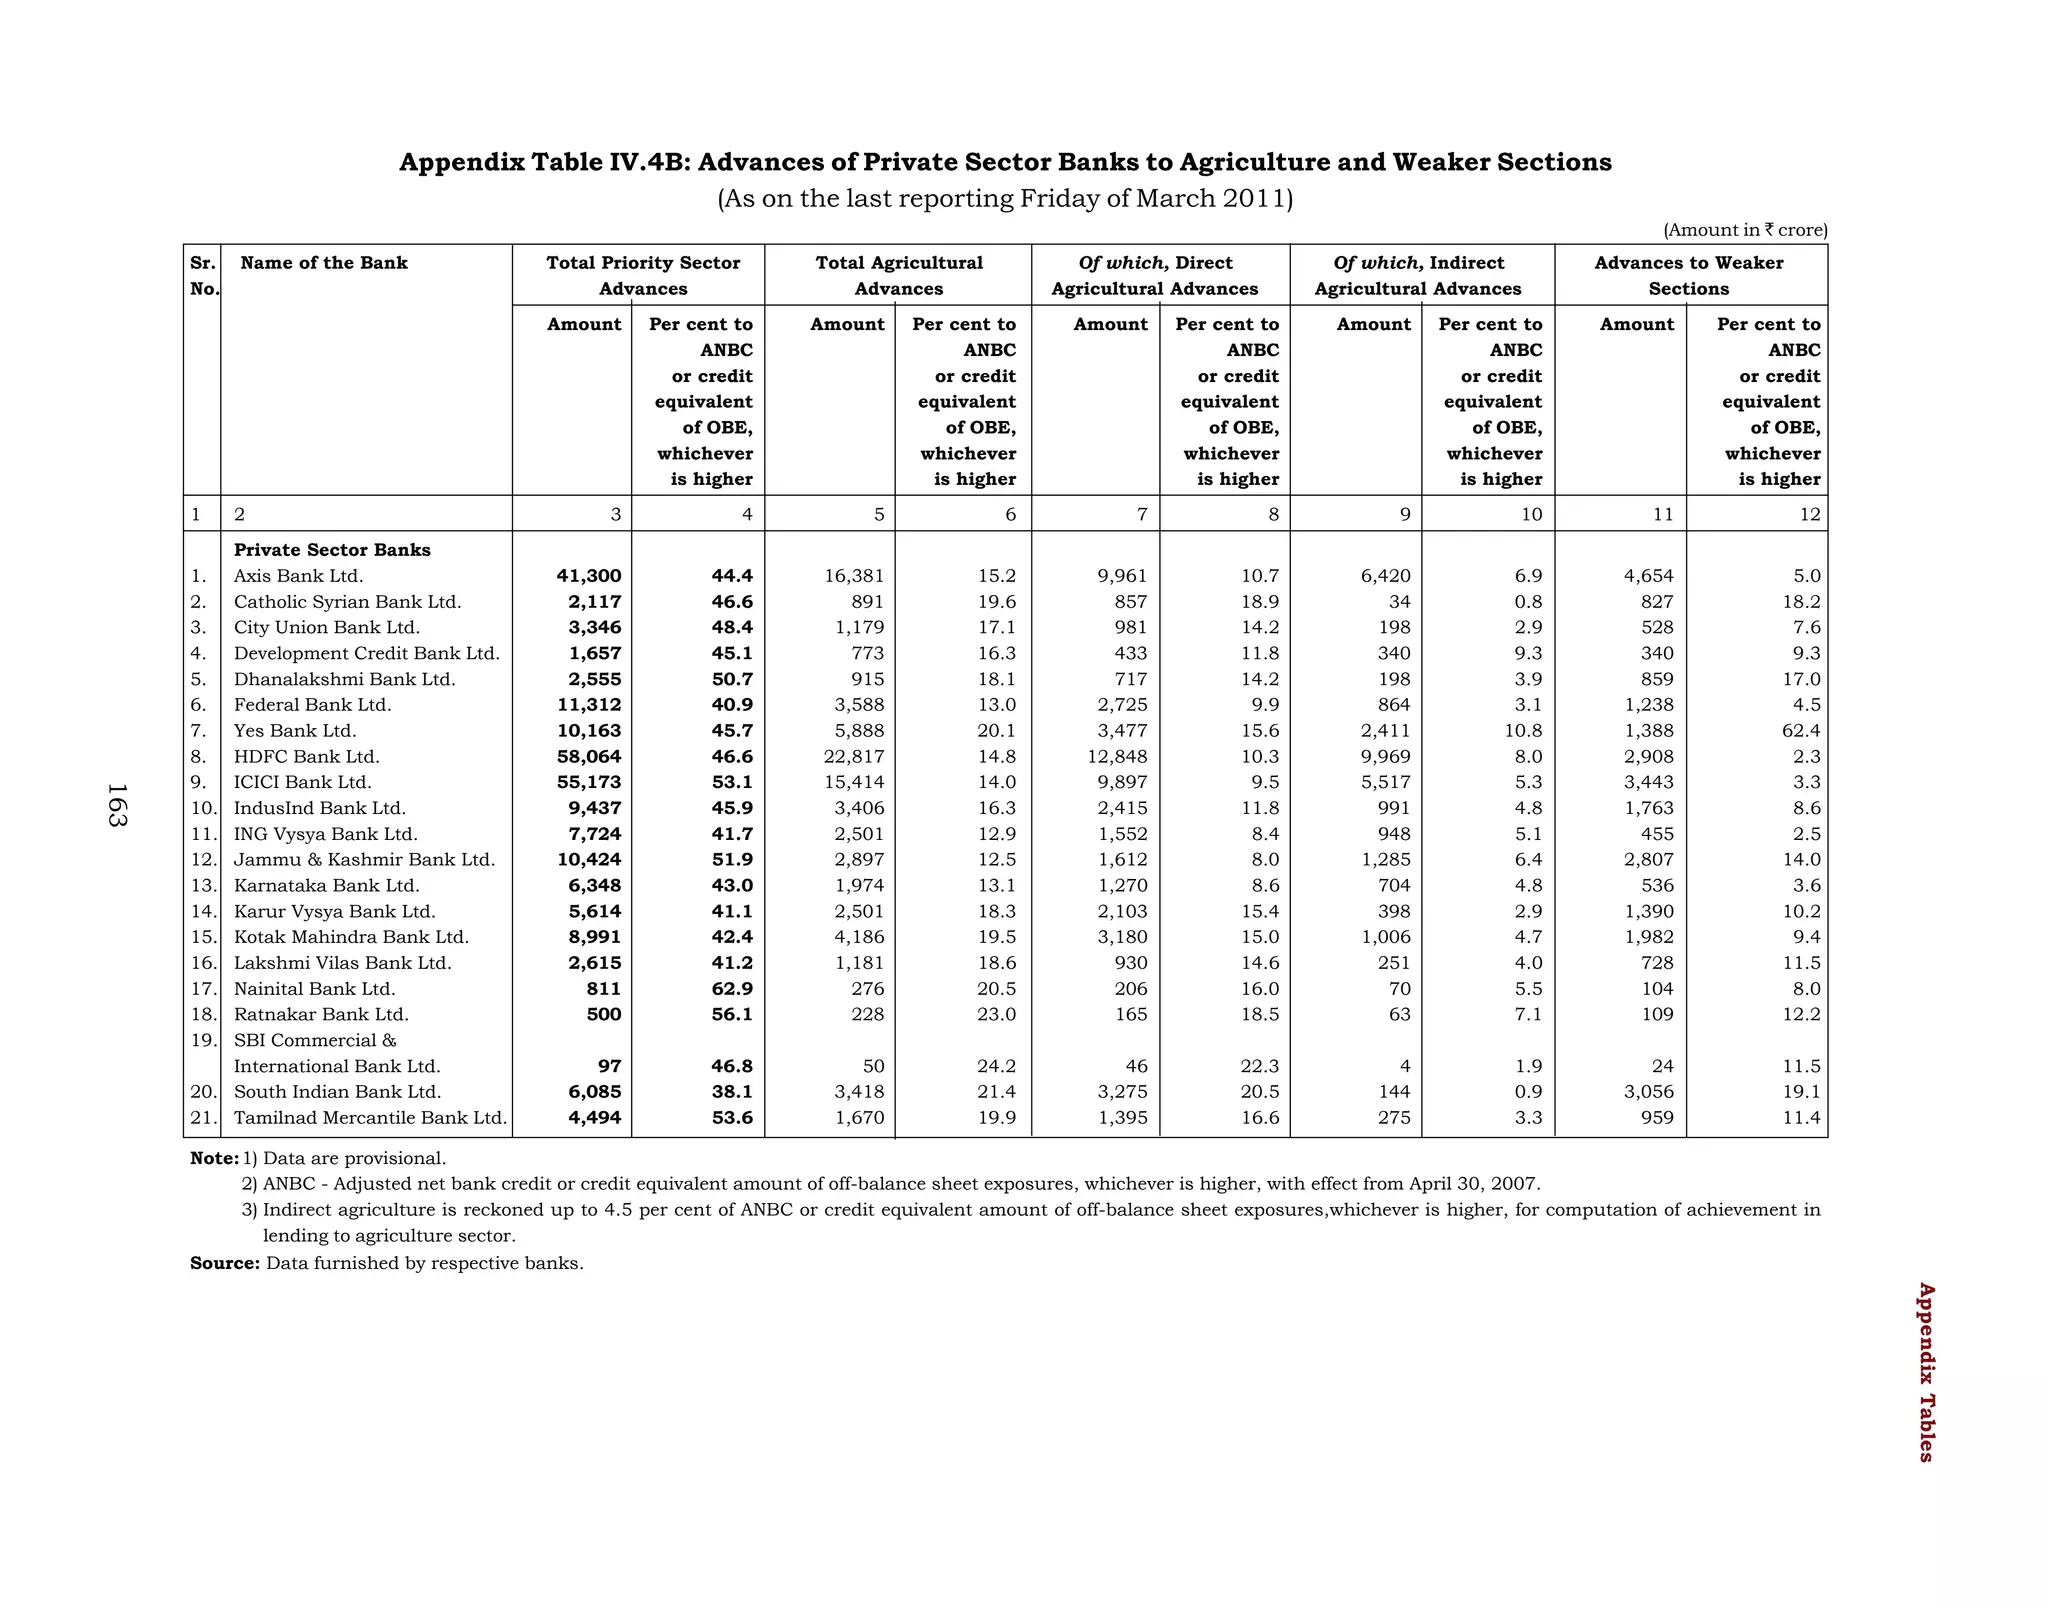
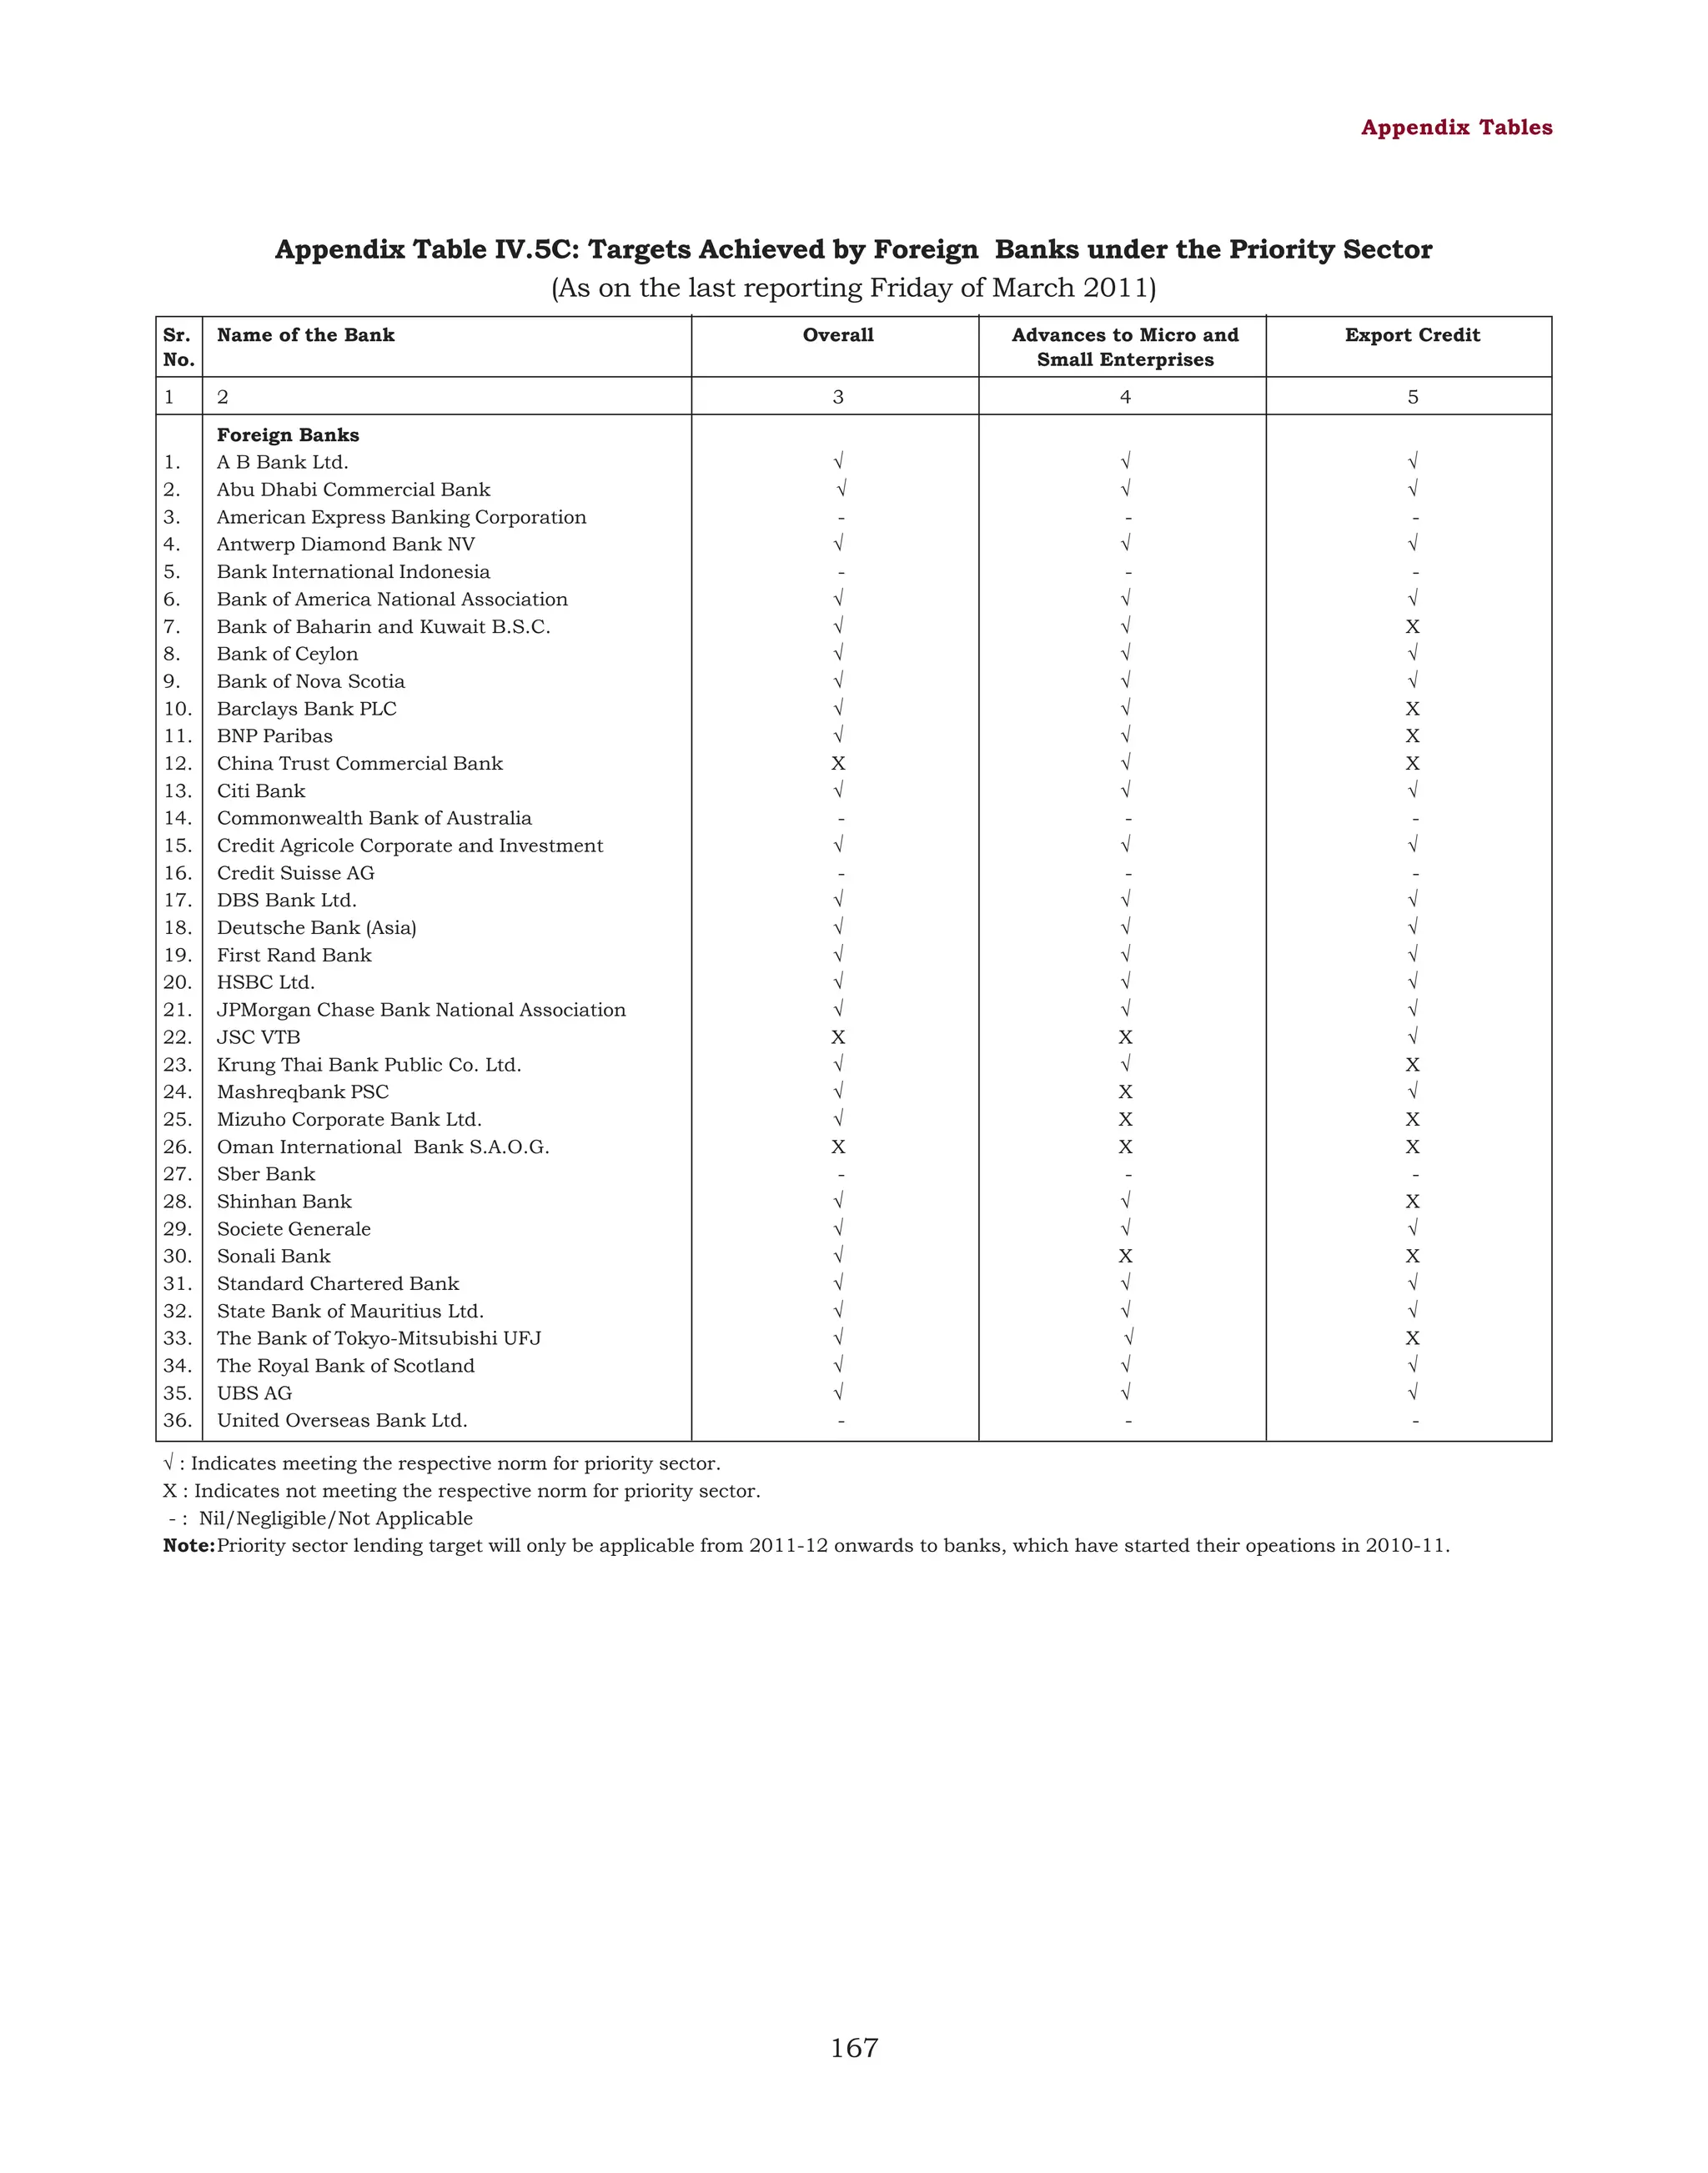
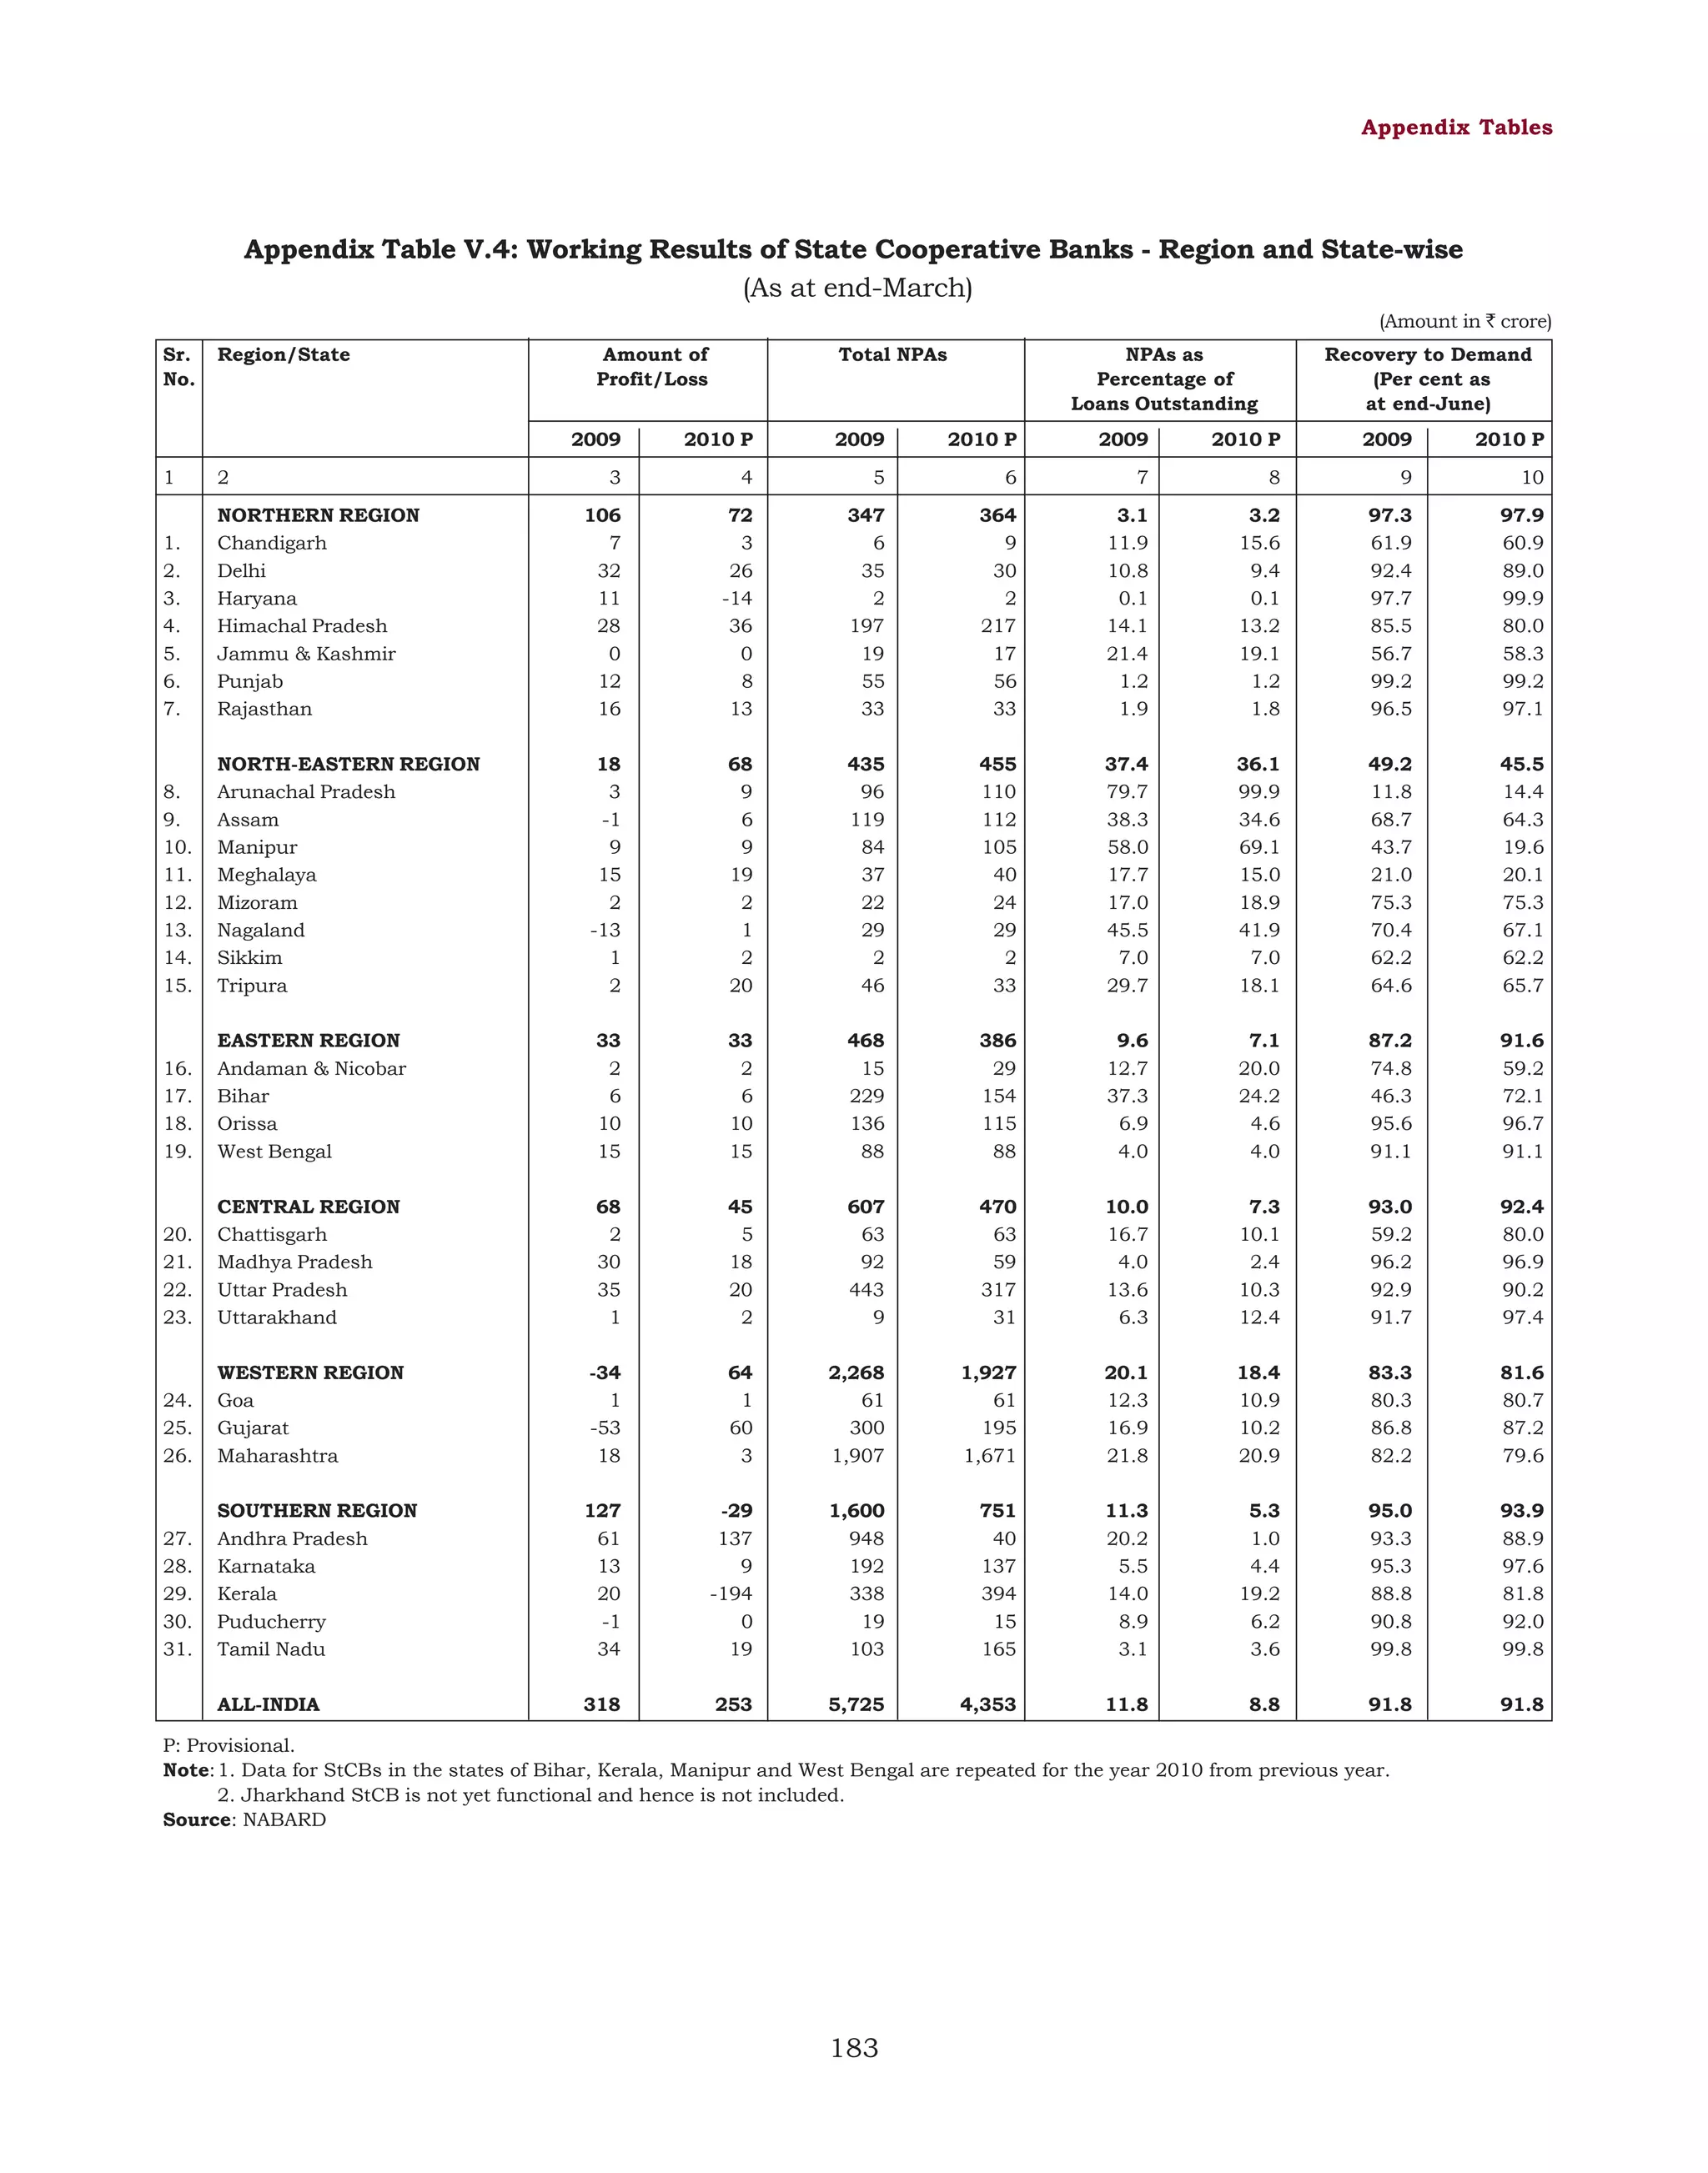
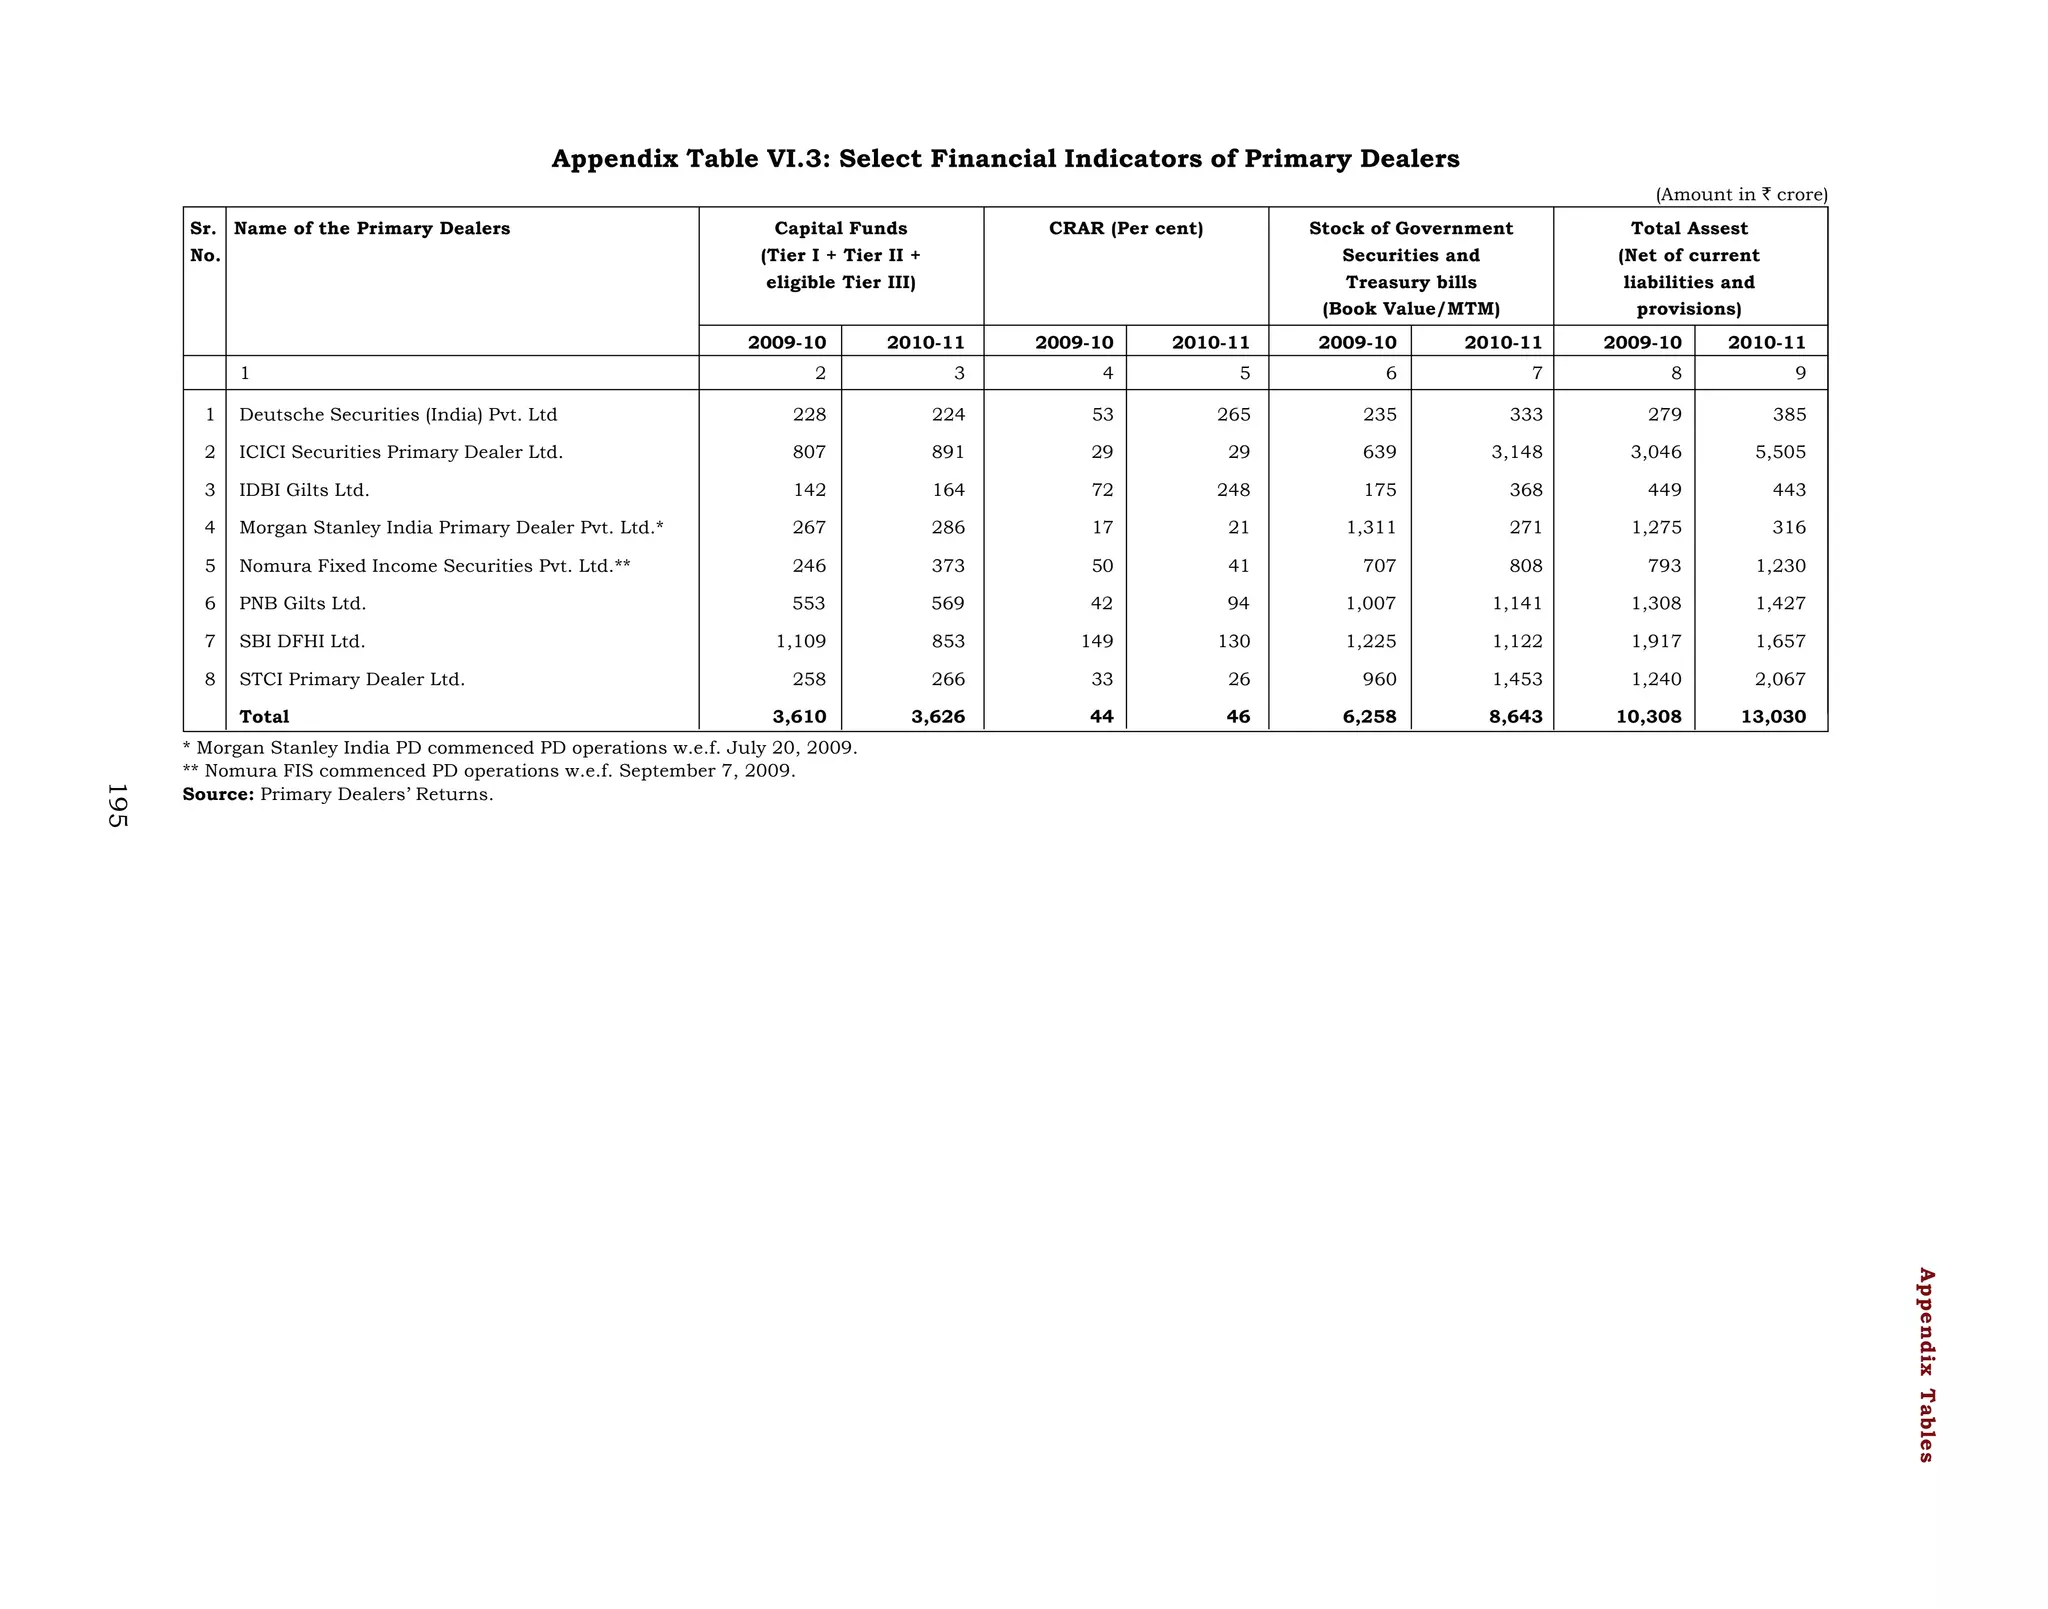
Table IV.4: International Liabilities of Banks – By Type
(As at end-March)
(Amount in ` crore)
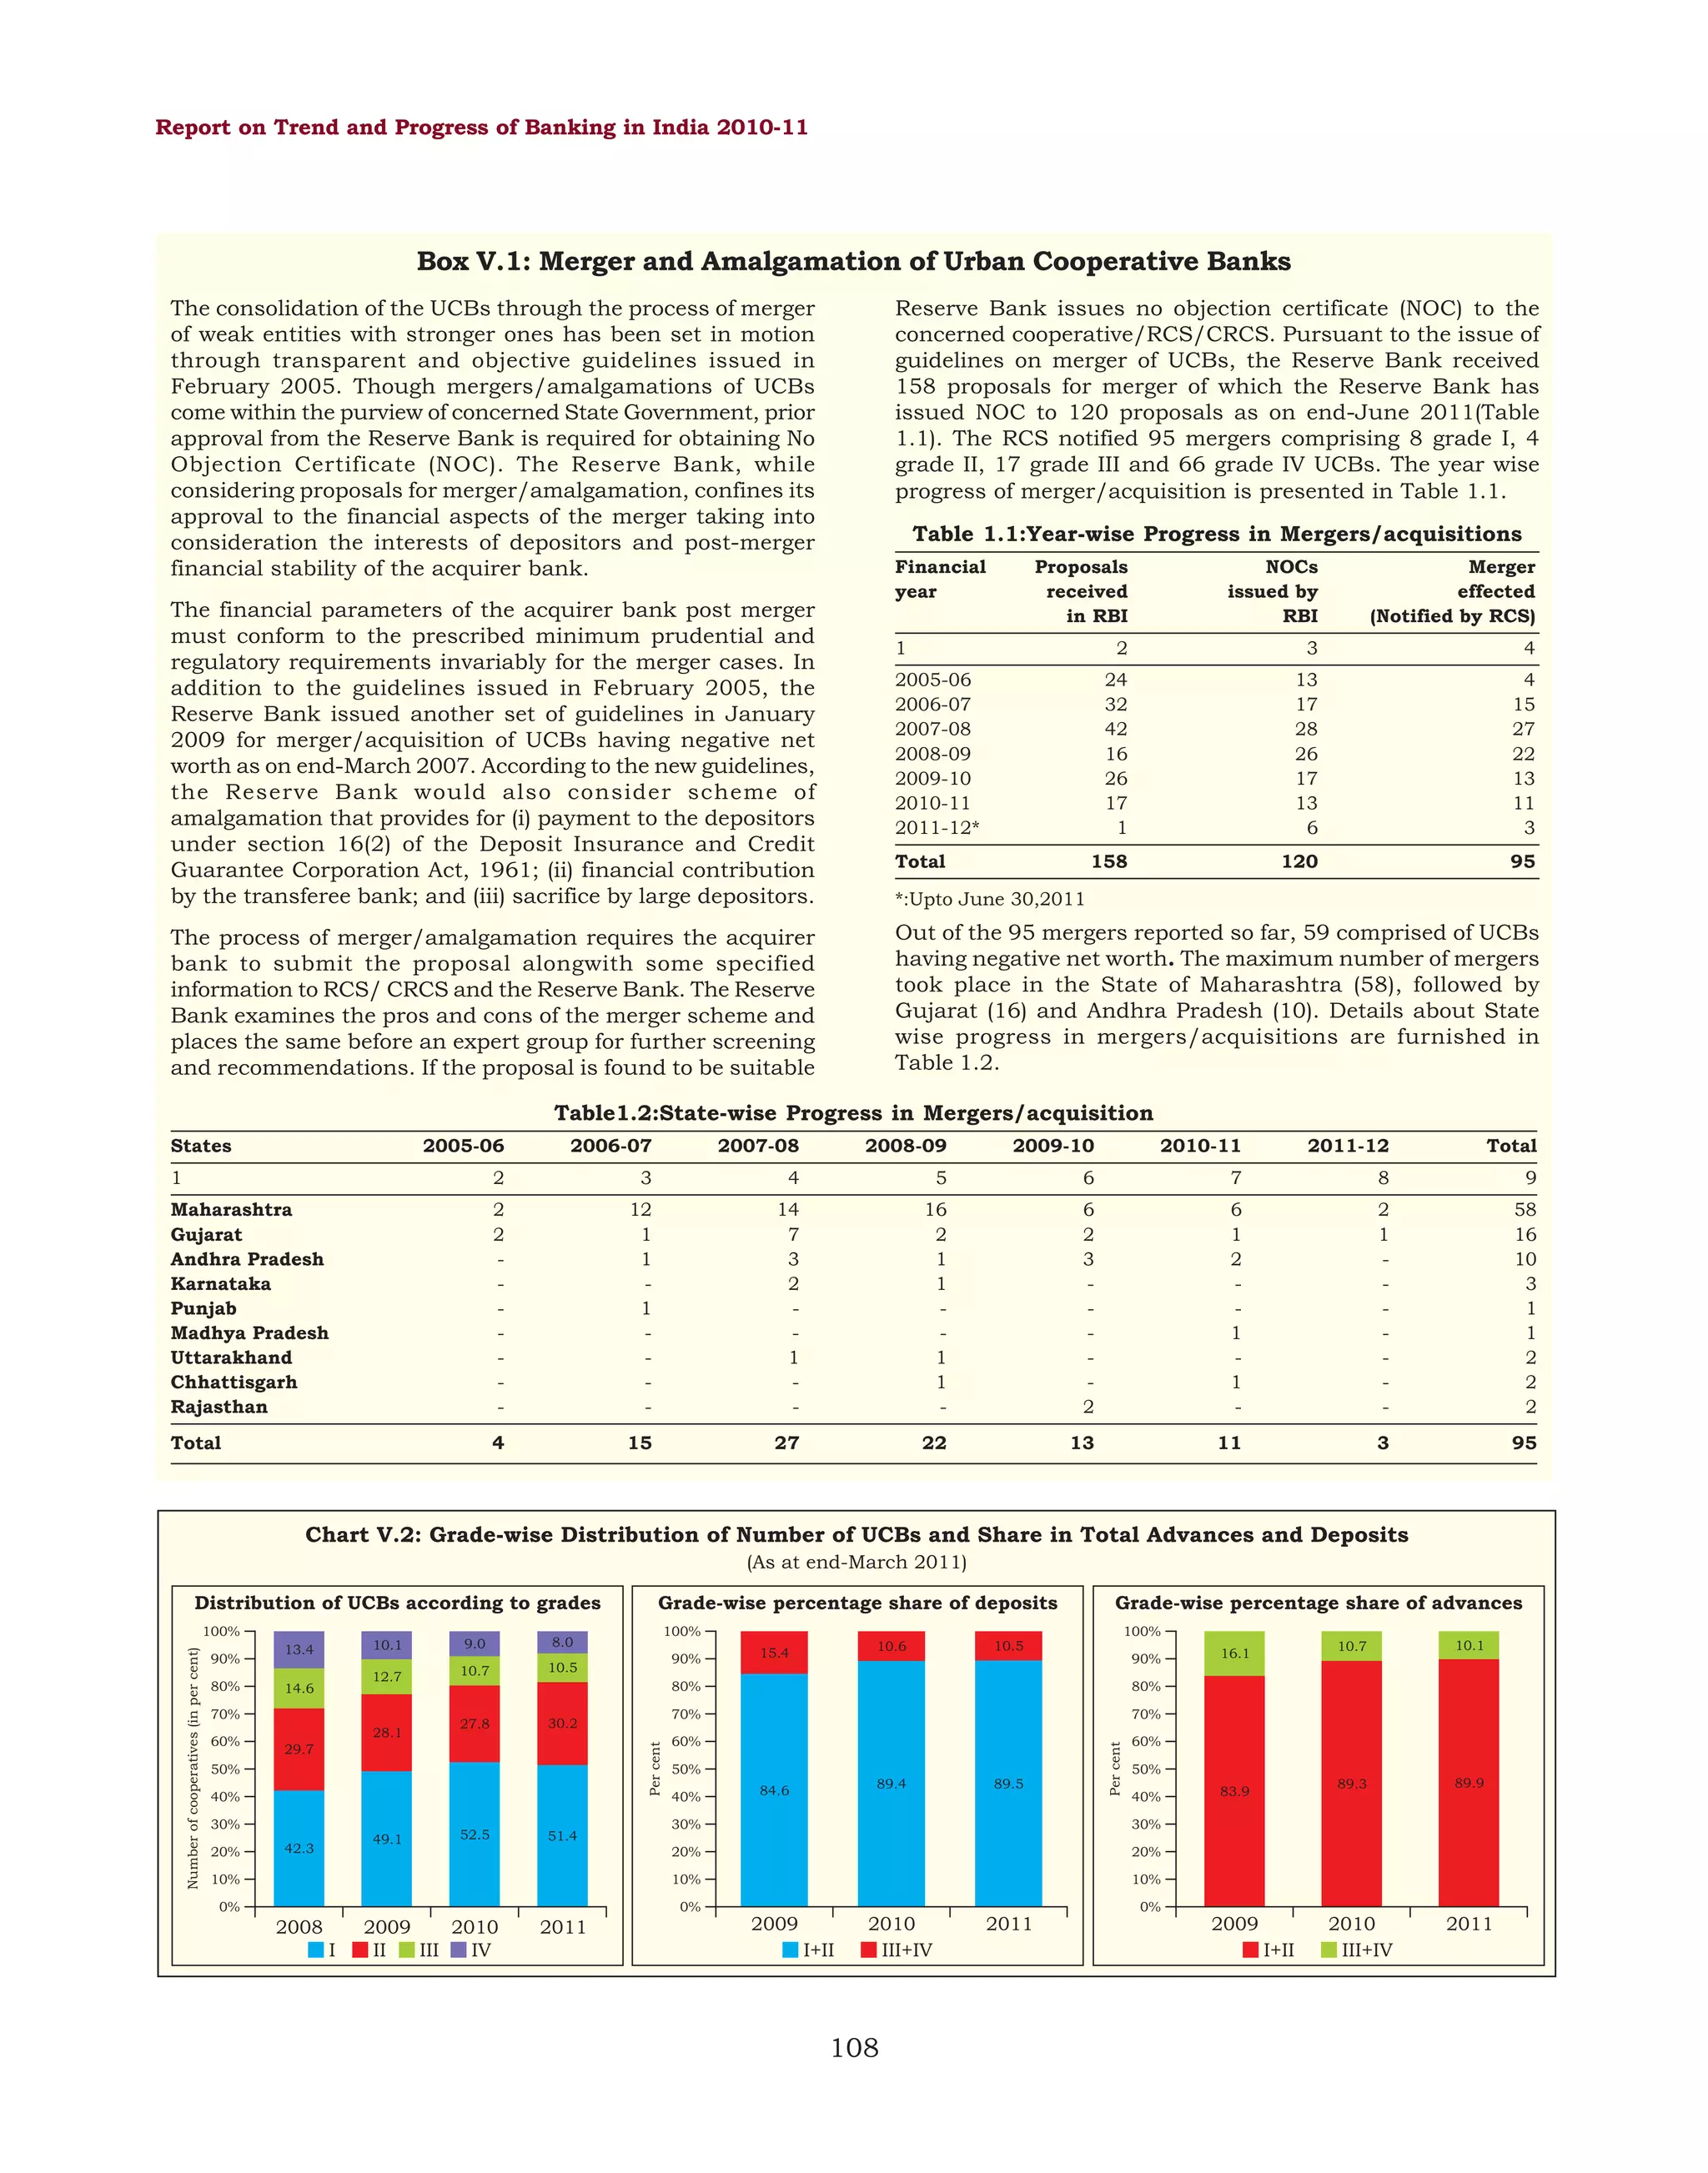
Percentage Variation
Item
2010
1
2011
2010
2011
2
Non-resident External Rupee (NRE) Deposits
Non-Resident Ordinary (NRO) Rupee Deposits
2. Own Issues of Securities/Bonds
3. Other Liabilities
of which:
ADRs/GDRs
Equities of banks held by non-residents
Capital/remittable Profits of Foreign Banks in India
and other unclassified International Liabilities
Total International Liabilities
3
4
5
3,38,574
(74.9)
72,234
(16.0)
74,354
(16.4)
1,22,380
(27.1)
30,824
(6.8)
5,439
(1.2)
1,08,166
(23.9)
30,391
(6.7)
50,313
(11.1)
27,462
(6.1)
3,78,221
(74.9)
77,413
(14.8)
95,419
(18.3)
1,21,229
(23.2)
41,072
(7.9)
4,575
(0.9)
1,38,658
(26.6)
34,699
(6.7)
73,159
(14.0)
30,799
(5.9)
4.8
11.7
-0.8
7.2
-1.4
28.3
-1.7
-0.9
49.0
33.2
-20.8
-15.9
91.3
28.2
193.4
14.2
165.8
45.4
0.8
12.2
4,52,179
1. Deposits and Borrowings
of which:
Foreign Currency Non Resident Deposits (Bank)
[FCNR (B)] scheme
Foreign Currency Borrowings *
5,21,454
17.0
15.3
* : Include inter-bank borrowings in India and from abroad, and external commercial borrowings of banks.
Note: Figures in parentheses are percentages to total International liabilities.
Source: Locational Banking Statistics.
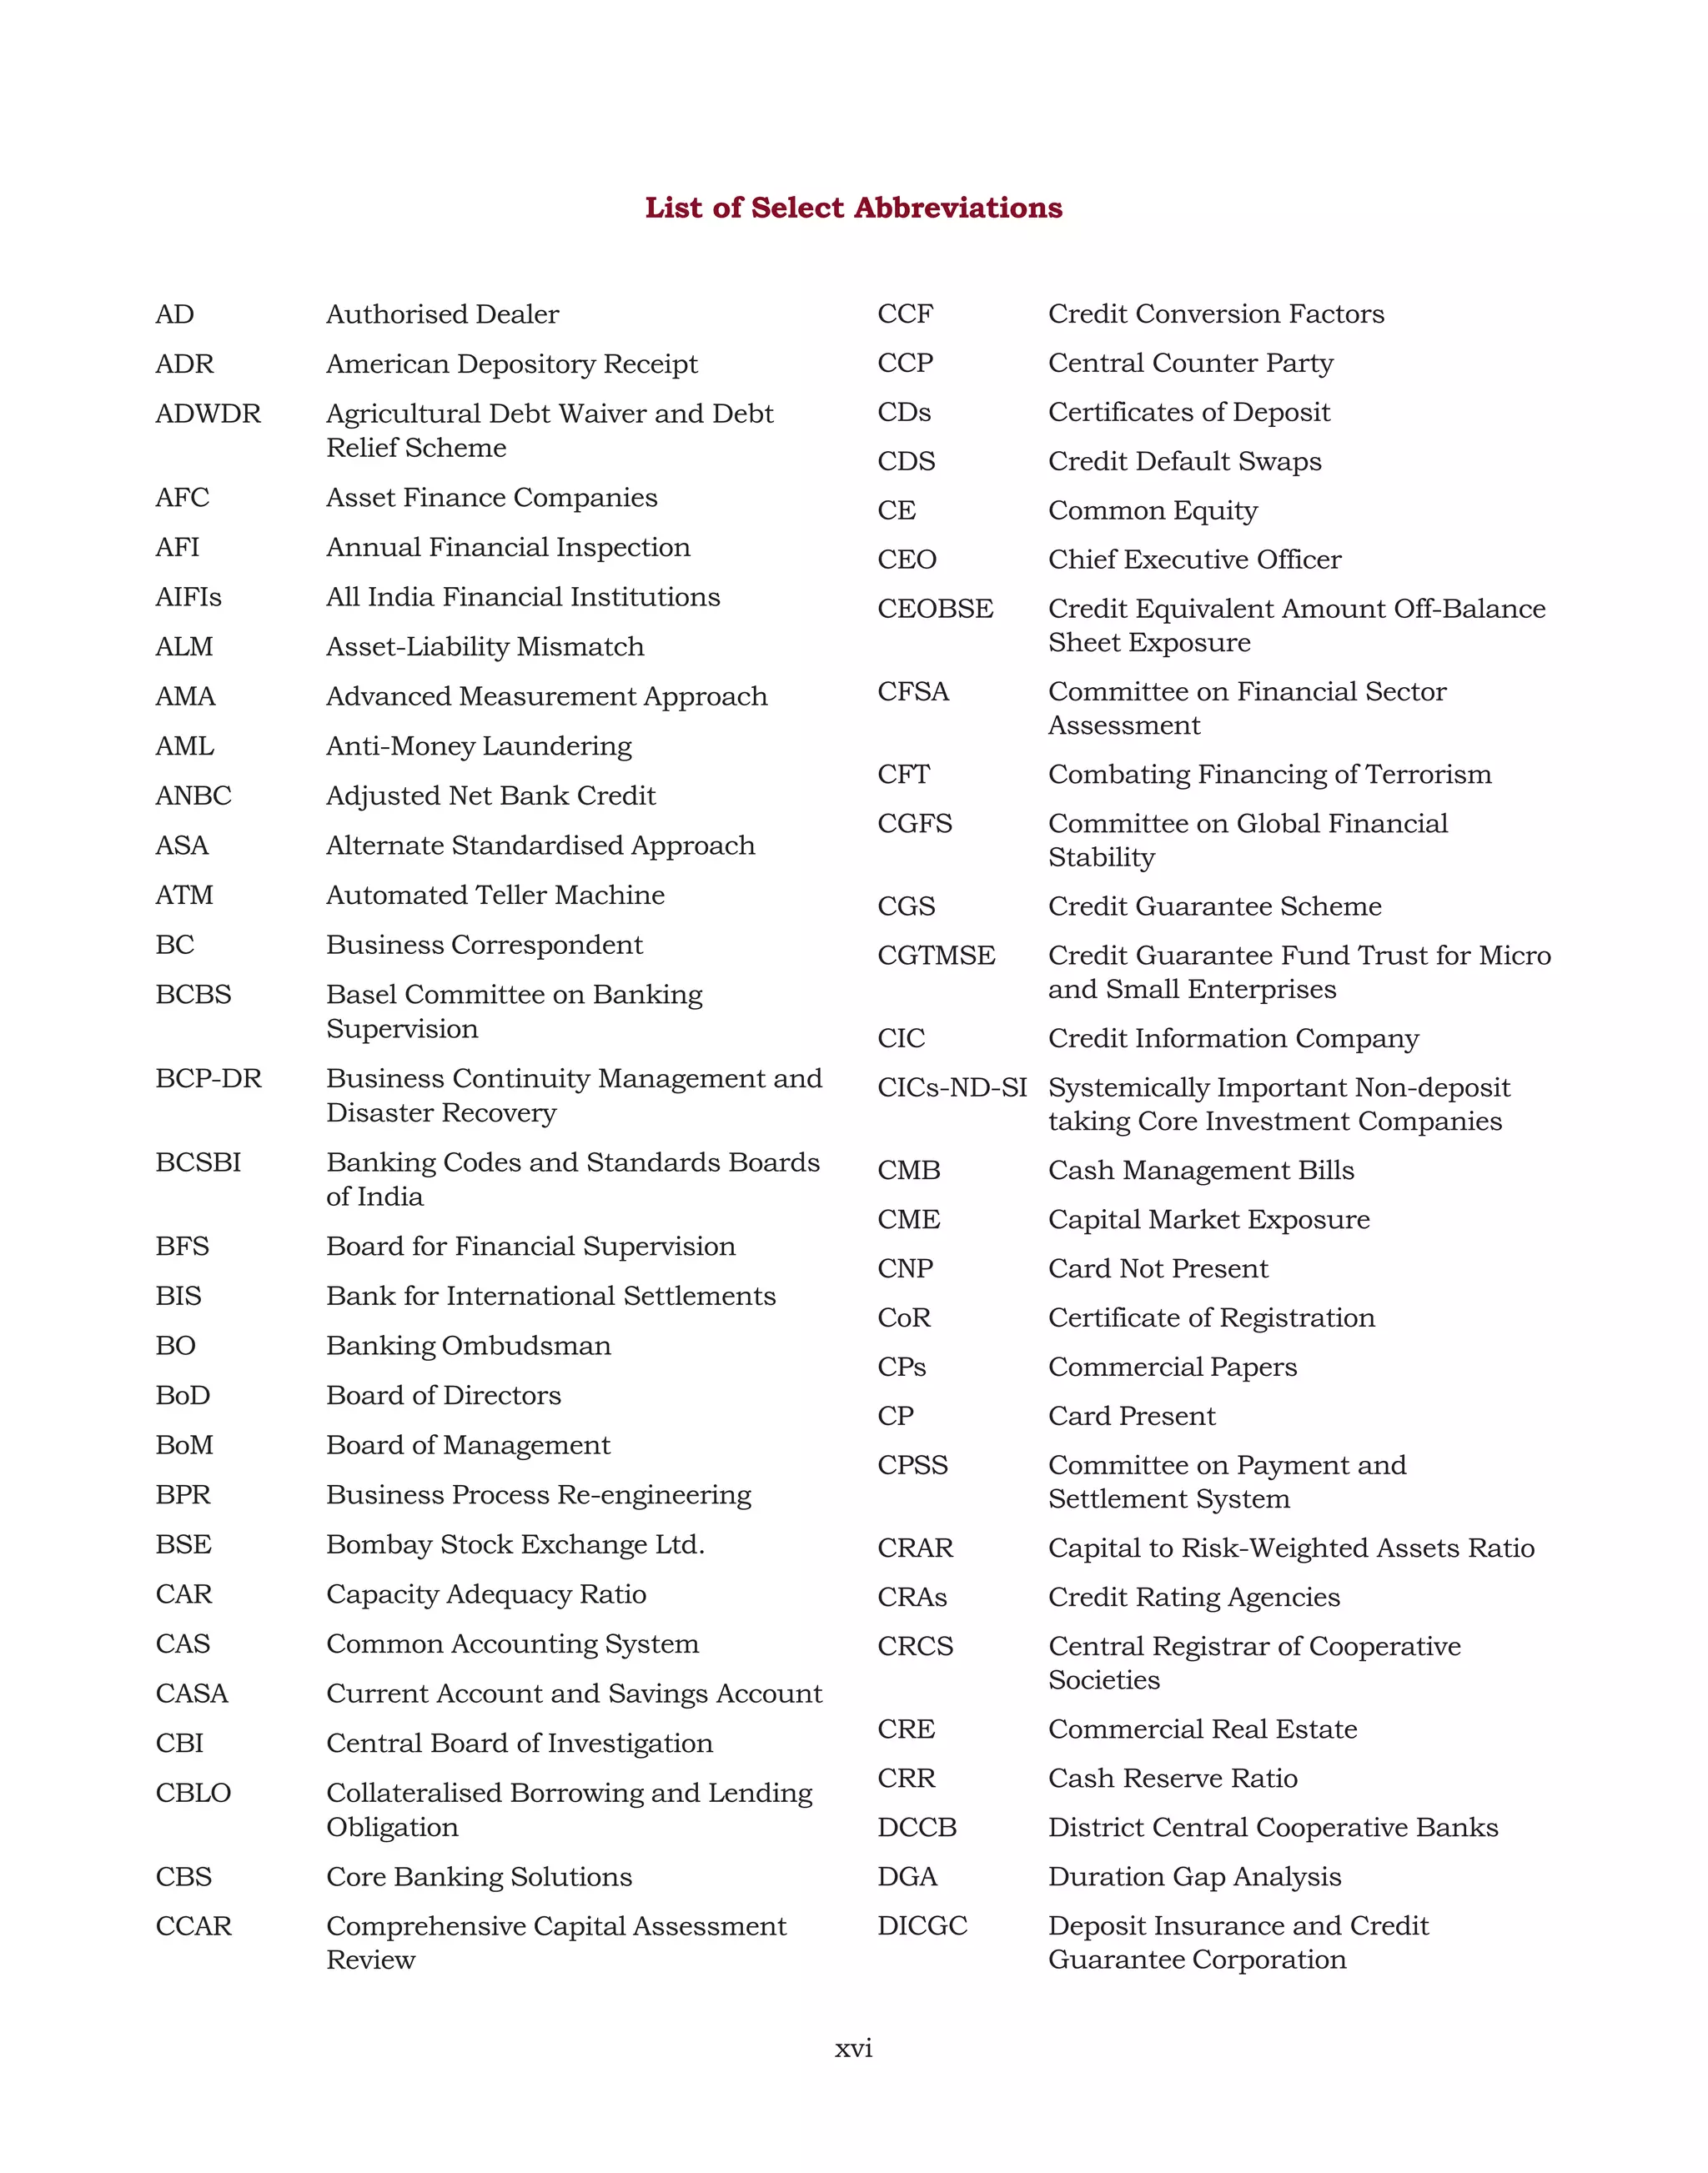
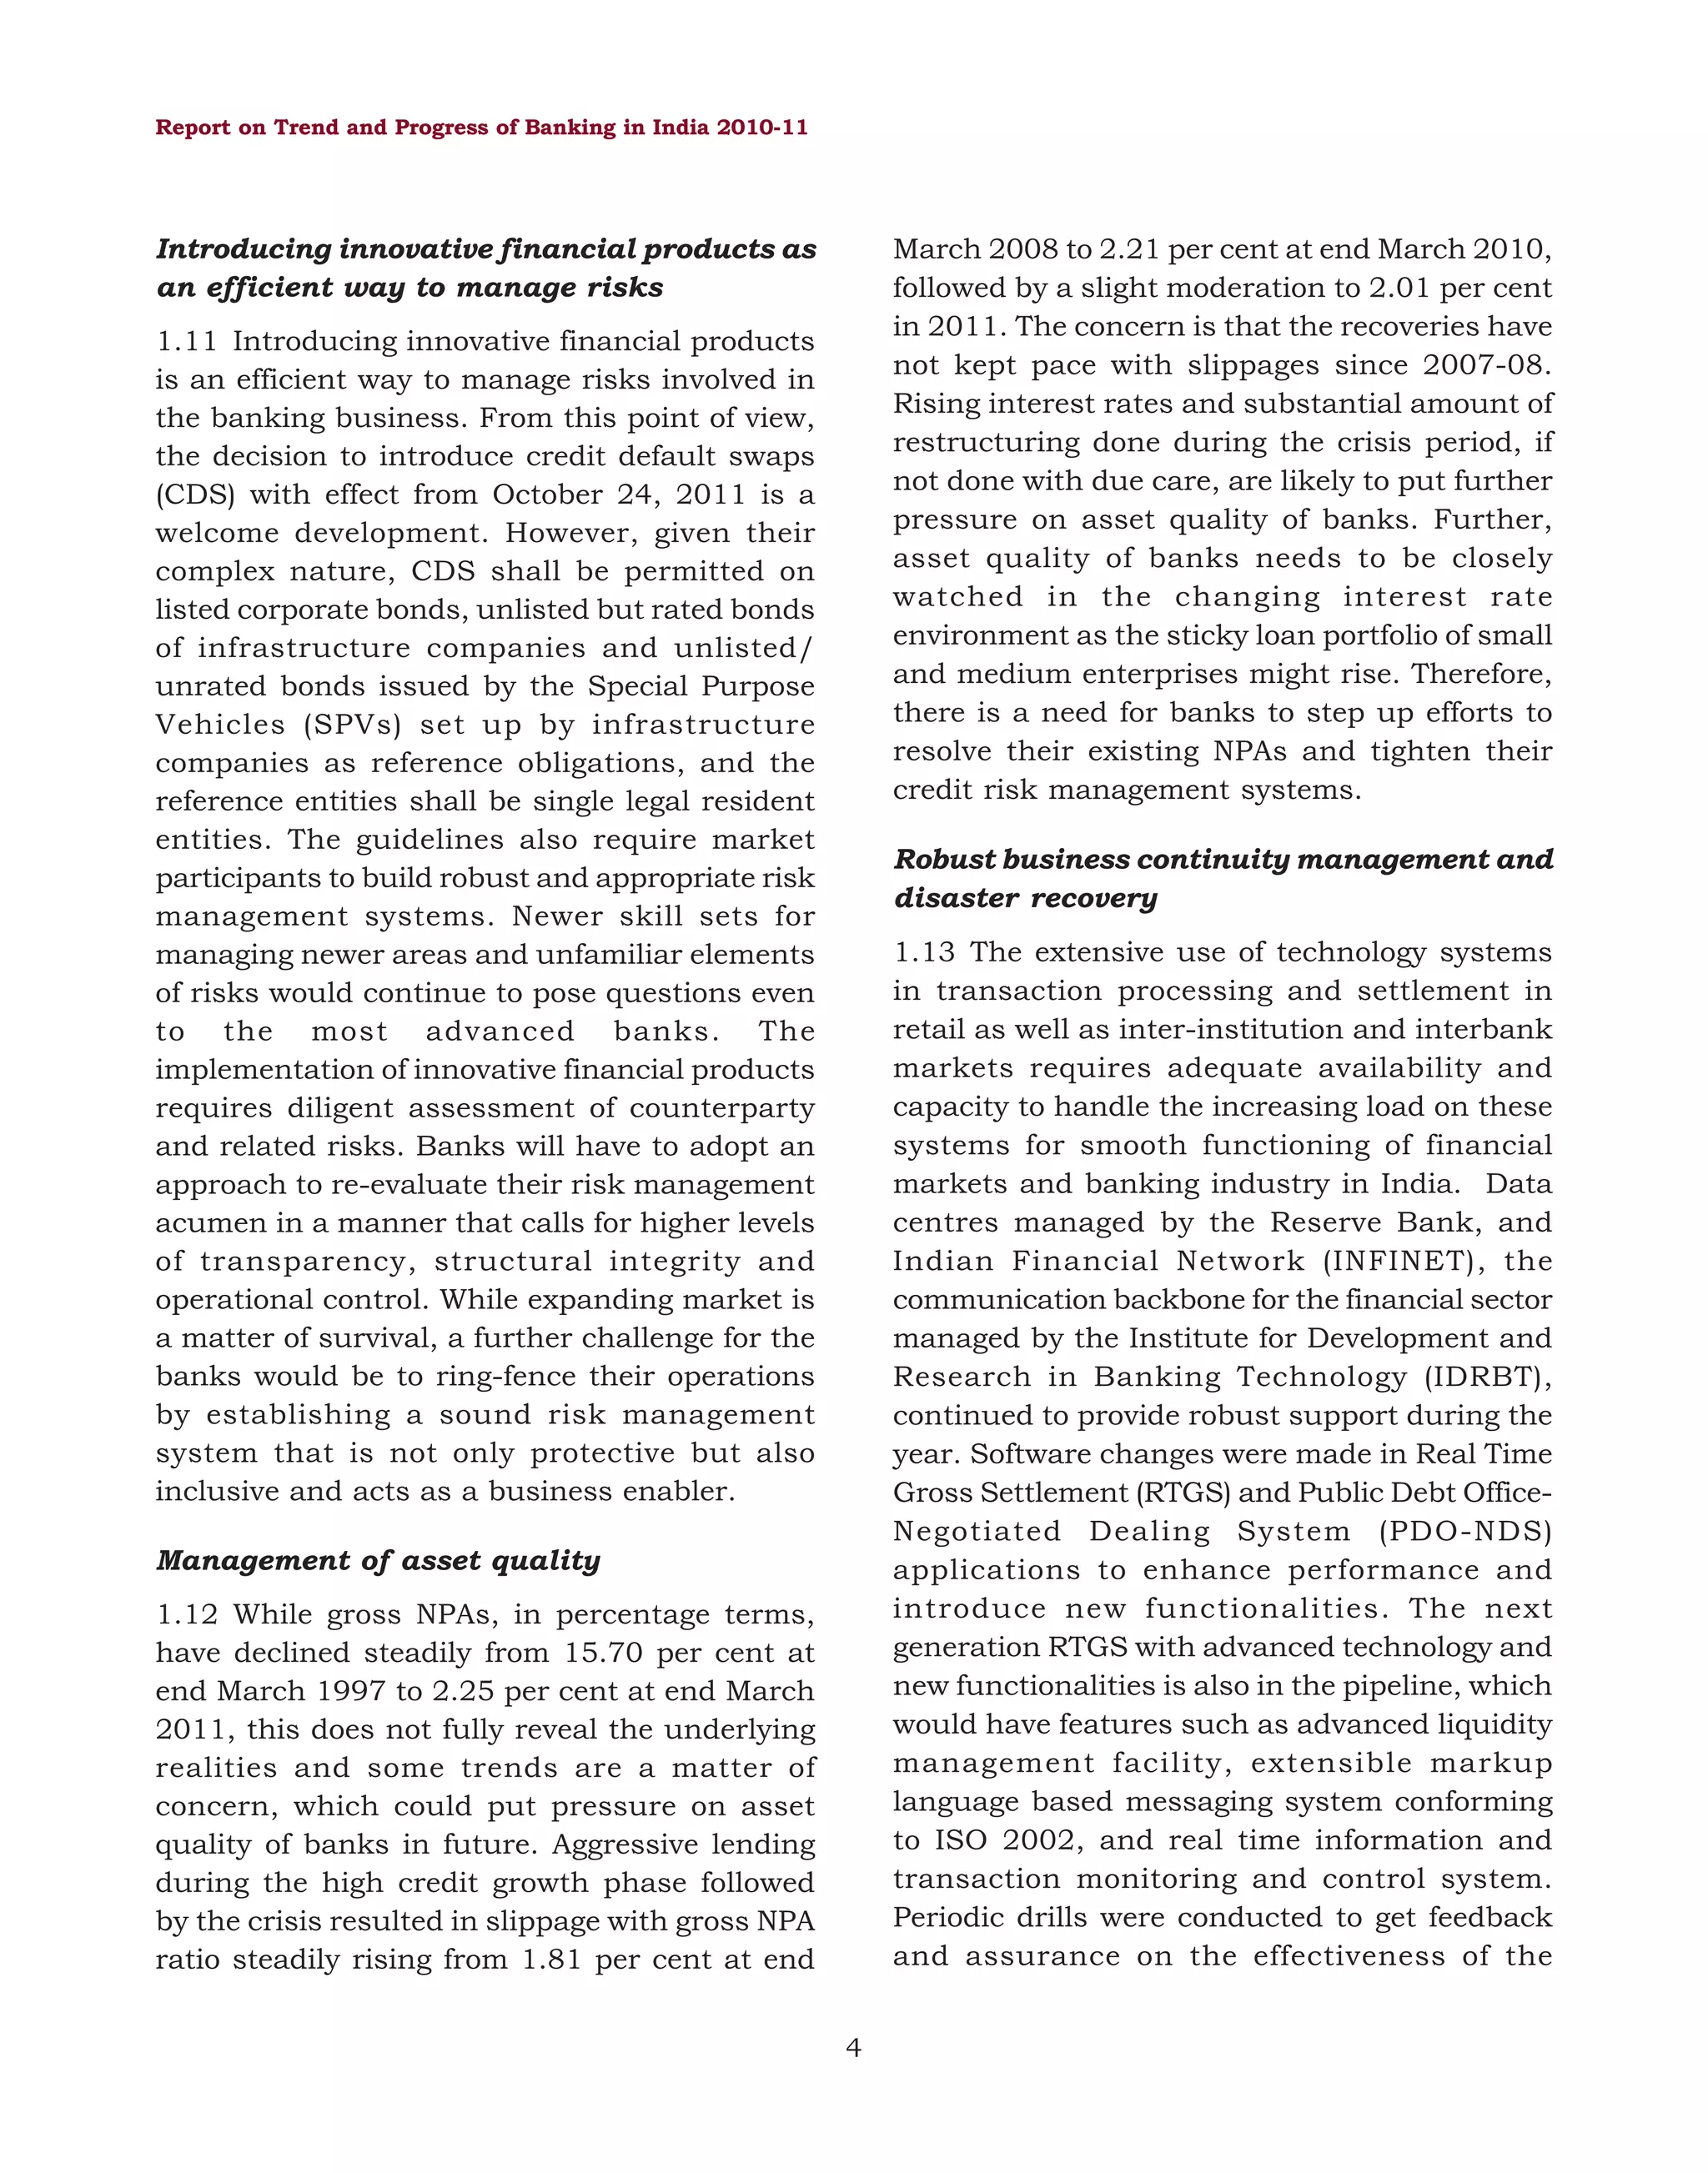
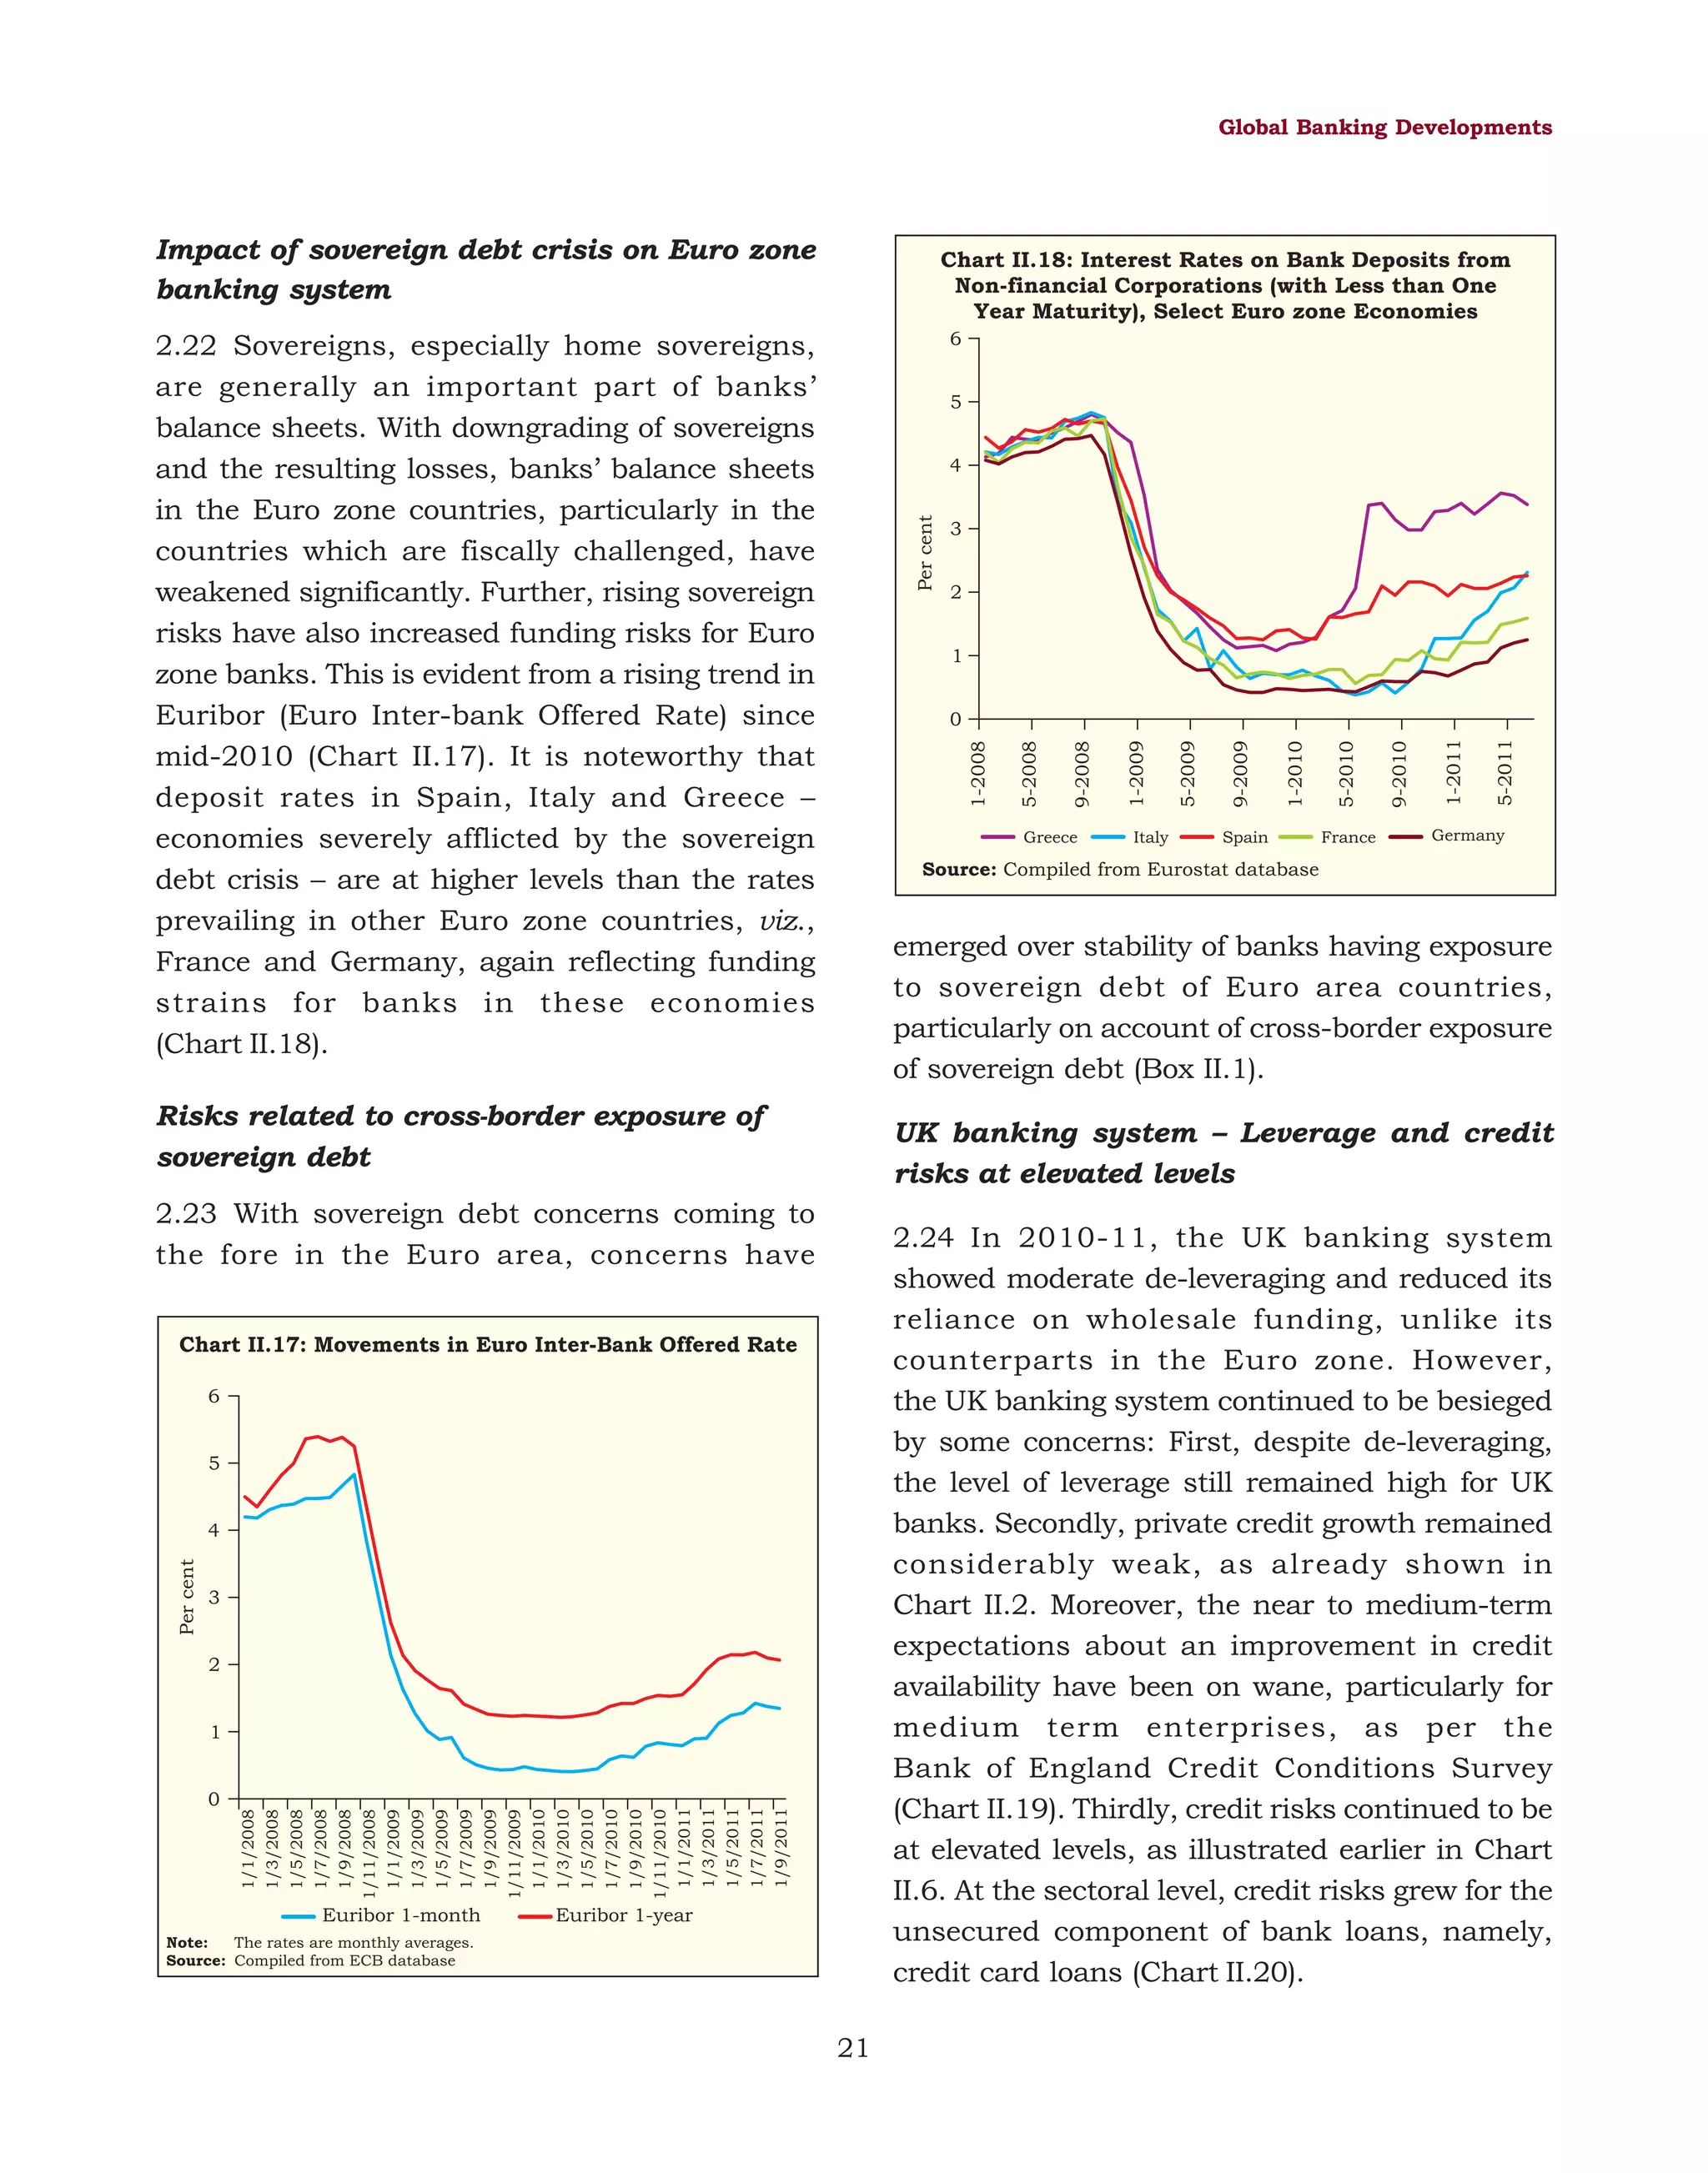
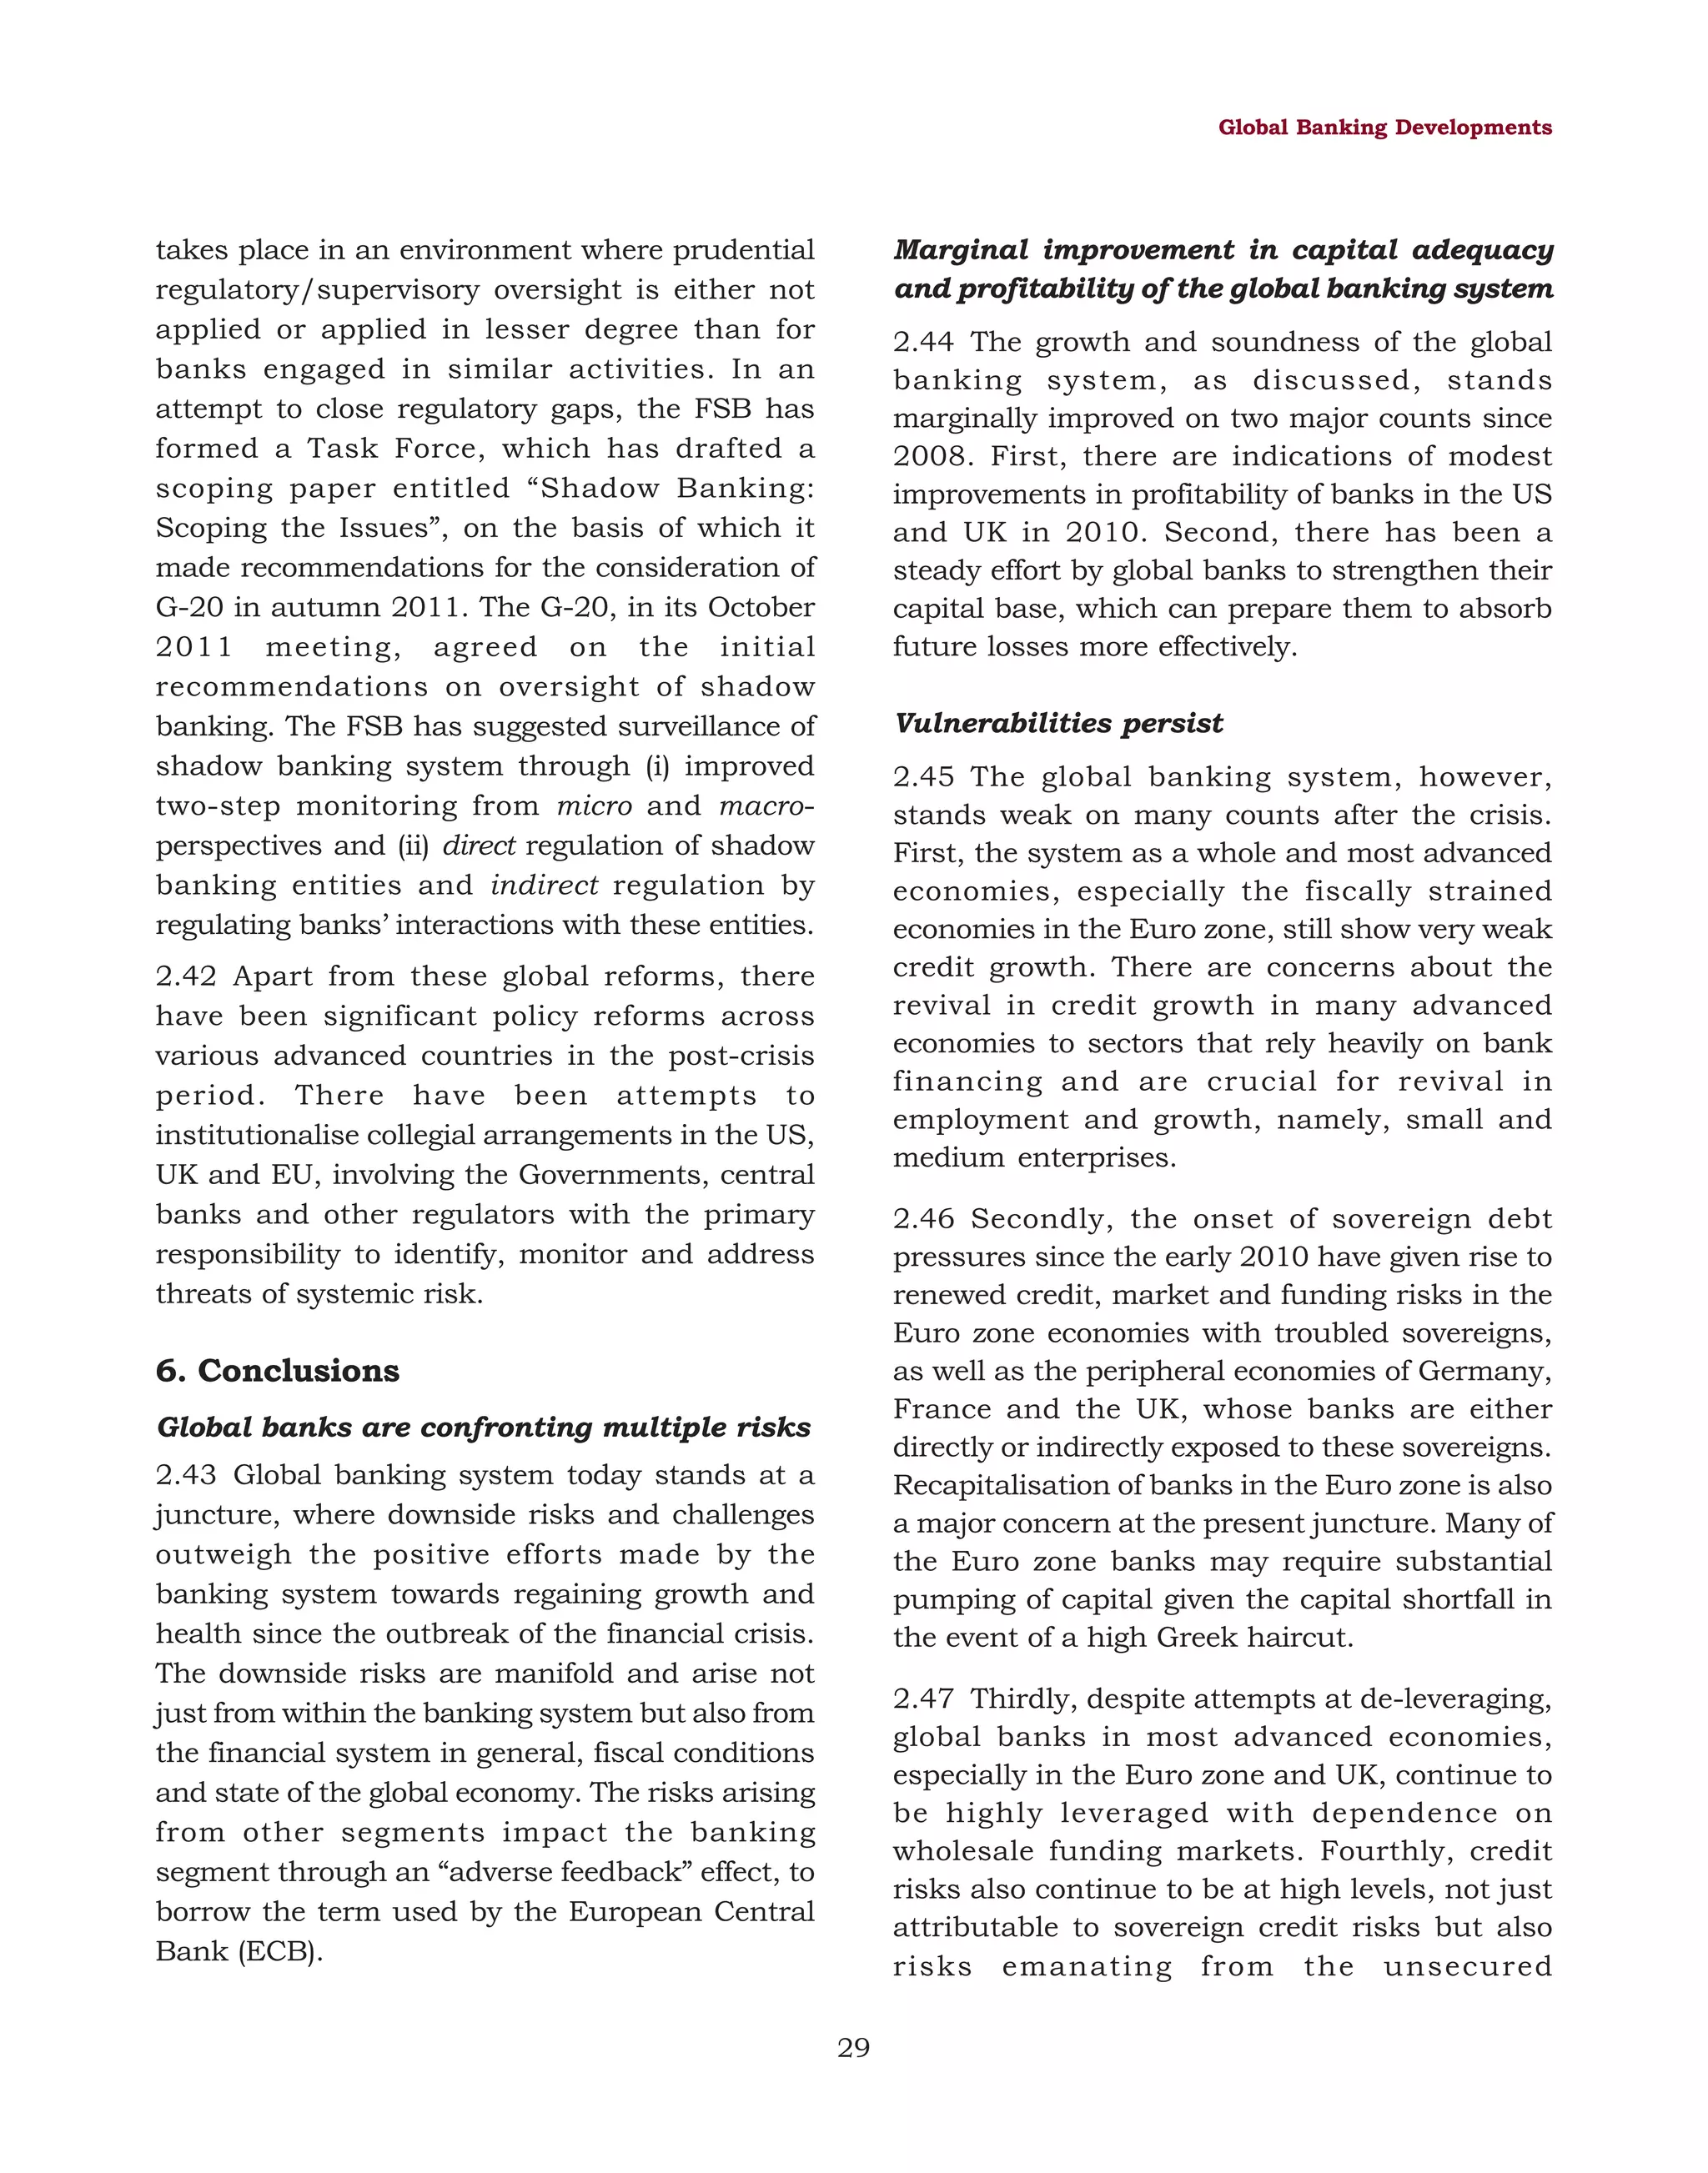
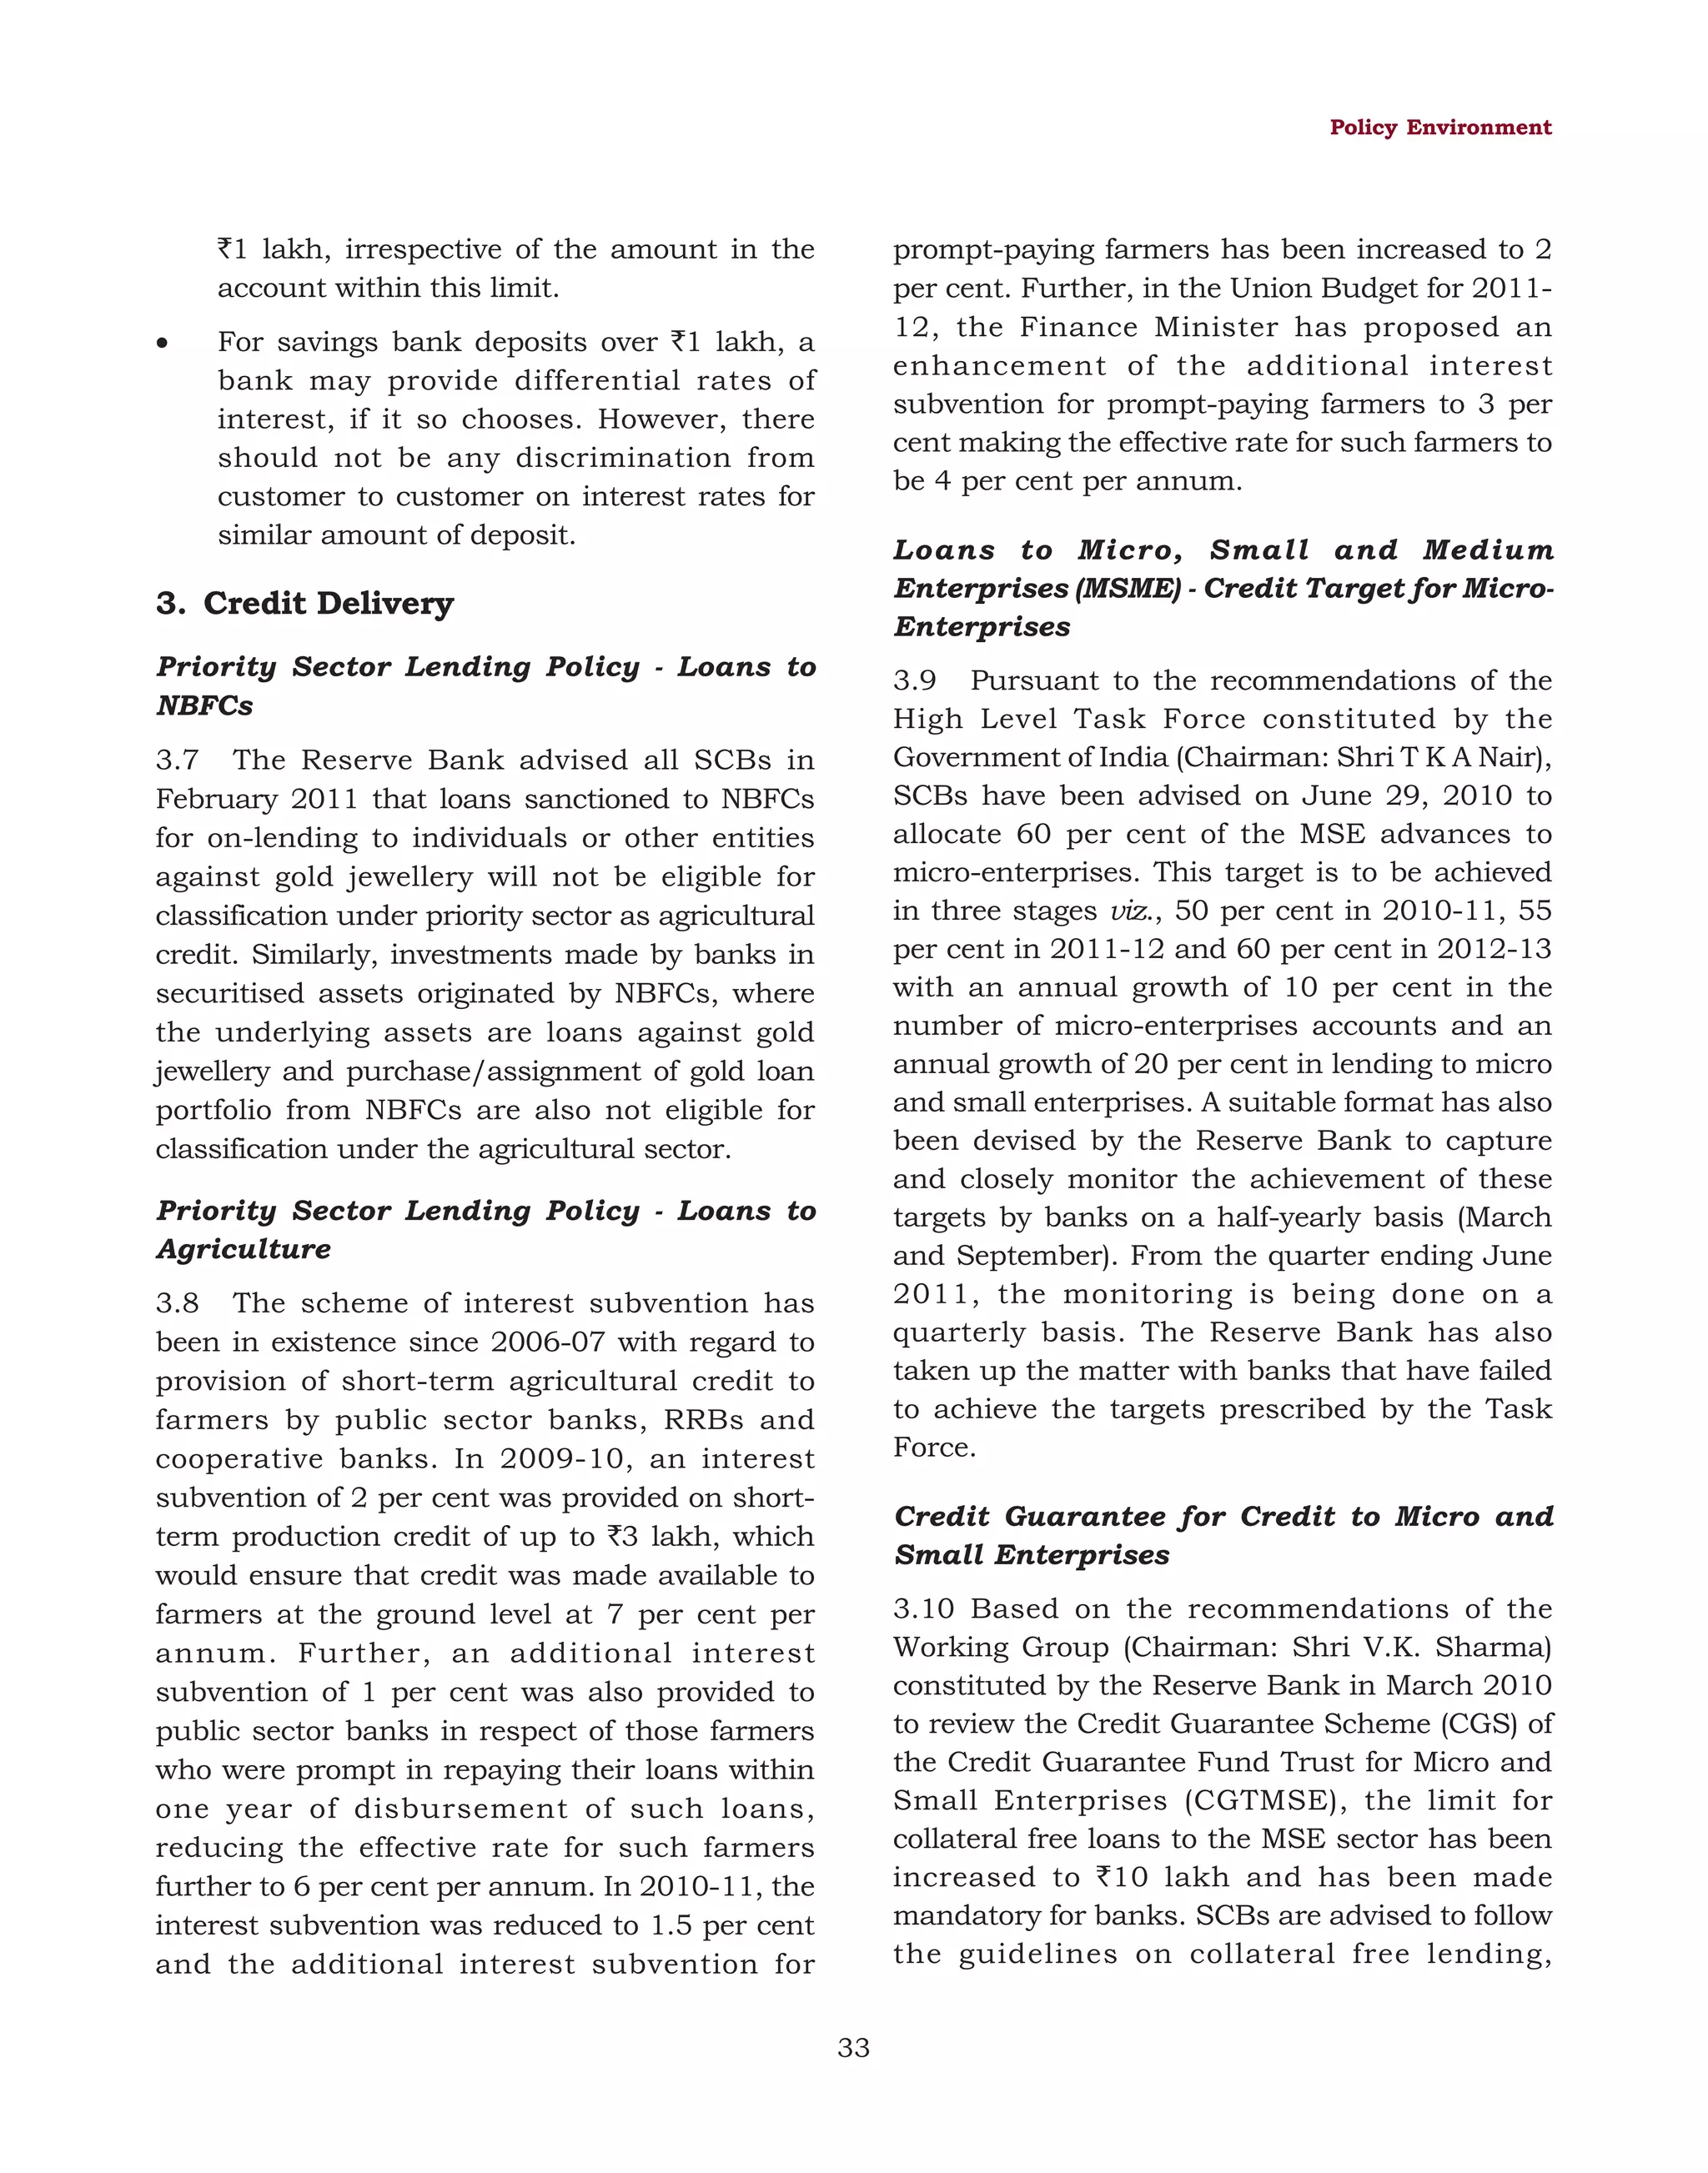
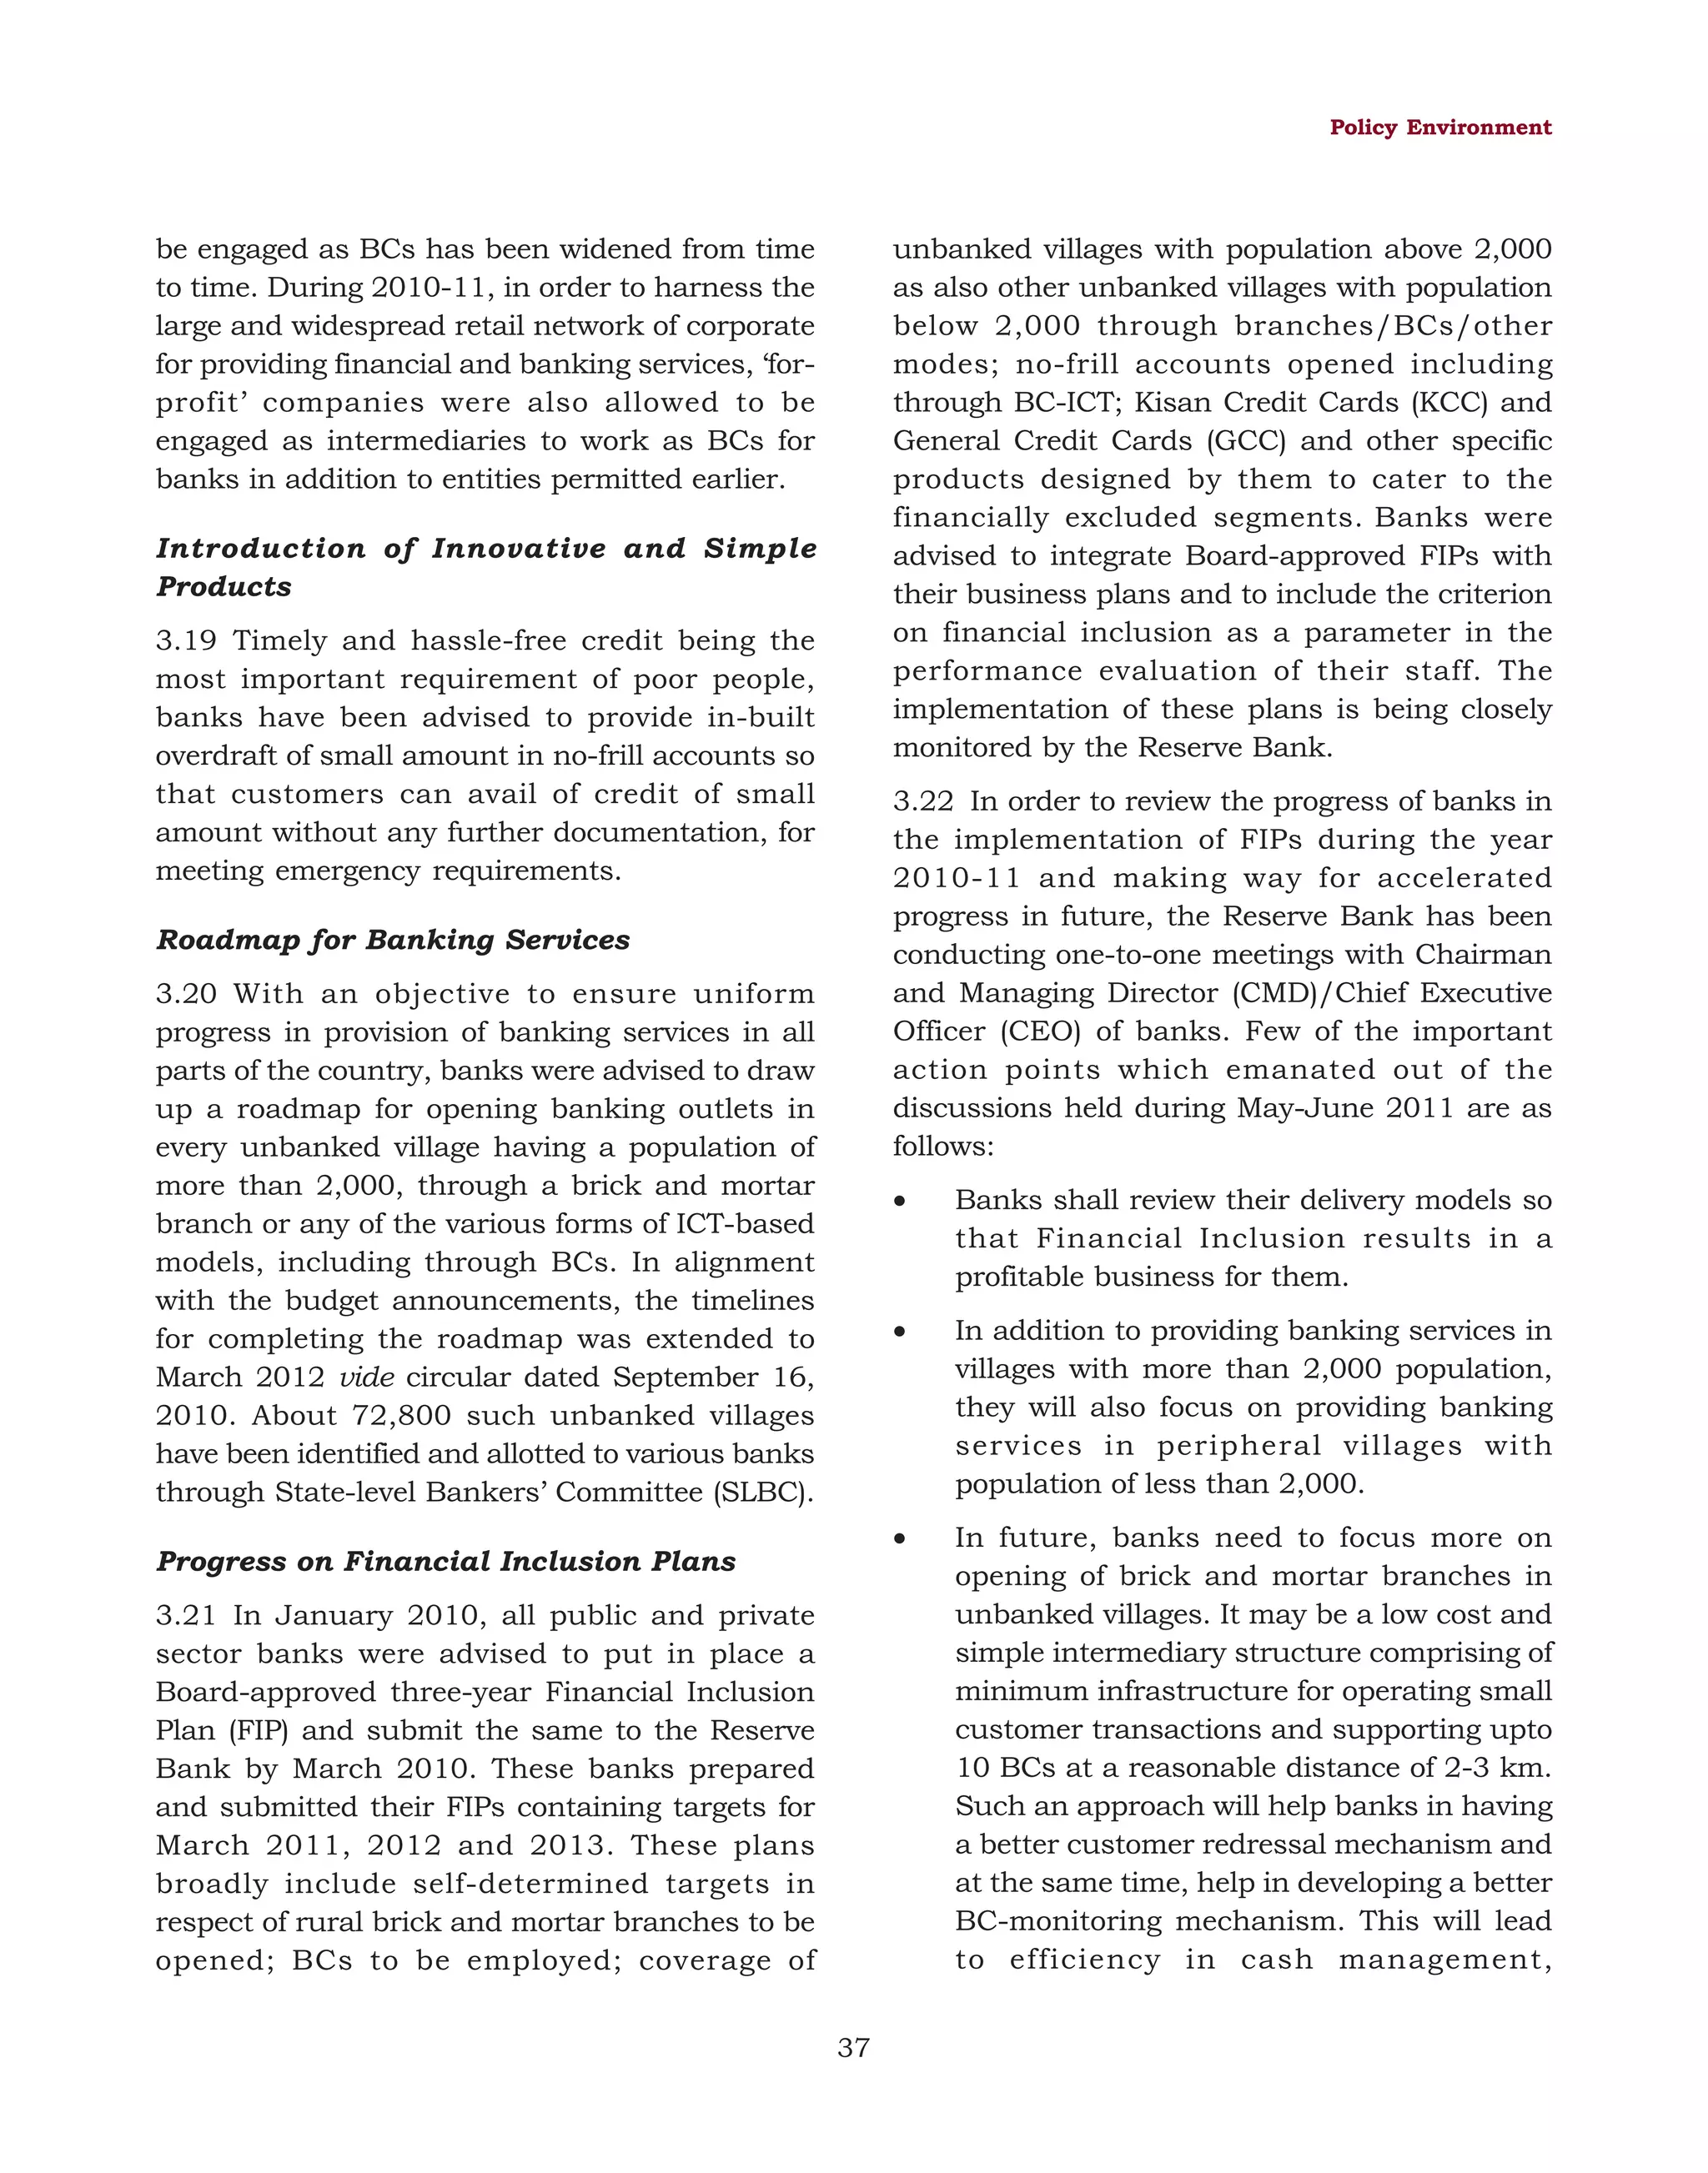
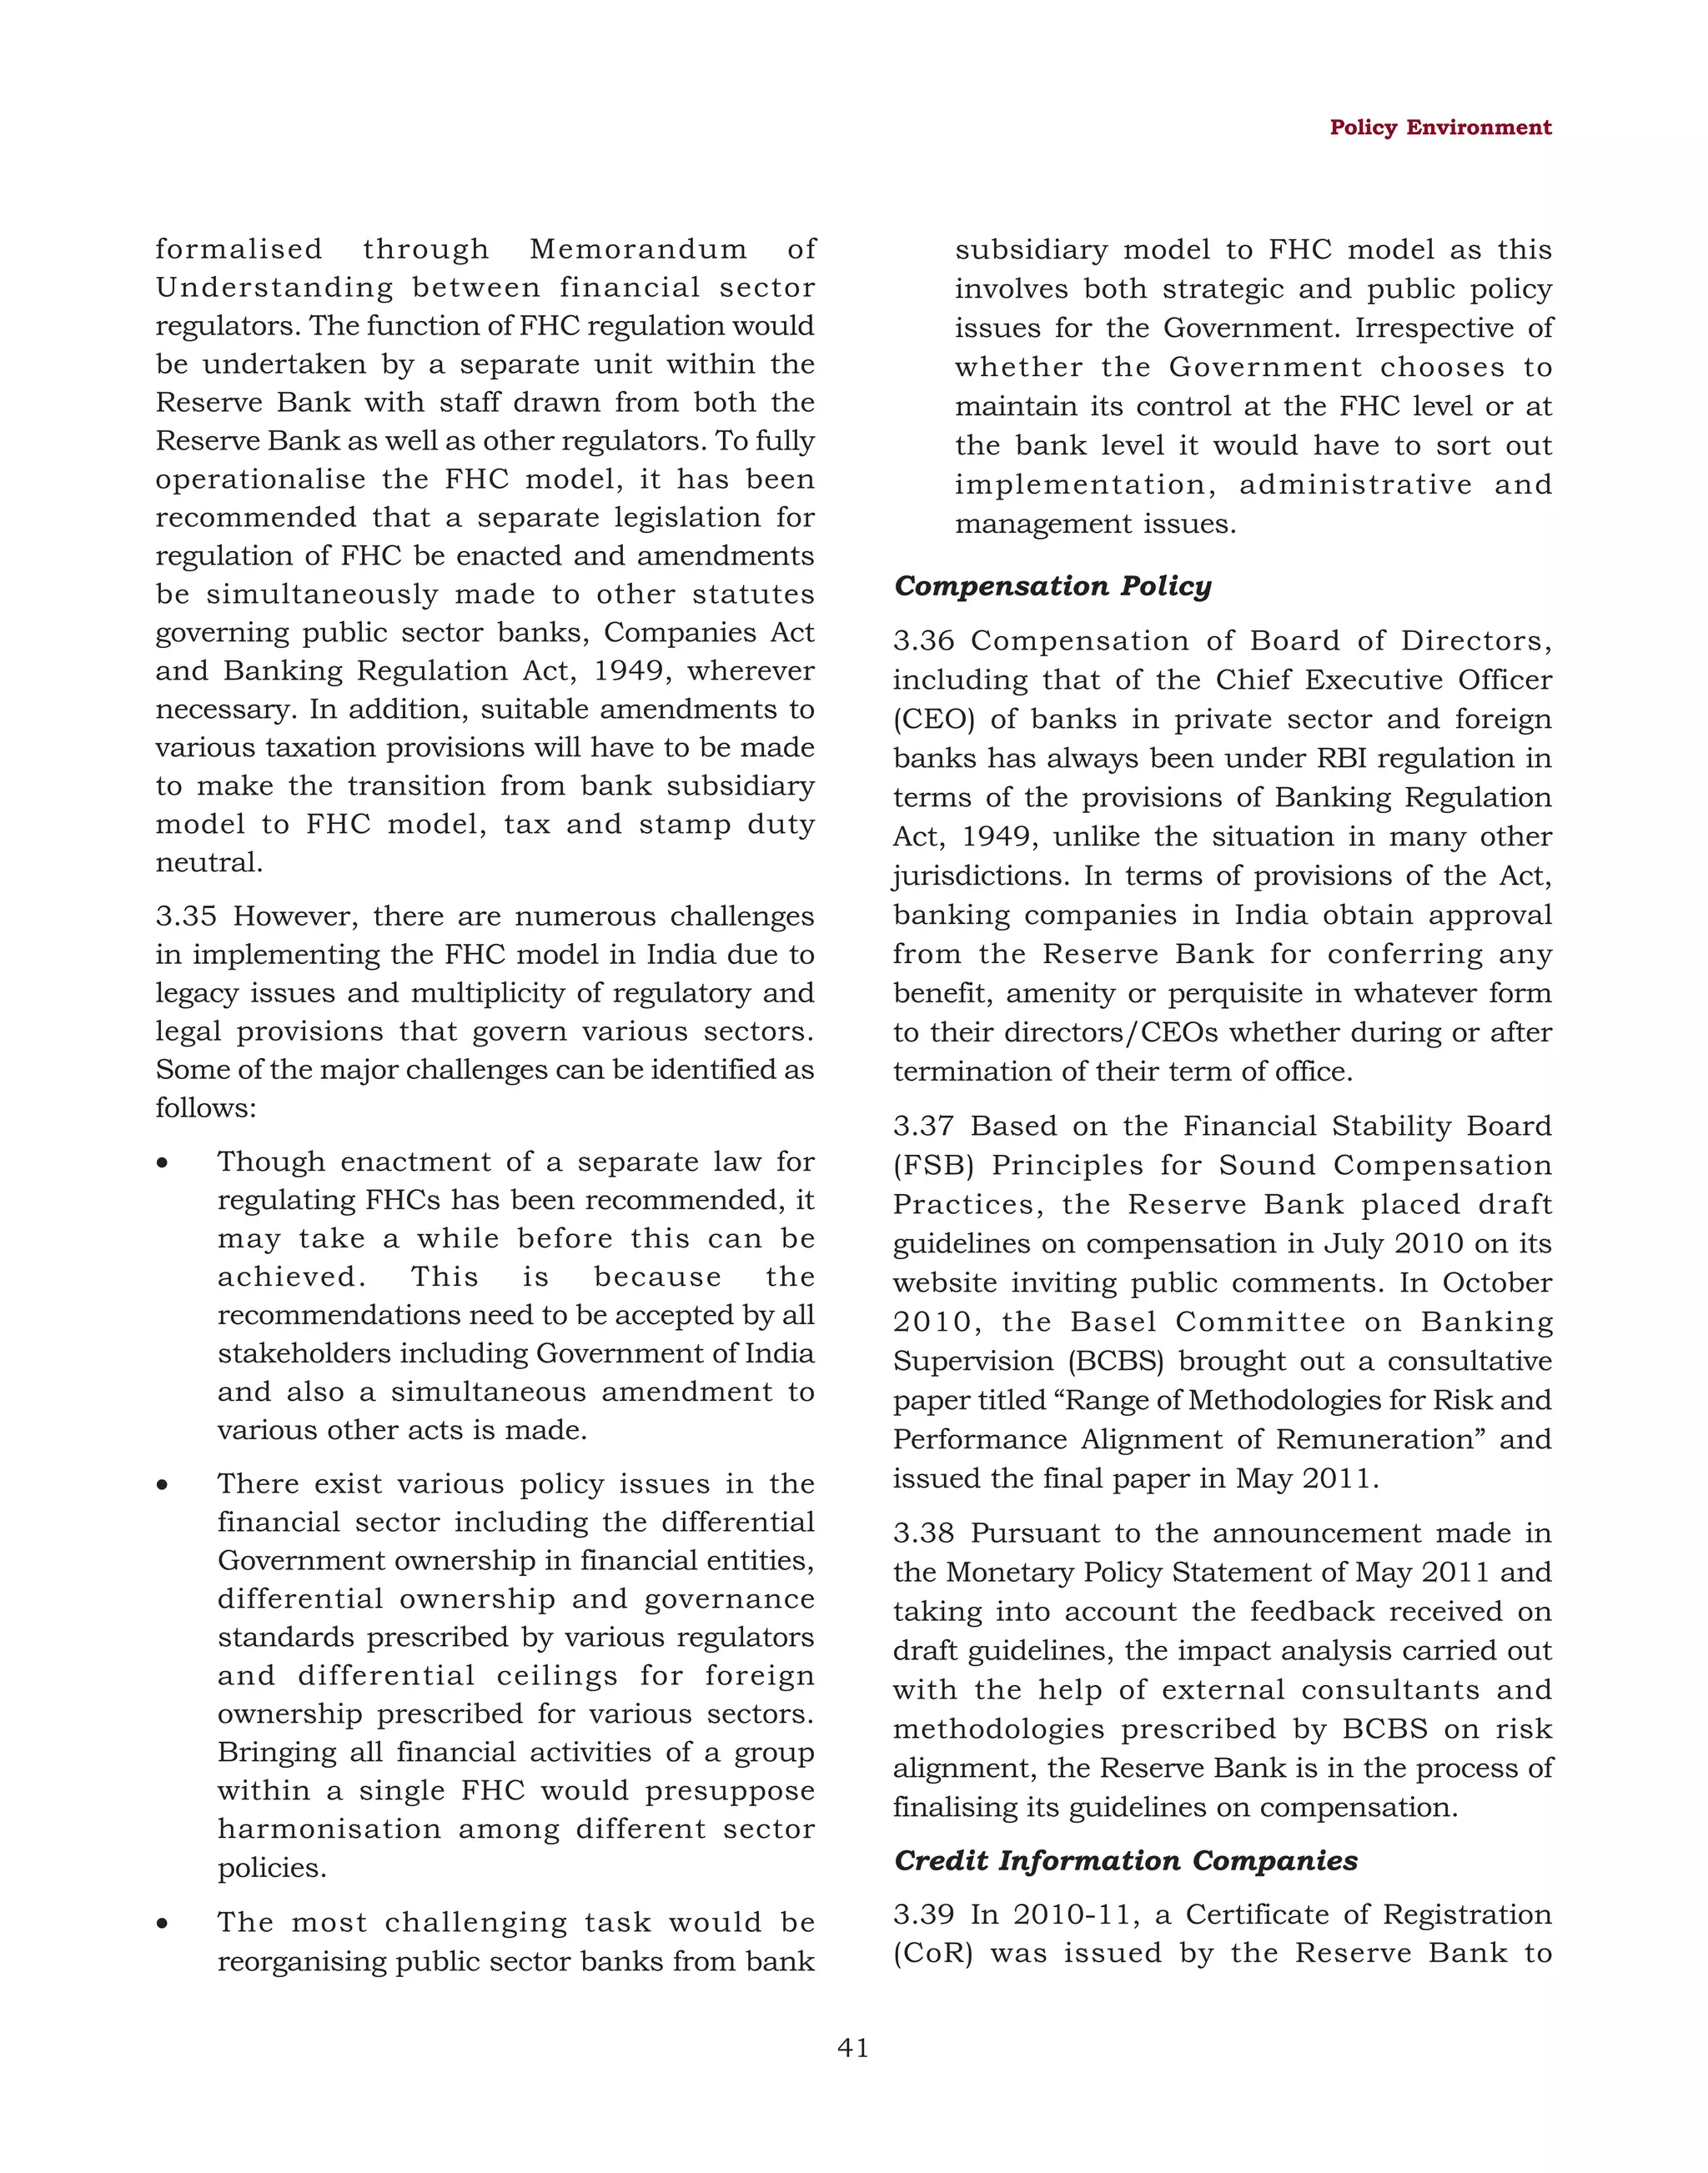
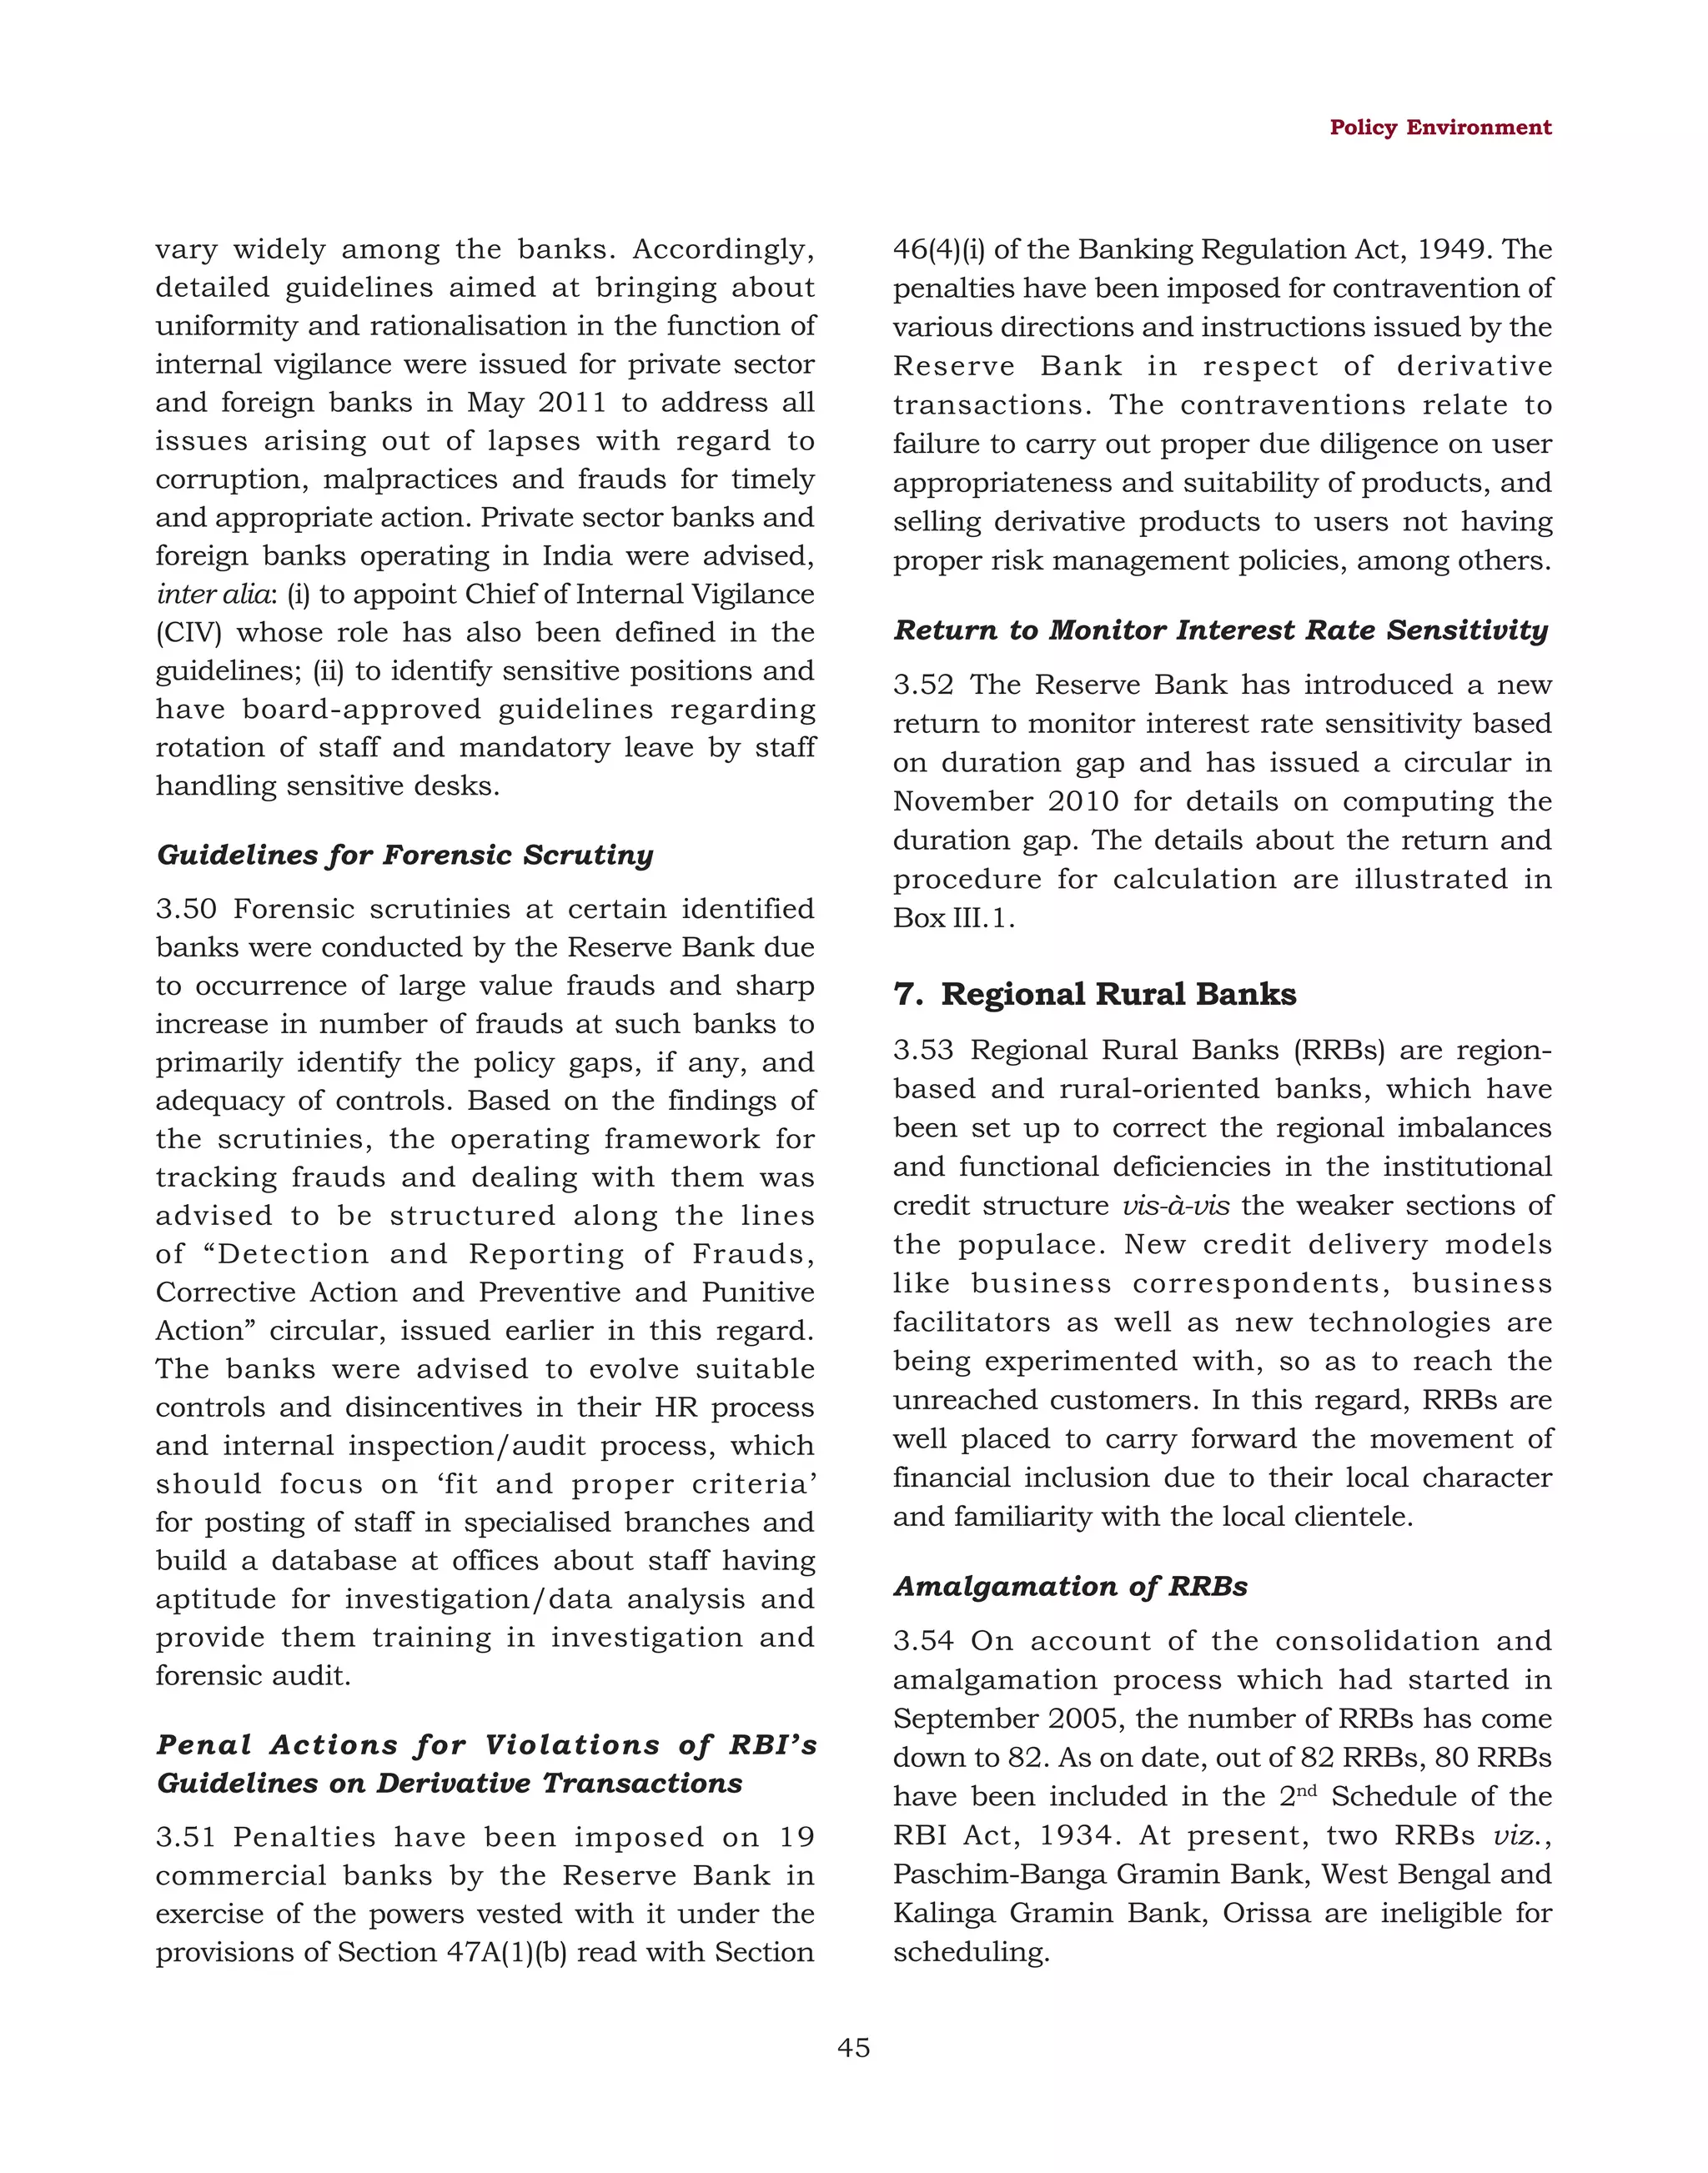
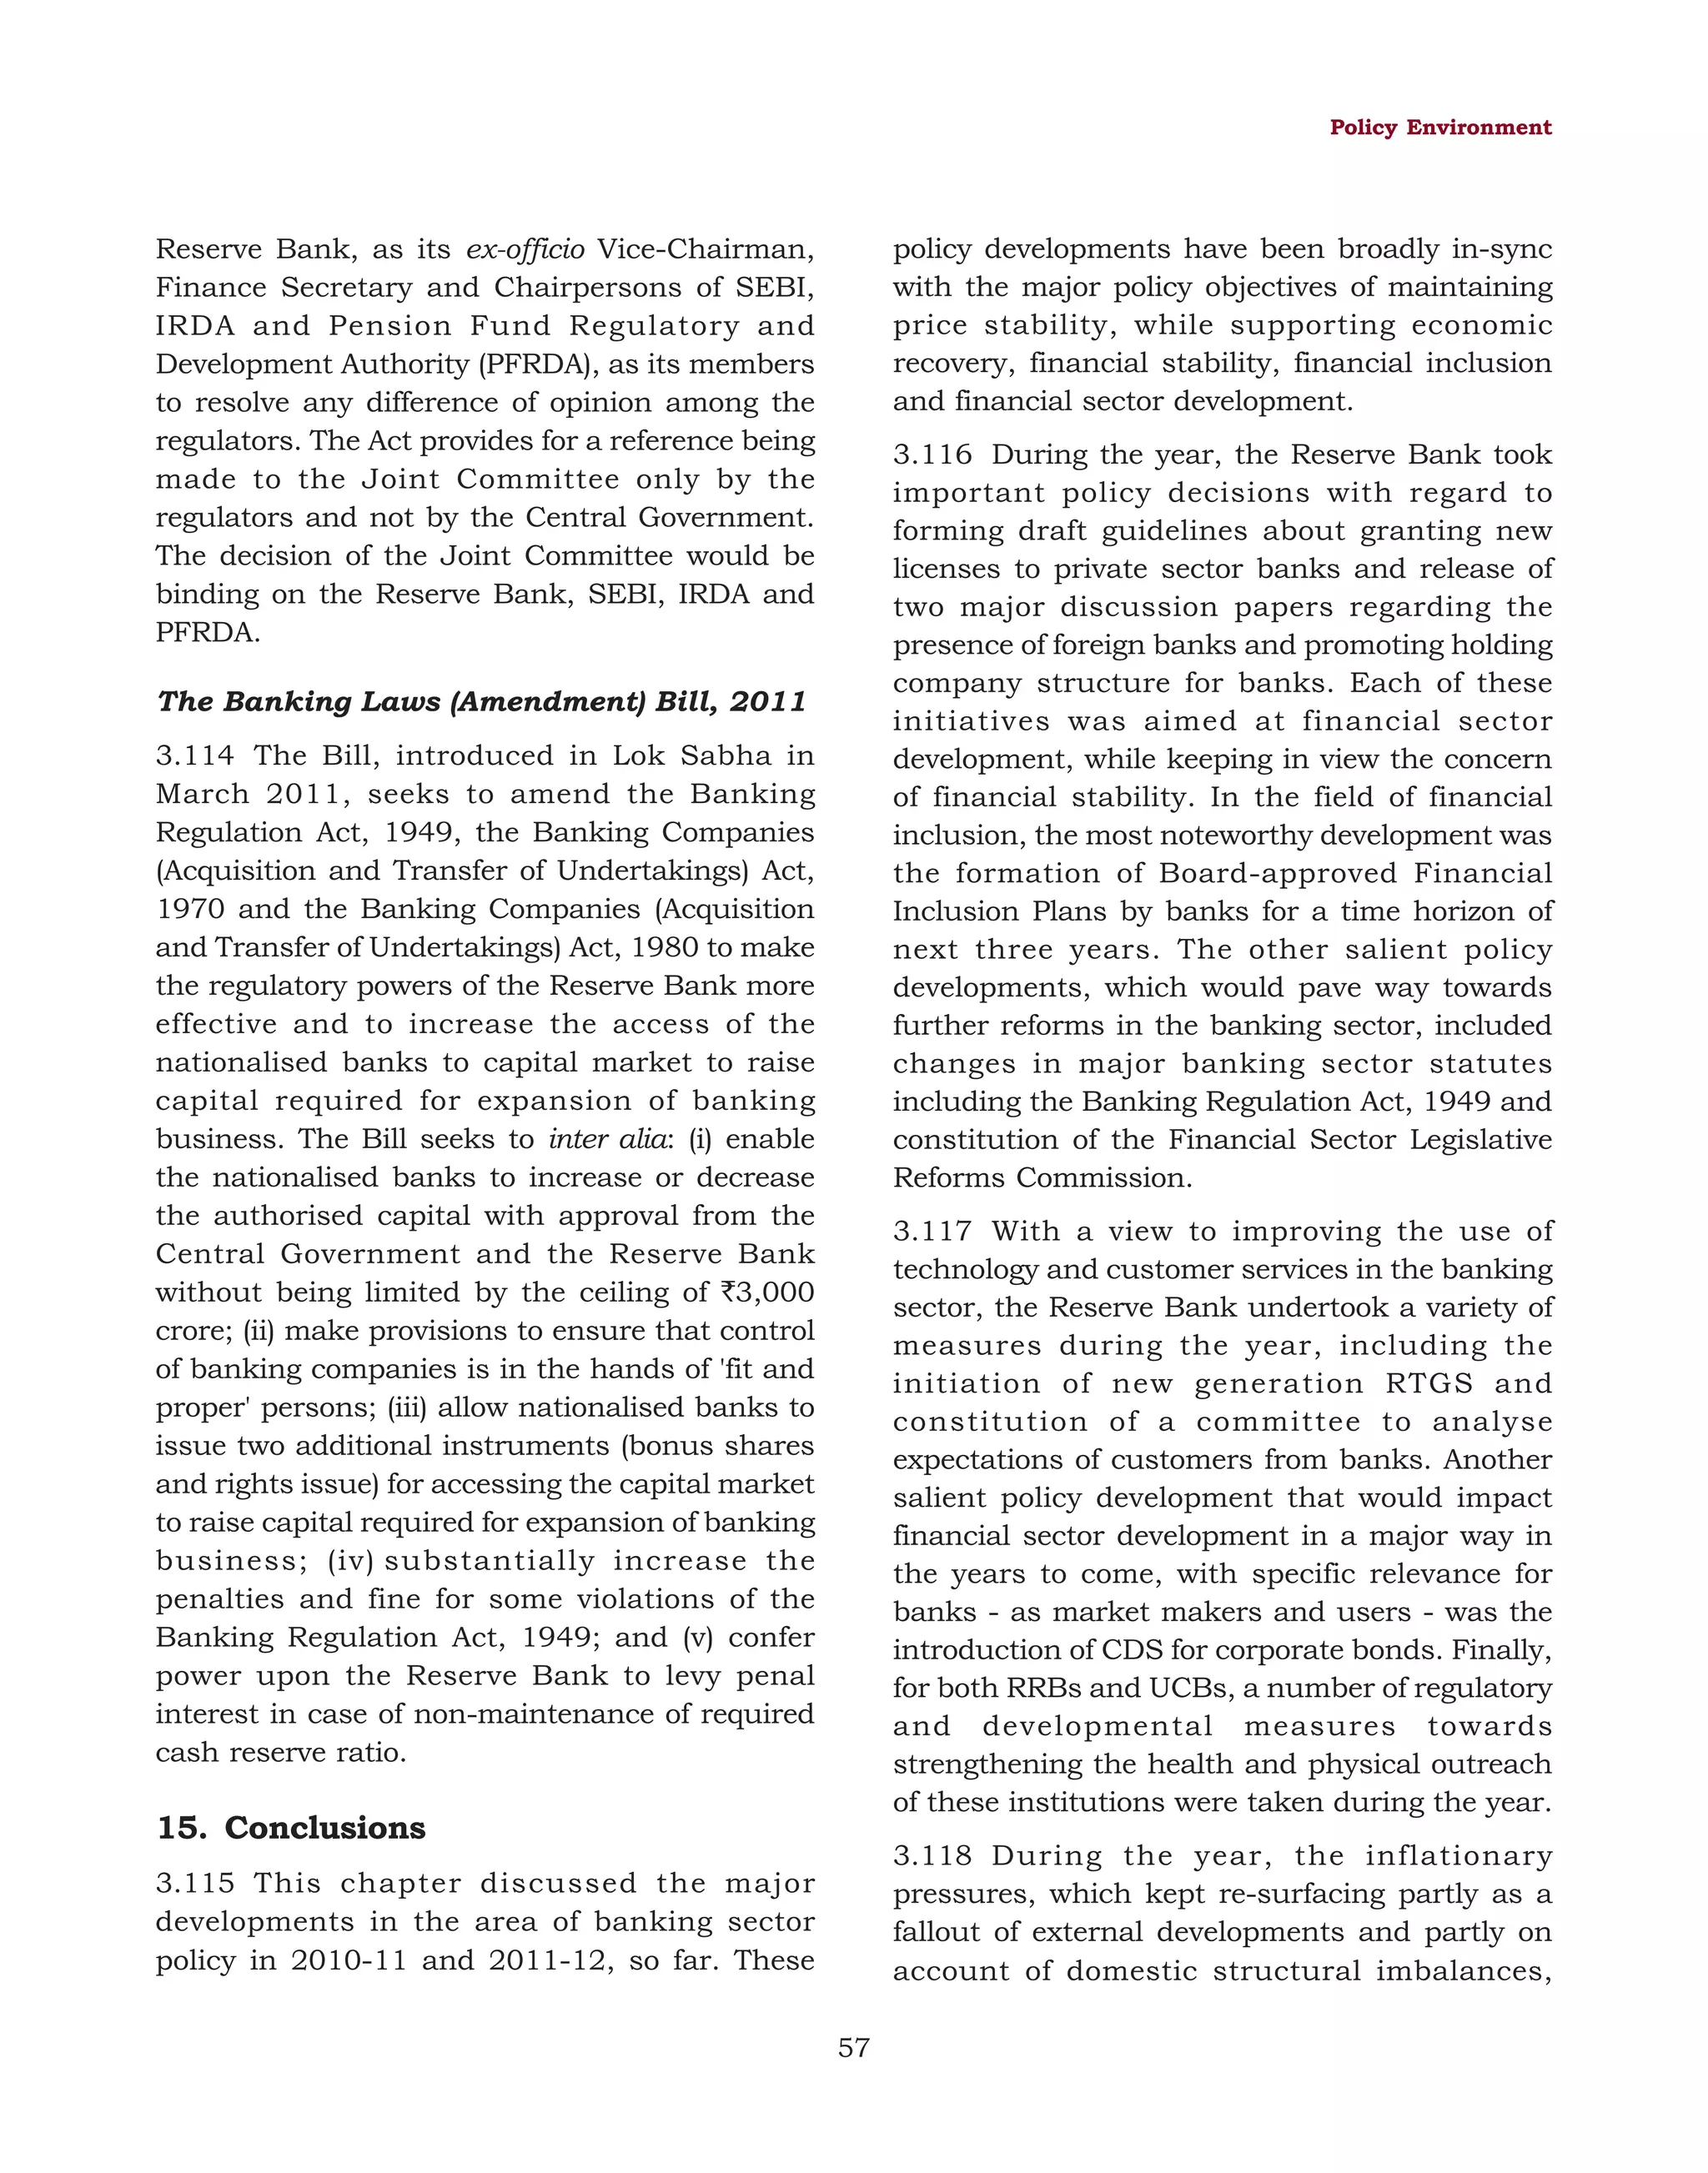
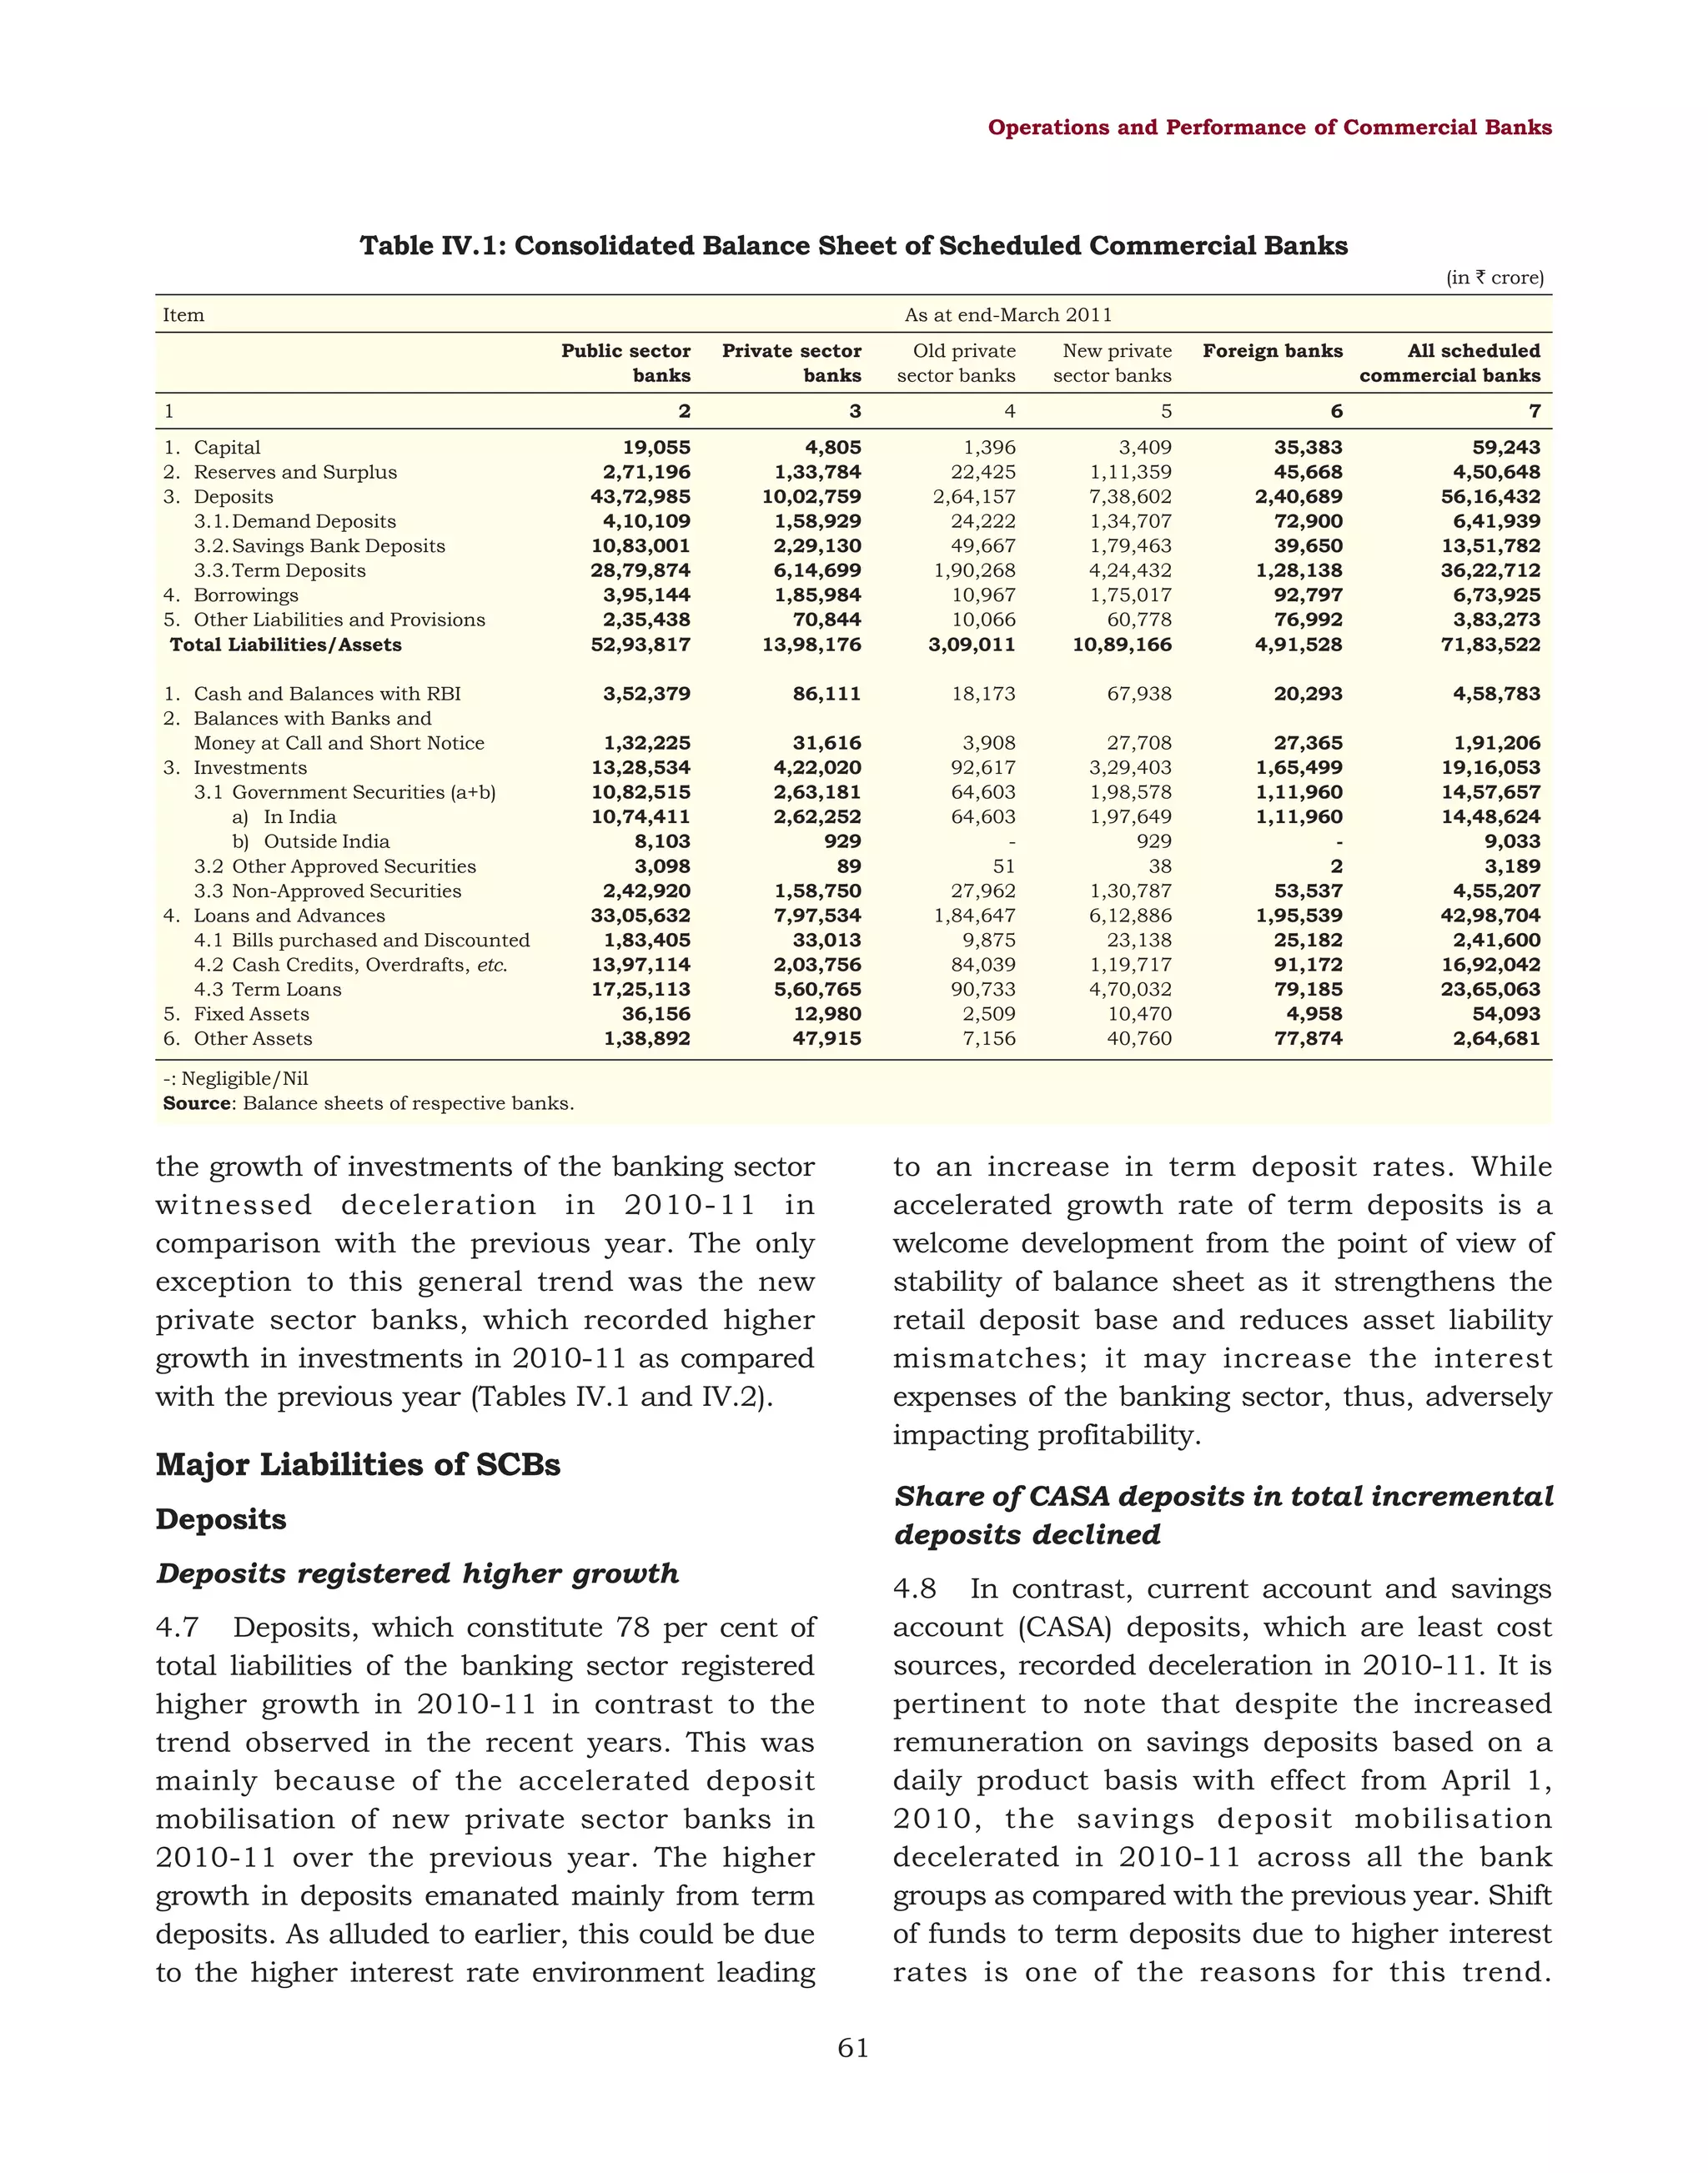
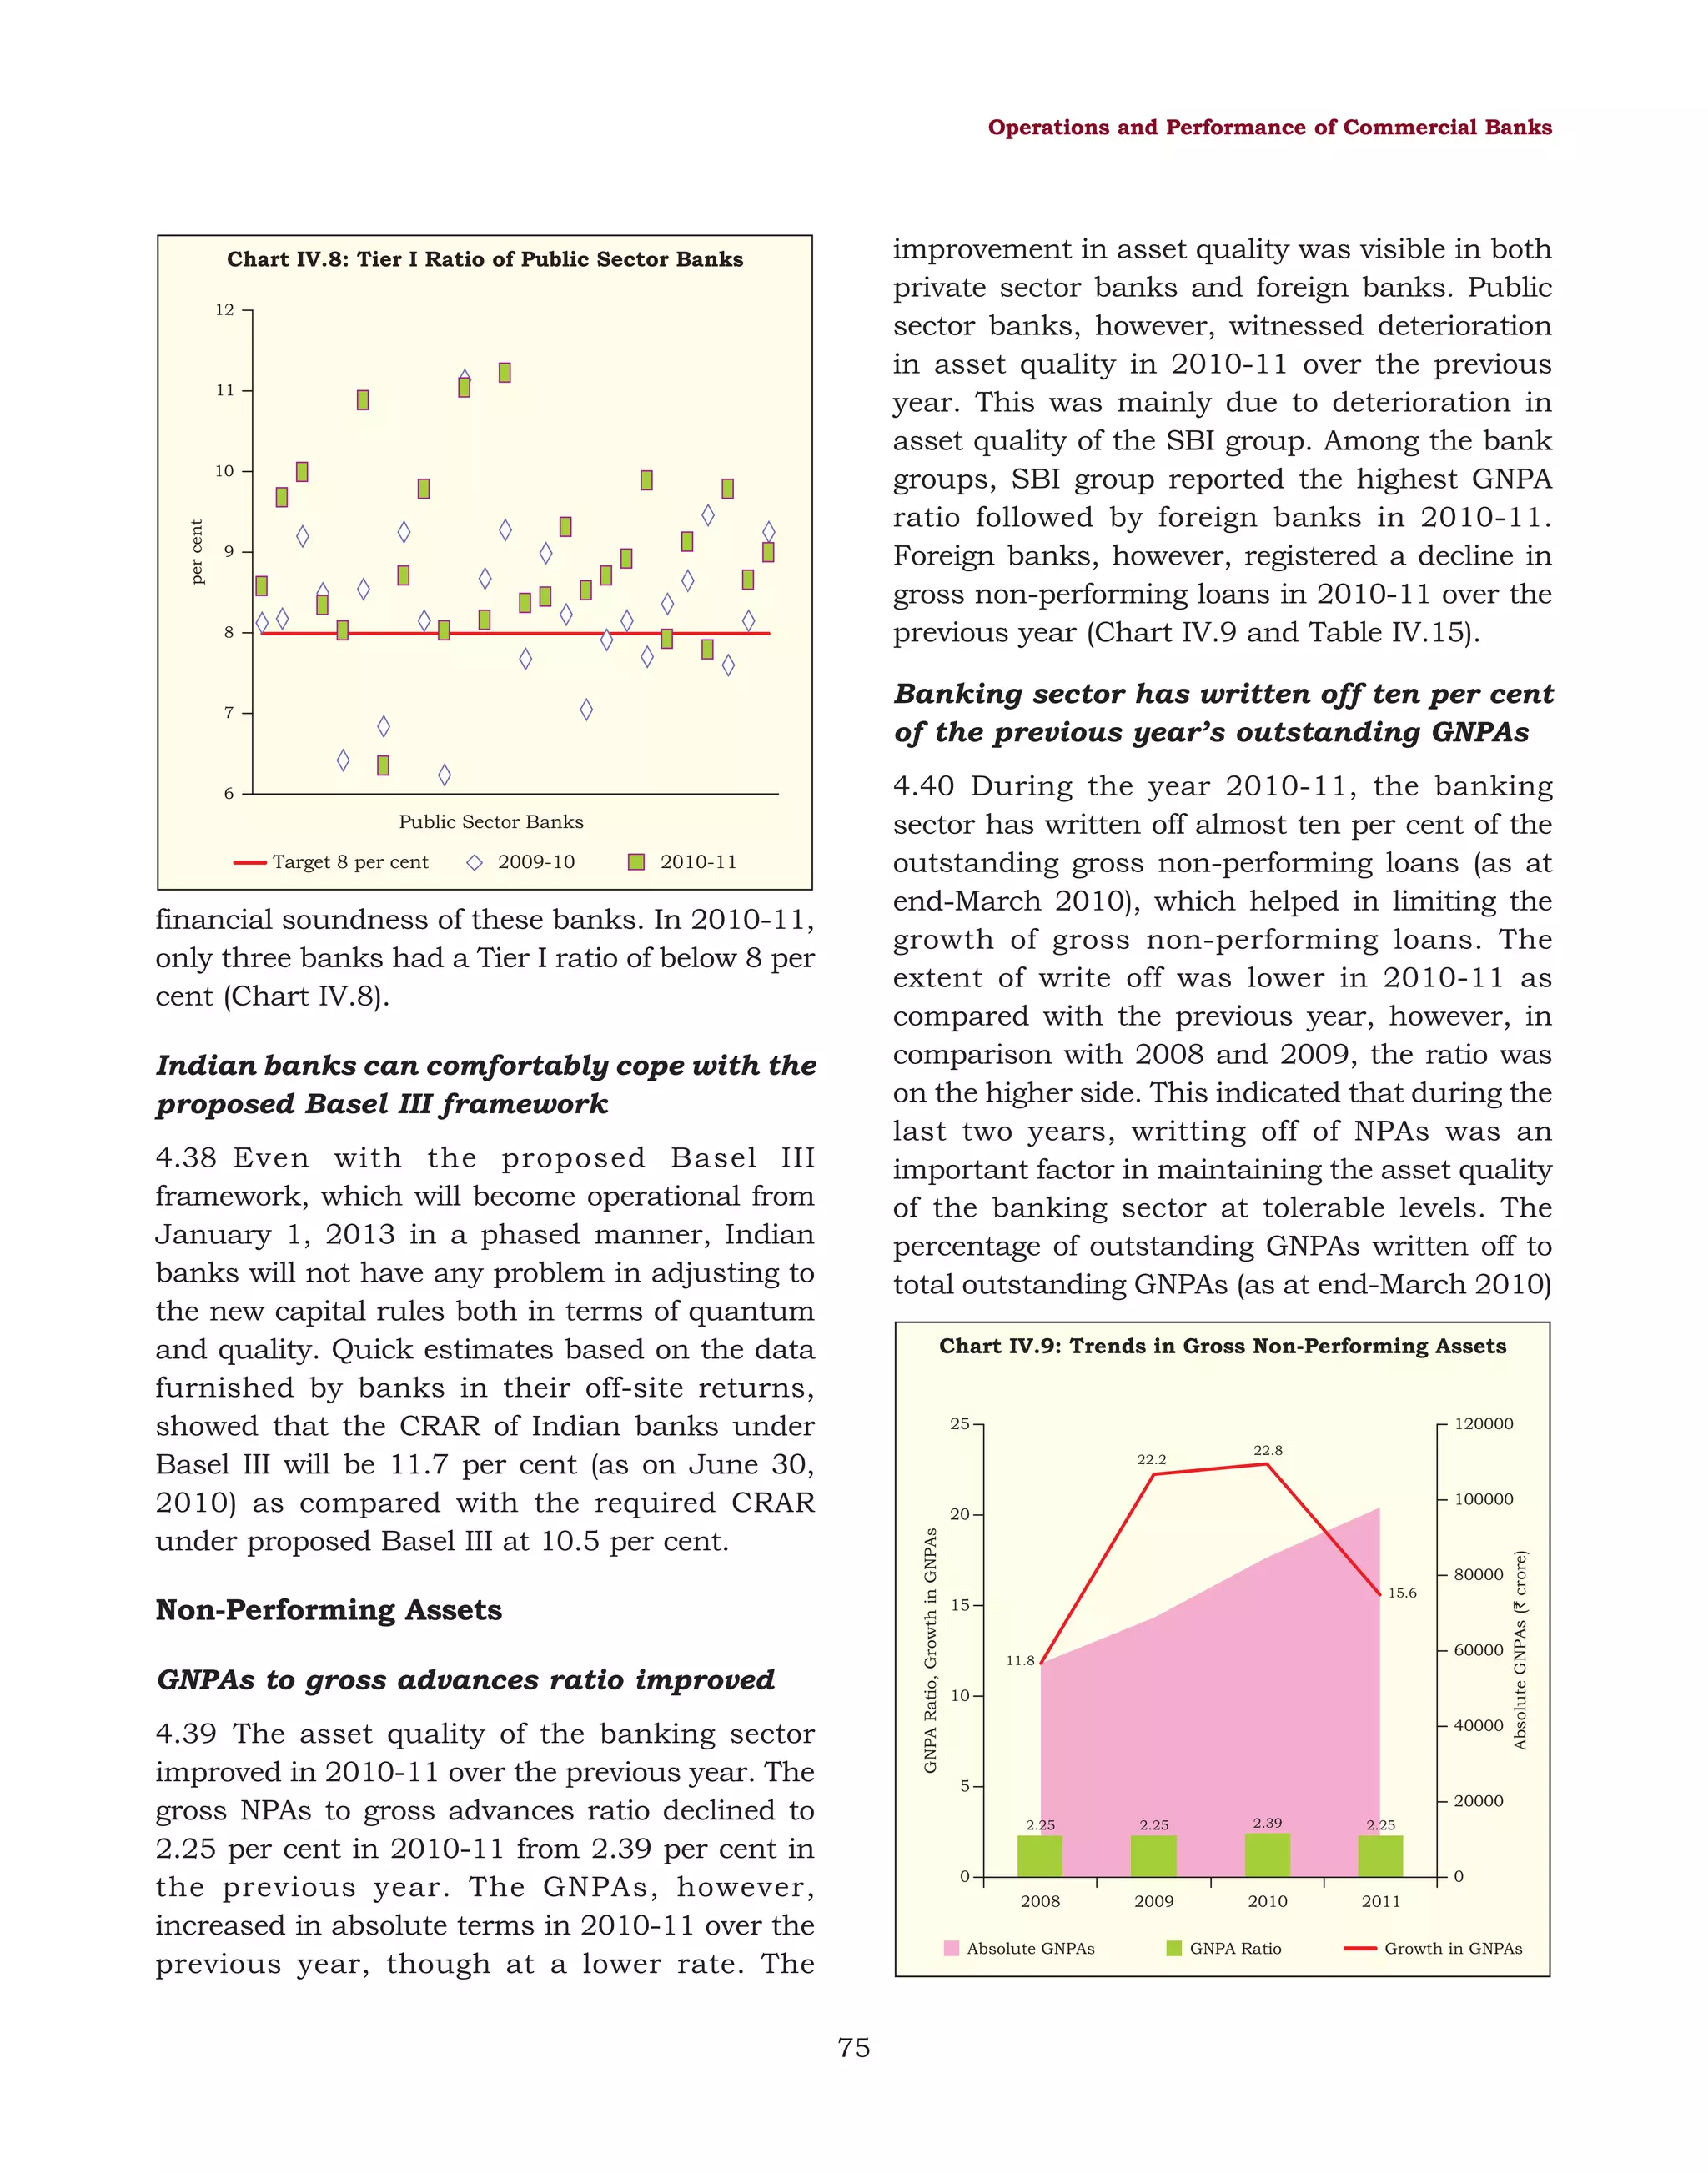
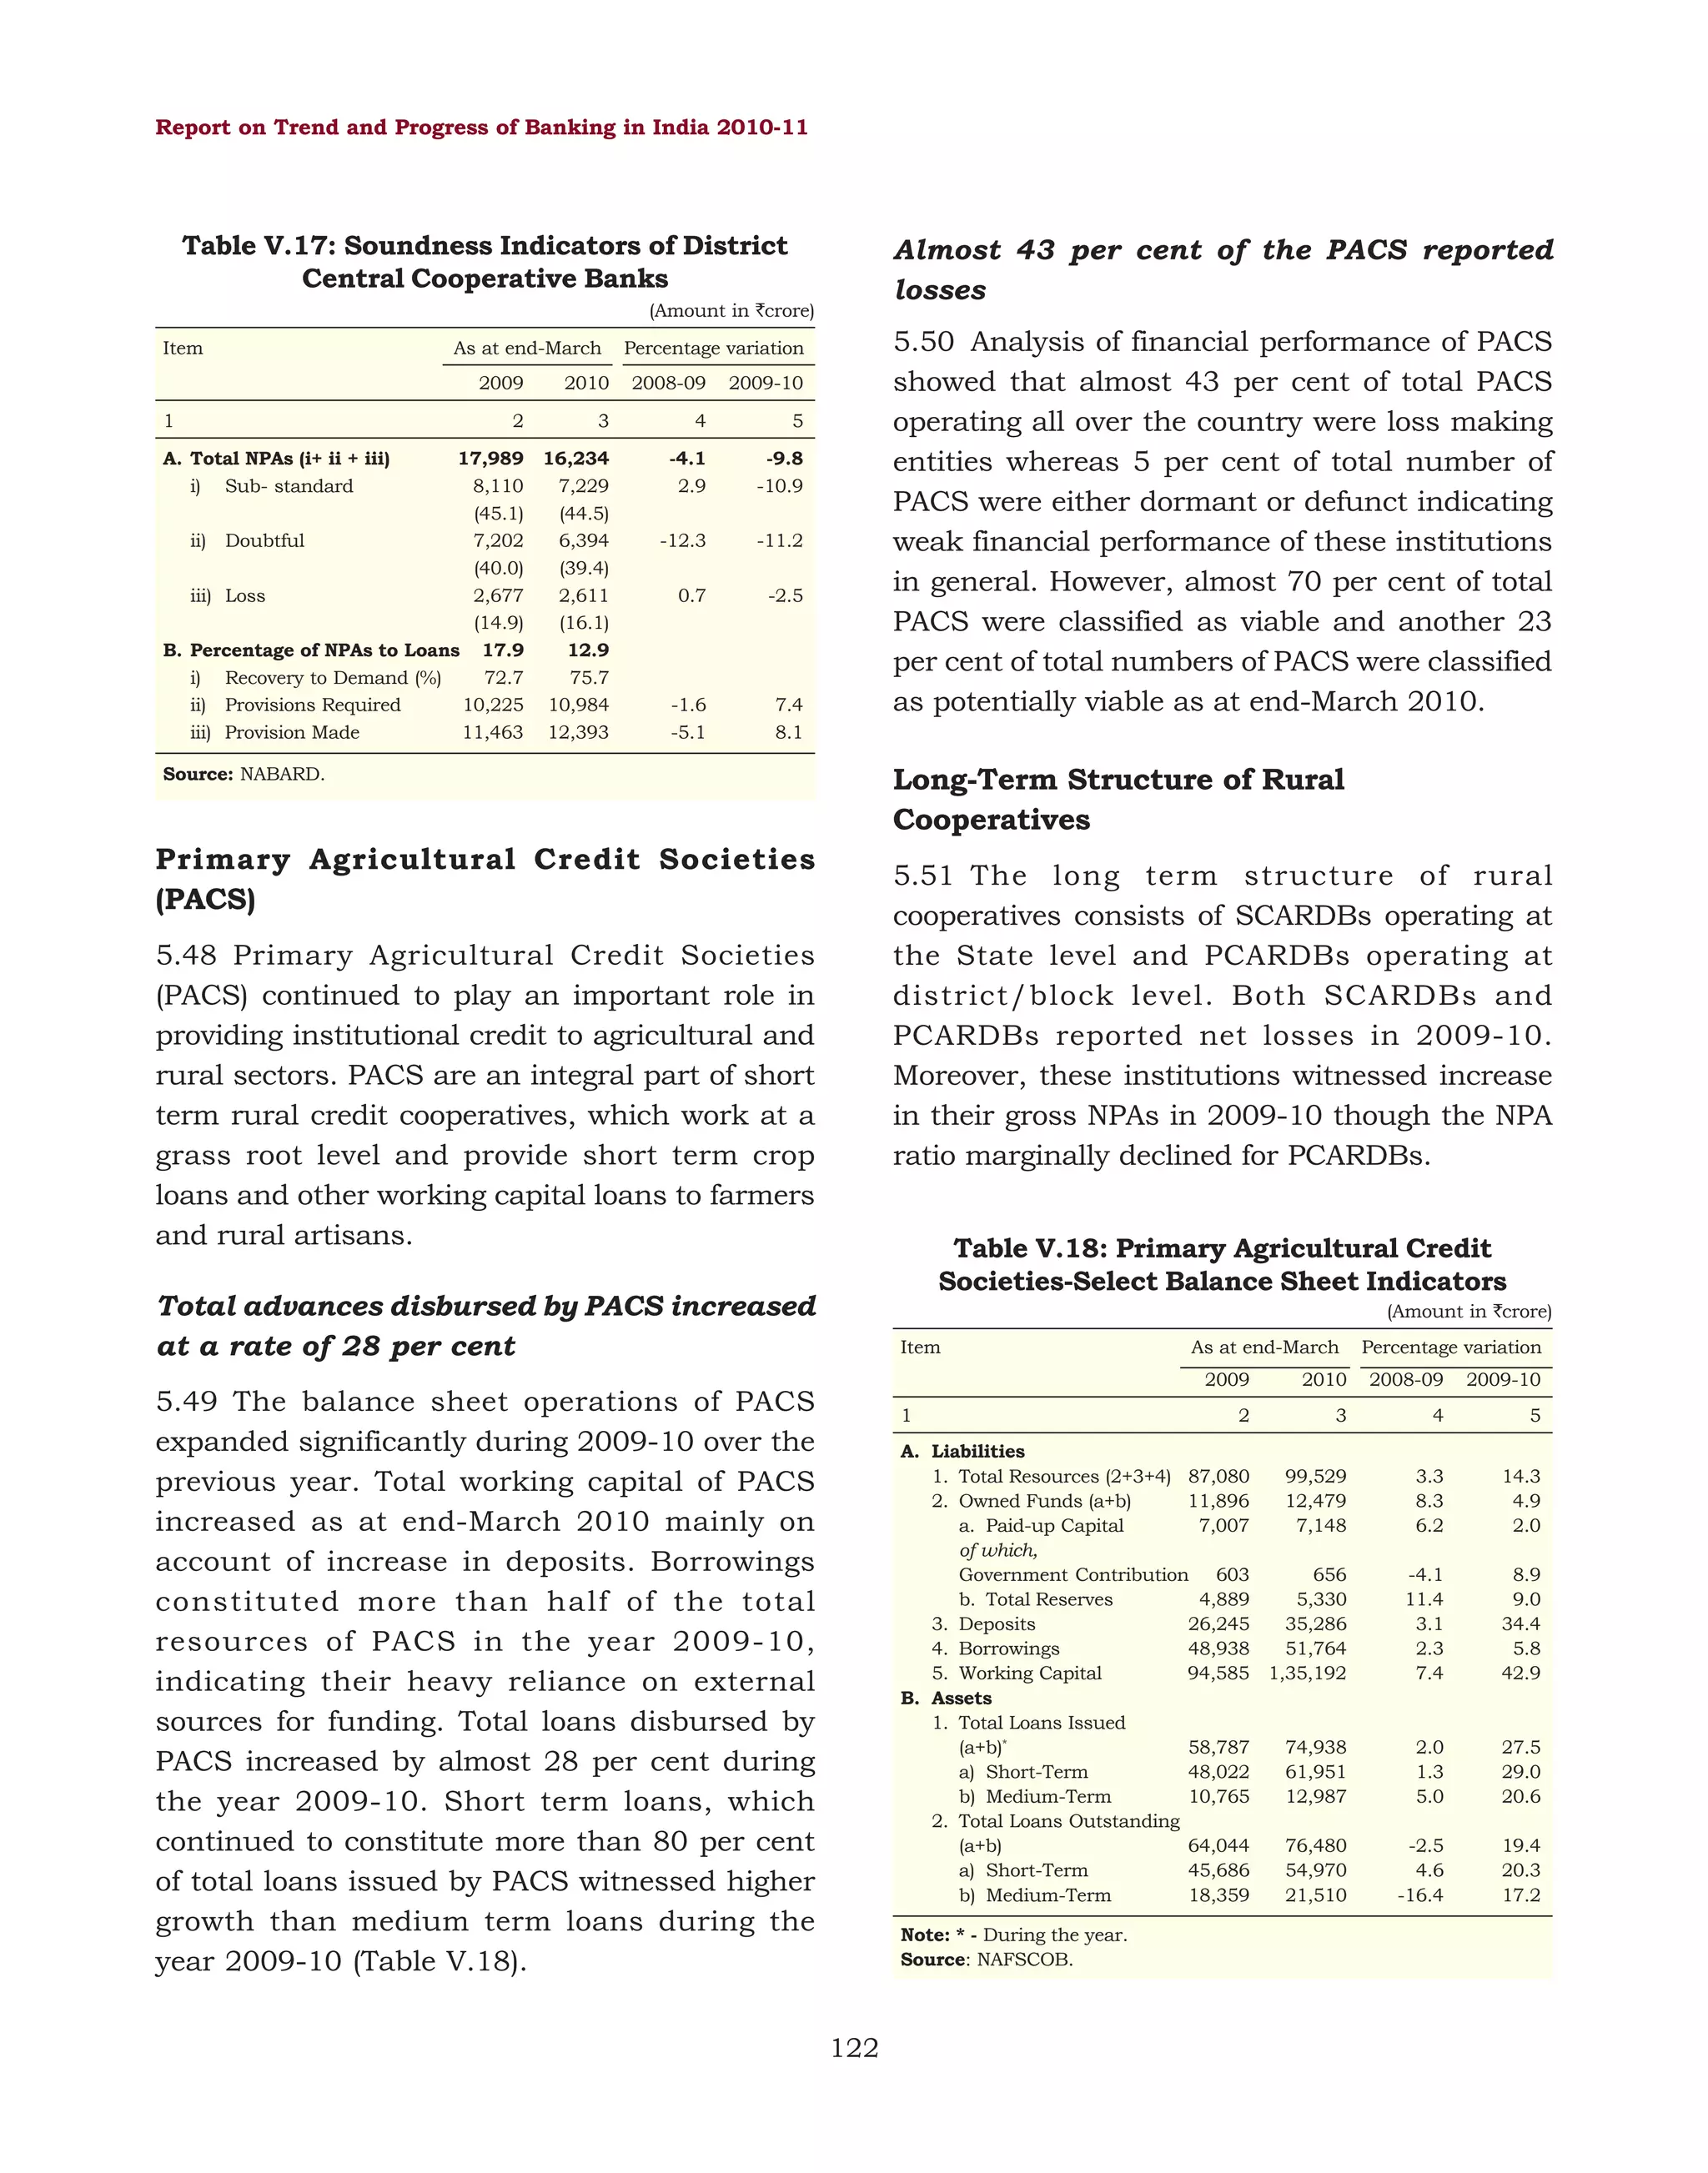
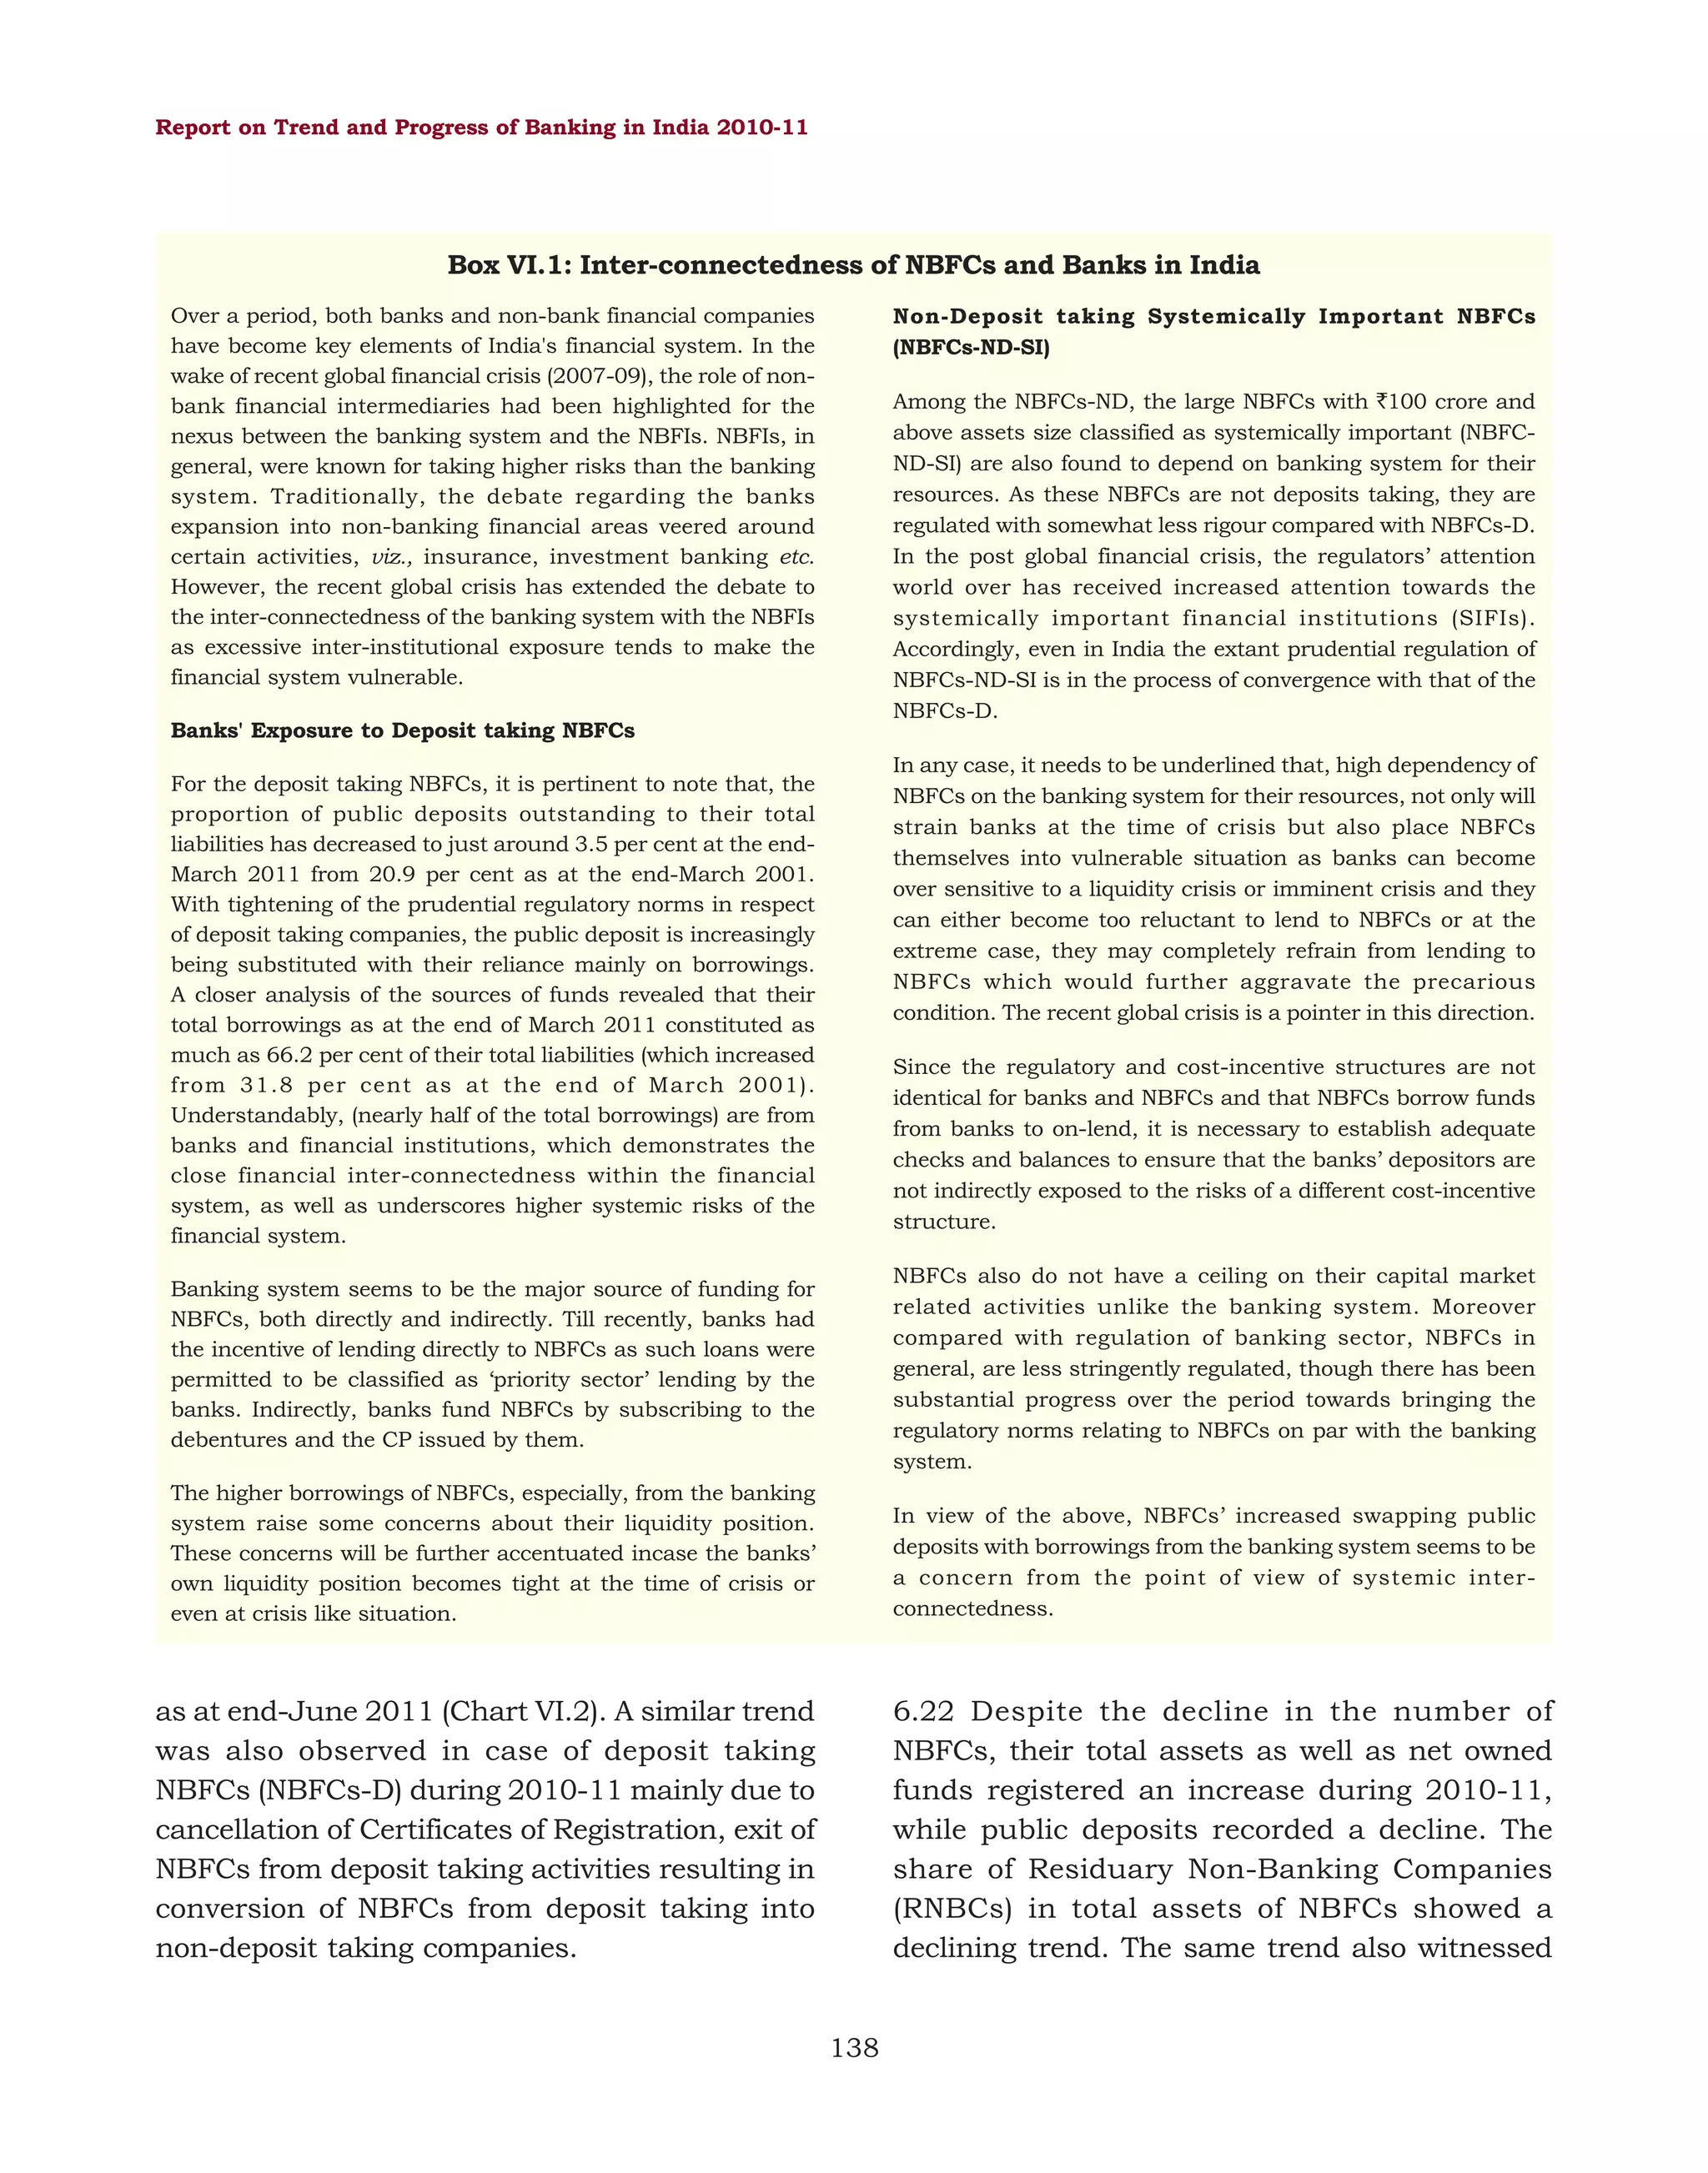
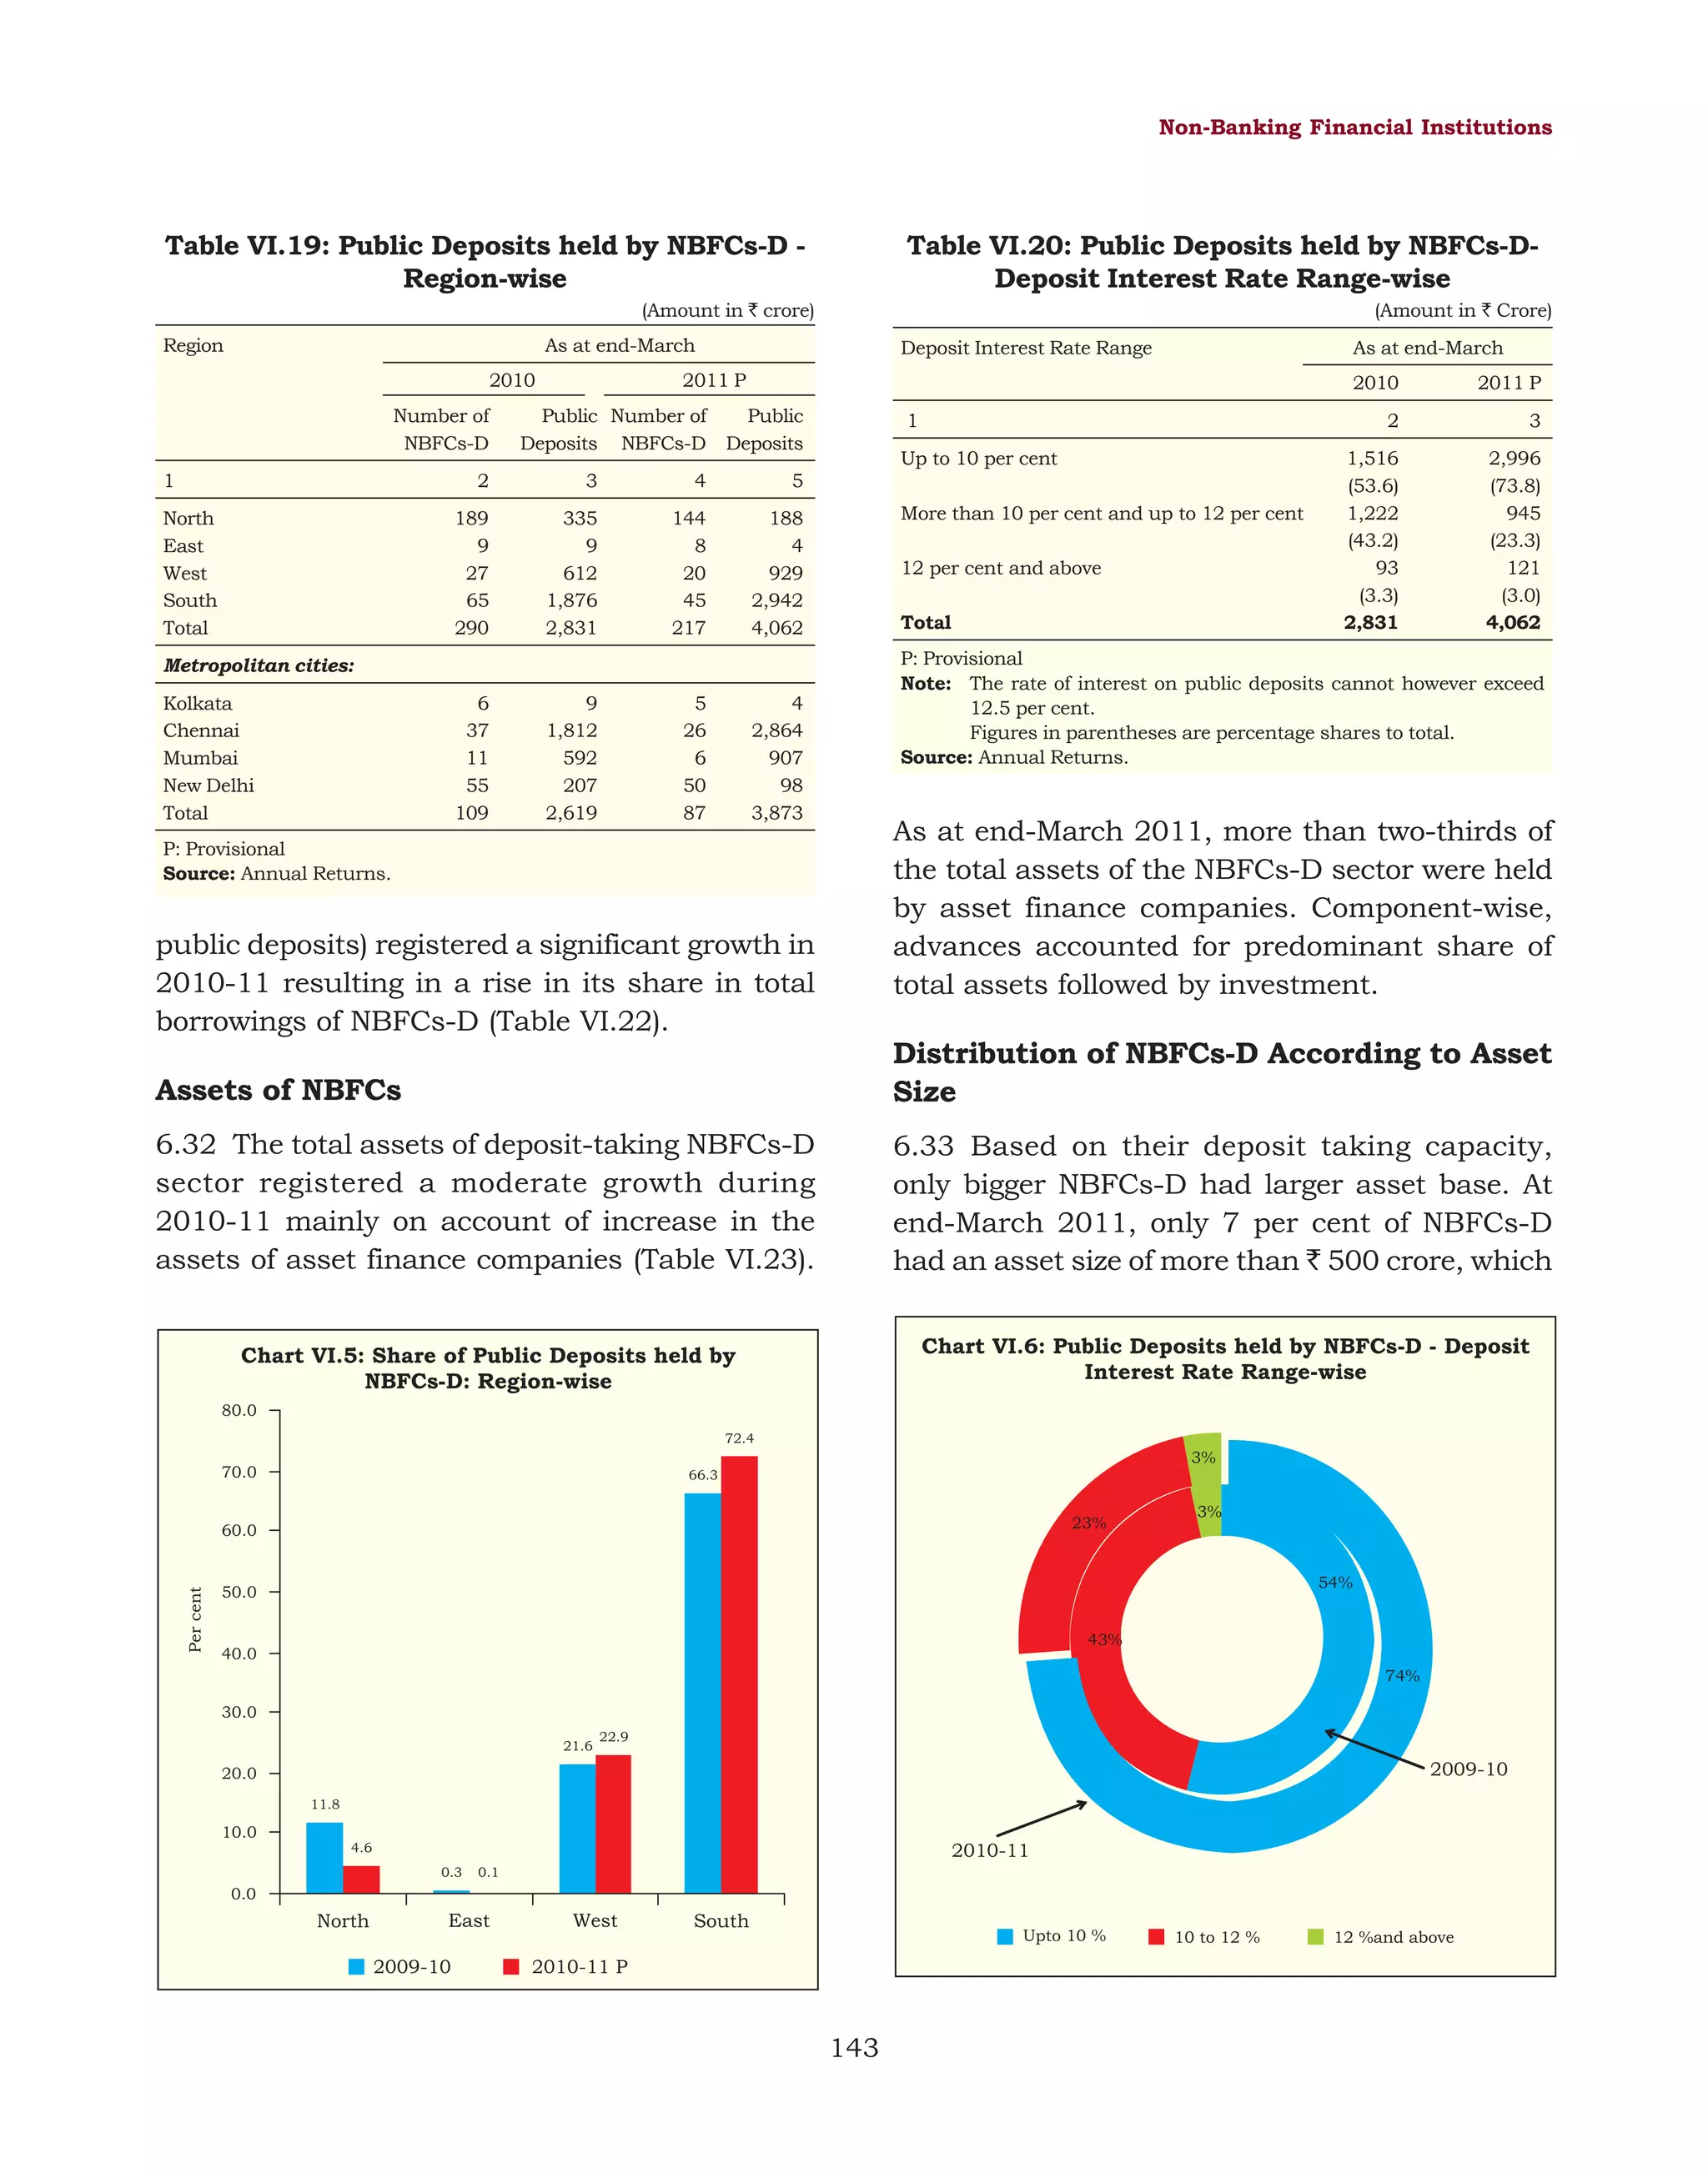
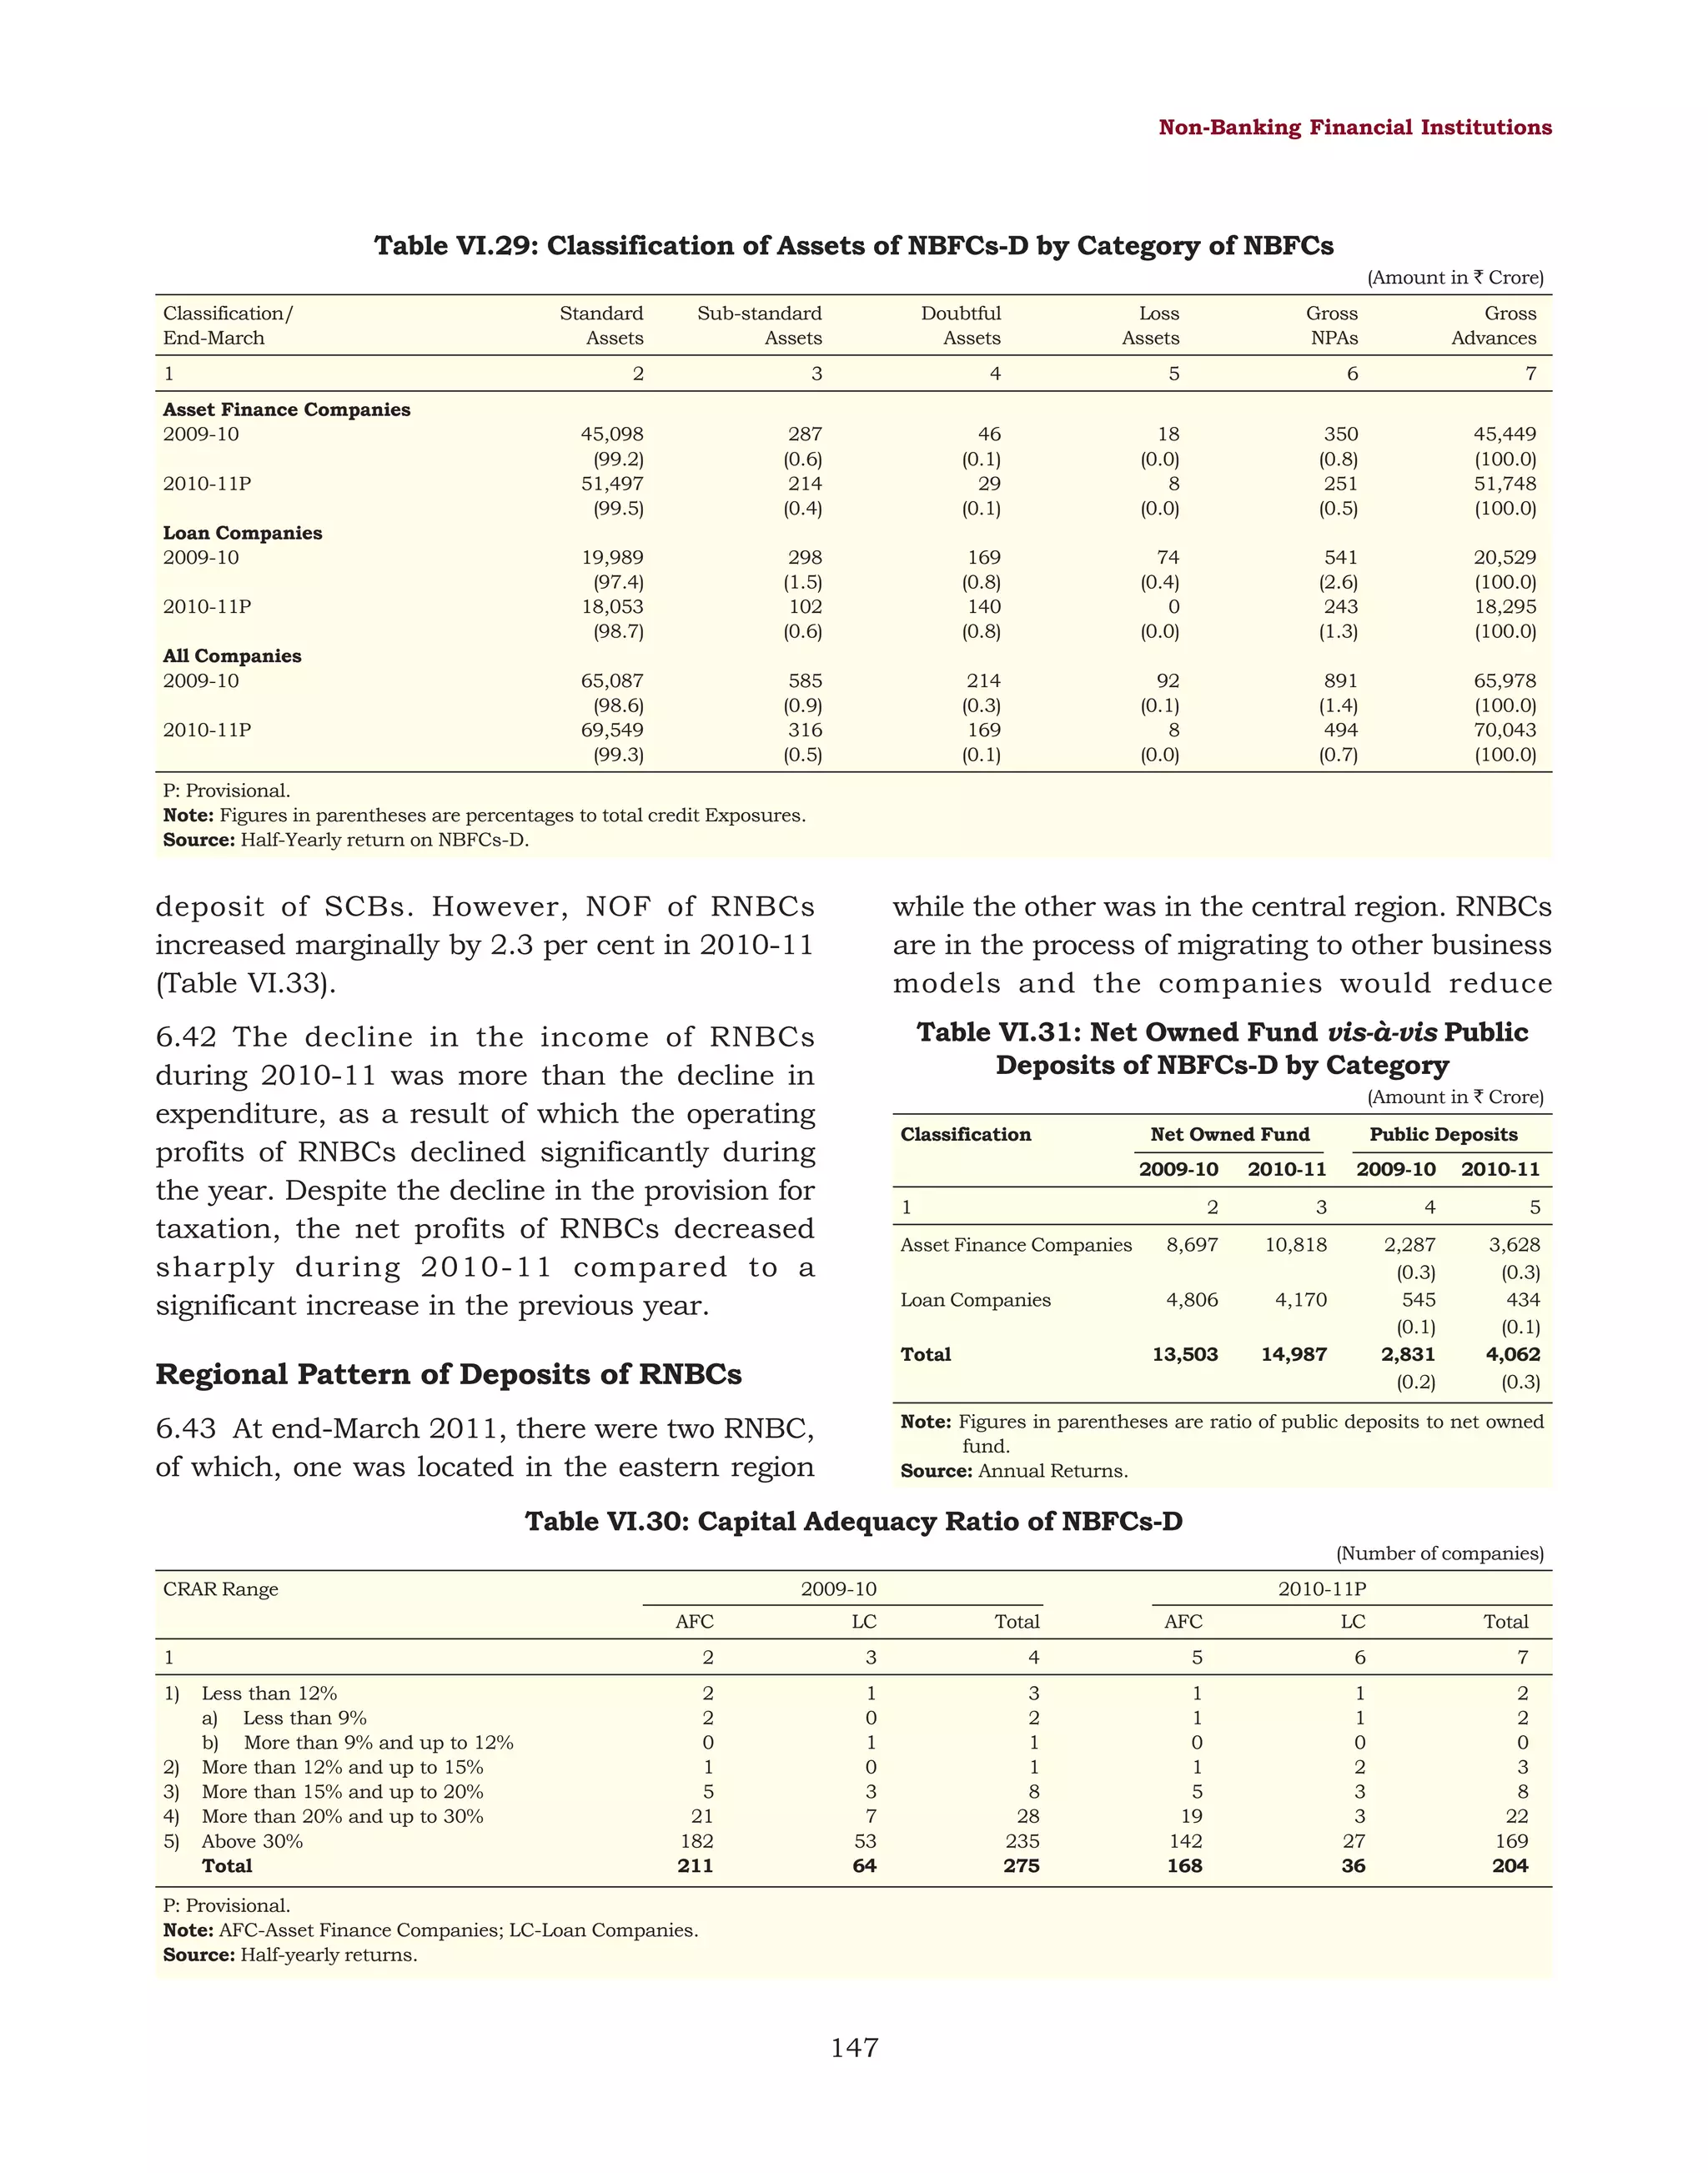
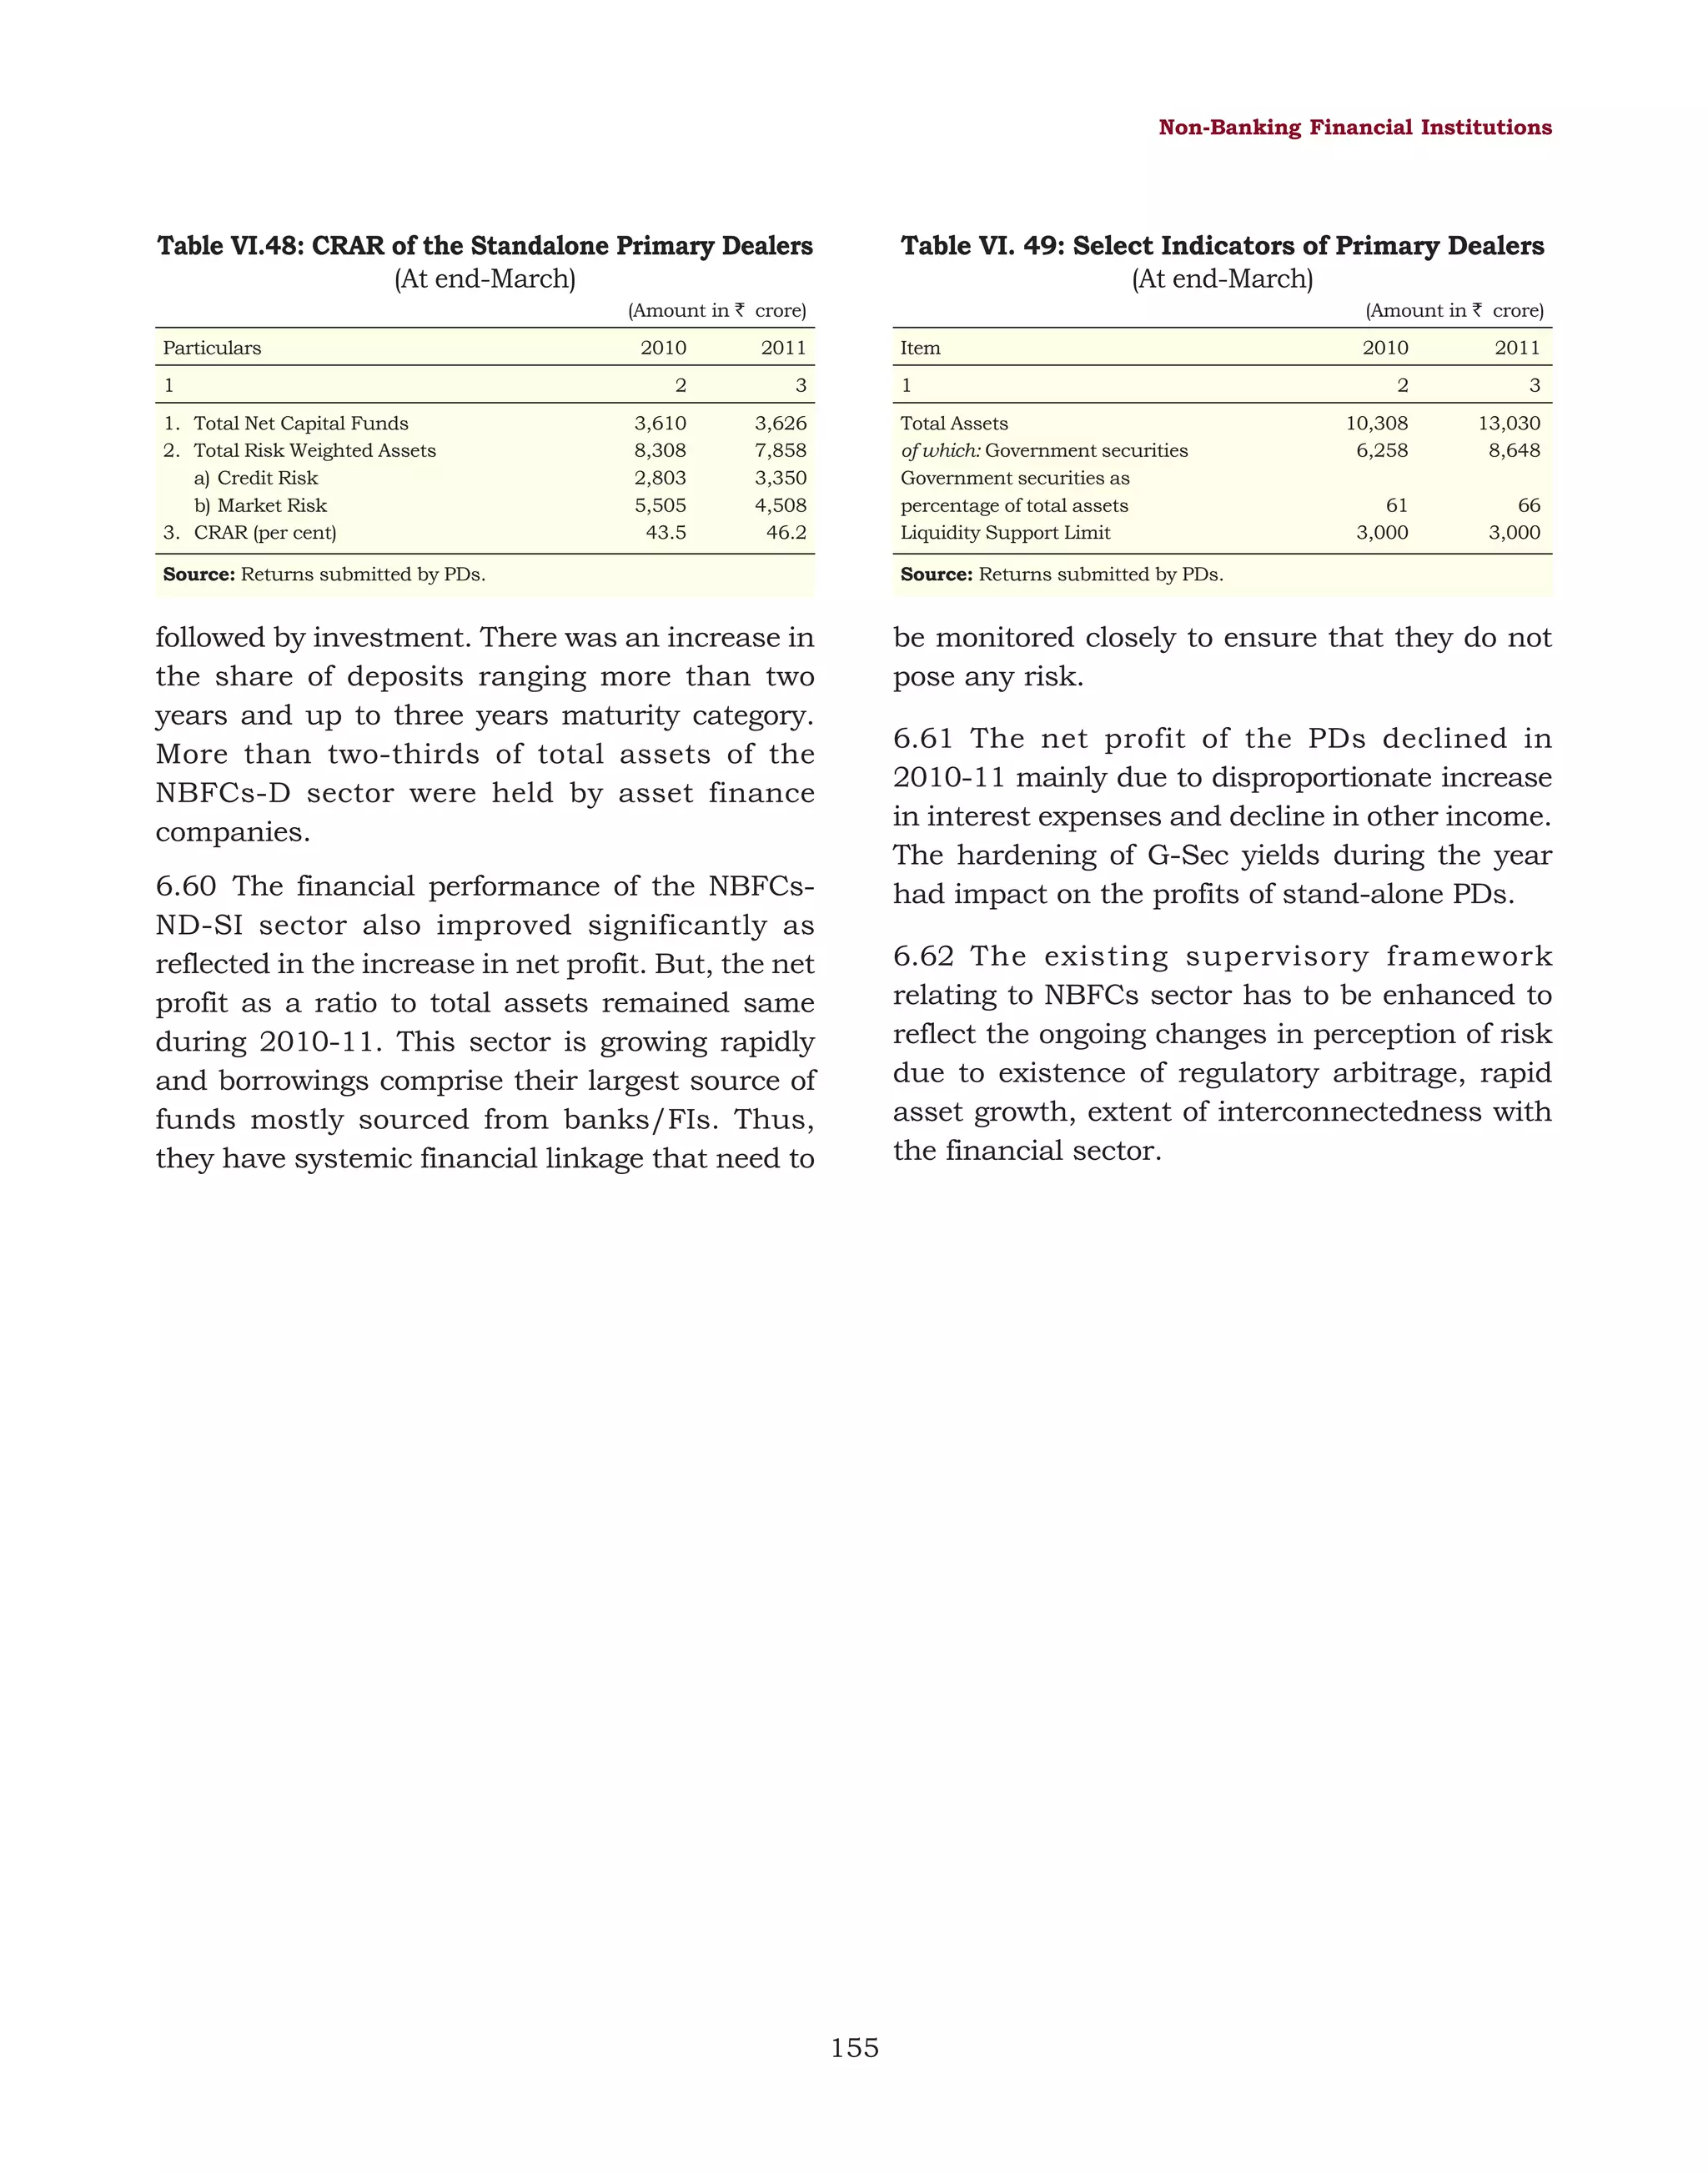
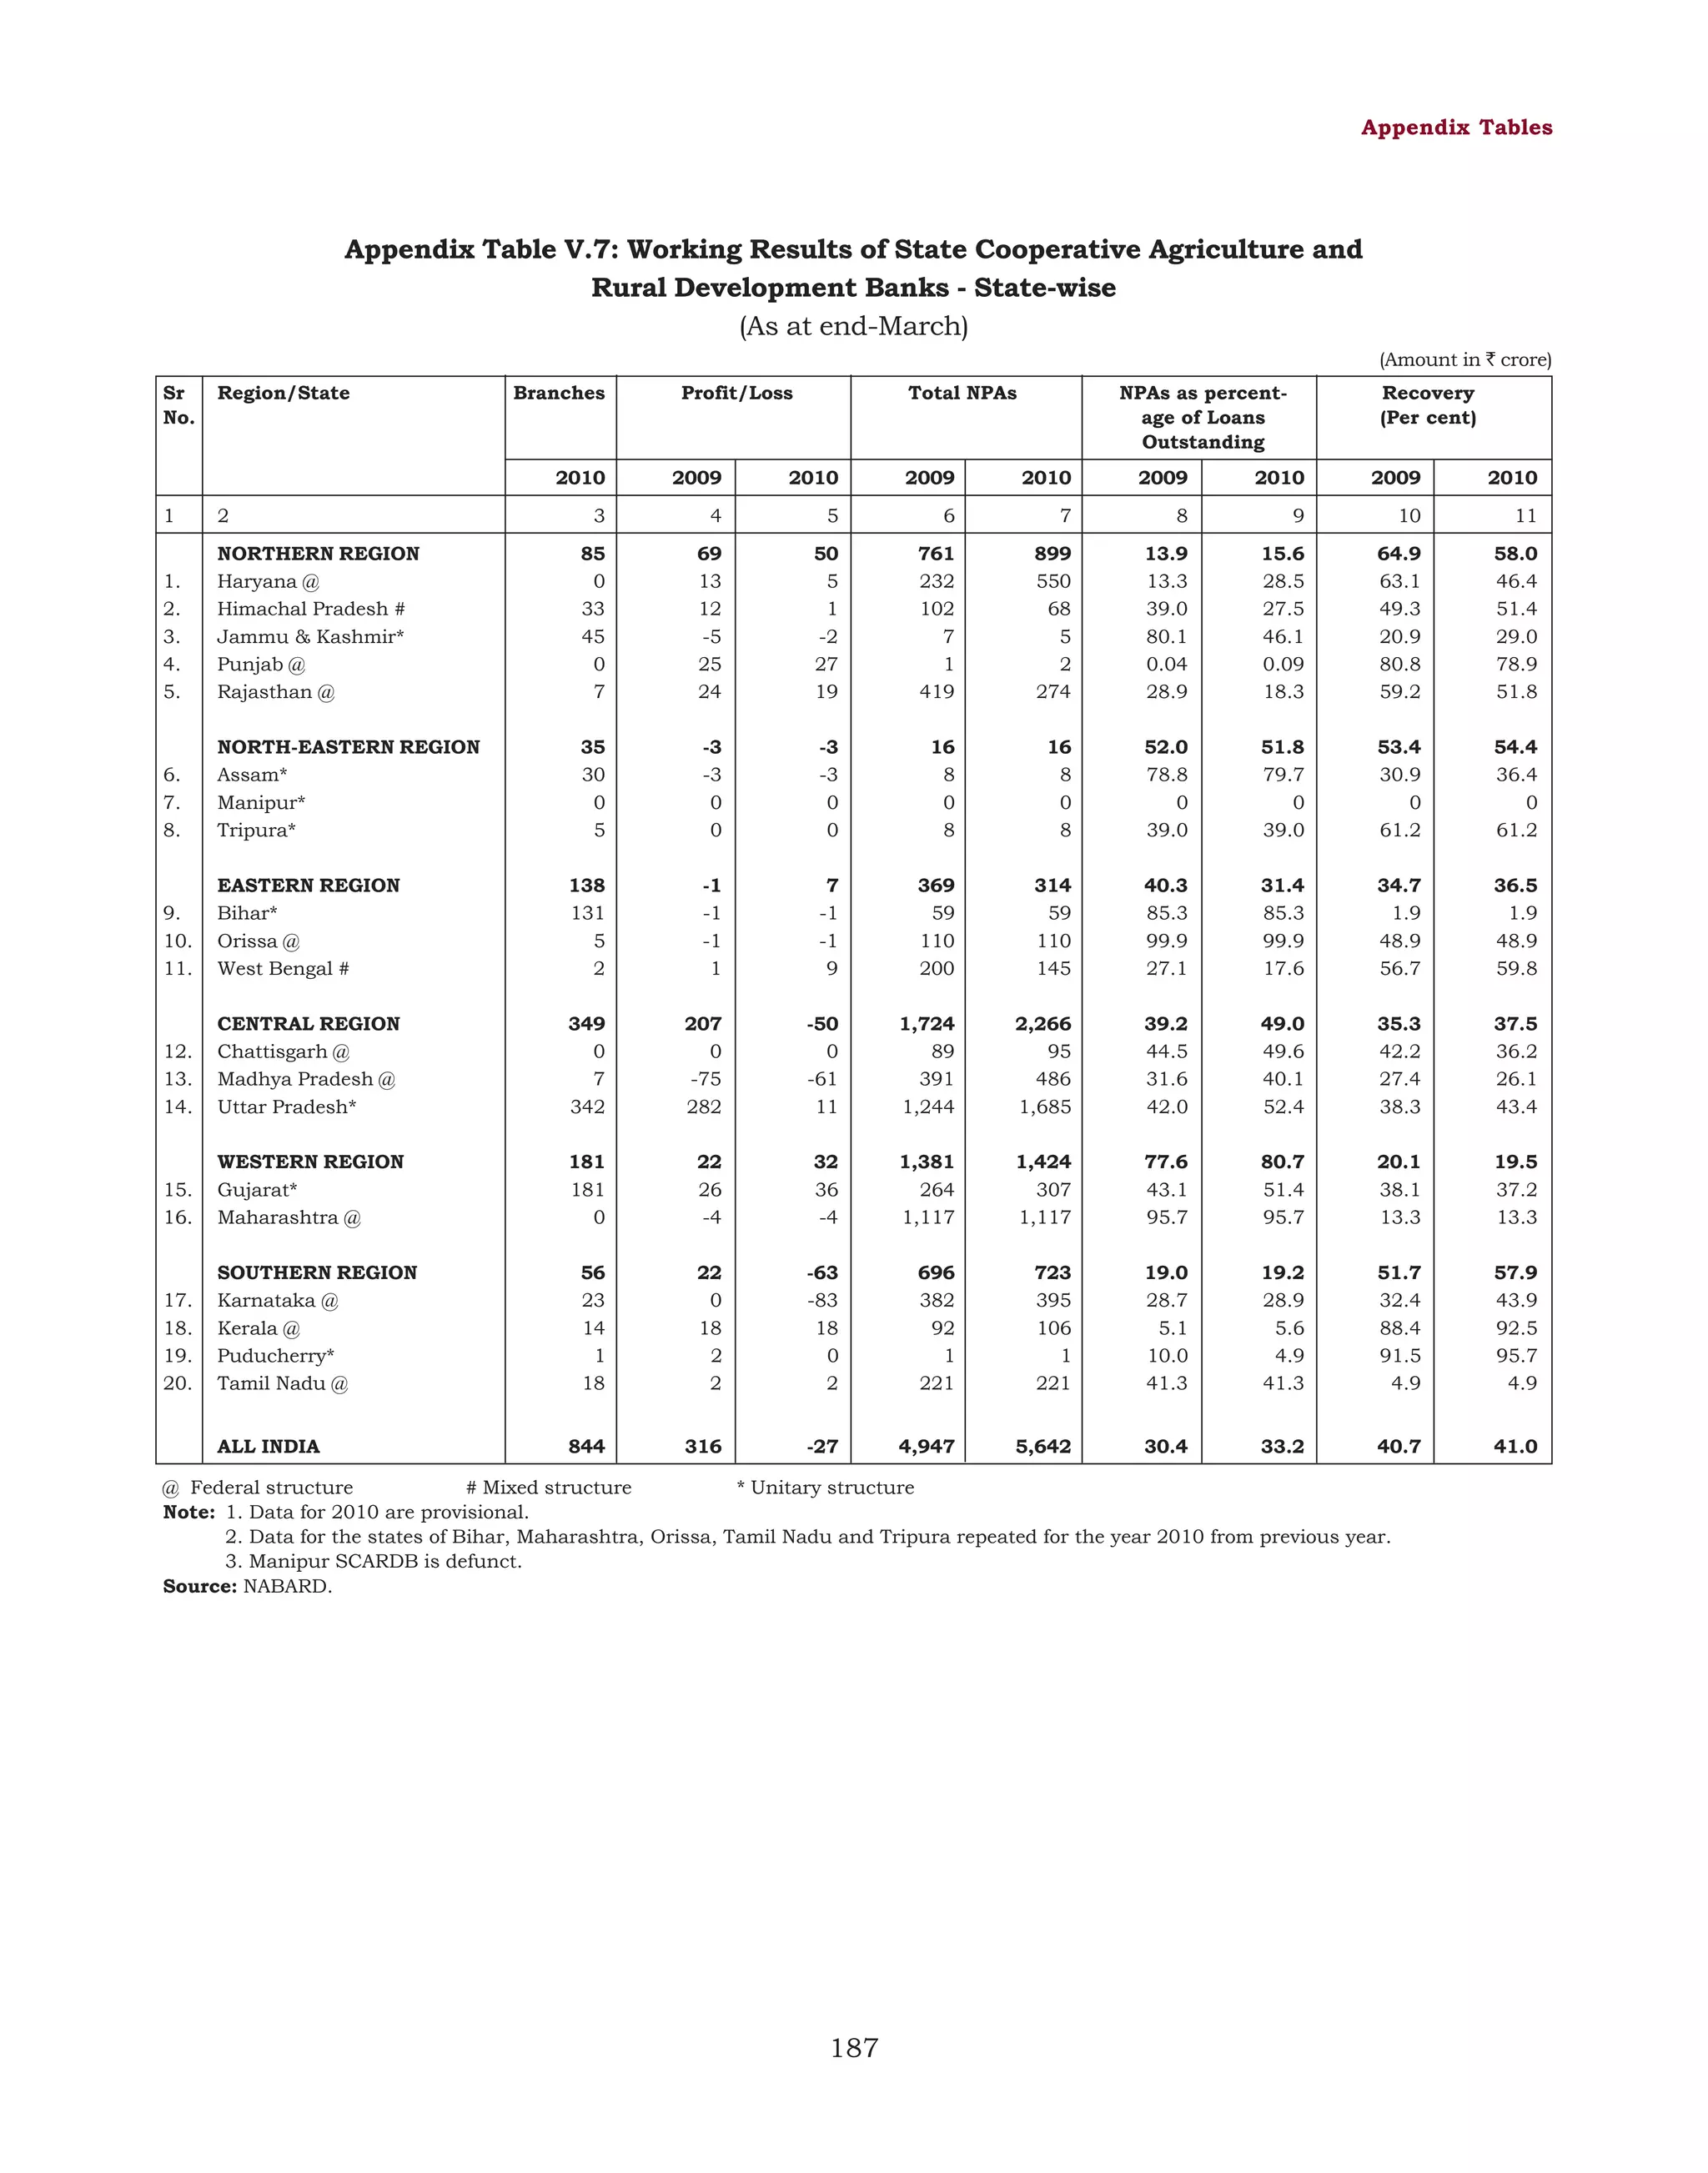
banks, which led the growth in total
international claims of banks (Table IV.6).
was mainly led by claims of banks on Germany,
UAE and USA. In contrast, claims of banks on UK
and Hong Kong registered a decline in 2010-11
as compared with the previous year (Table IV.7).
4.17 The growth in the consolidated international
claims of banks on countries other than India
Table IV.5: International Assets of Banks - By Type
(As at end-March)
(Amount in ` crore)
Percentage Variation
Item
2010
2011
2010
2
3
4
5
2,37,181
(96.3)
2,78,741
(96.8)
8.0
17.5
10,196
(4.1)
1,23,476
(50.1)
50,496
(20.5)
52,135
(21.2)
39
(0.0)
9,139
(3.7)
14,414
(5.0)
1,40,083
(48.6)
61,321
(21.3)
62,343
(21.6)
179
(0.1)
9,147
(3.2)
22.2
41.4
23.5
13.4
13.3
21.4
-21.6
19.6
-48.7
359.0
-6.1
0.1
2,46,359
(100.0)
2,88,067
(100.0)
7.4
16.9
1
1. Loans and Investments
of which :
a) Loans to Non-Residents*
b)
Foreign Currency Loans to Residents**
c)
Outstanding Export Bills drawn on
Non-Residents by Residents
Nostro Balances @
d)
2. Holdings of Debt Securities
3. Other Assets
@@
Total International Assets
2011
*
: Include rupee loans and Foreign Currency (FC) loans out of non-residents (NR) deposits;
** : Include loans out of FCNR (B) deposits, Packing Credit in Foreign Currency (PCFC), FC lending to and FC deposits with banks in India.
@ : Include placements made abroad and balances in term deposits with non-resident banks.
@@ : Include capital supplied to and receivable profits from foreign branches/subsidiaries of Indian banks and other unclassified international assets.
Note : Figures in parentheses are percentages to total international assets.
Source: Locational Banking Statistics.
65](https://image.slidesharecdn.com/0tpbi121111full-140101004243-phpapp02/75/0-tpbi121111-full-85-2048.jpg)

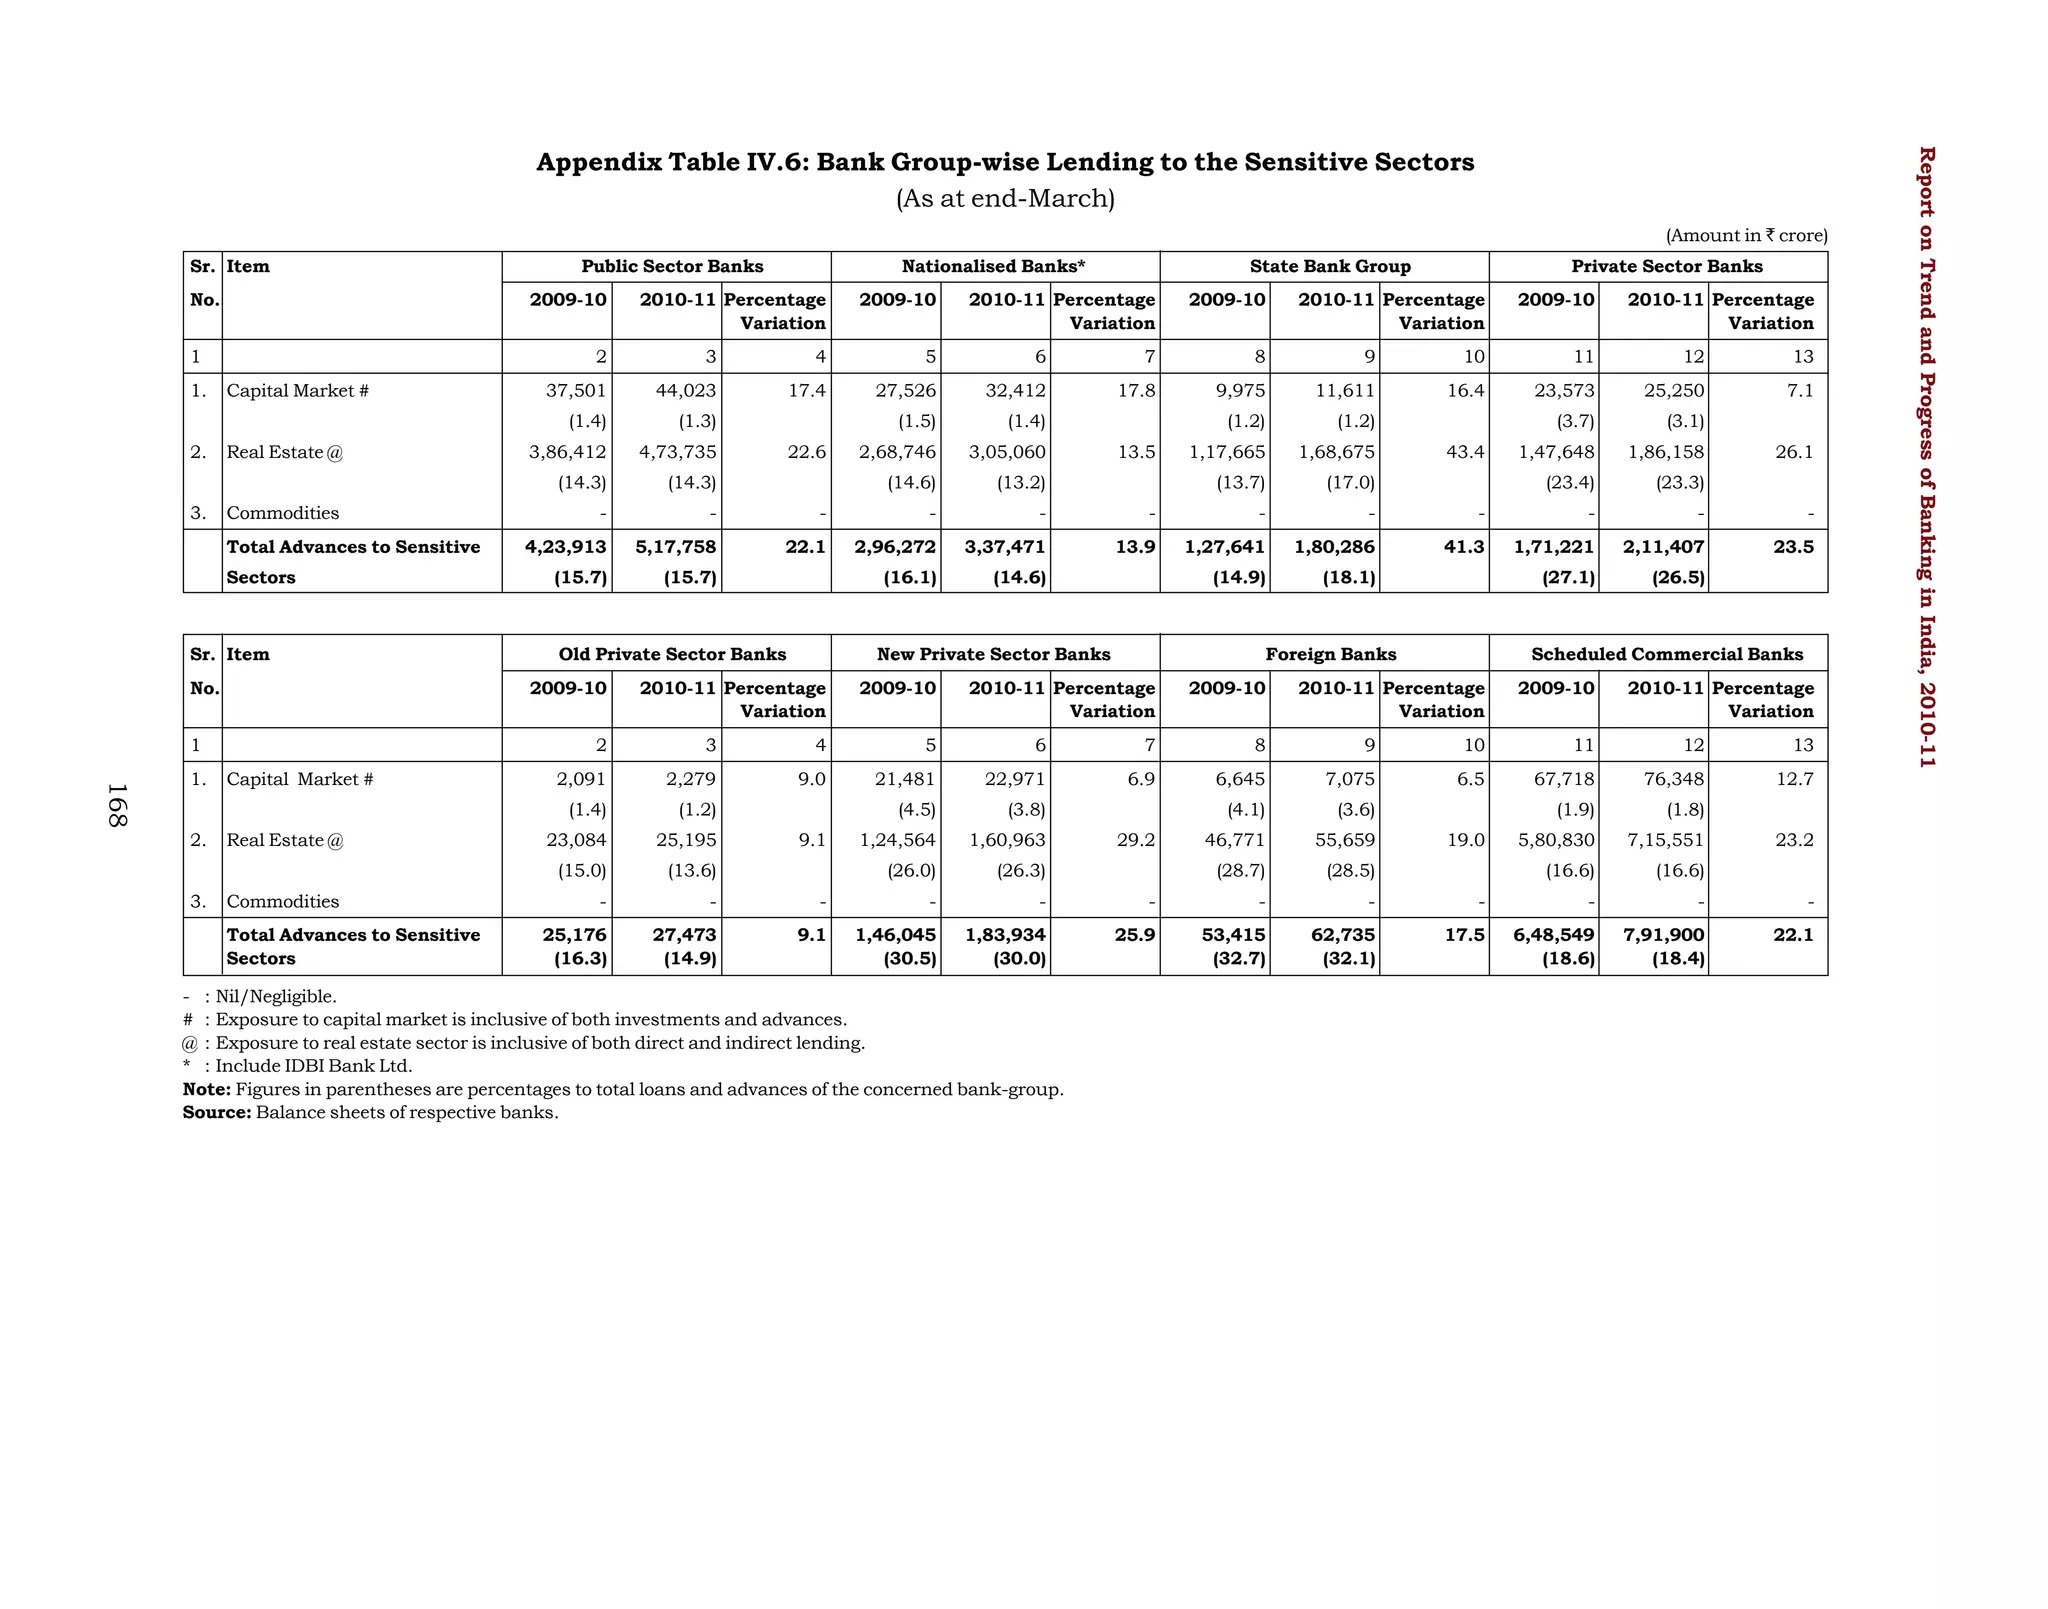
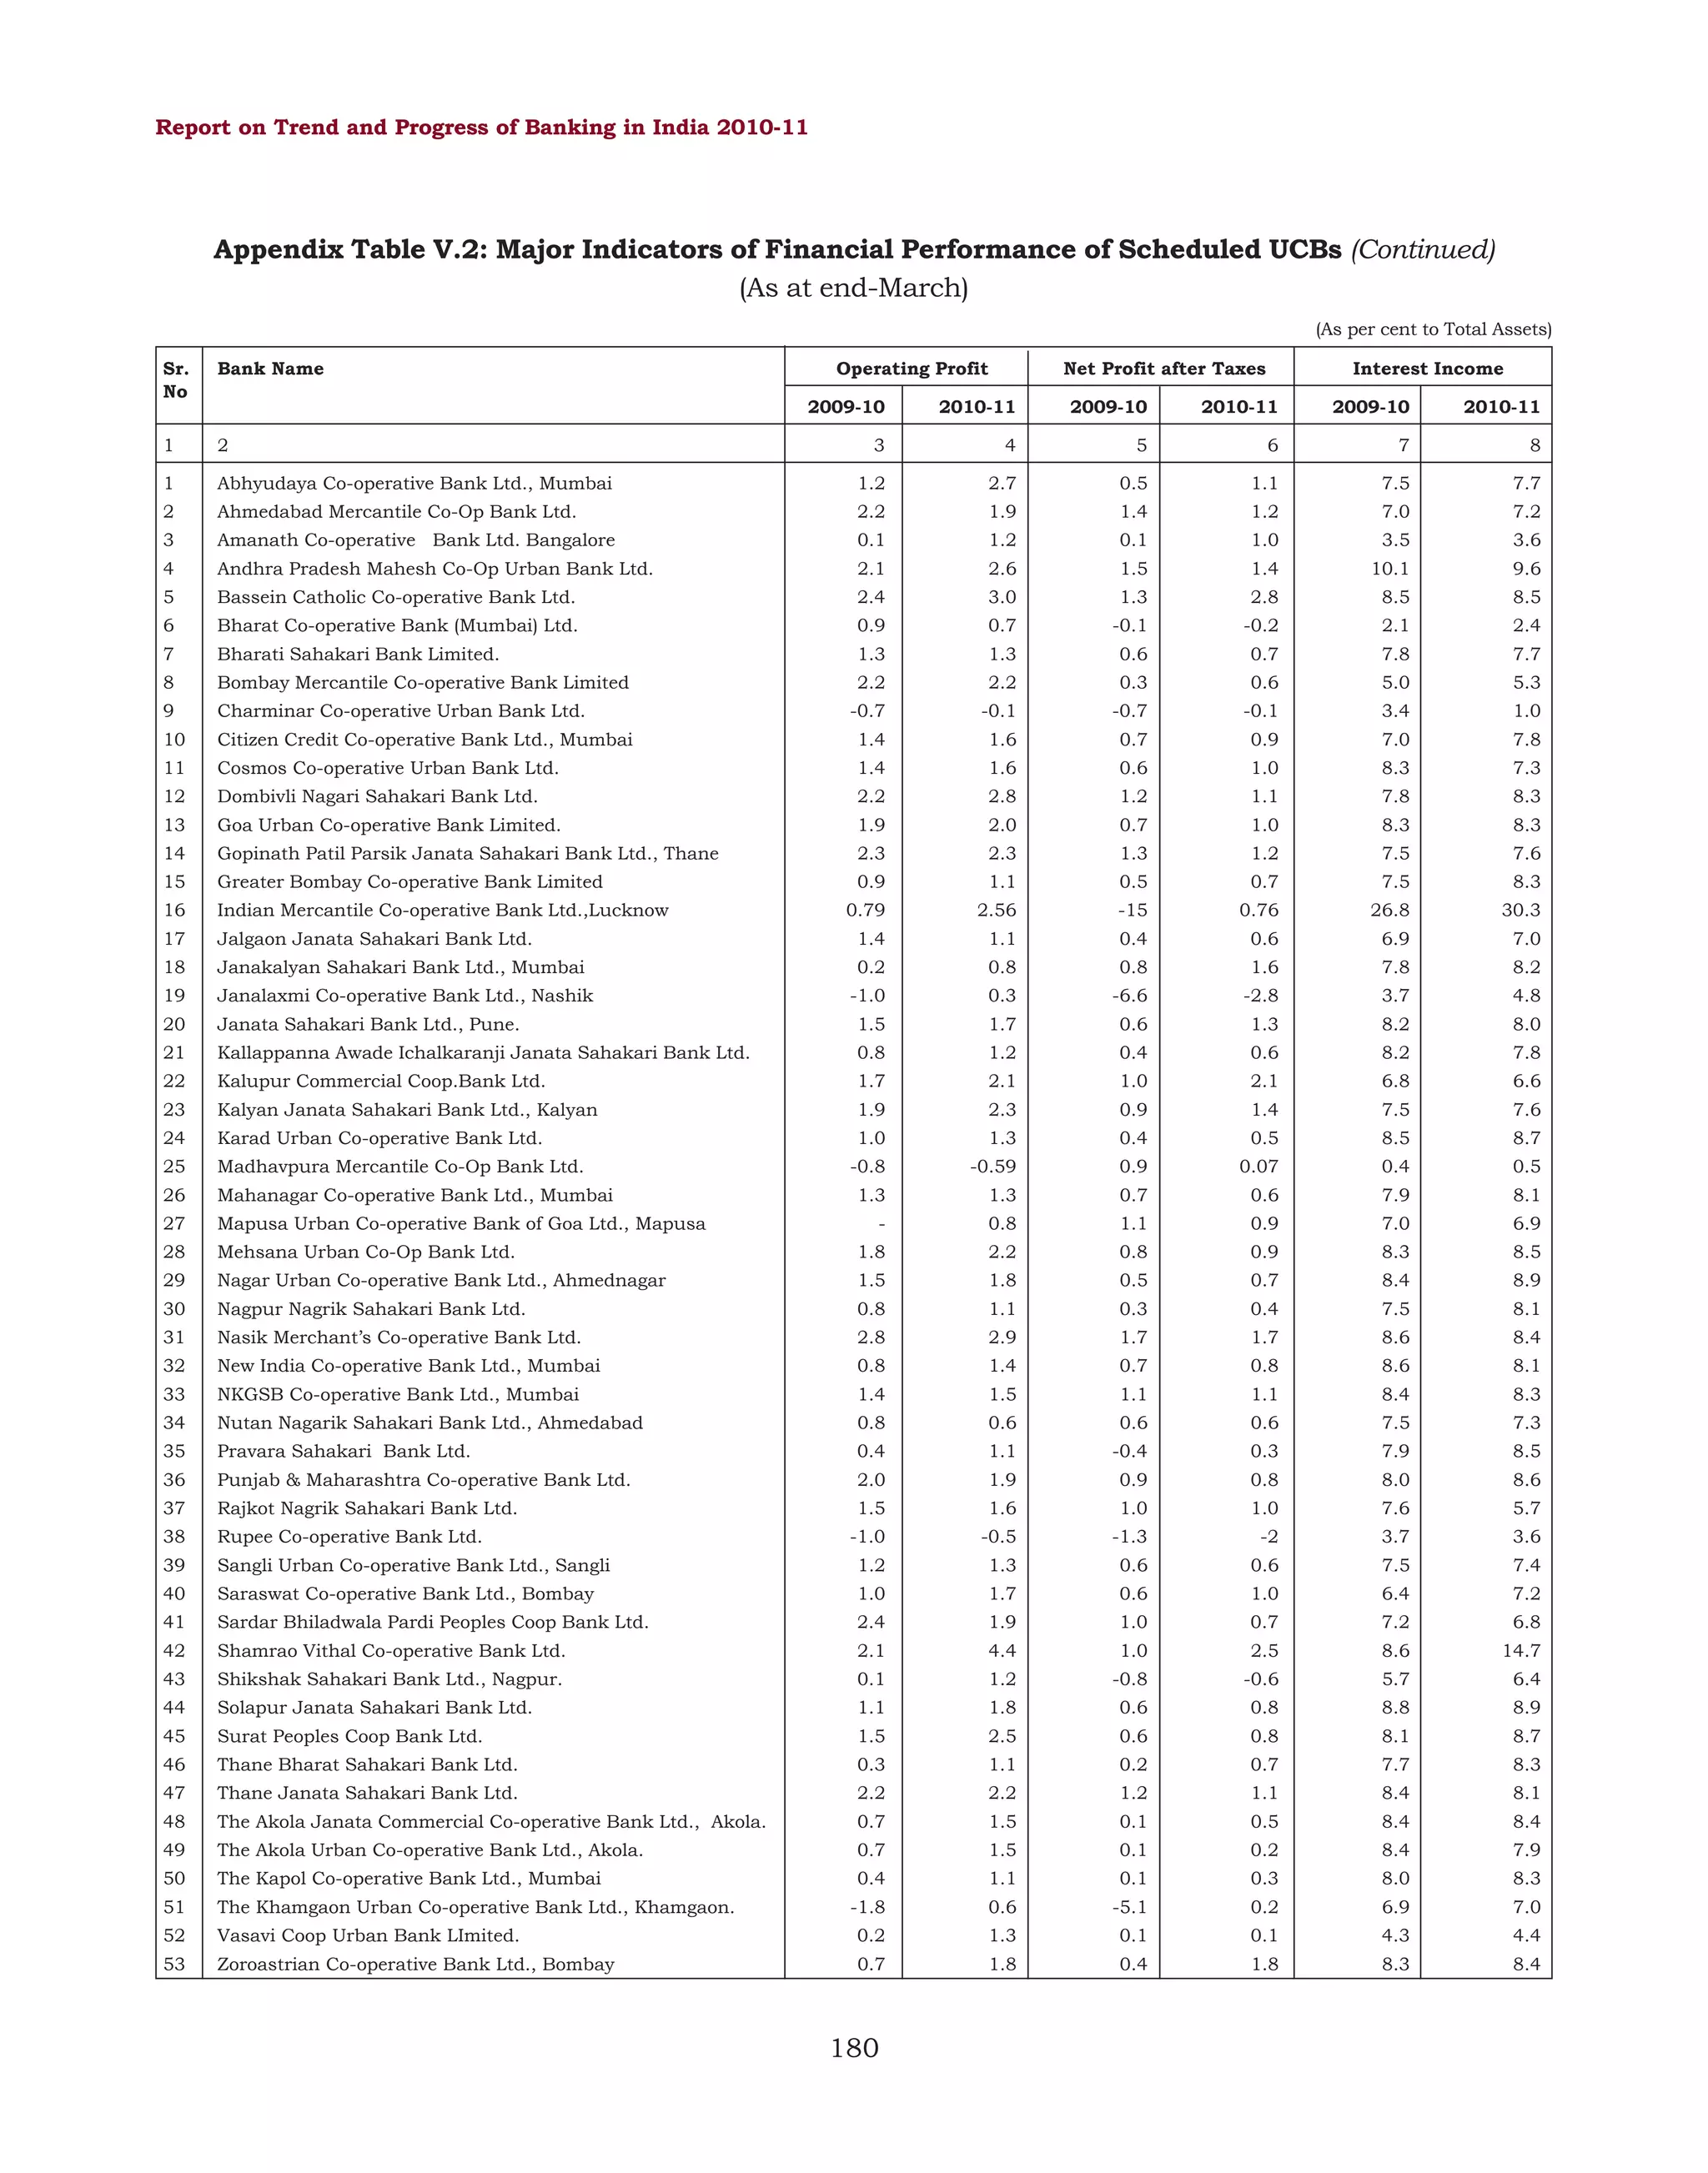
![Report on Trend and Progress of Banking in India 2010-11
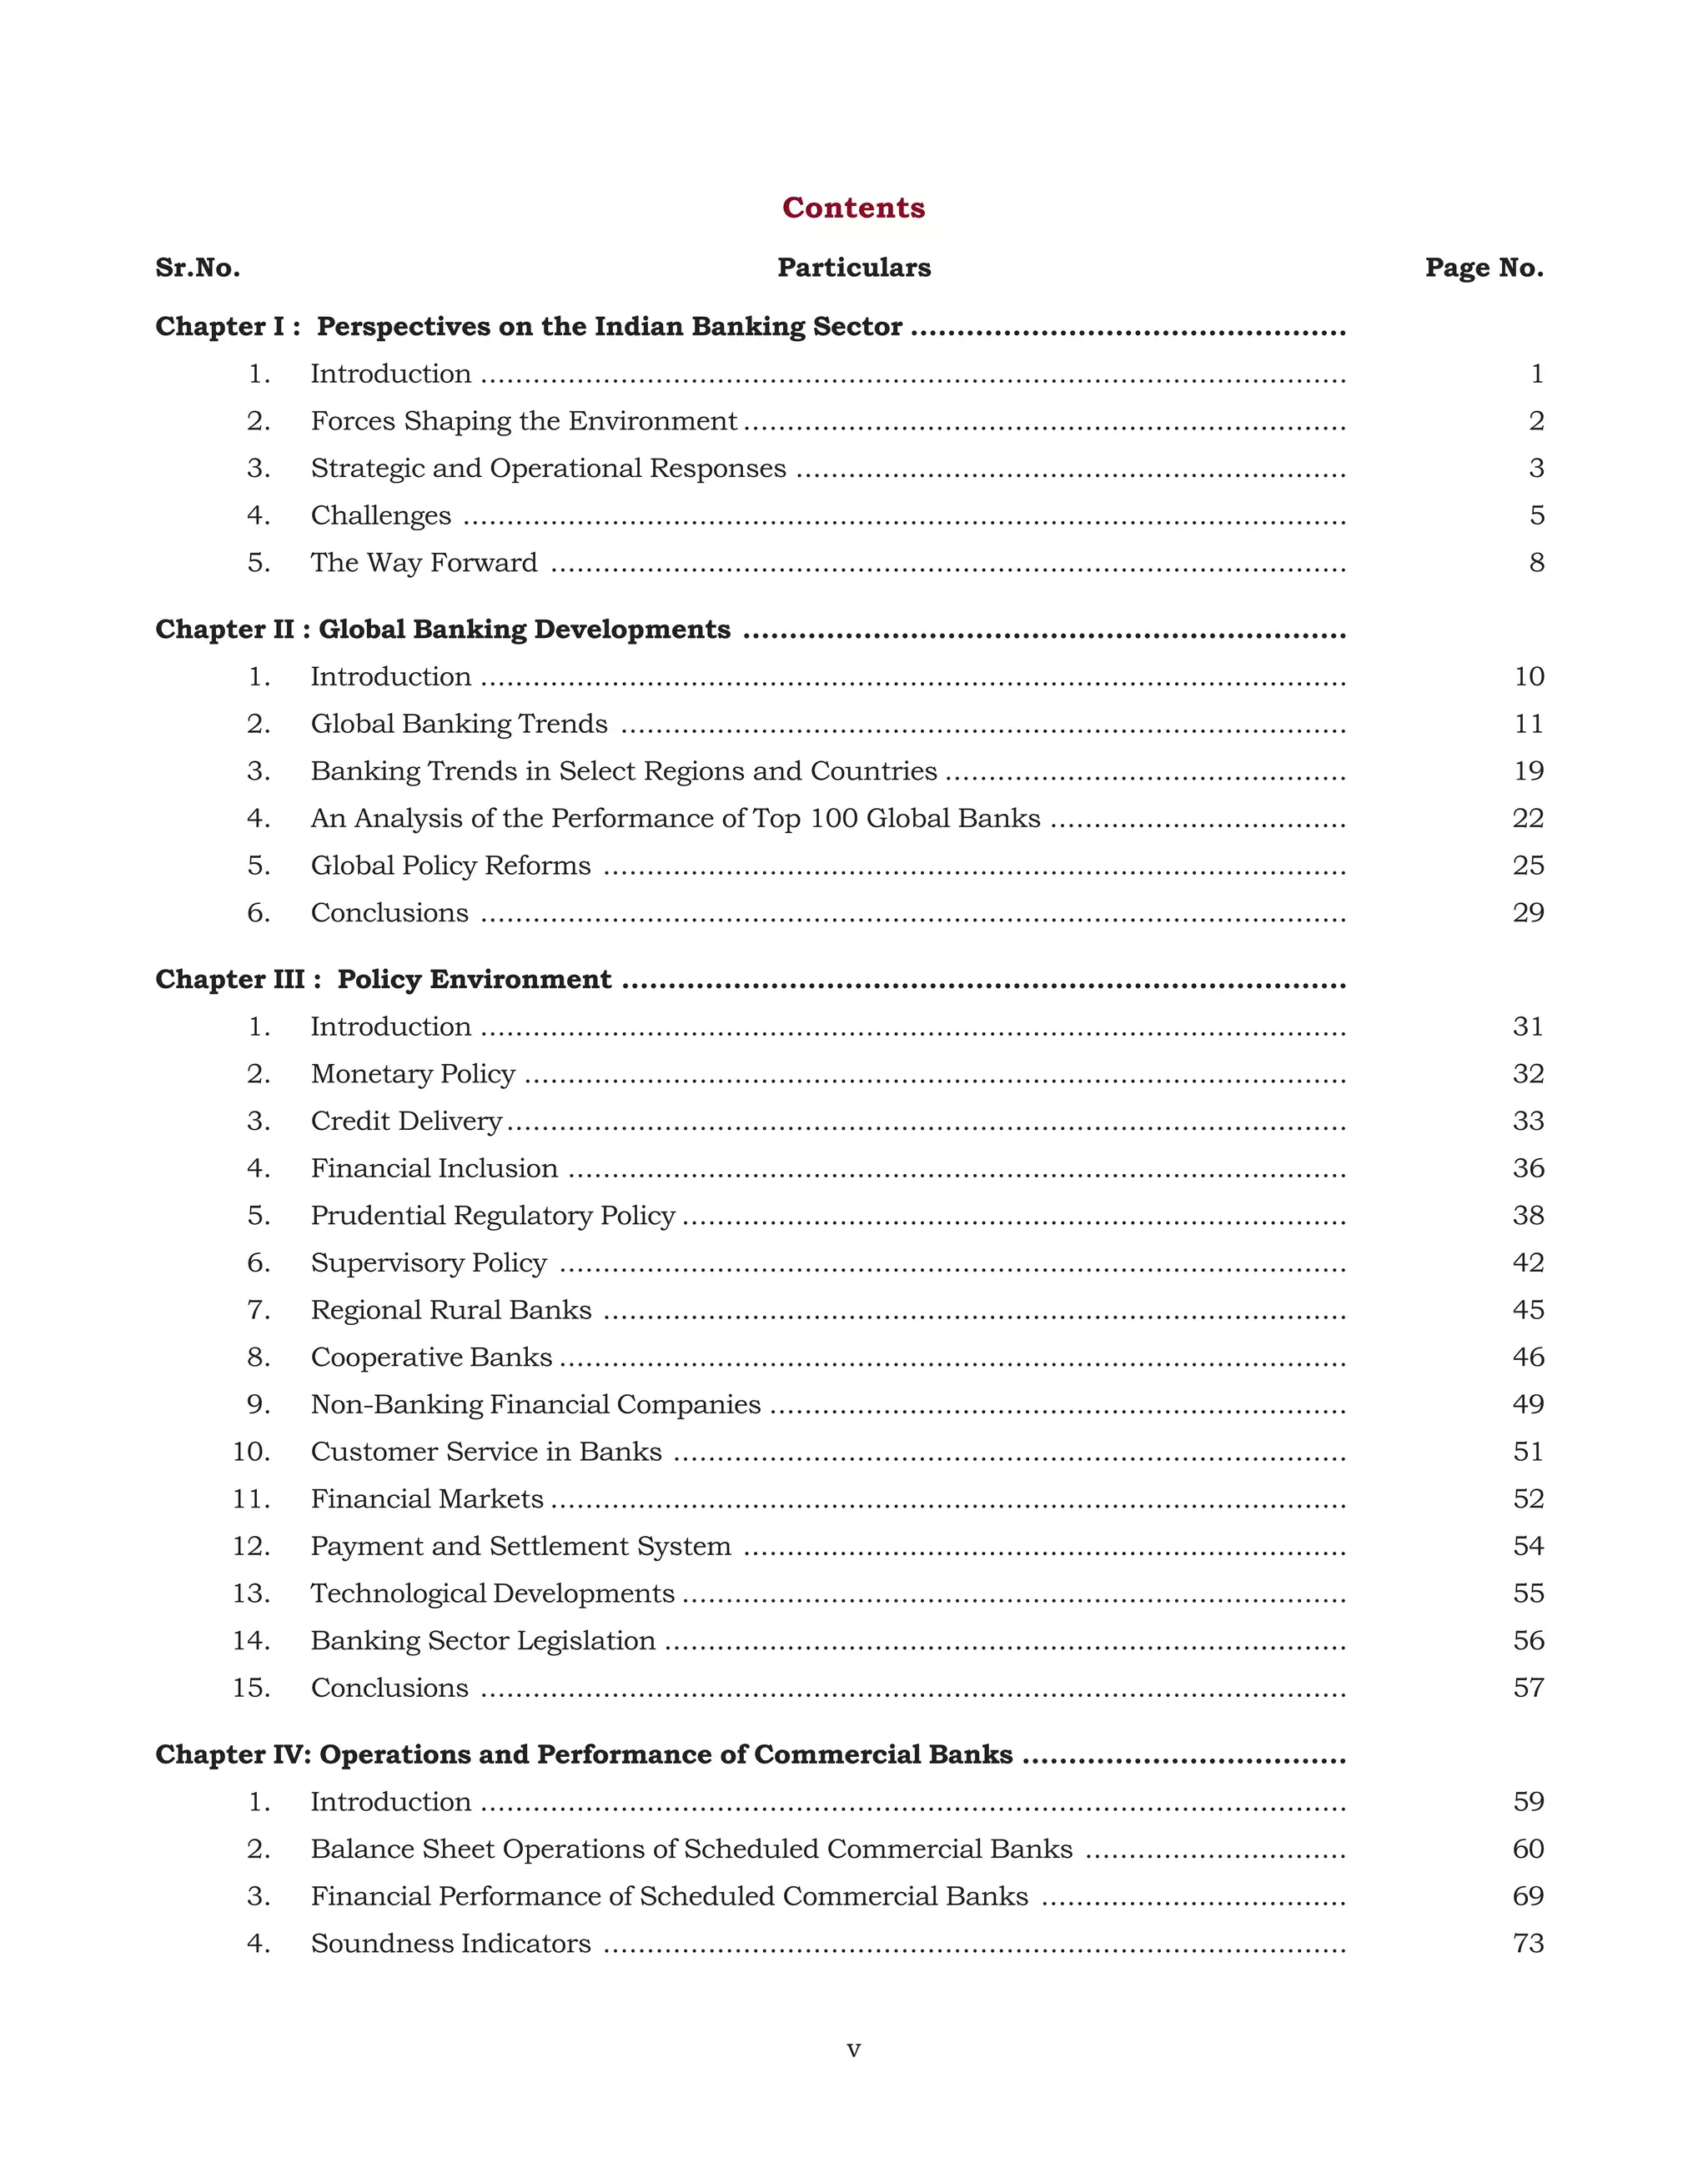
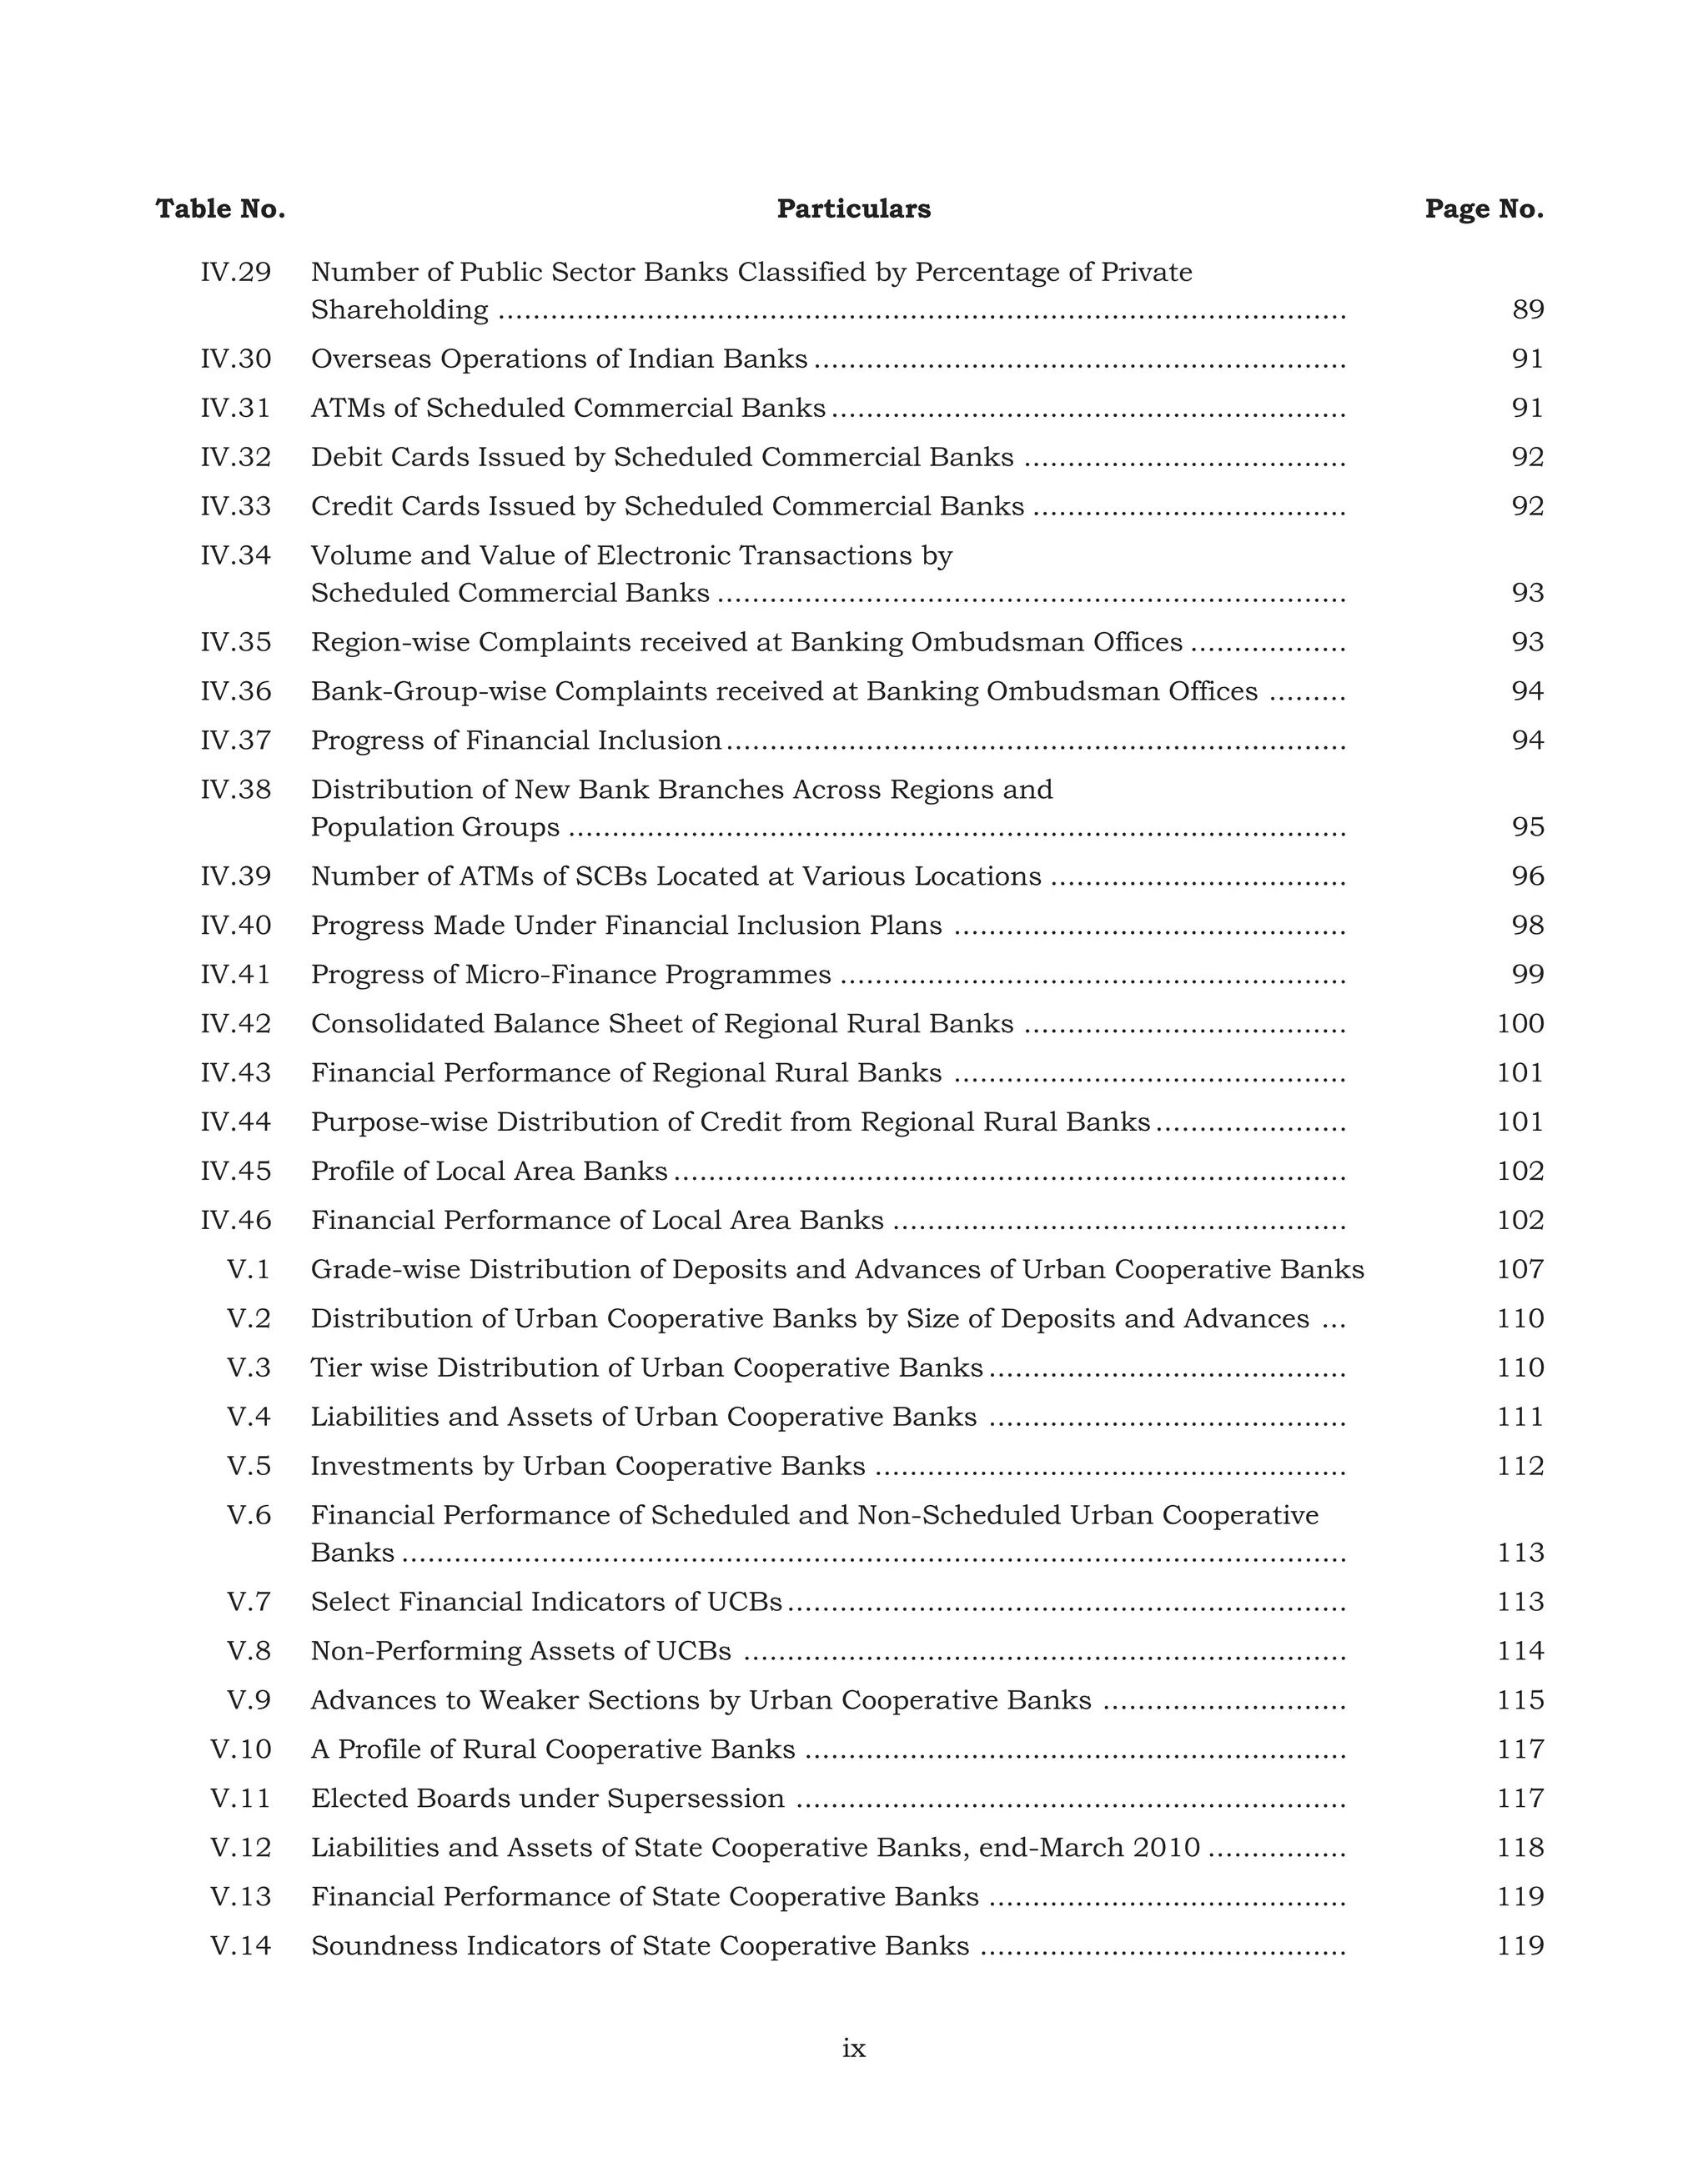
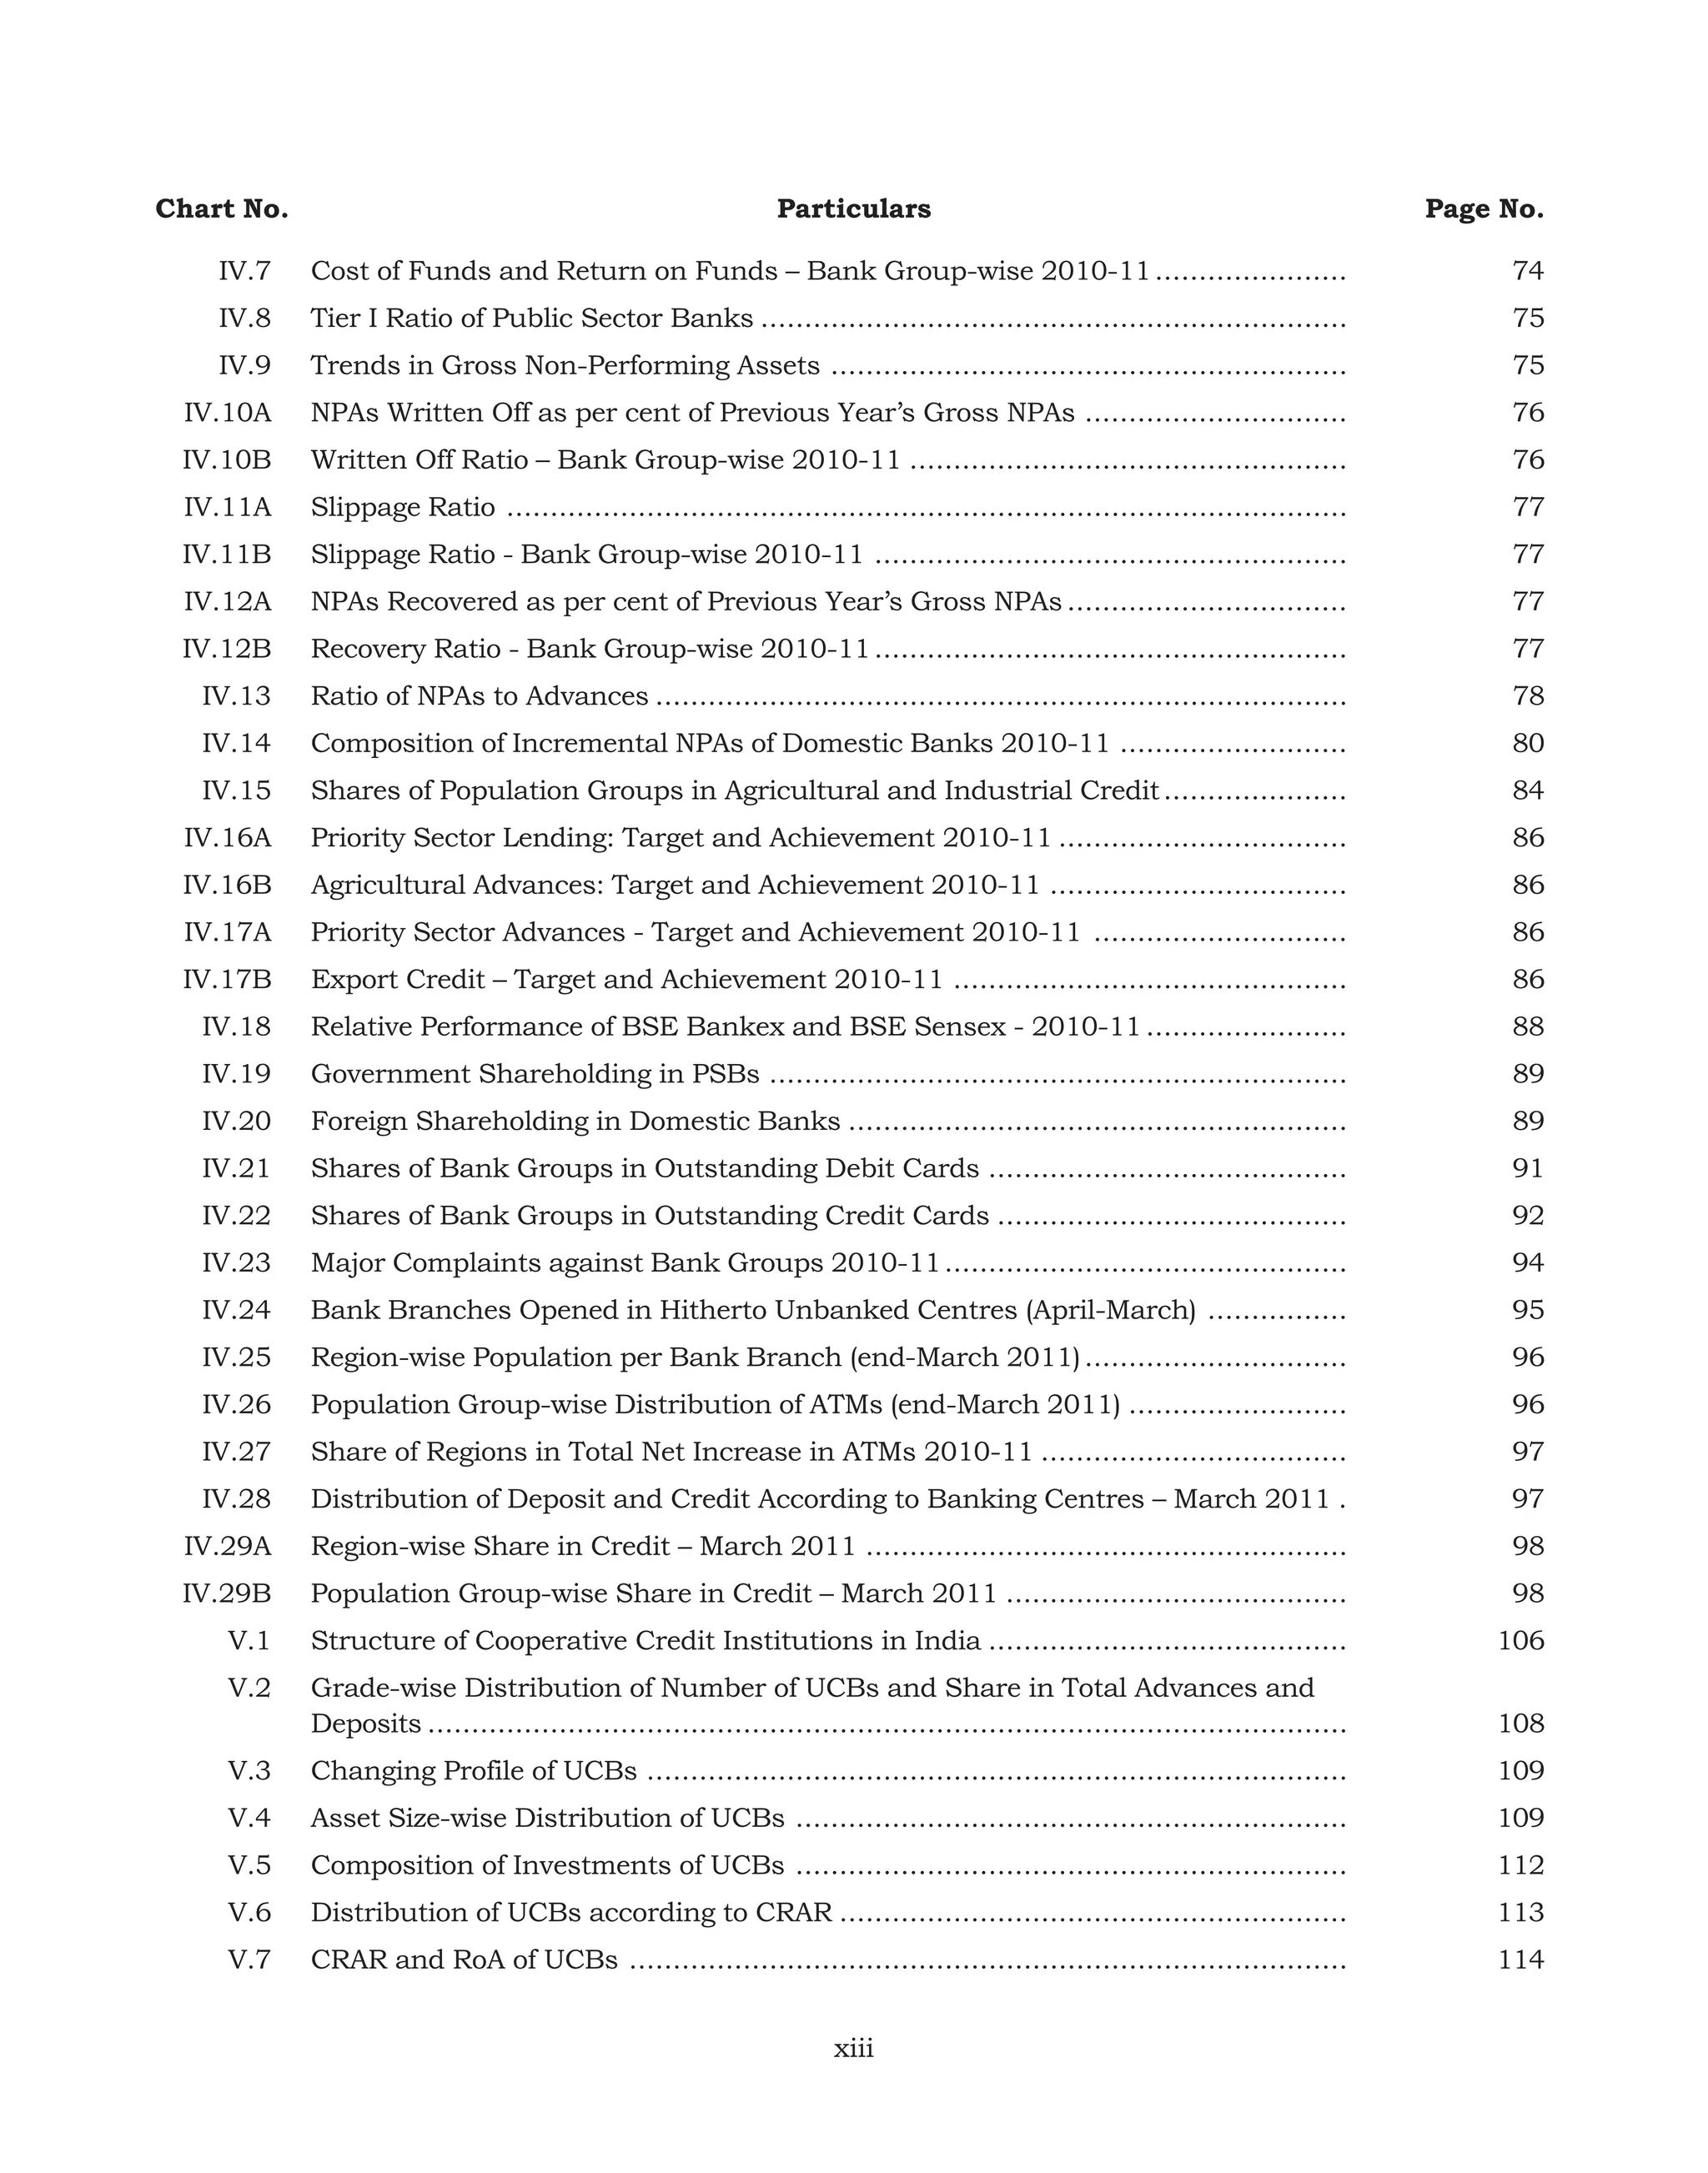
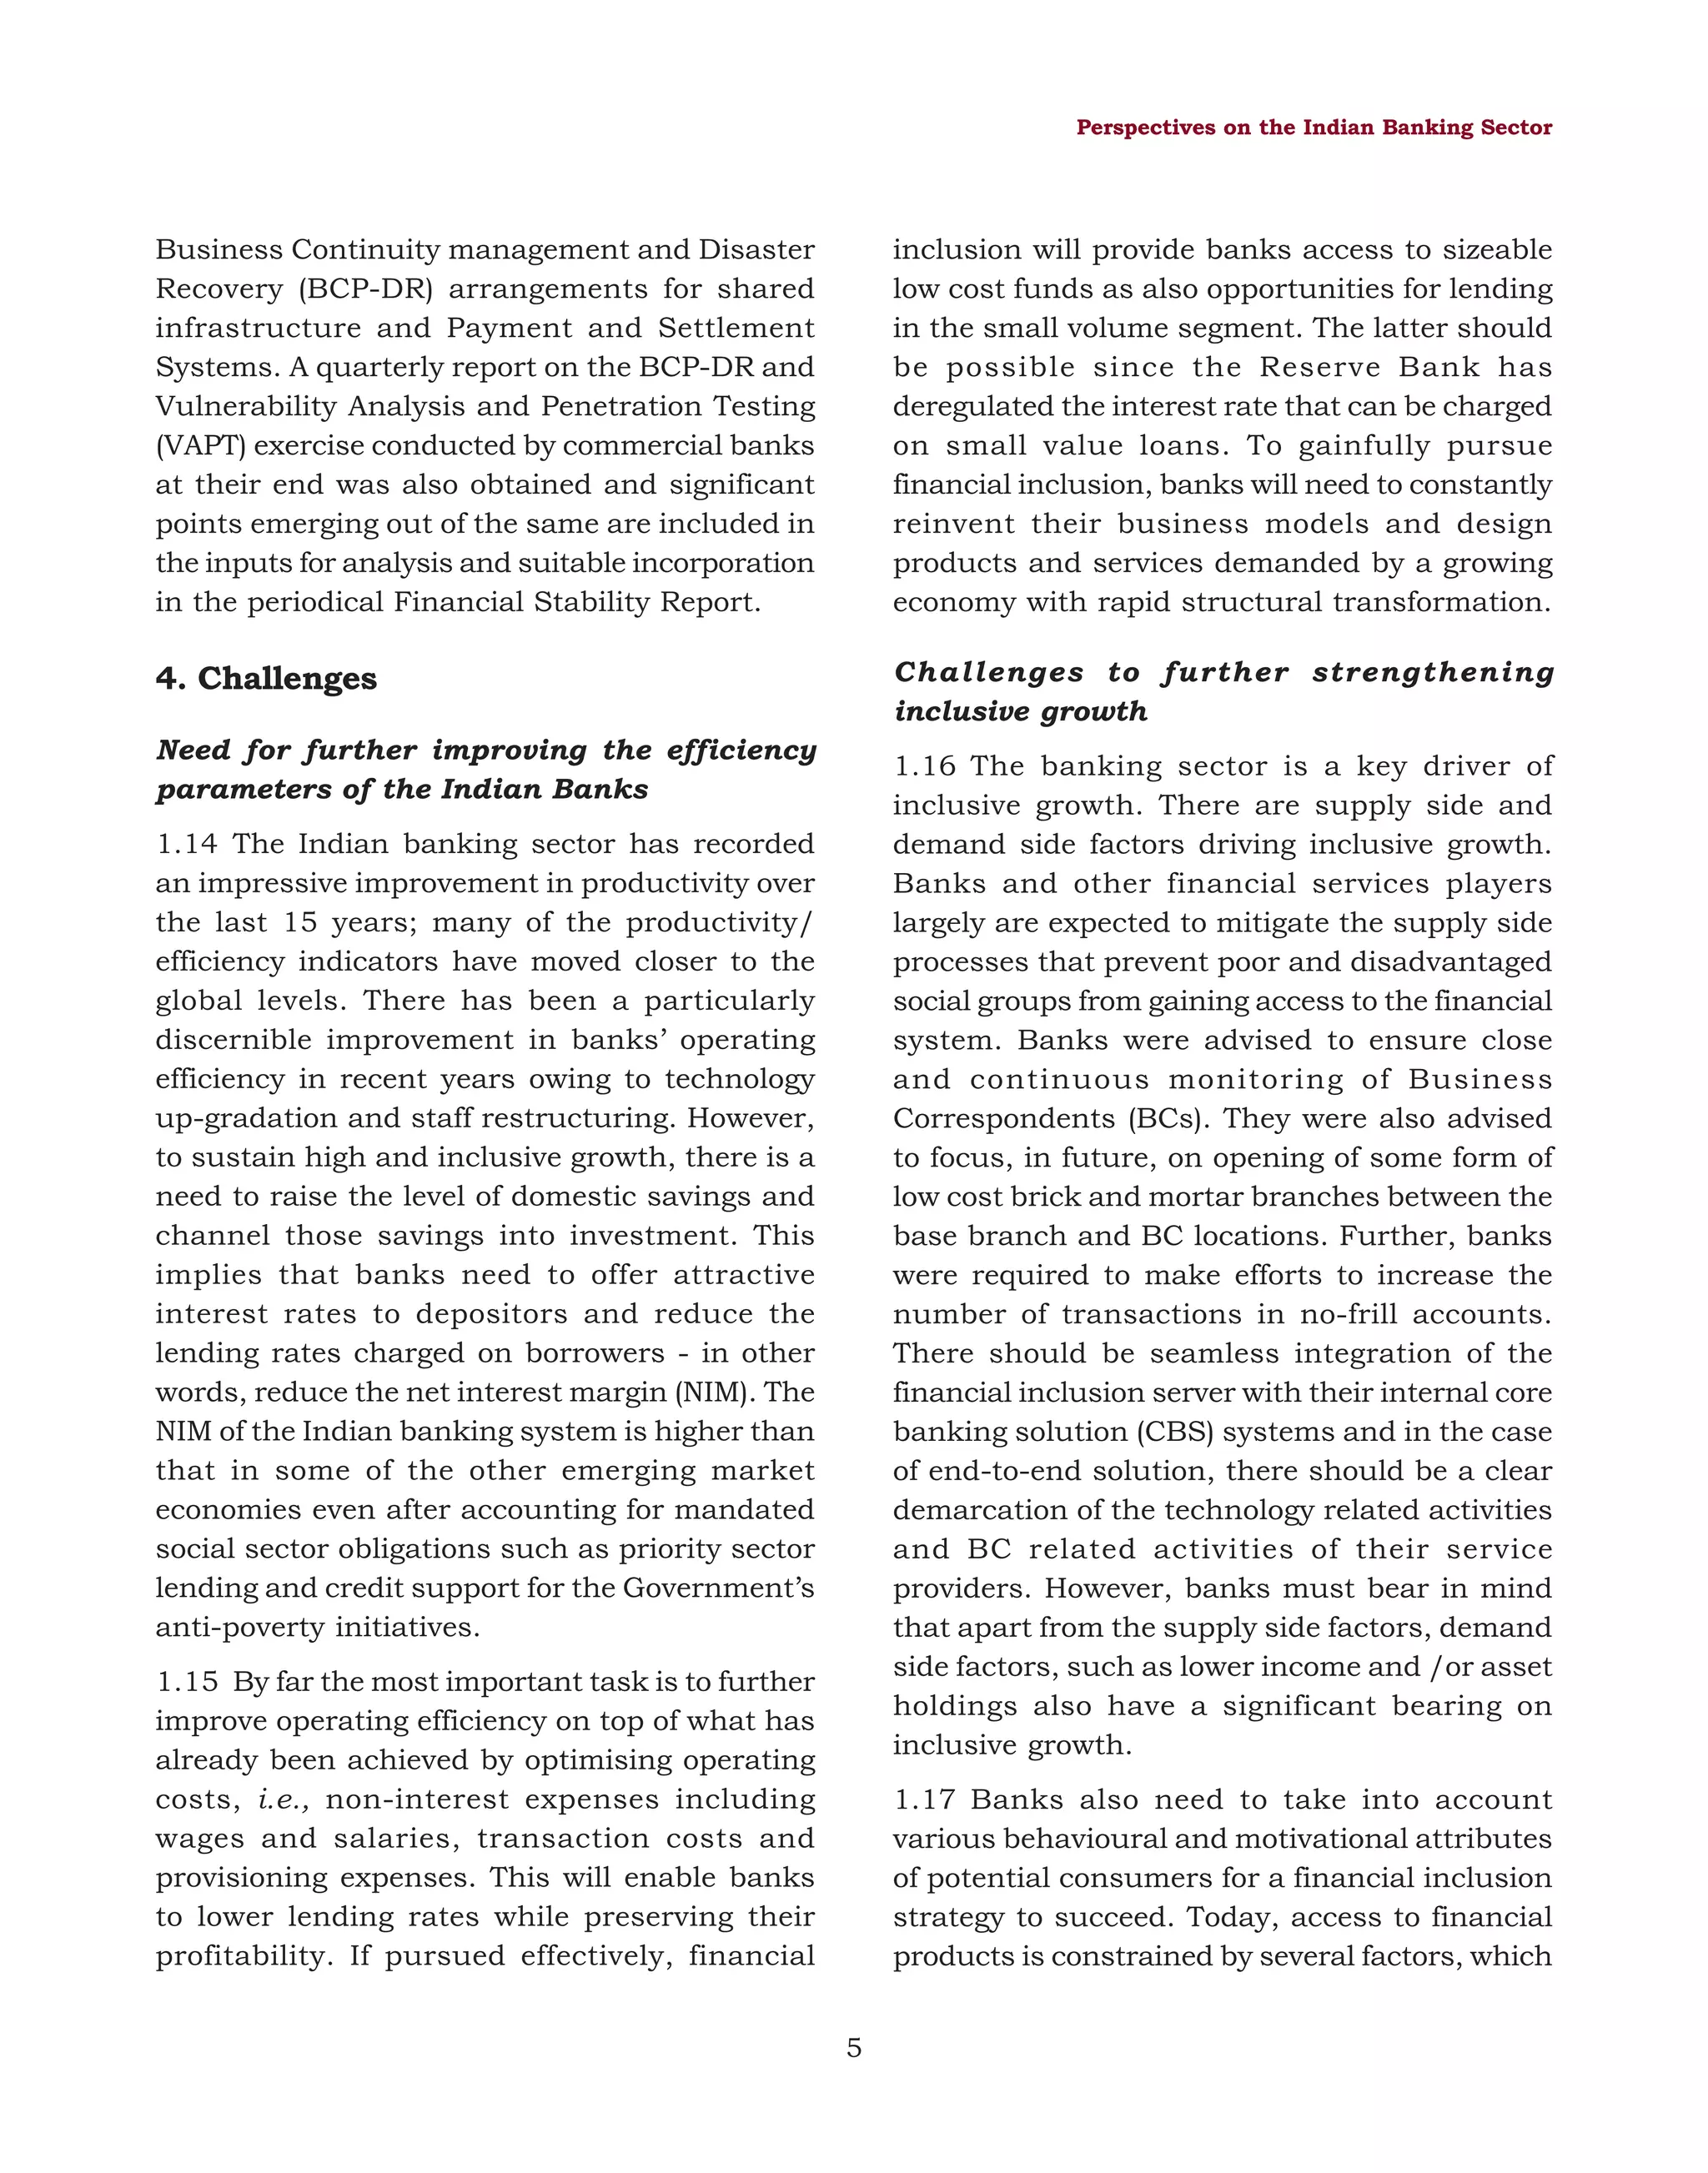
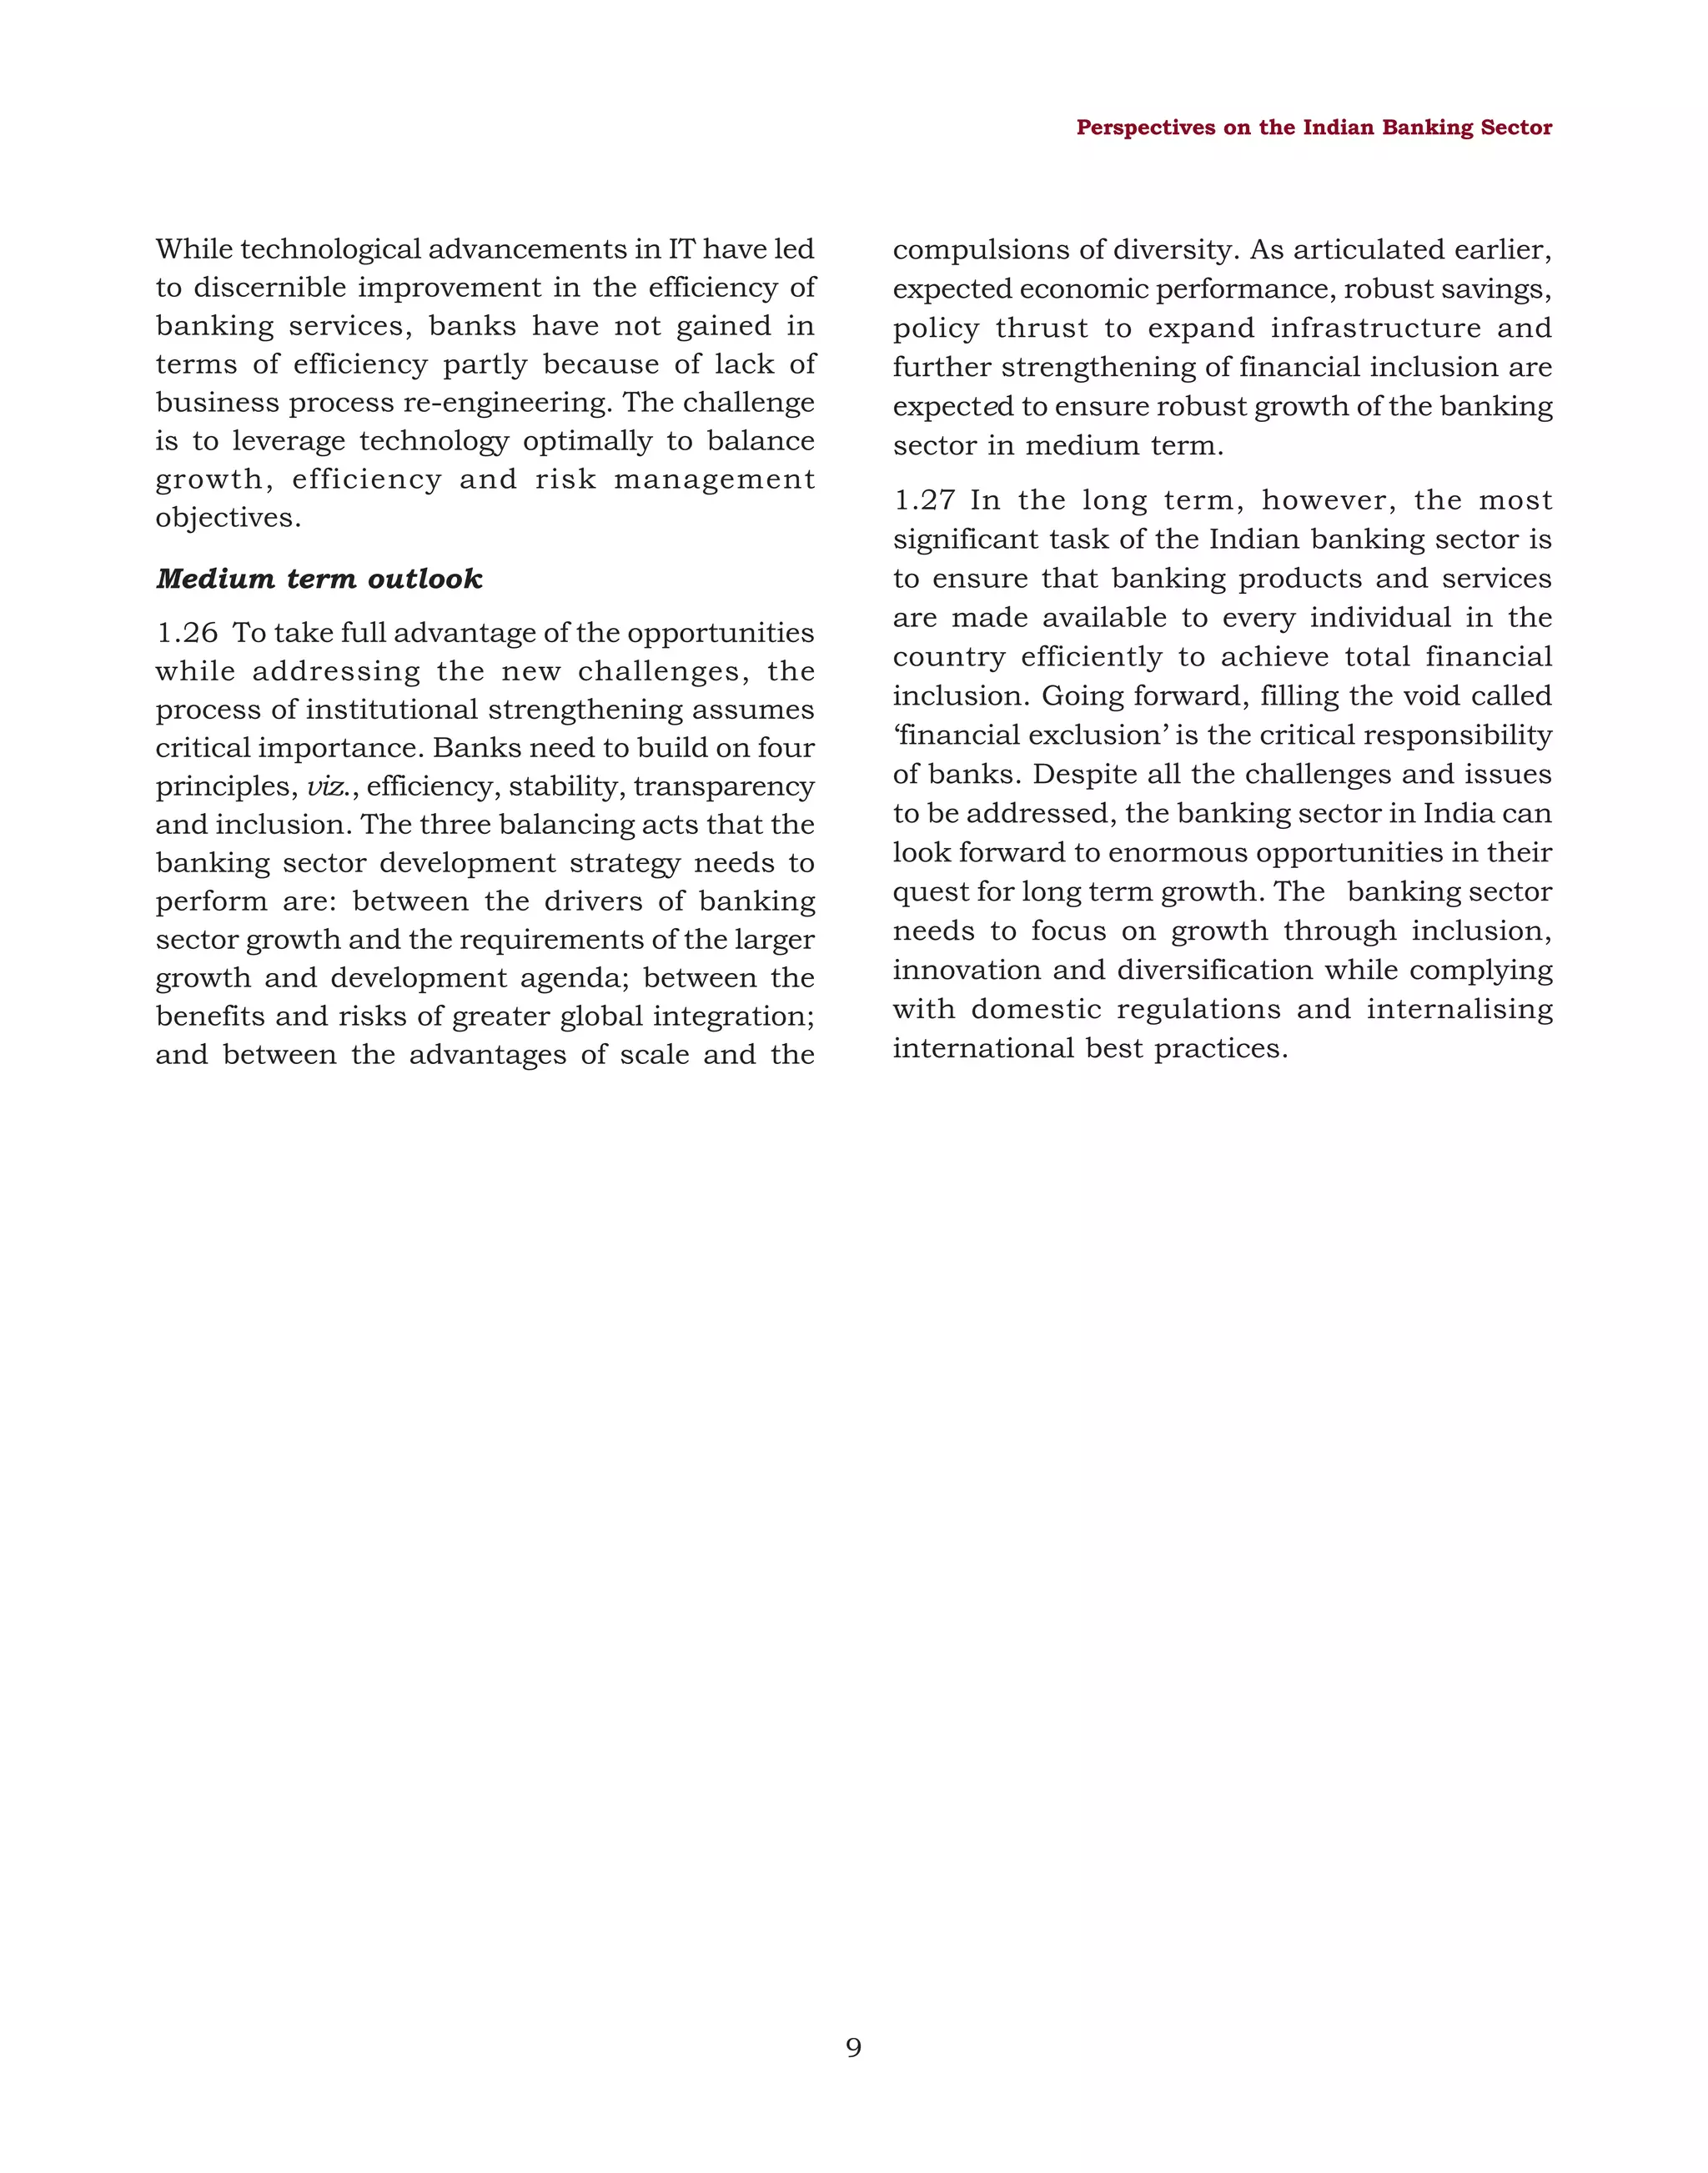
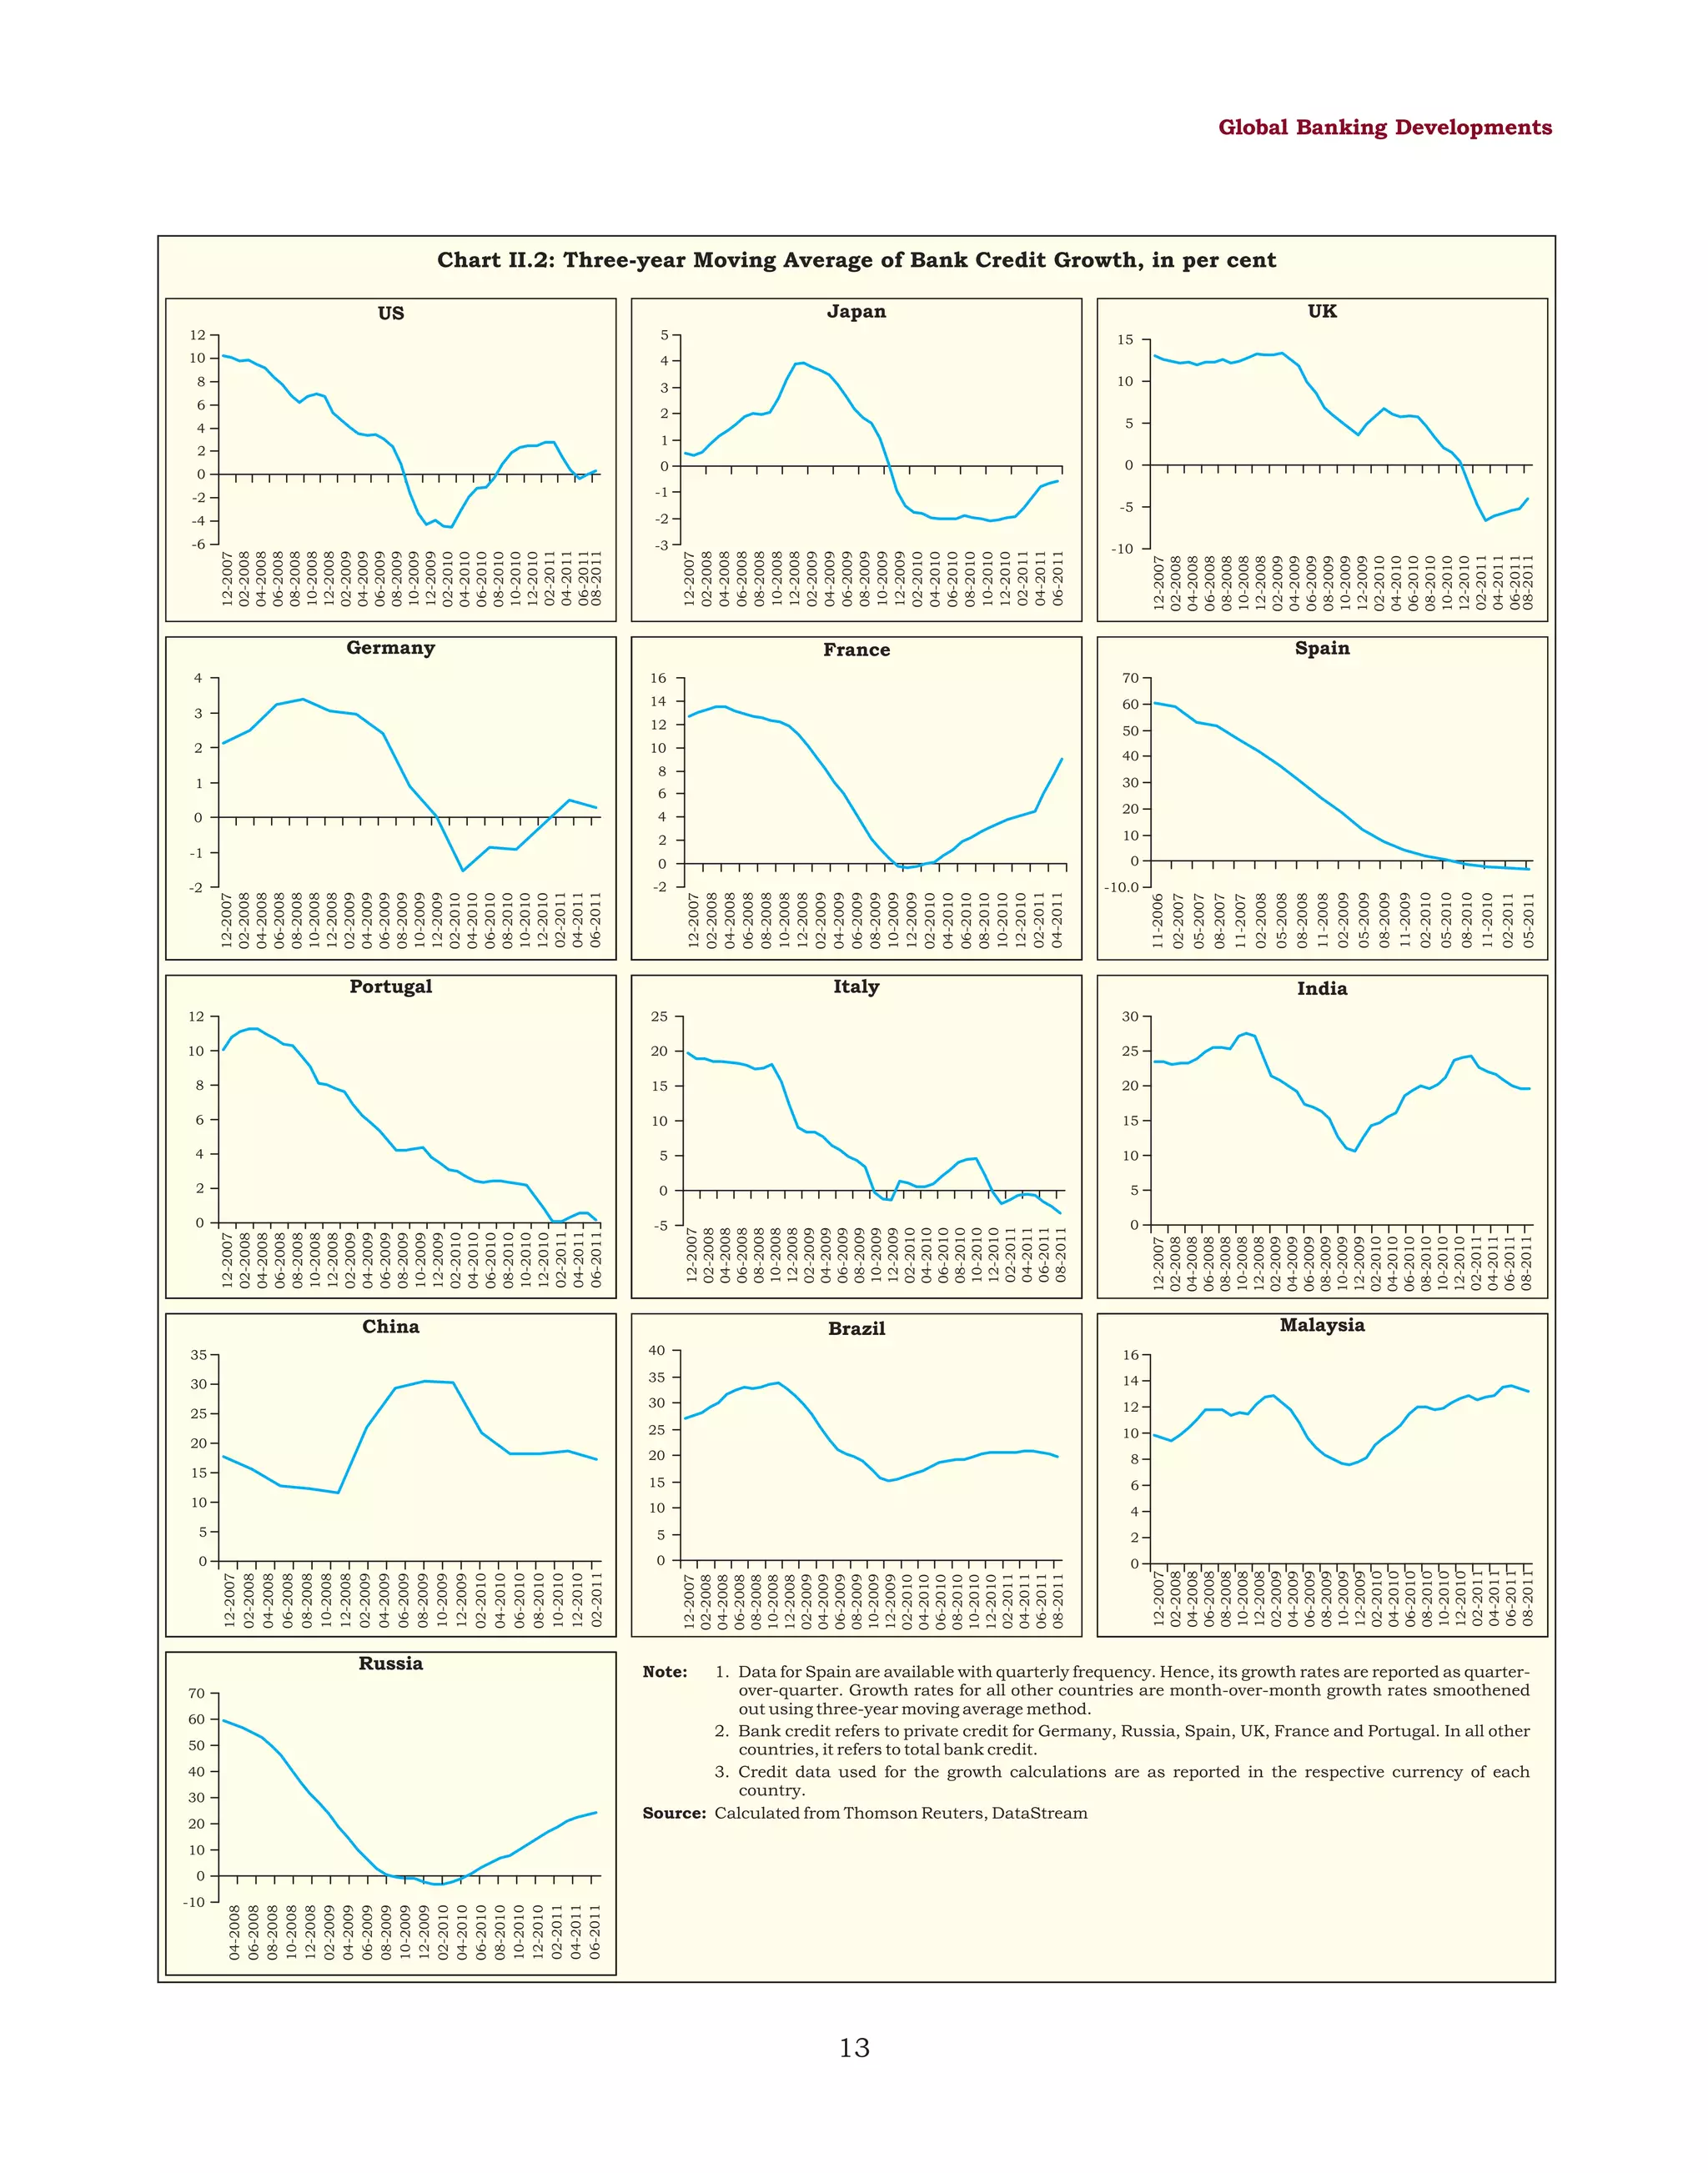
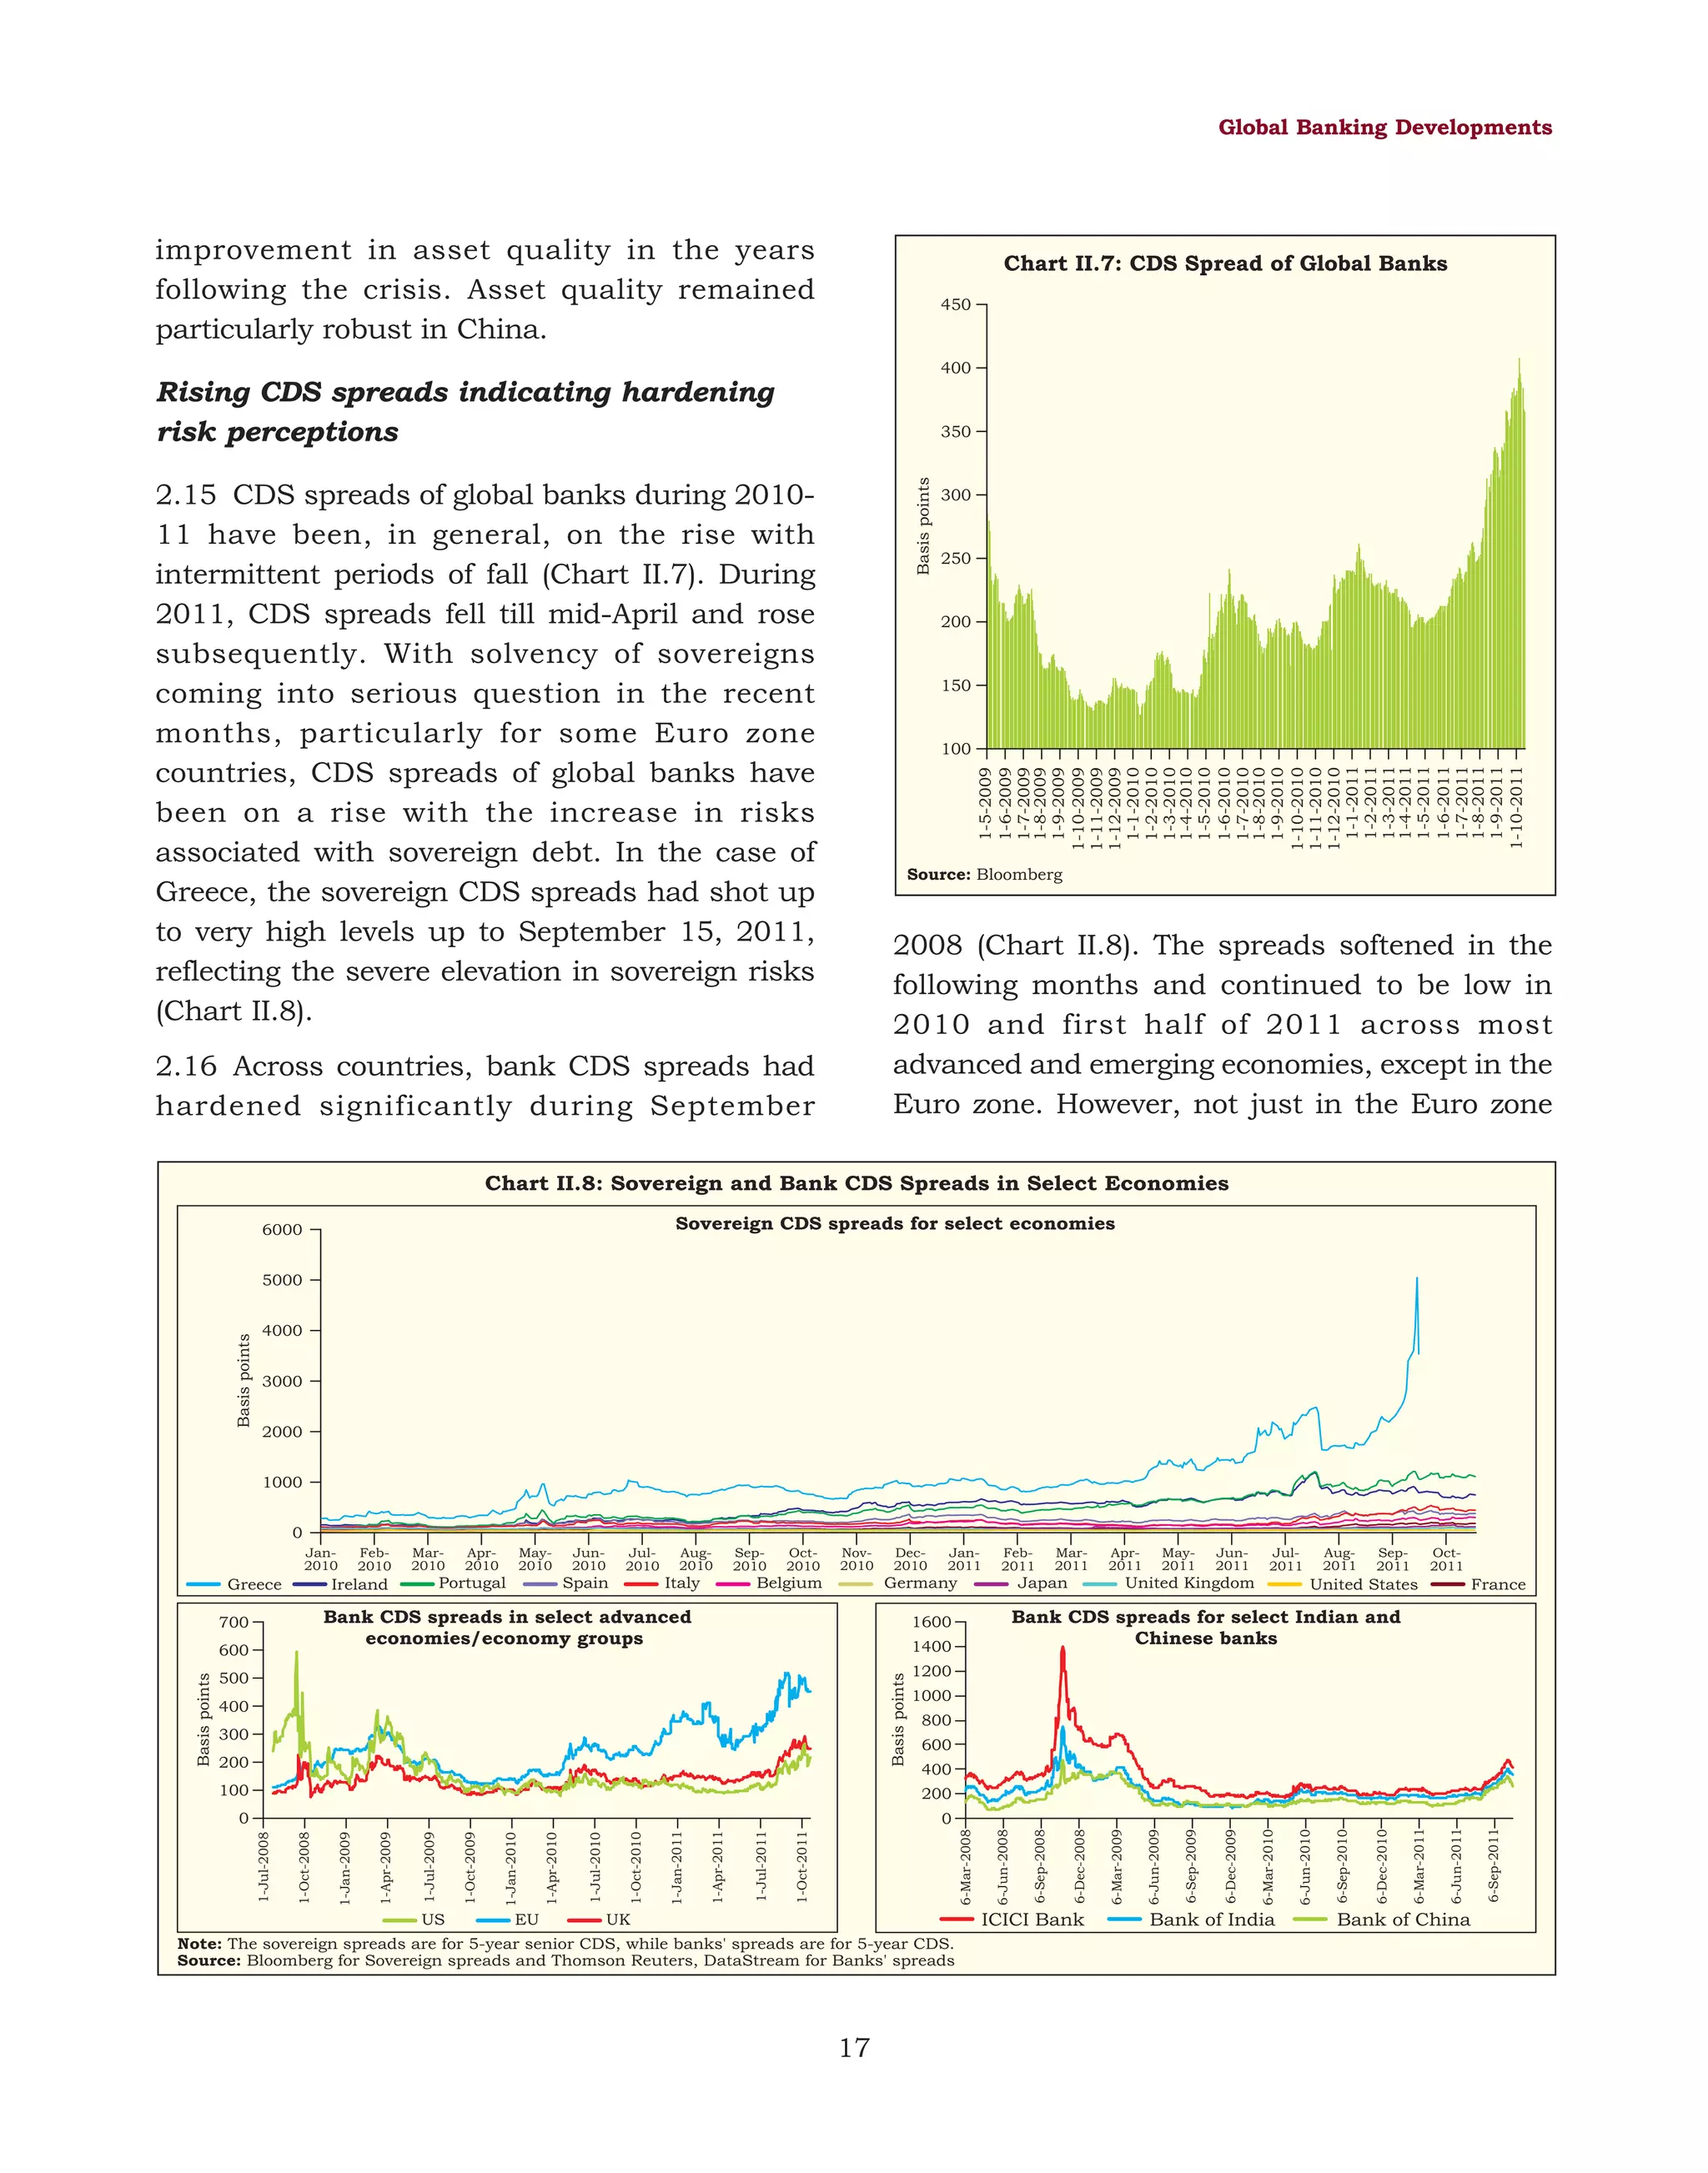
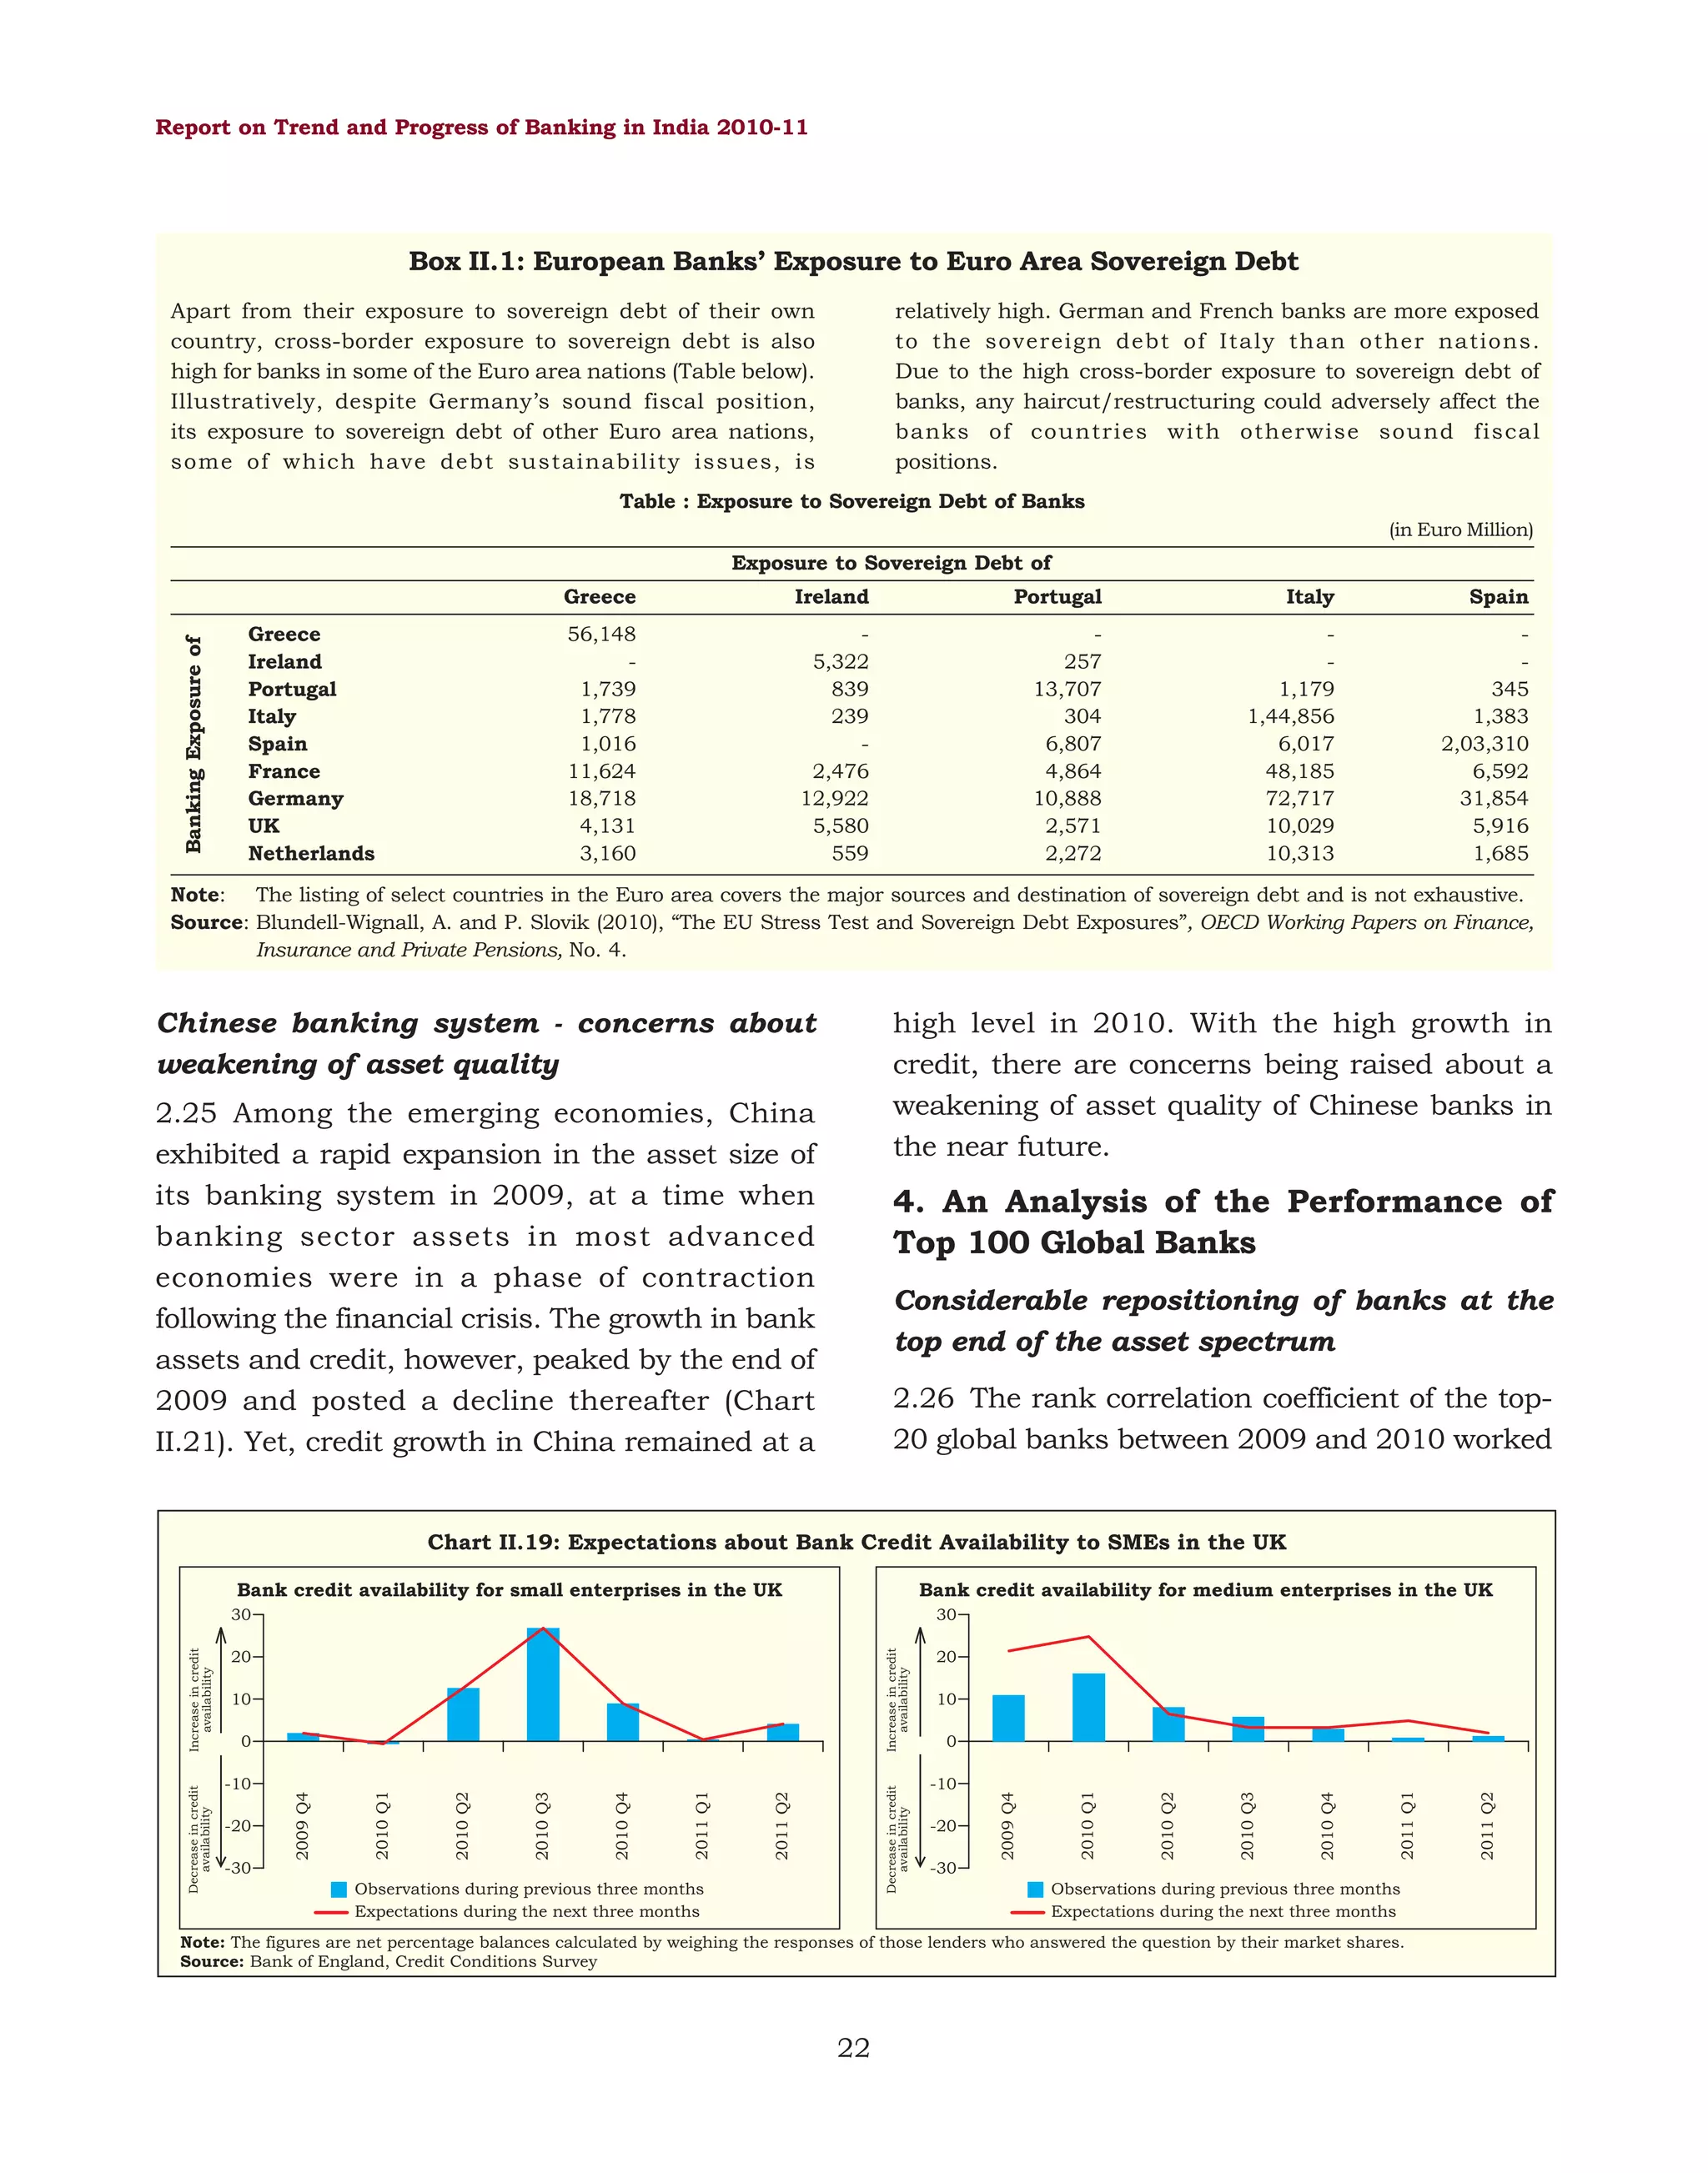
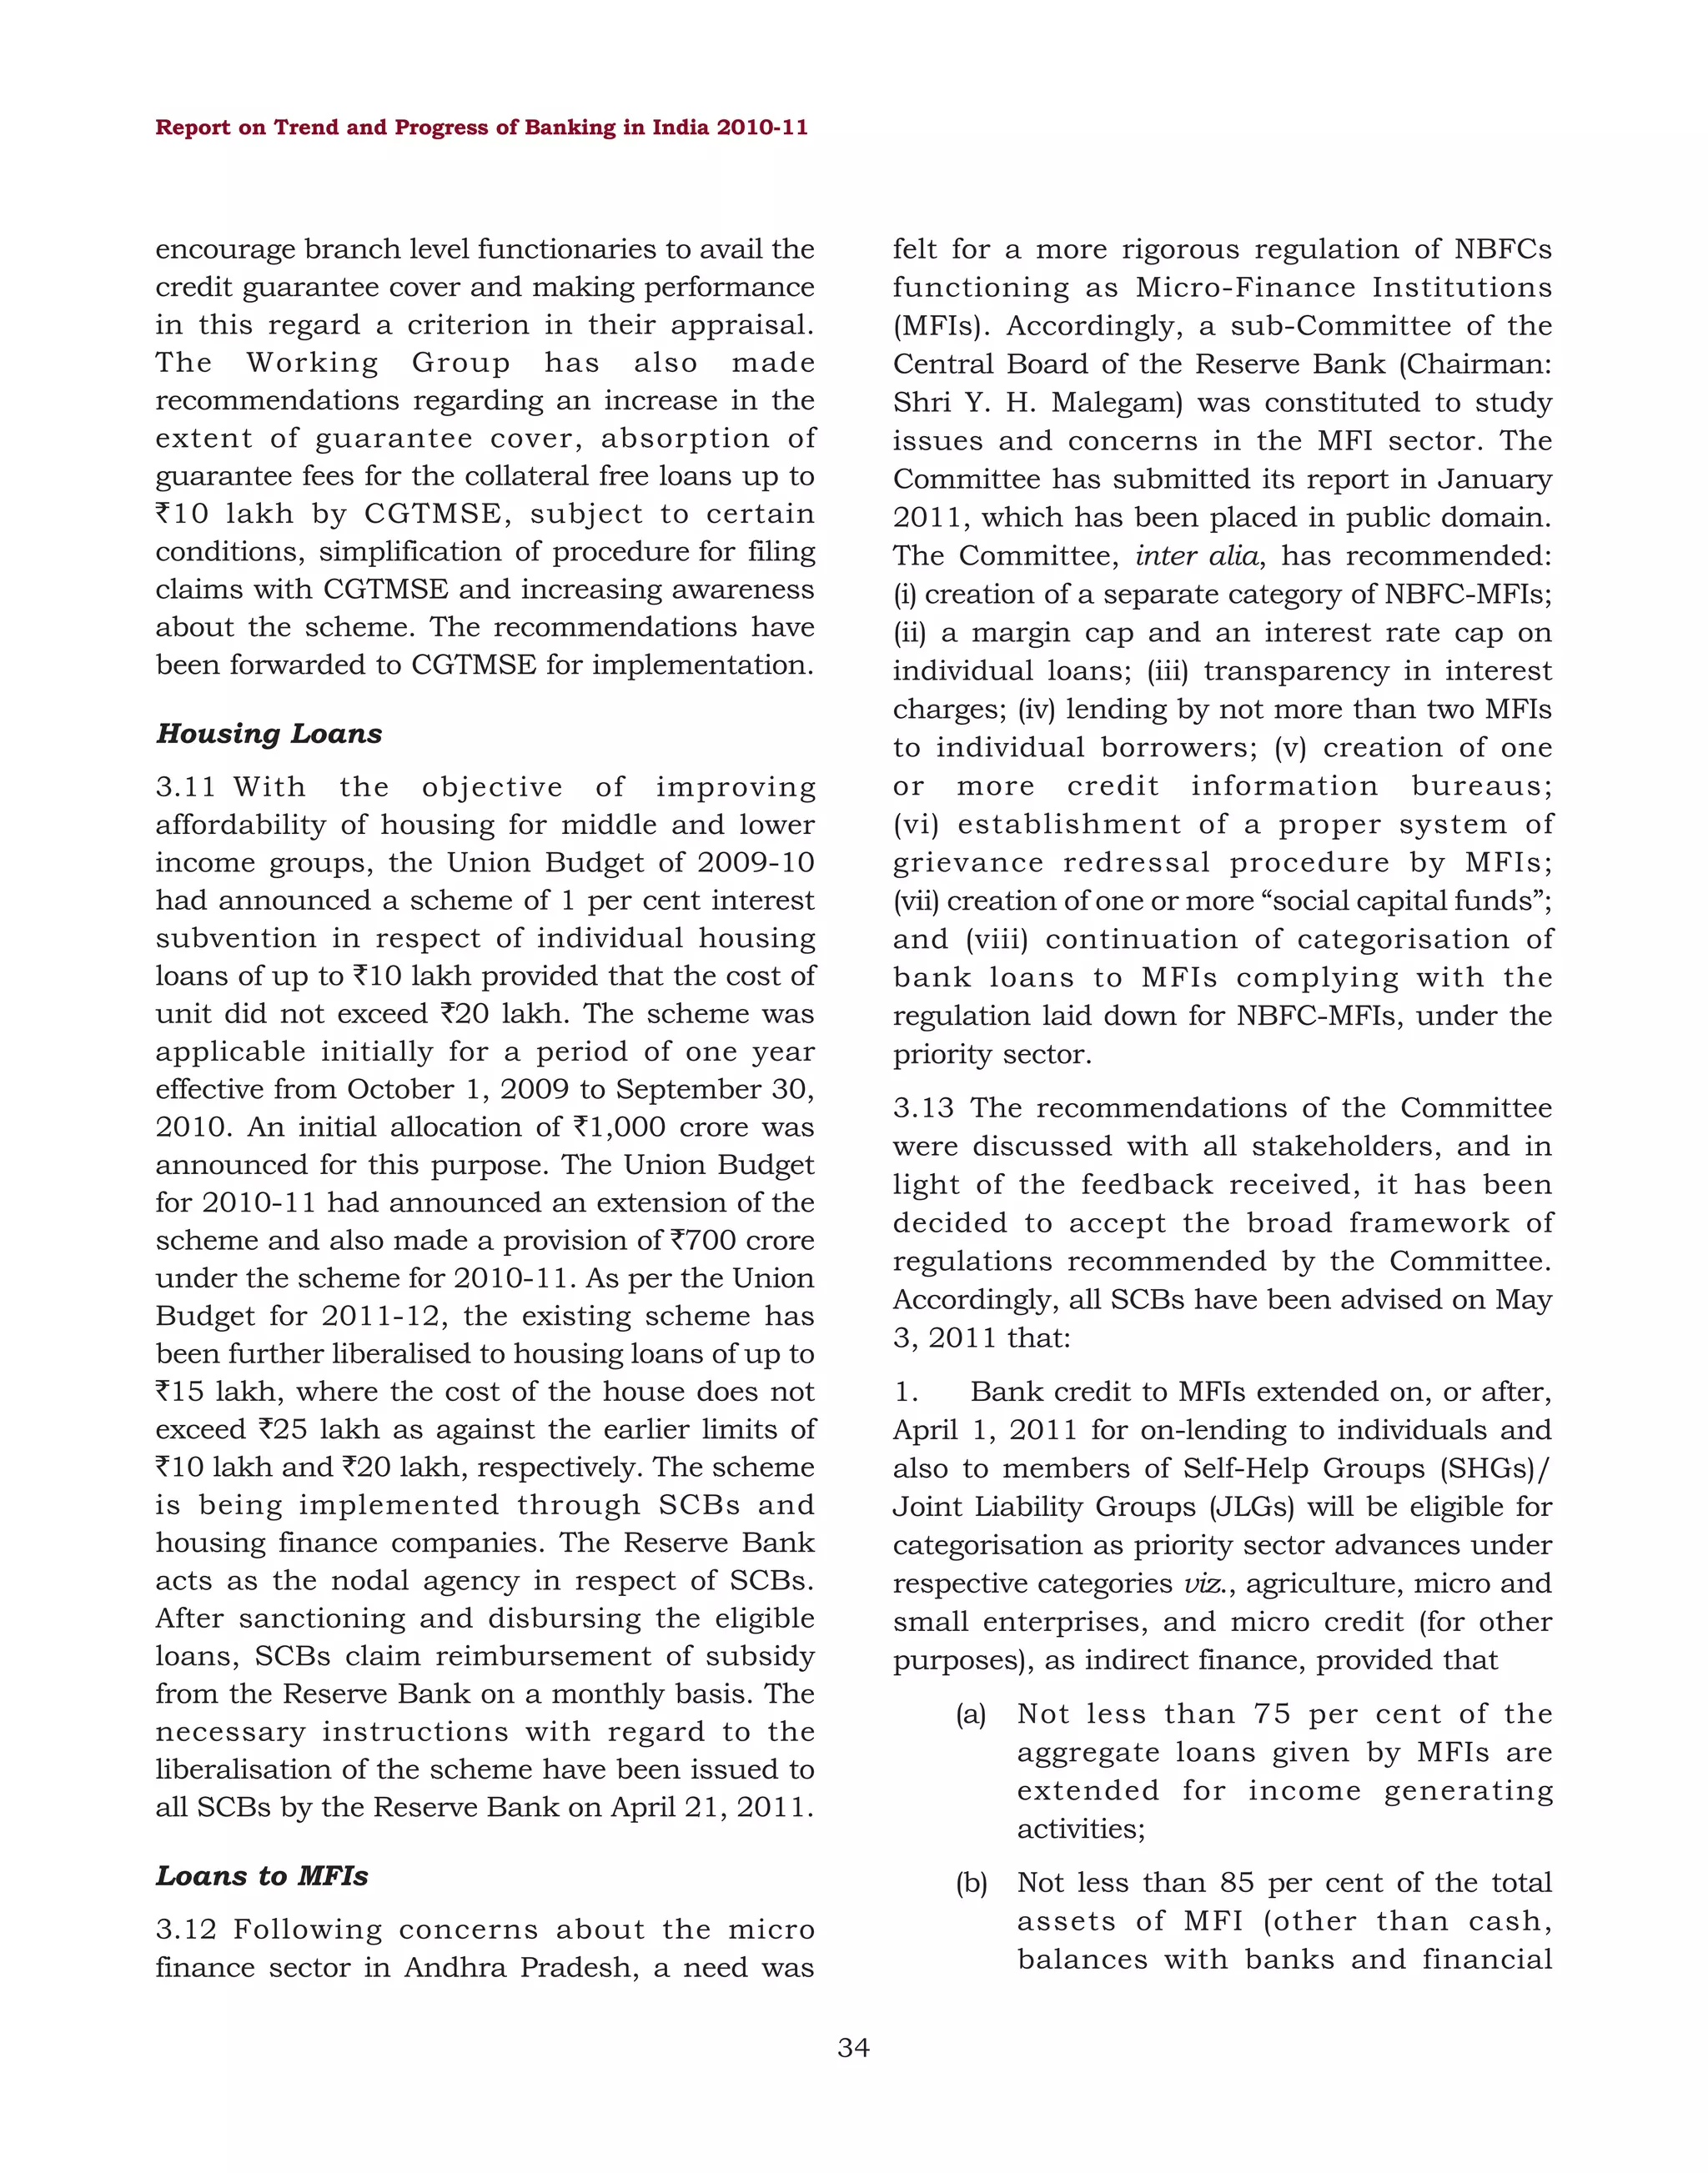
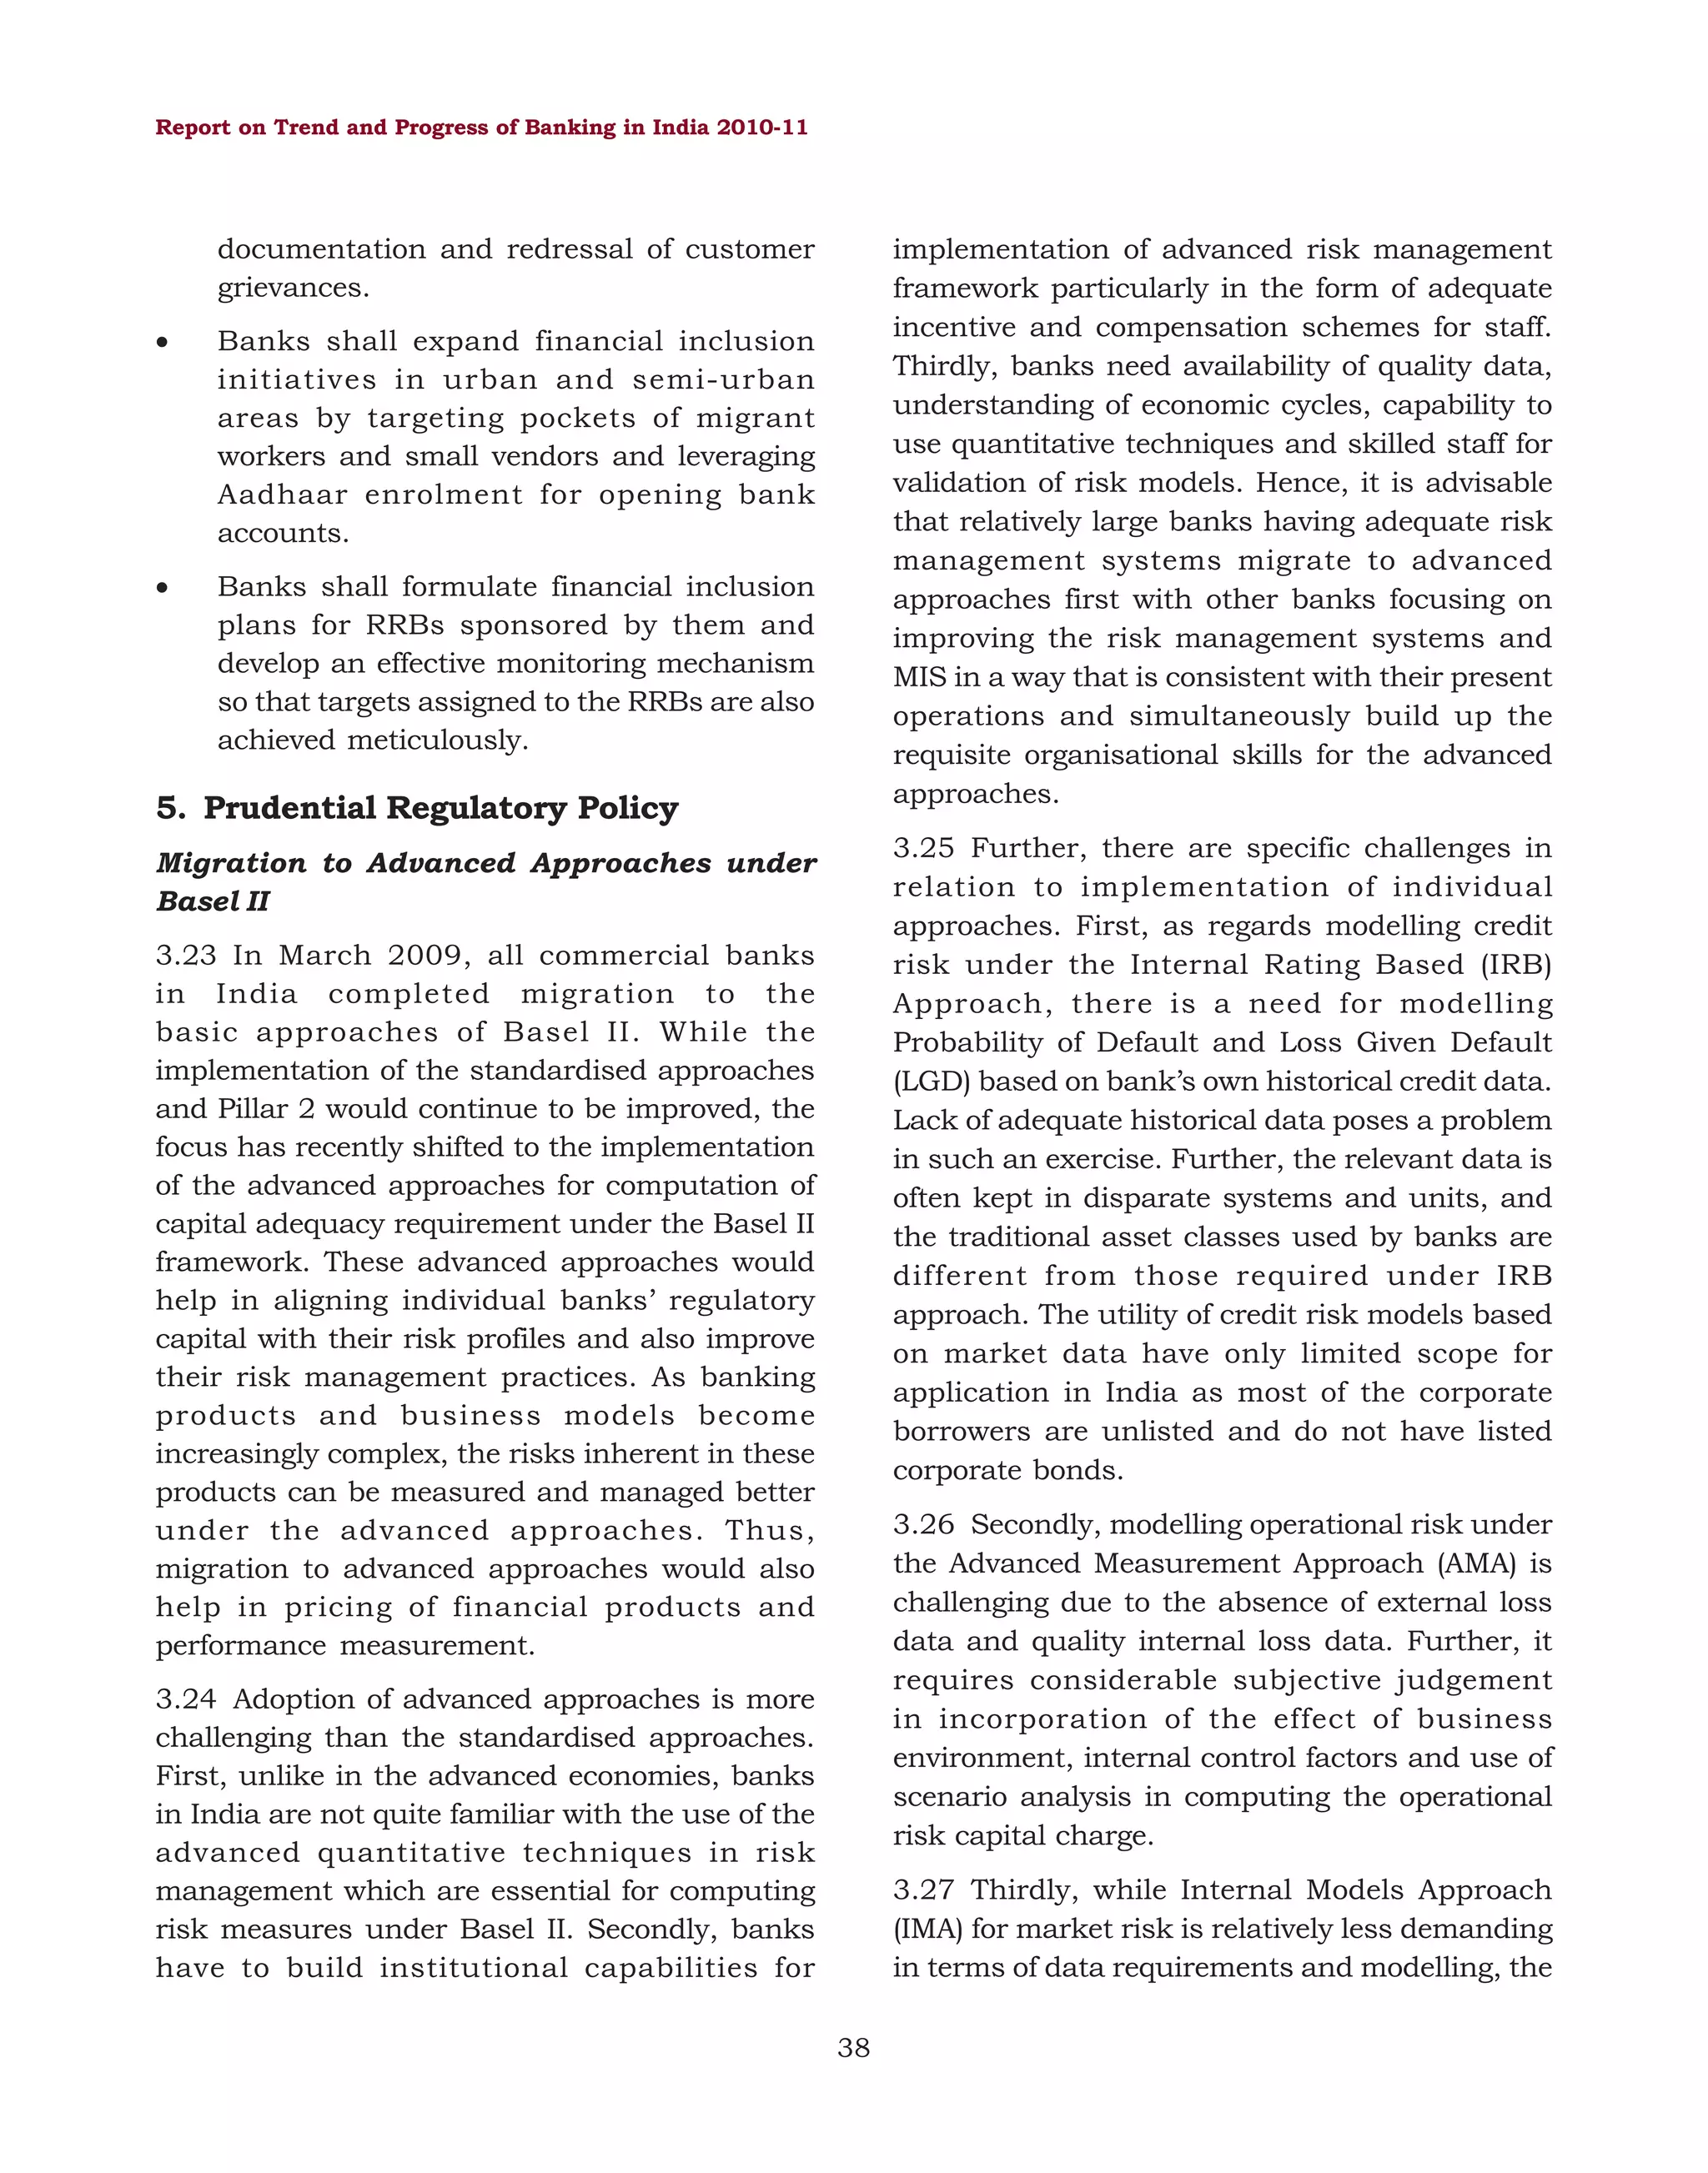
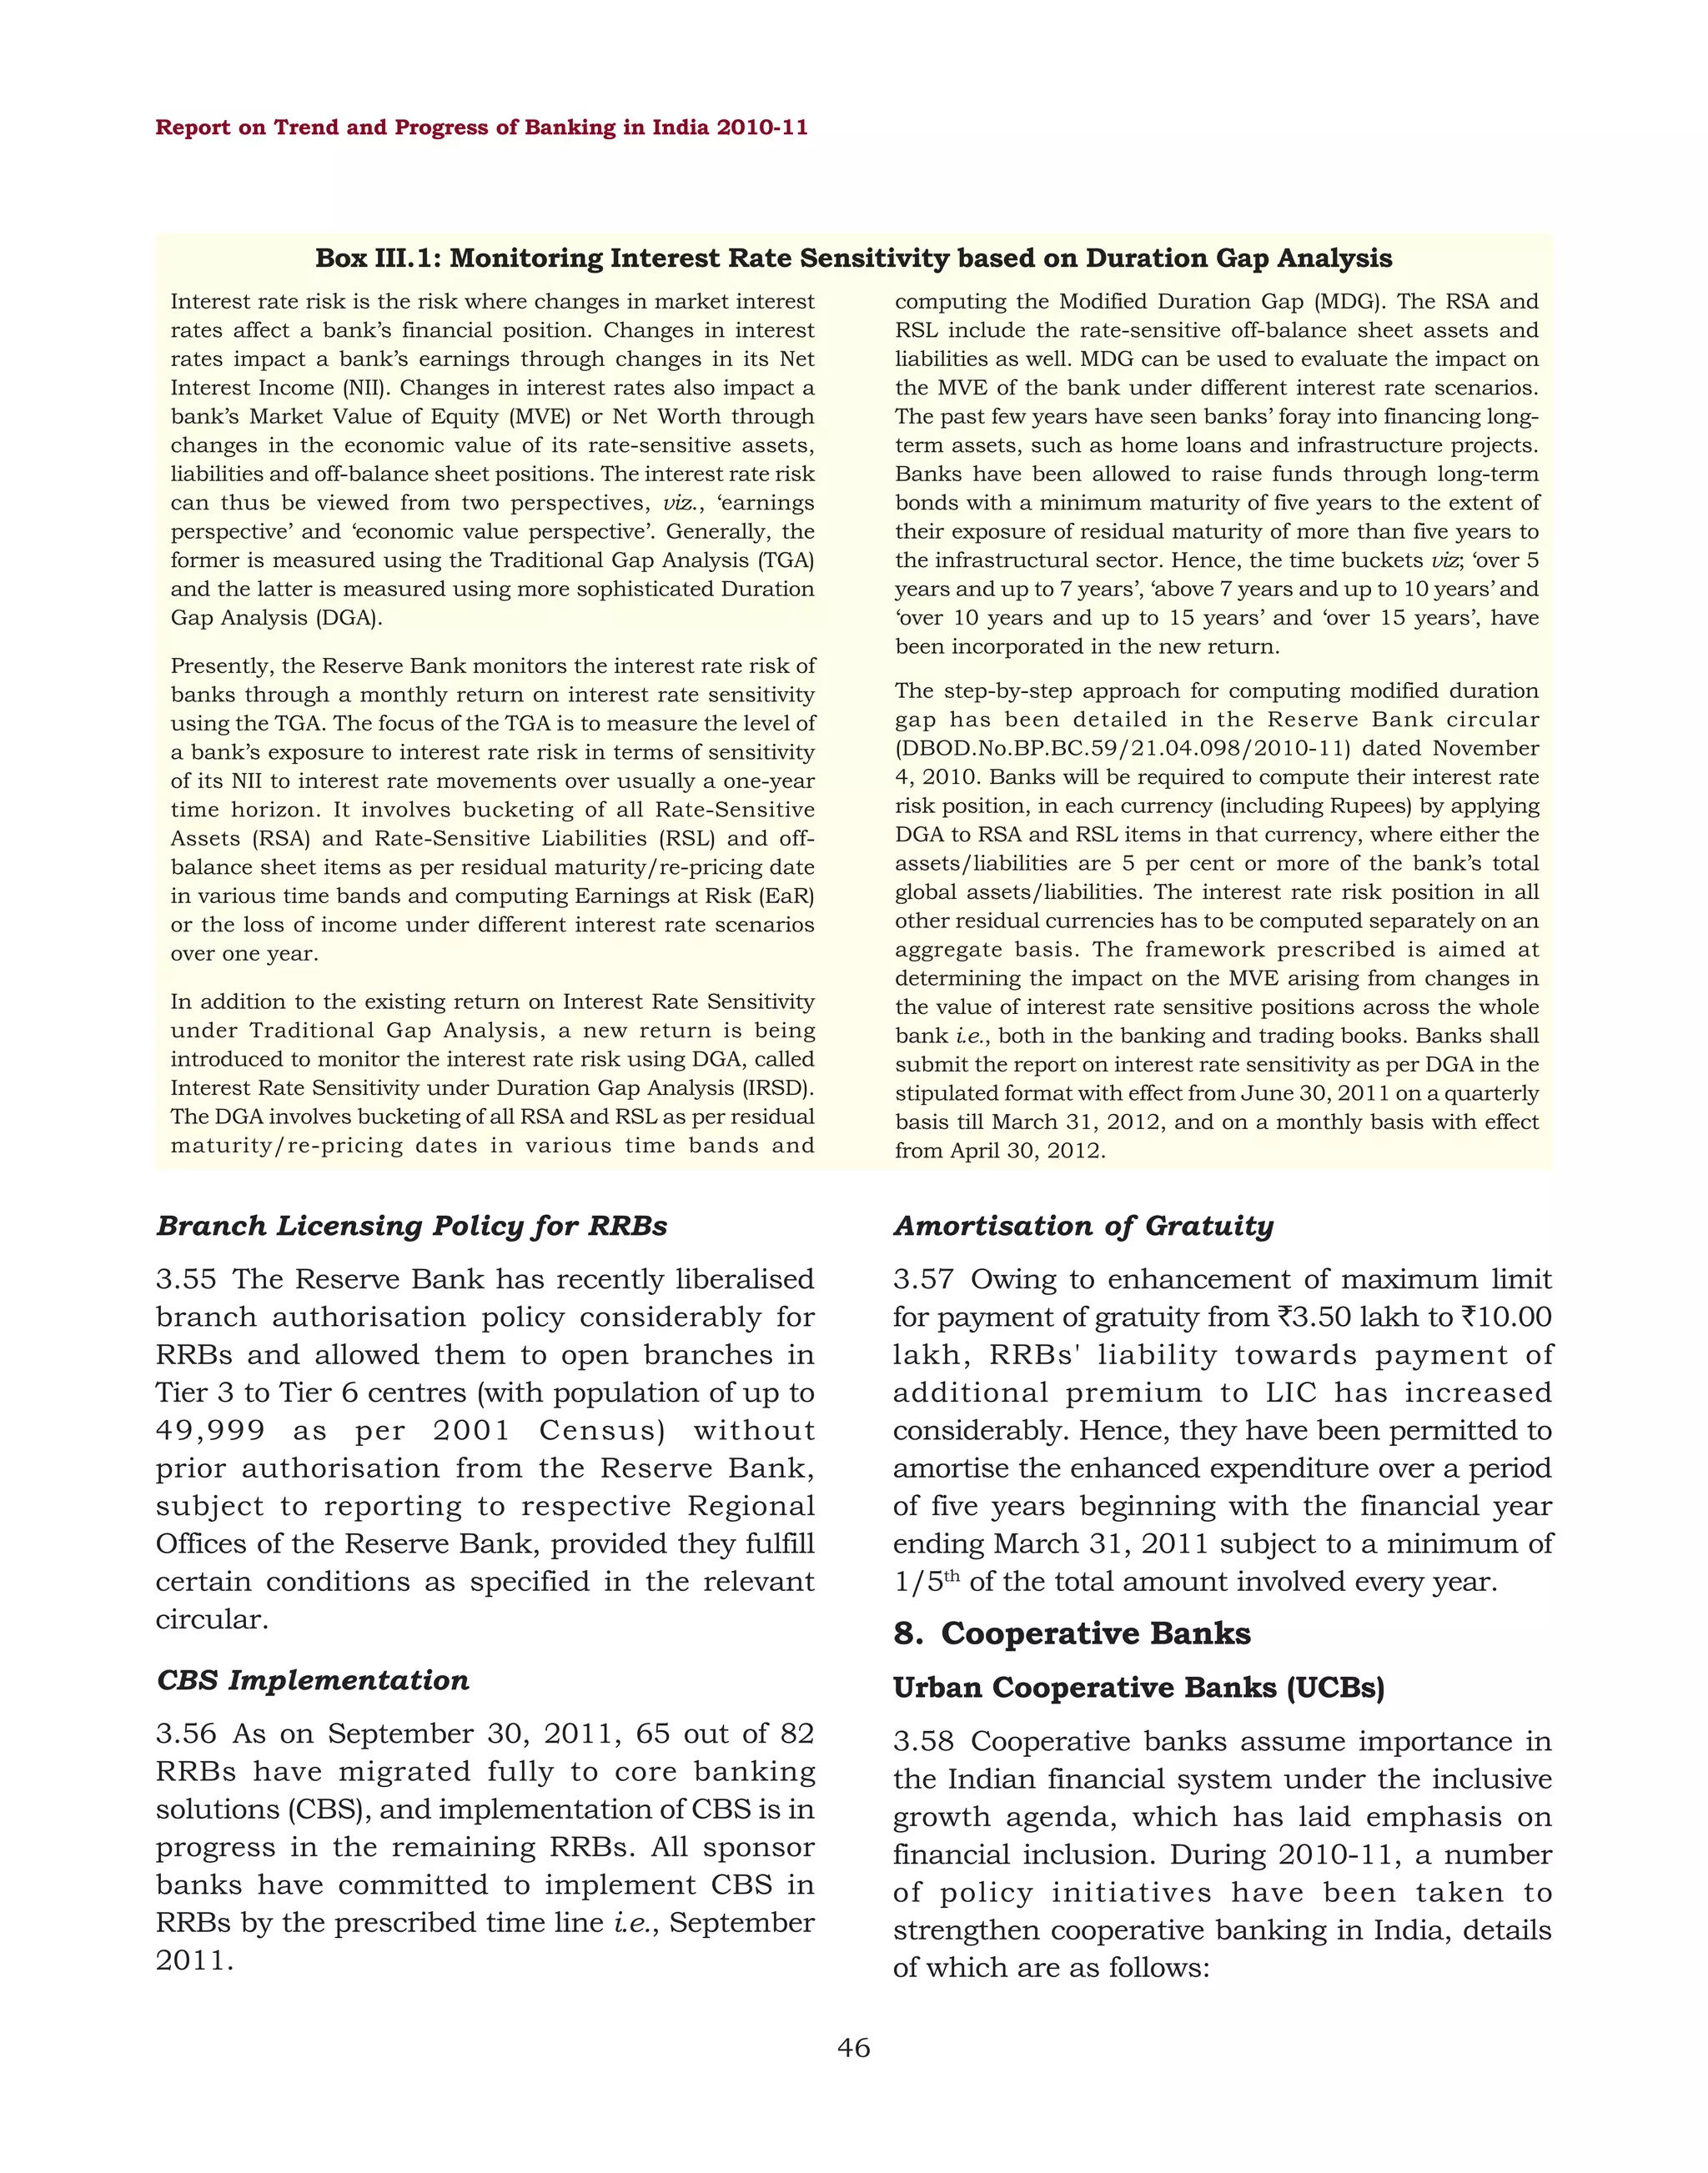
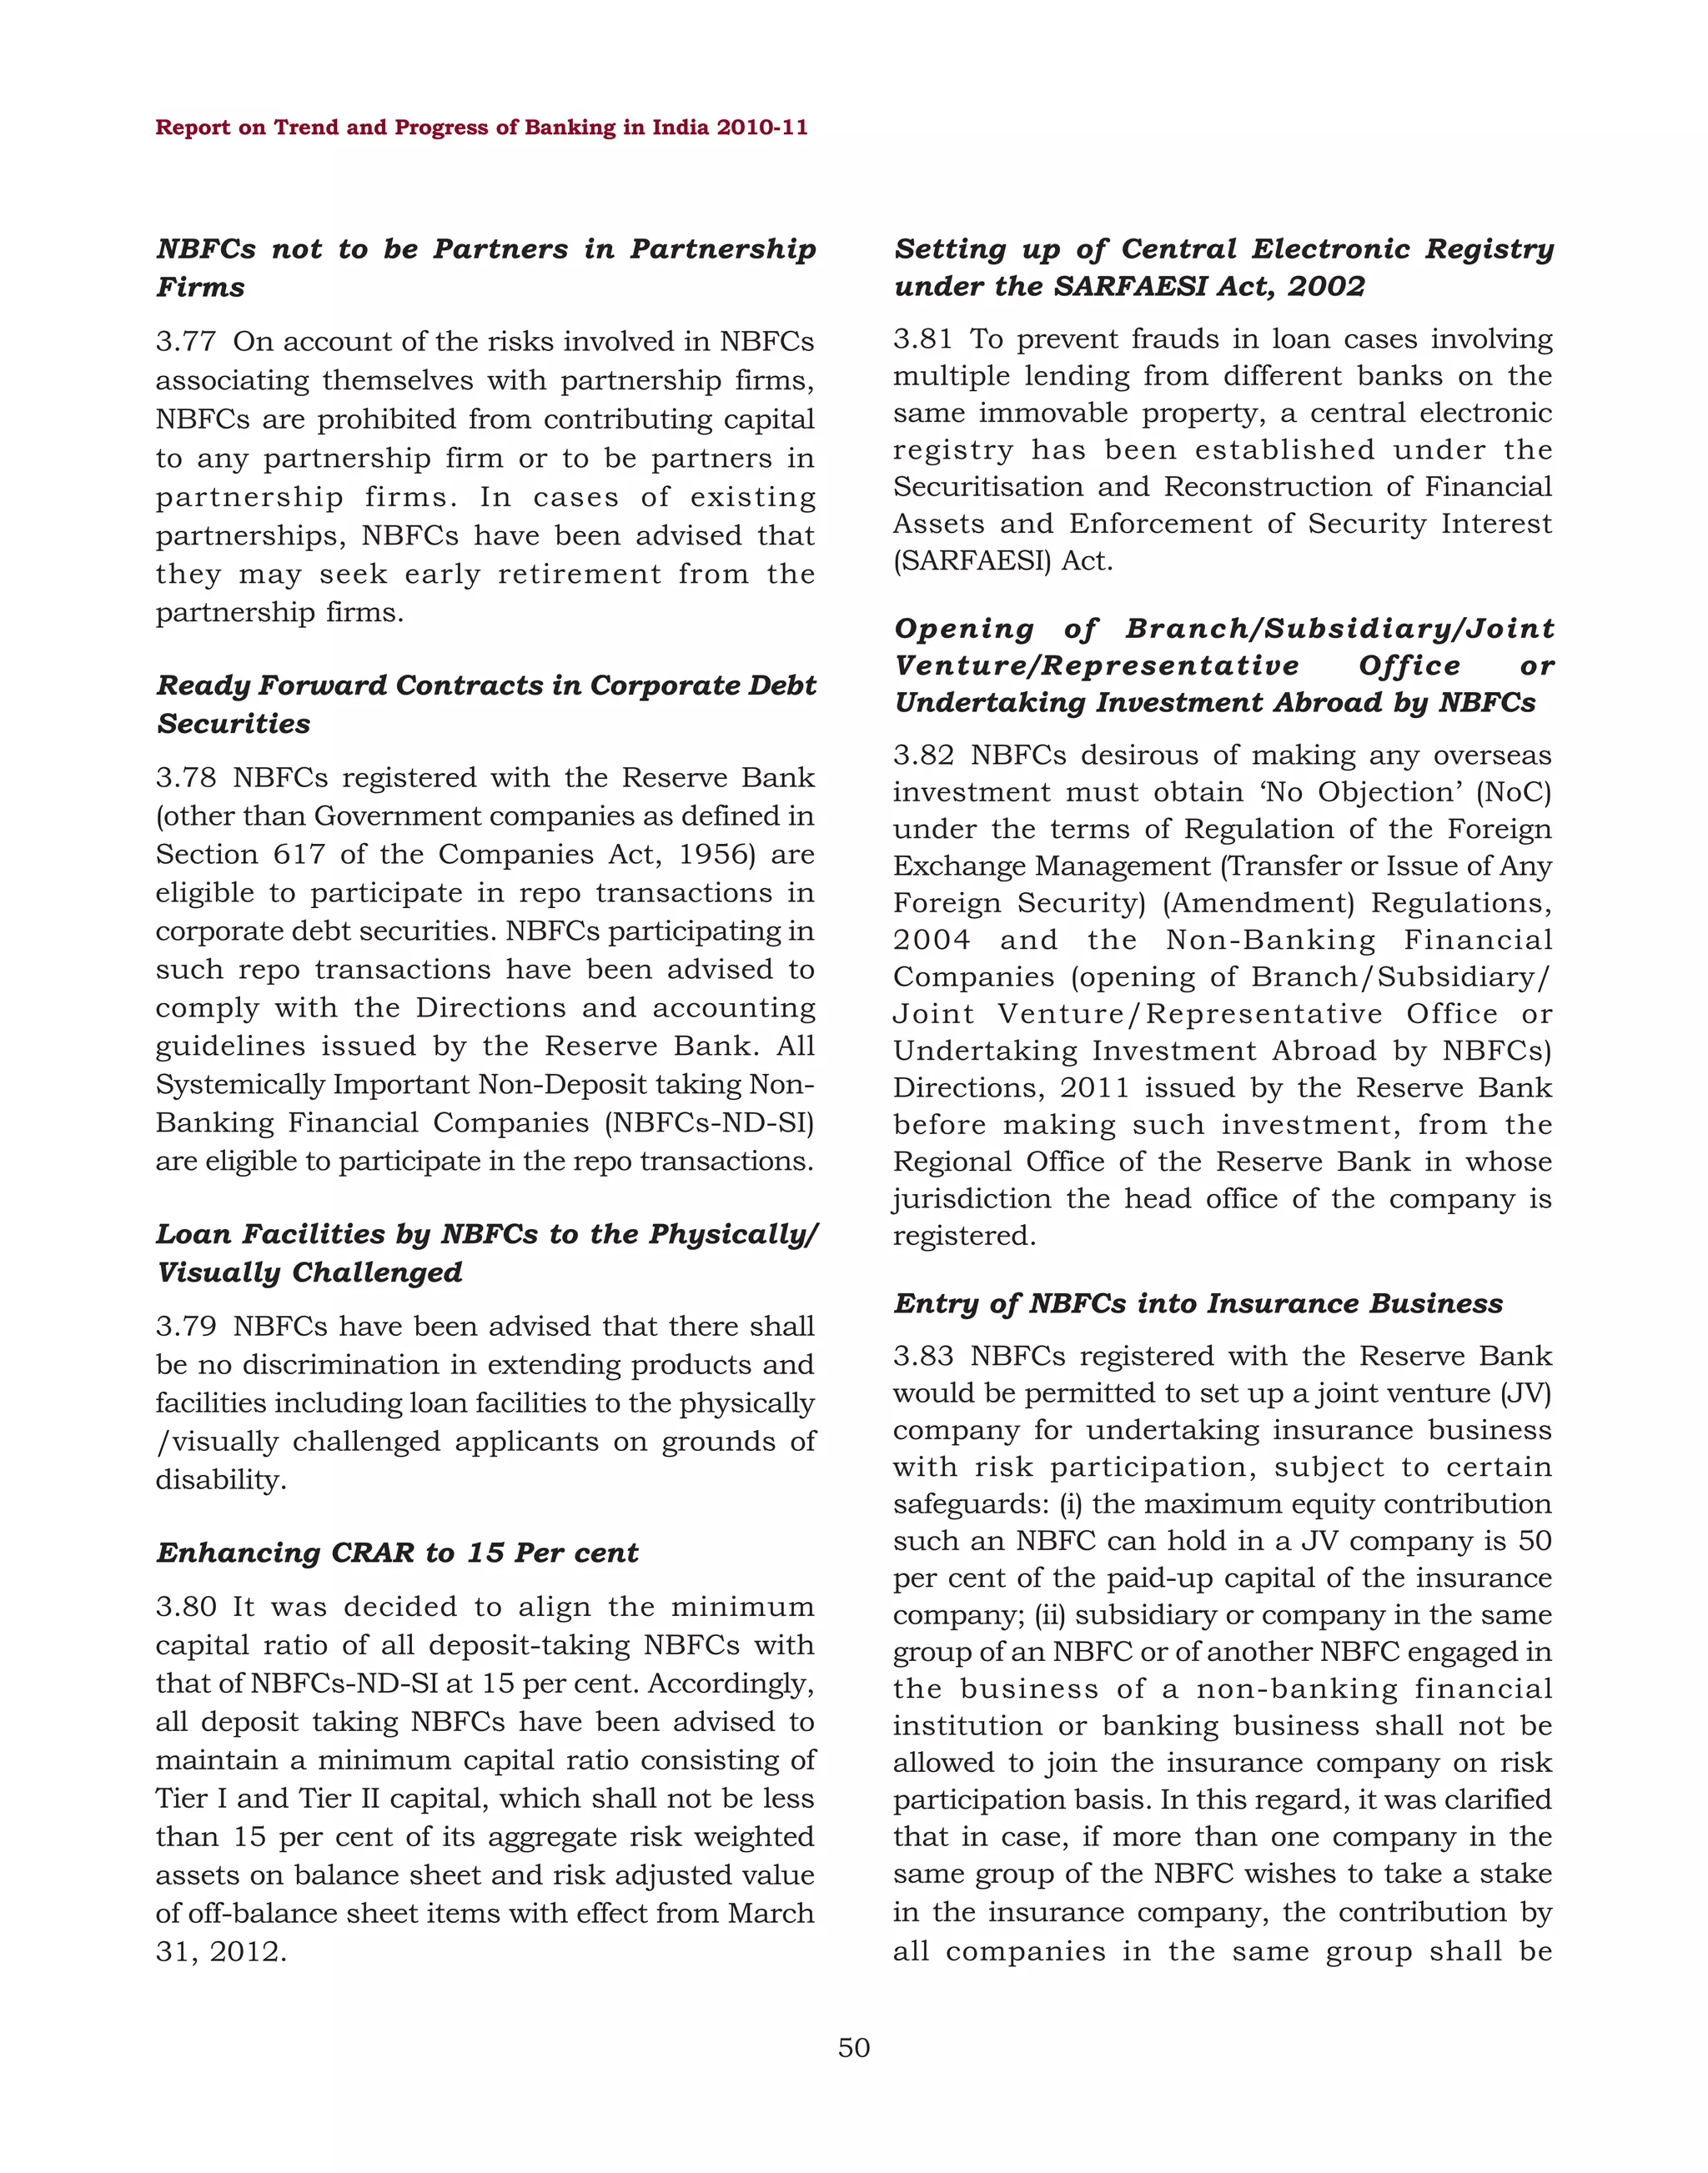
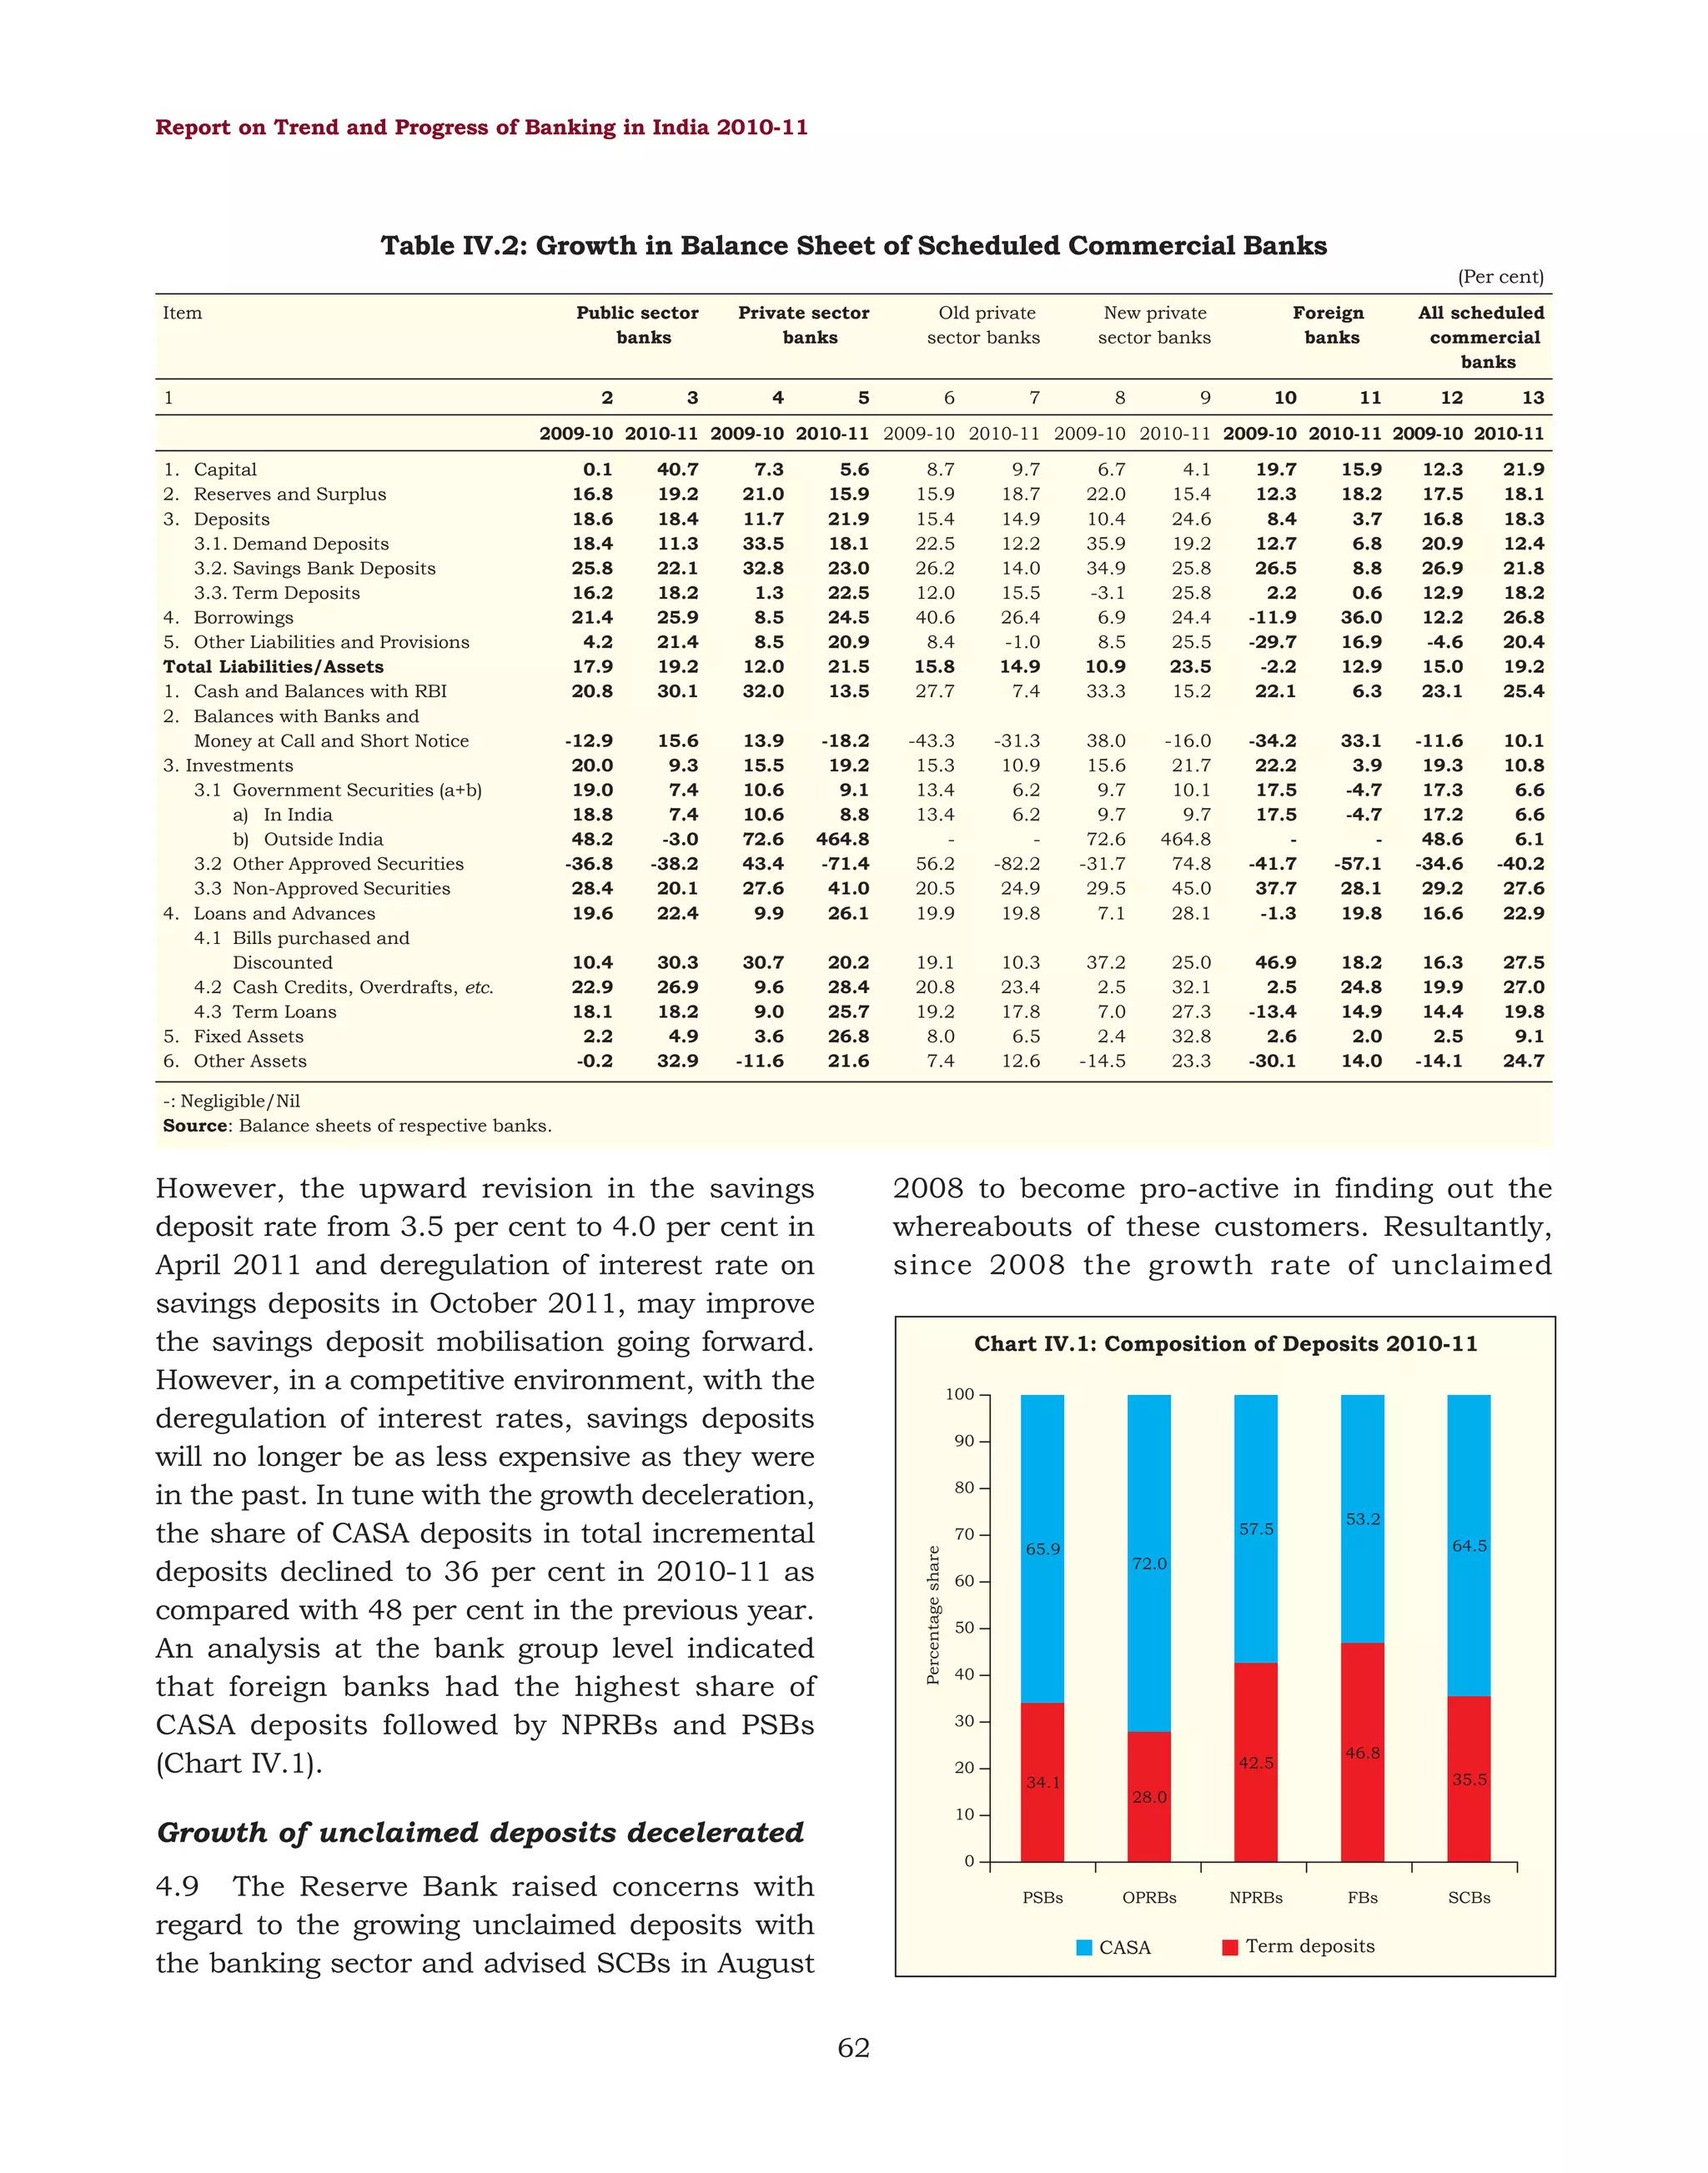
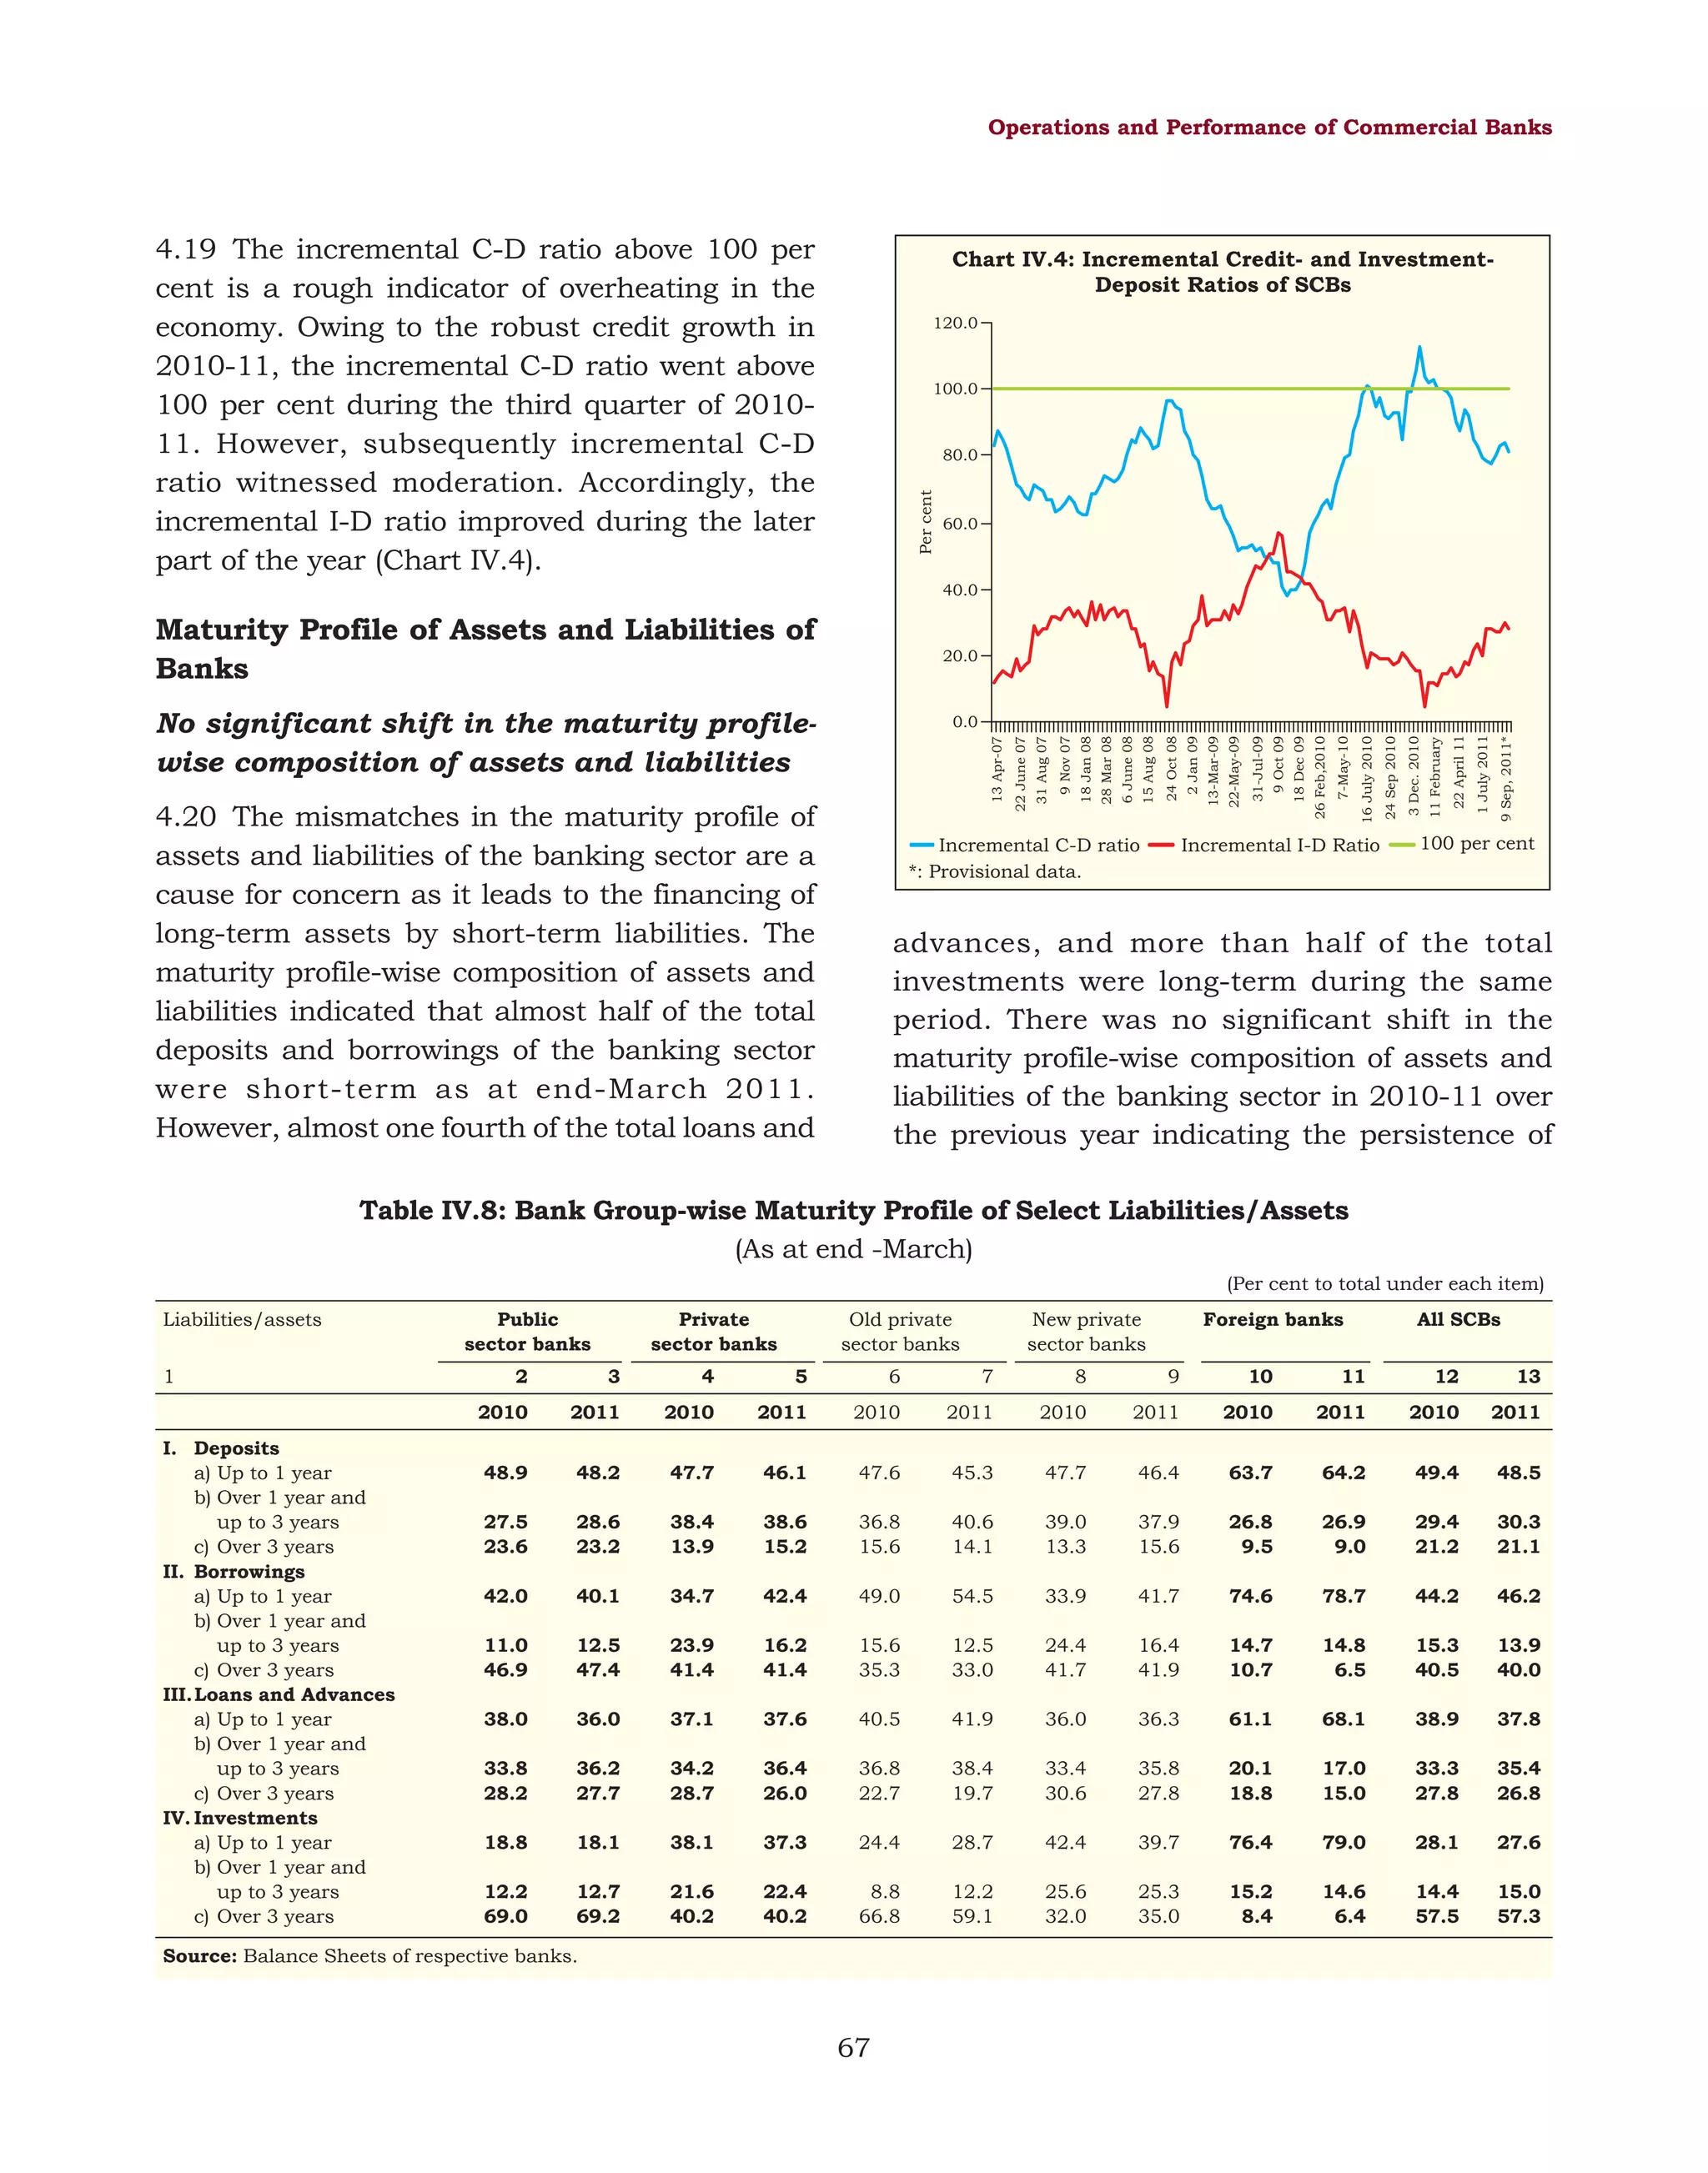
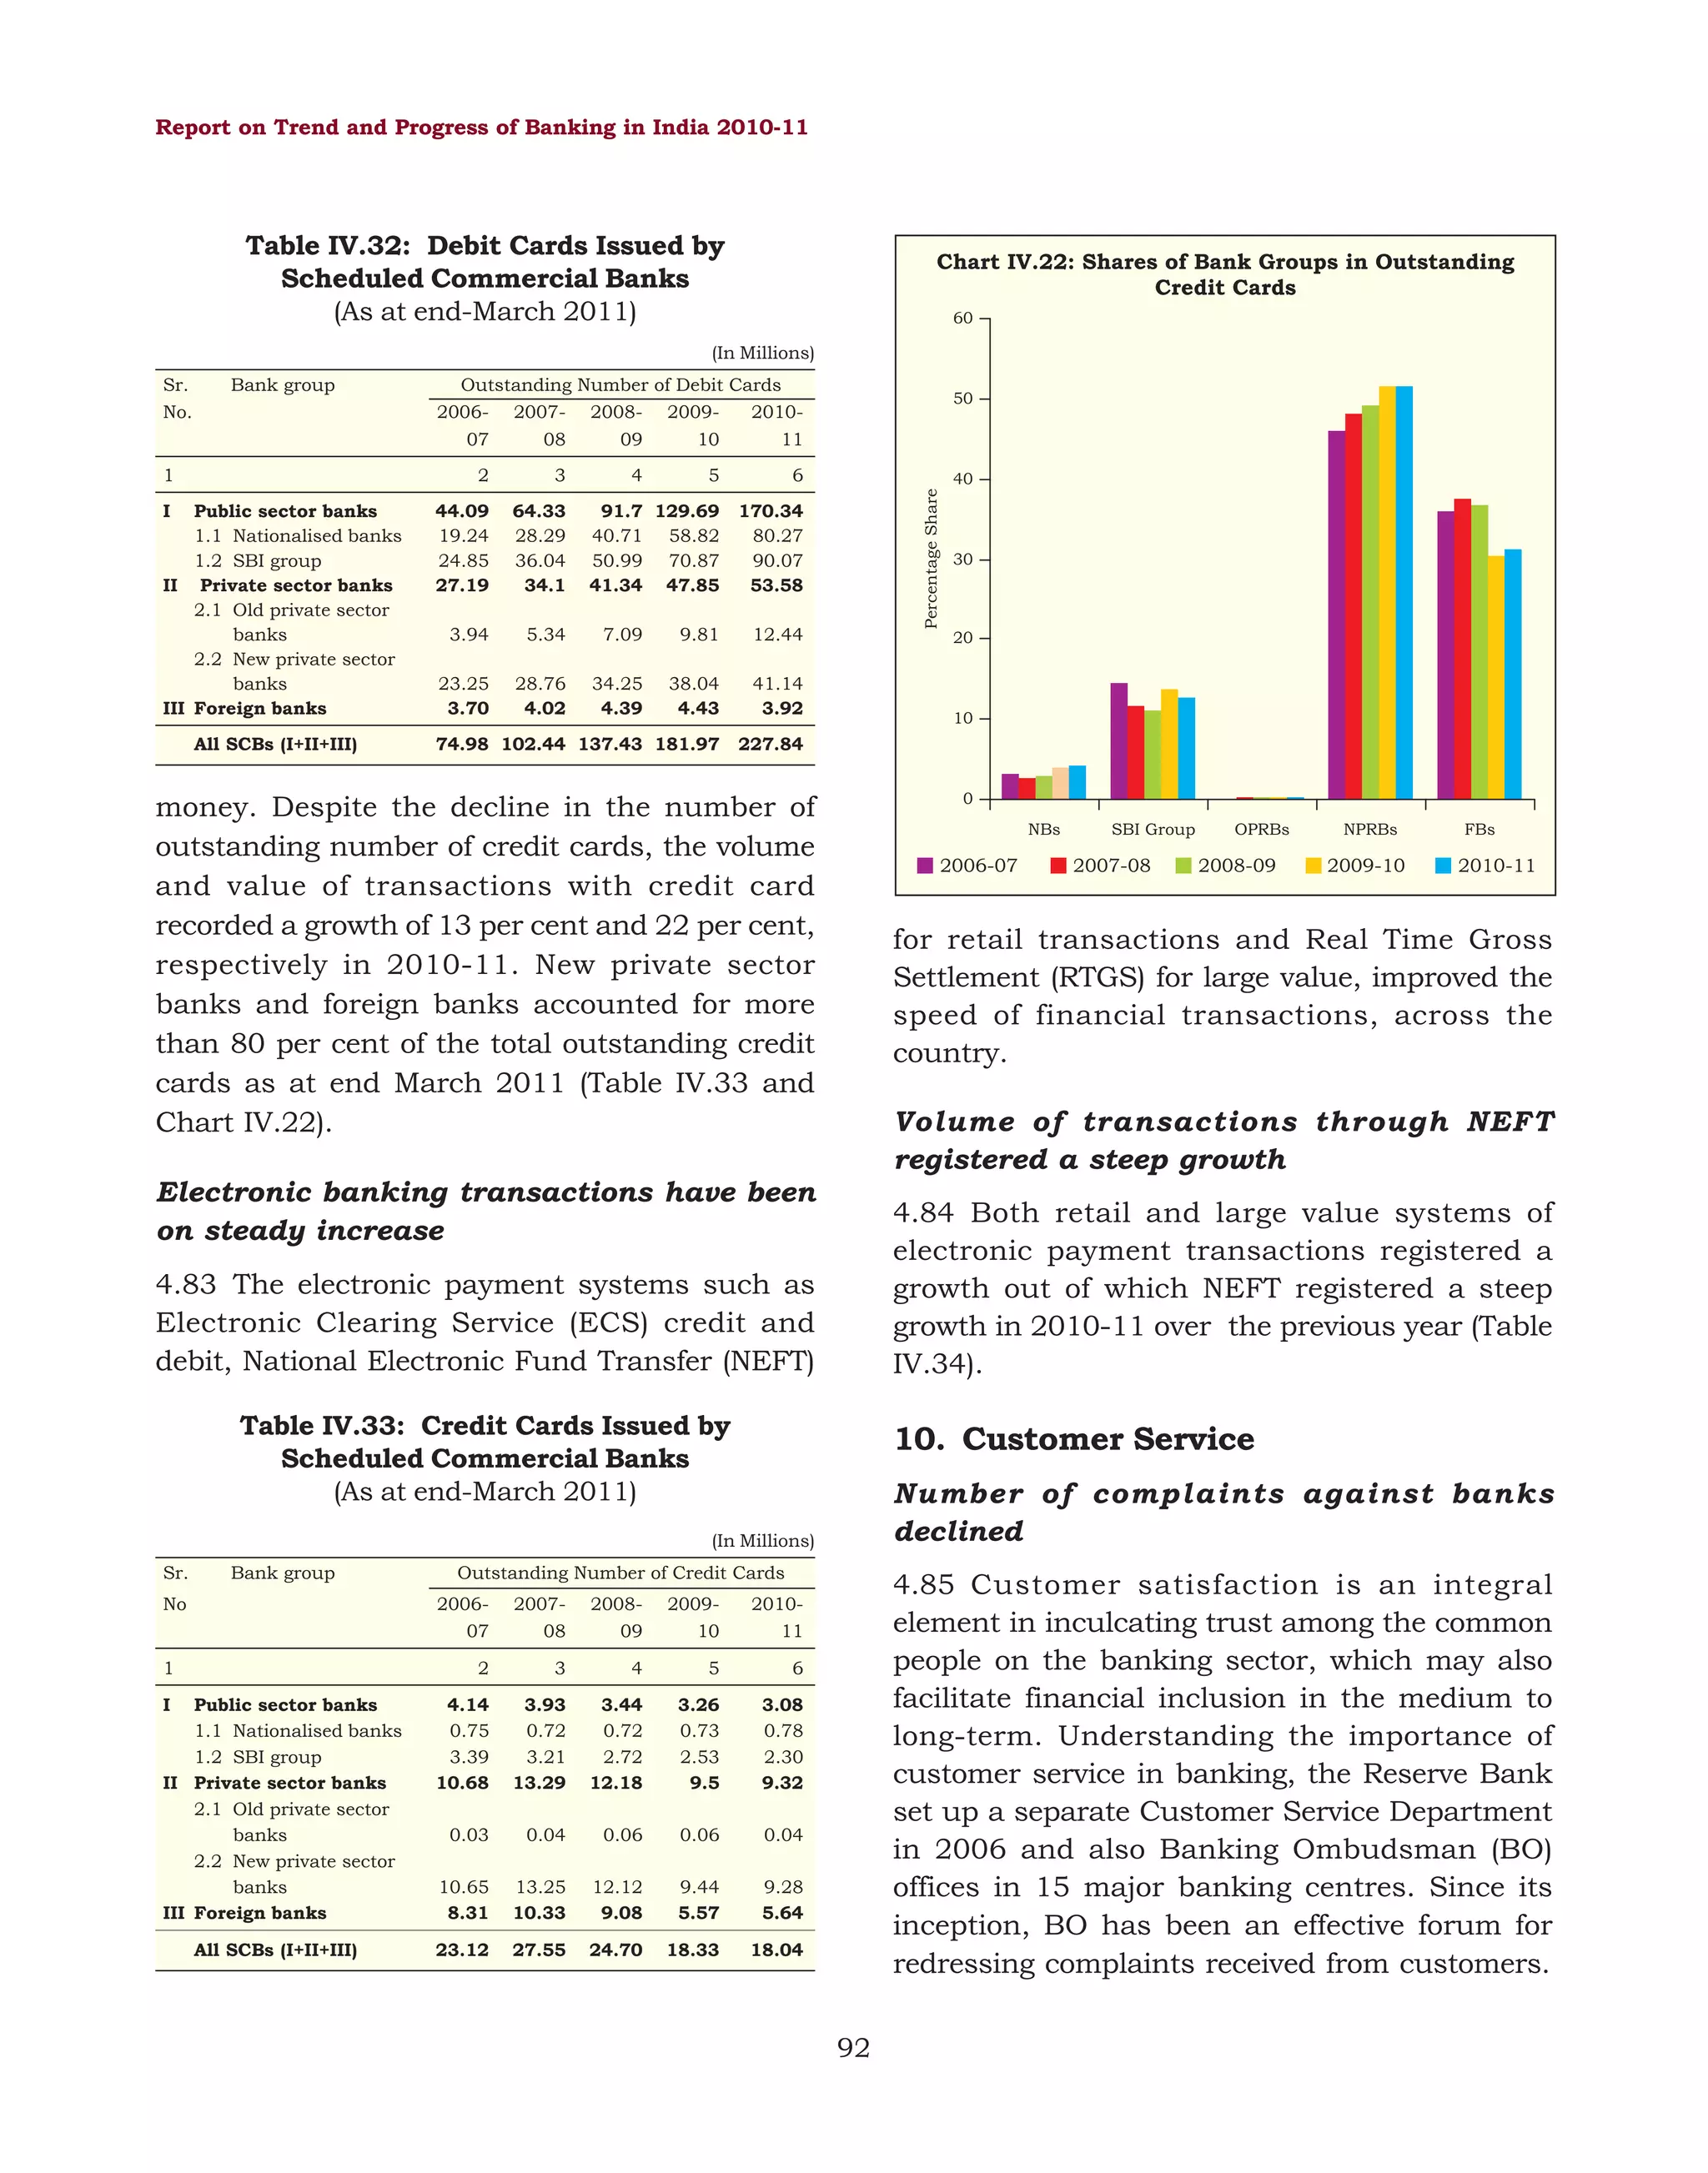
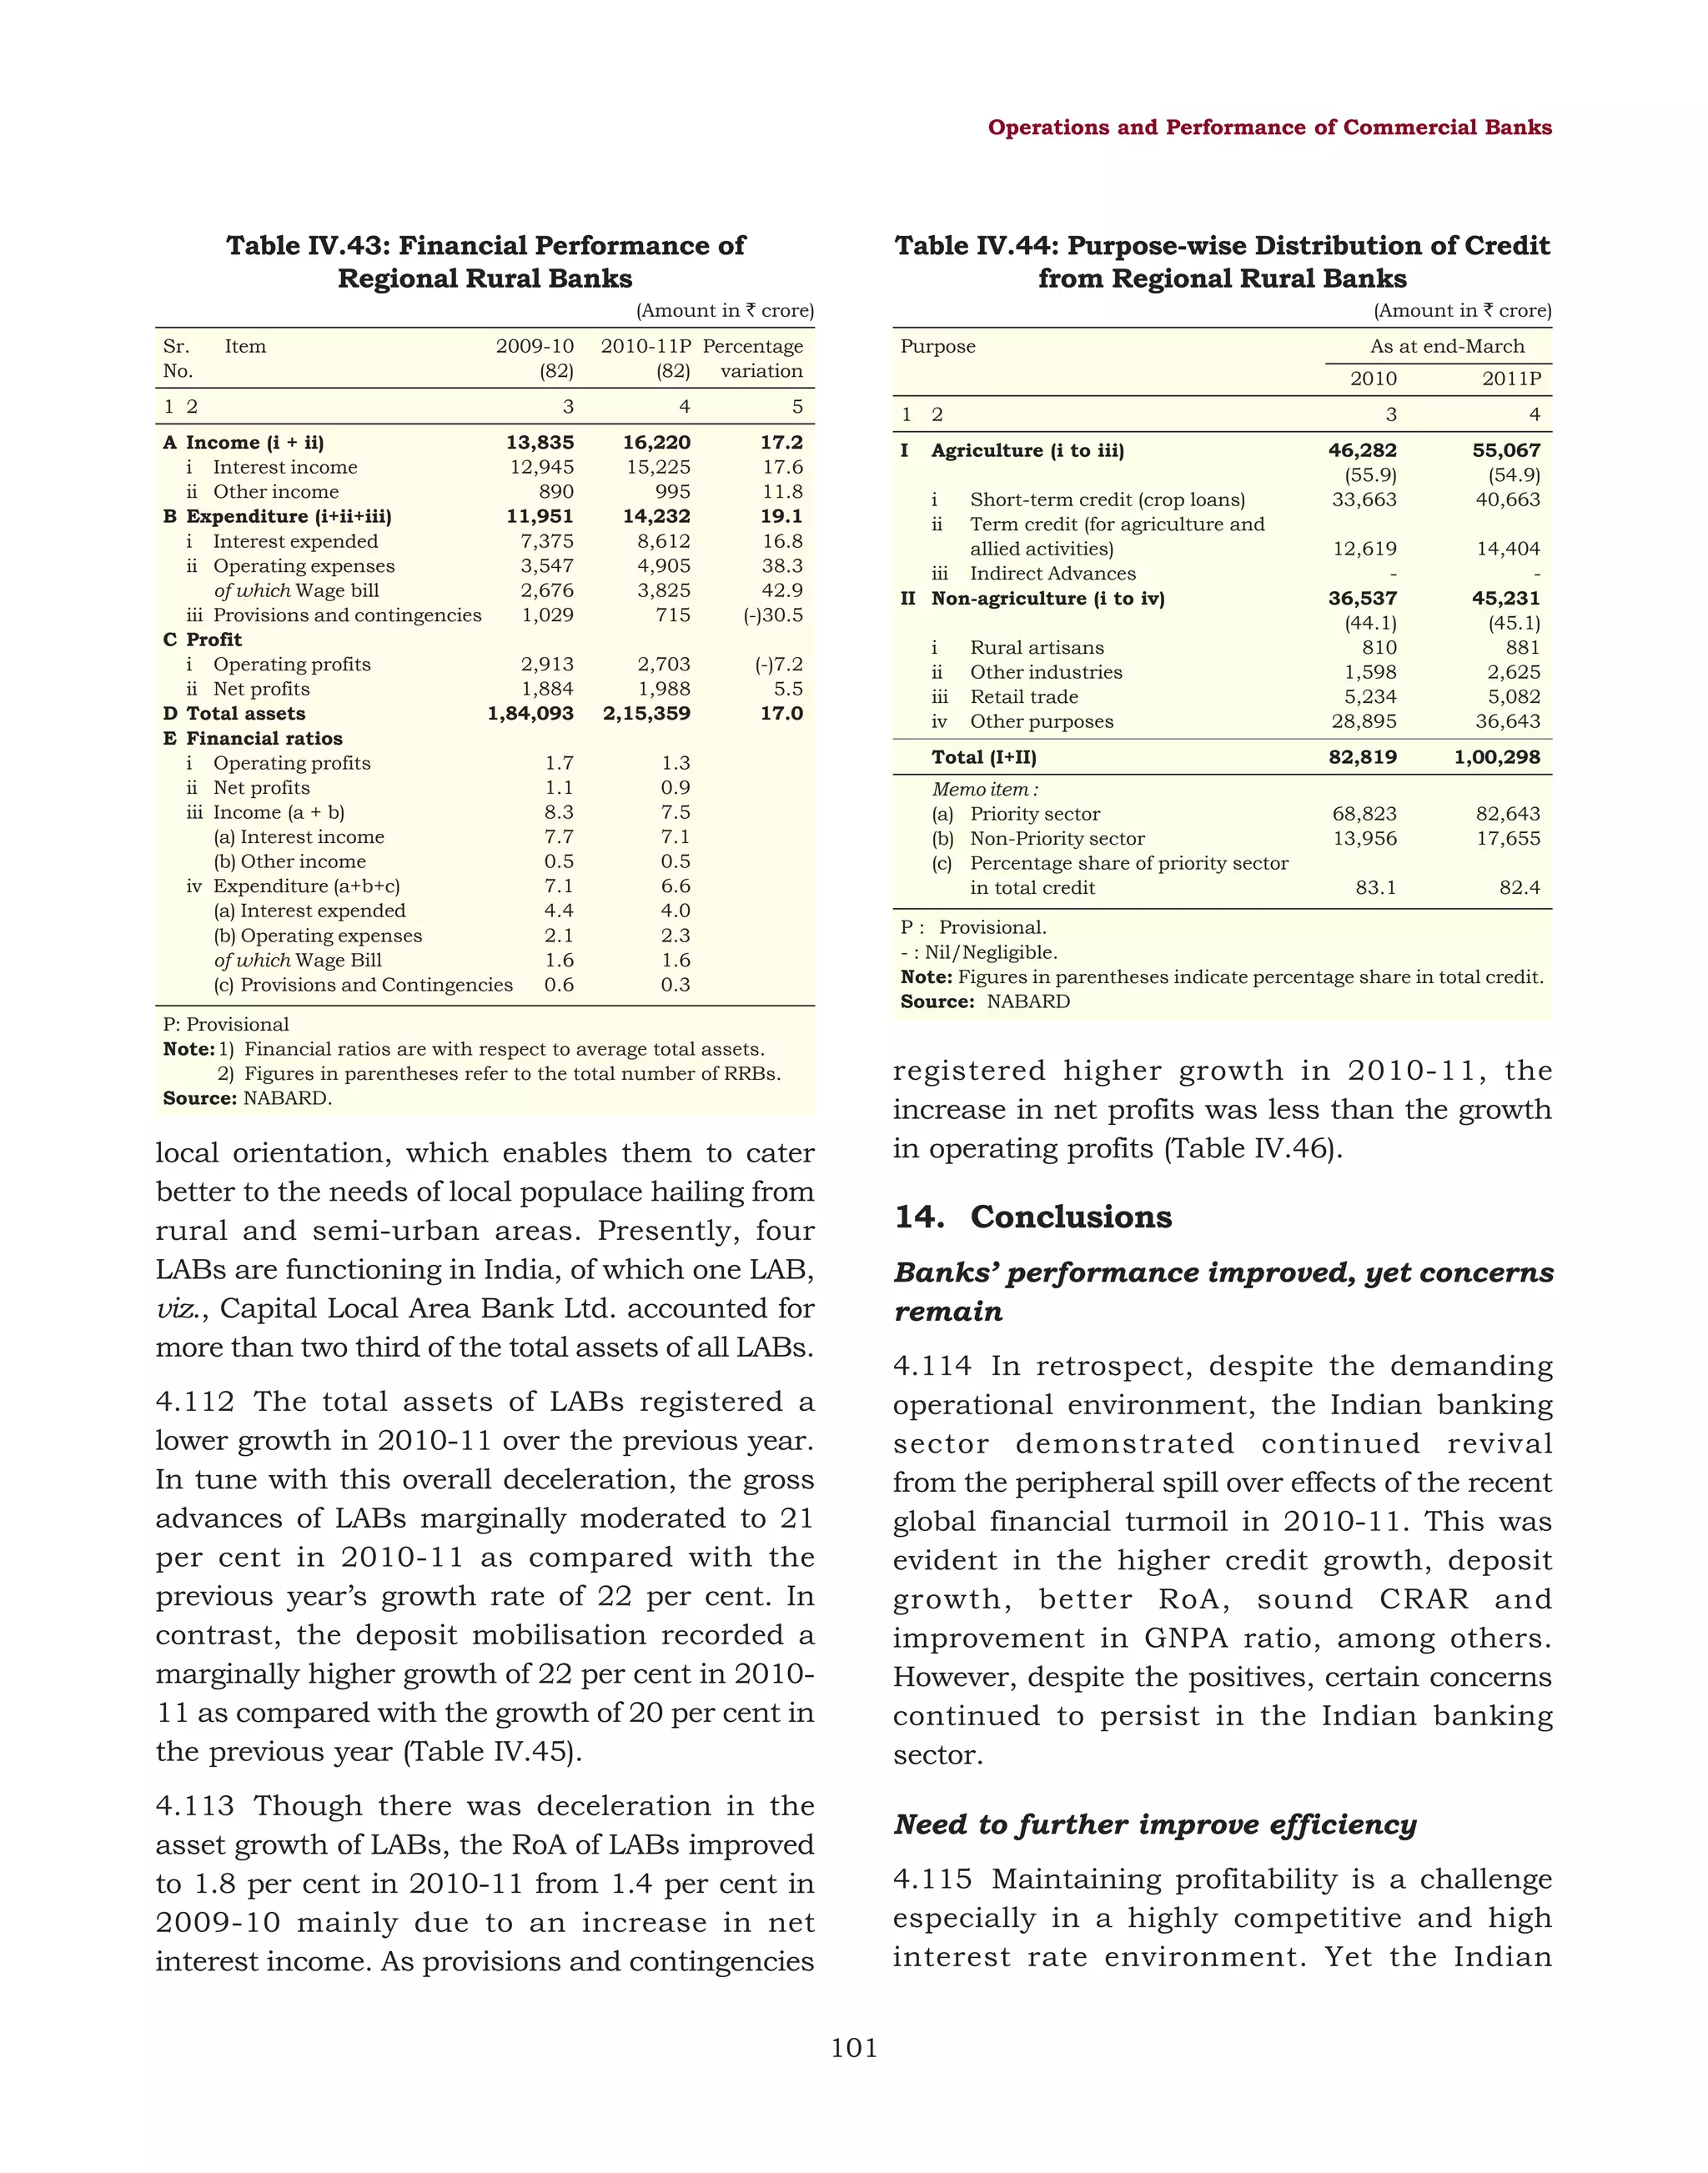
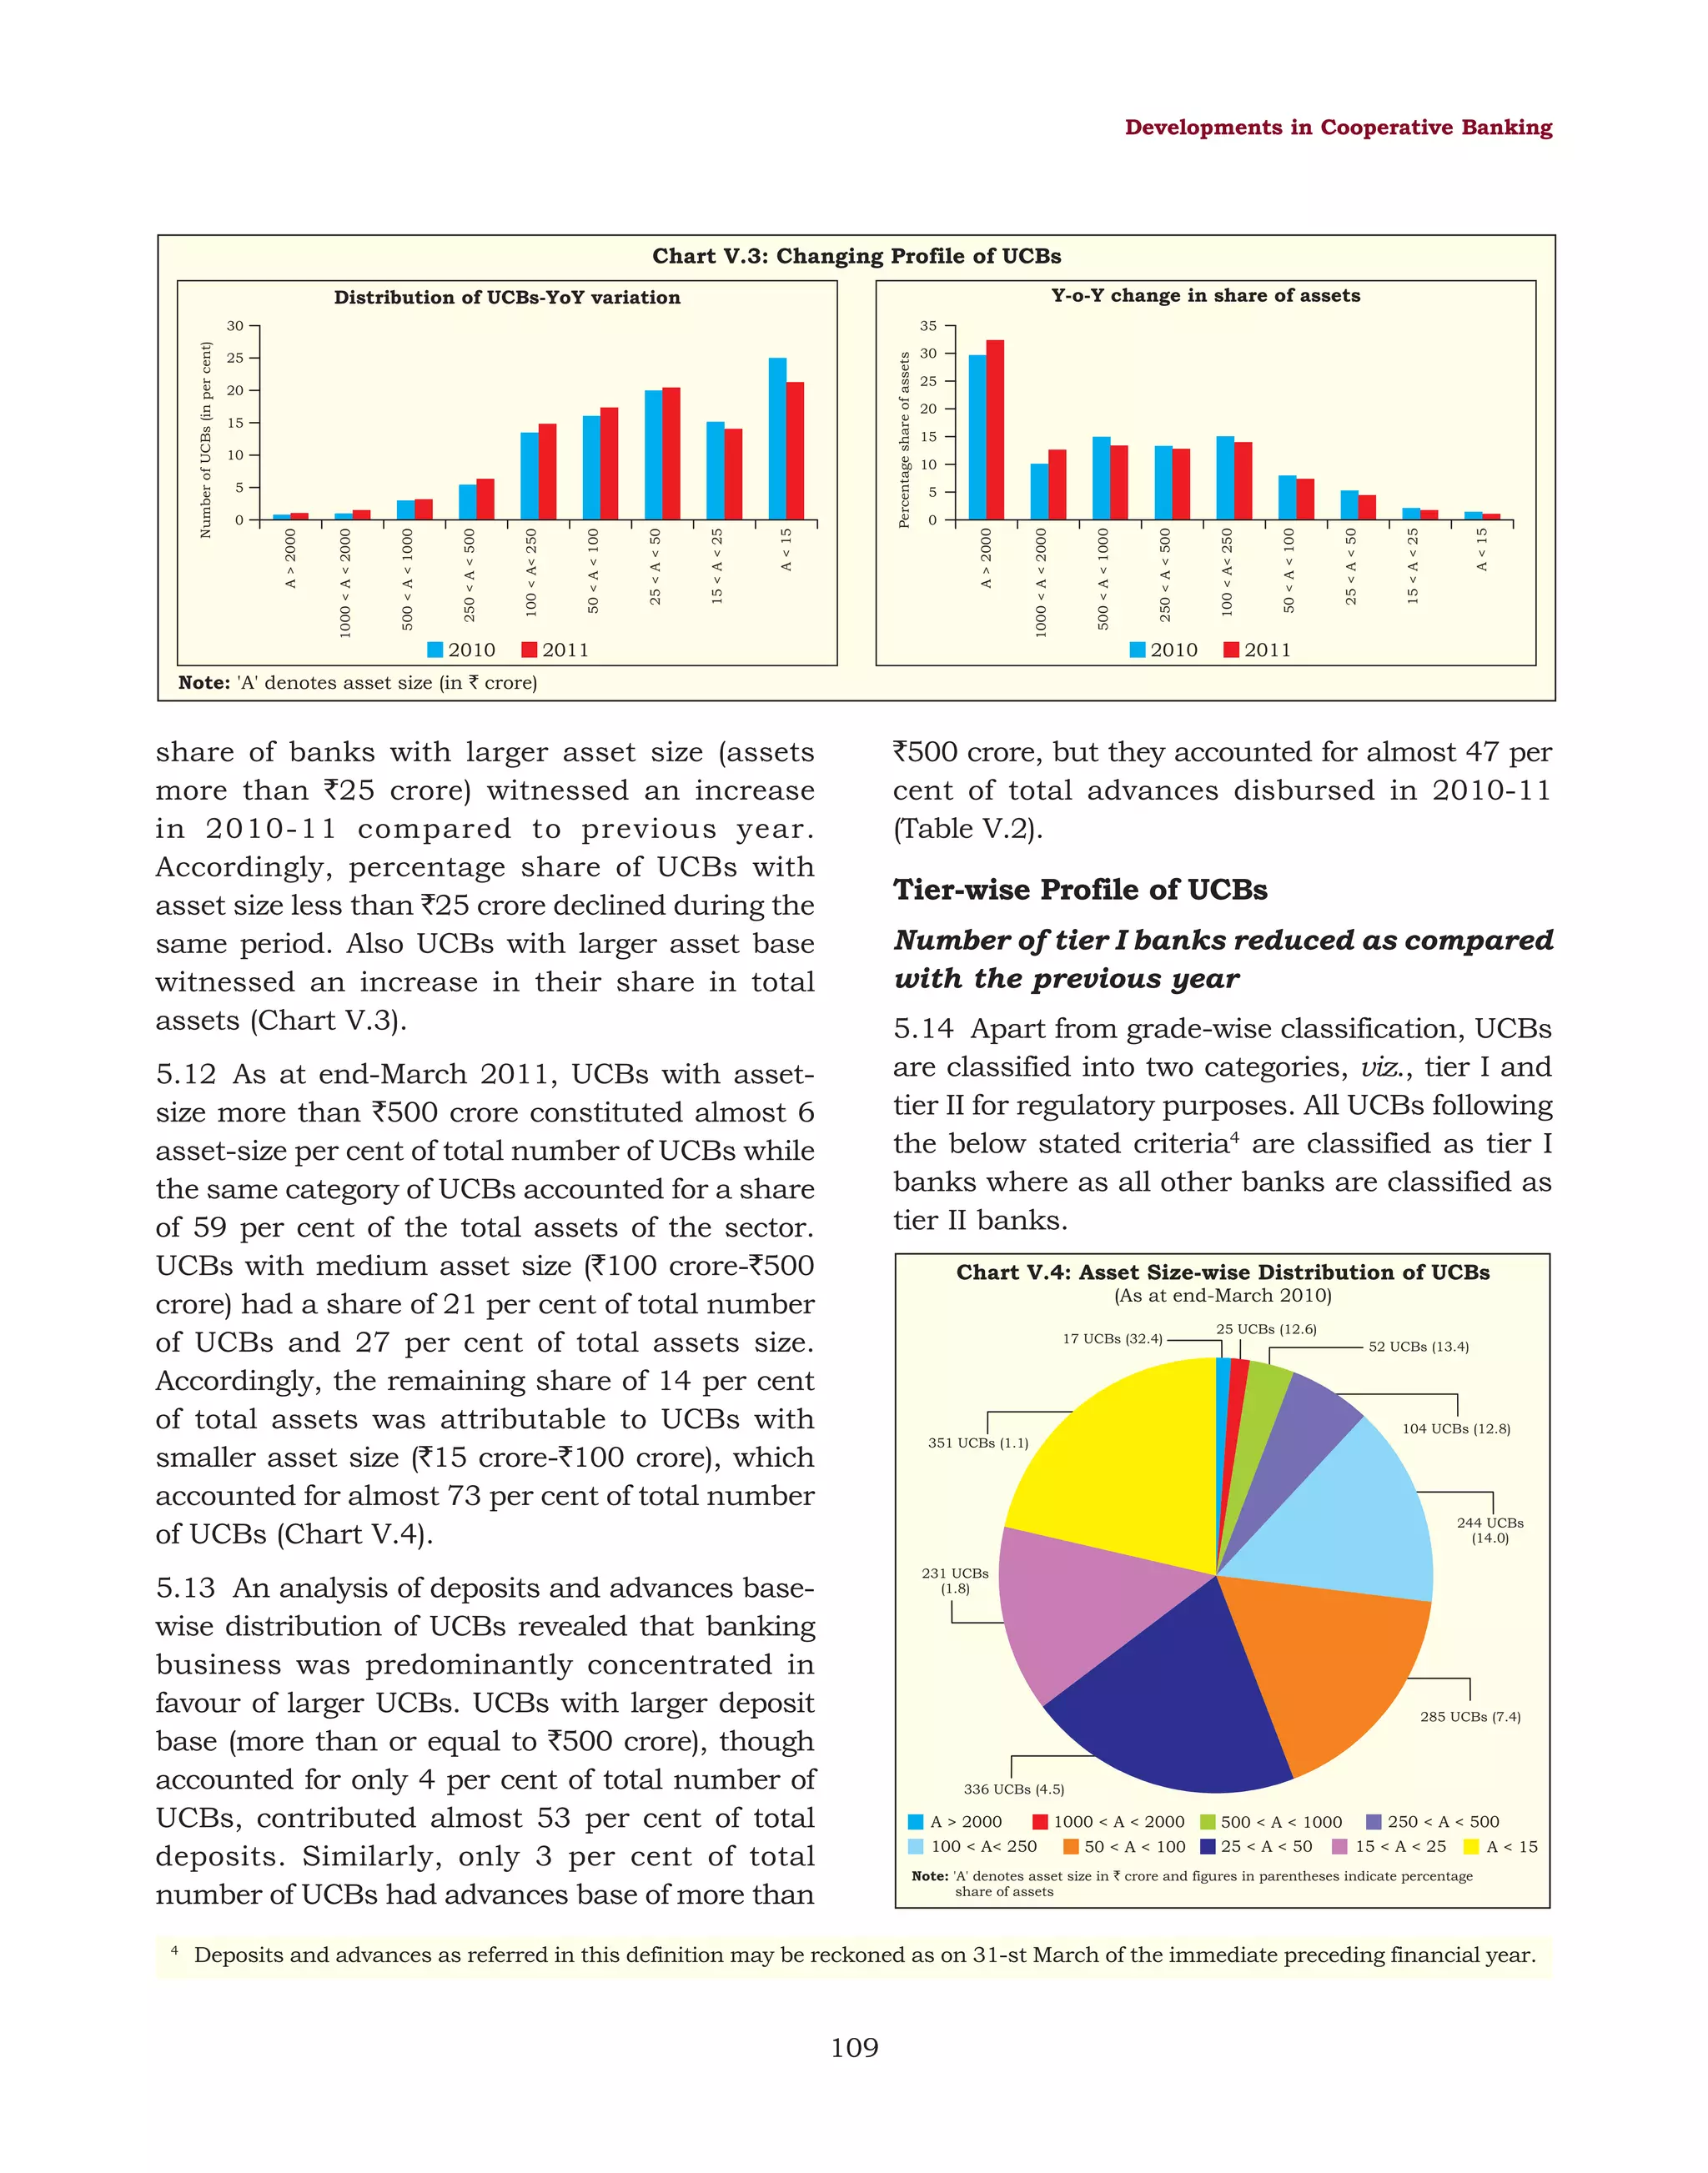
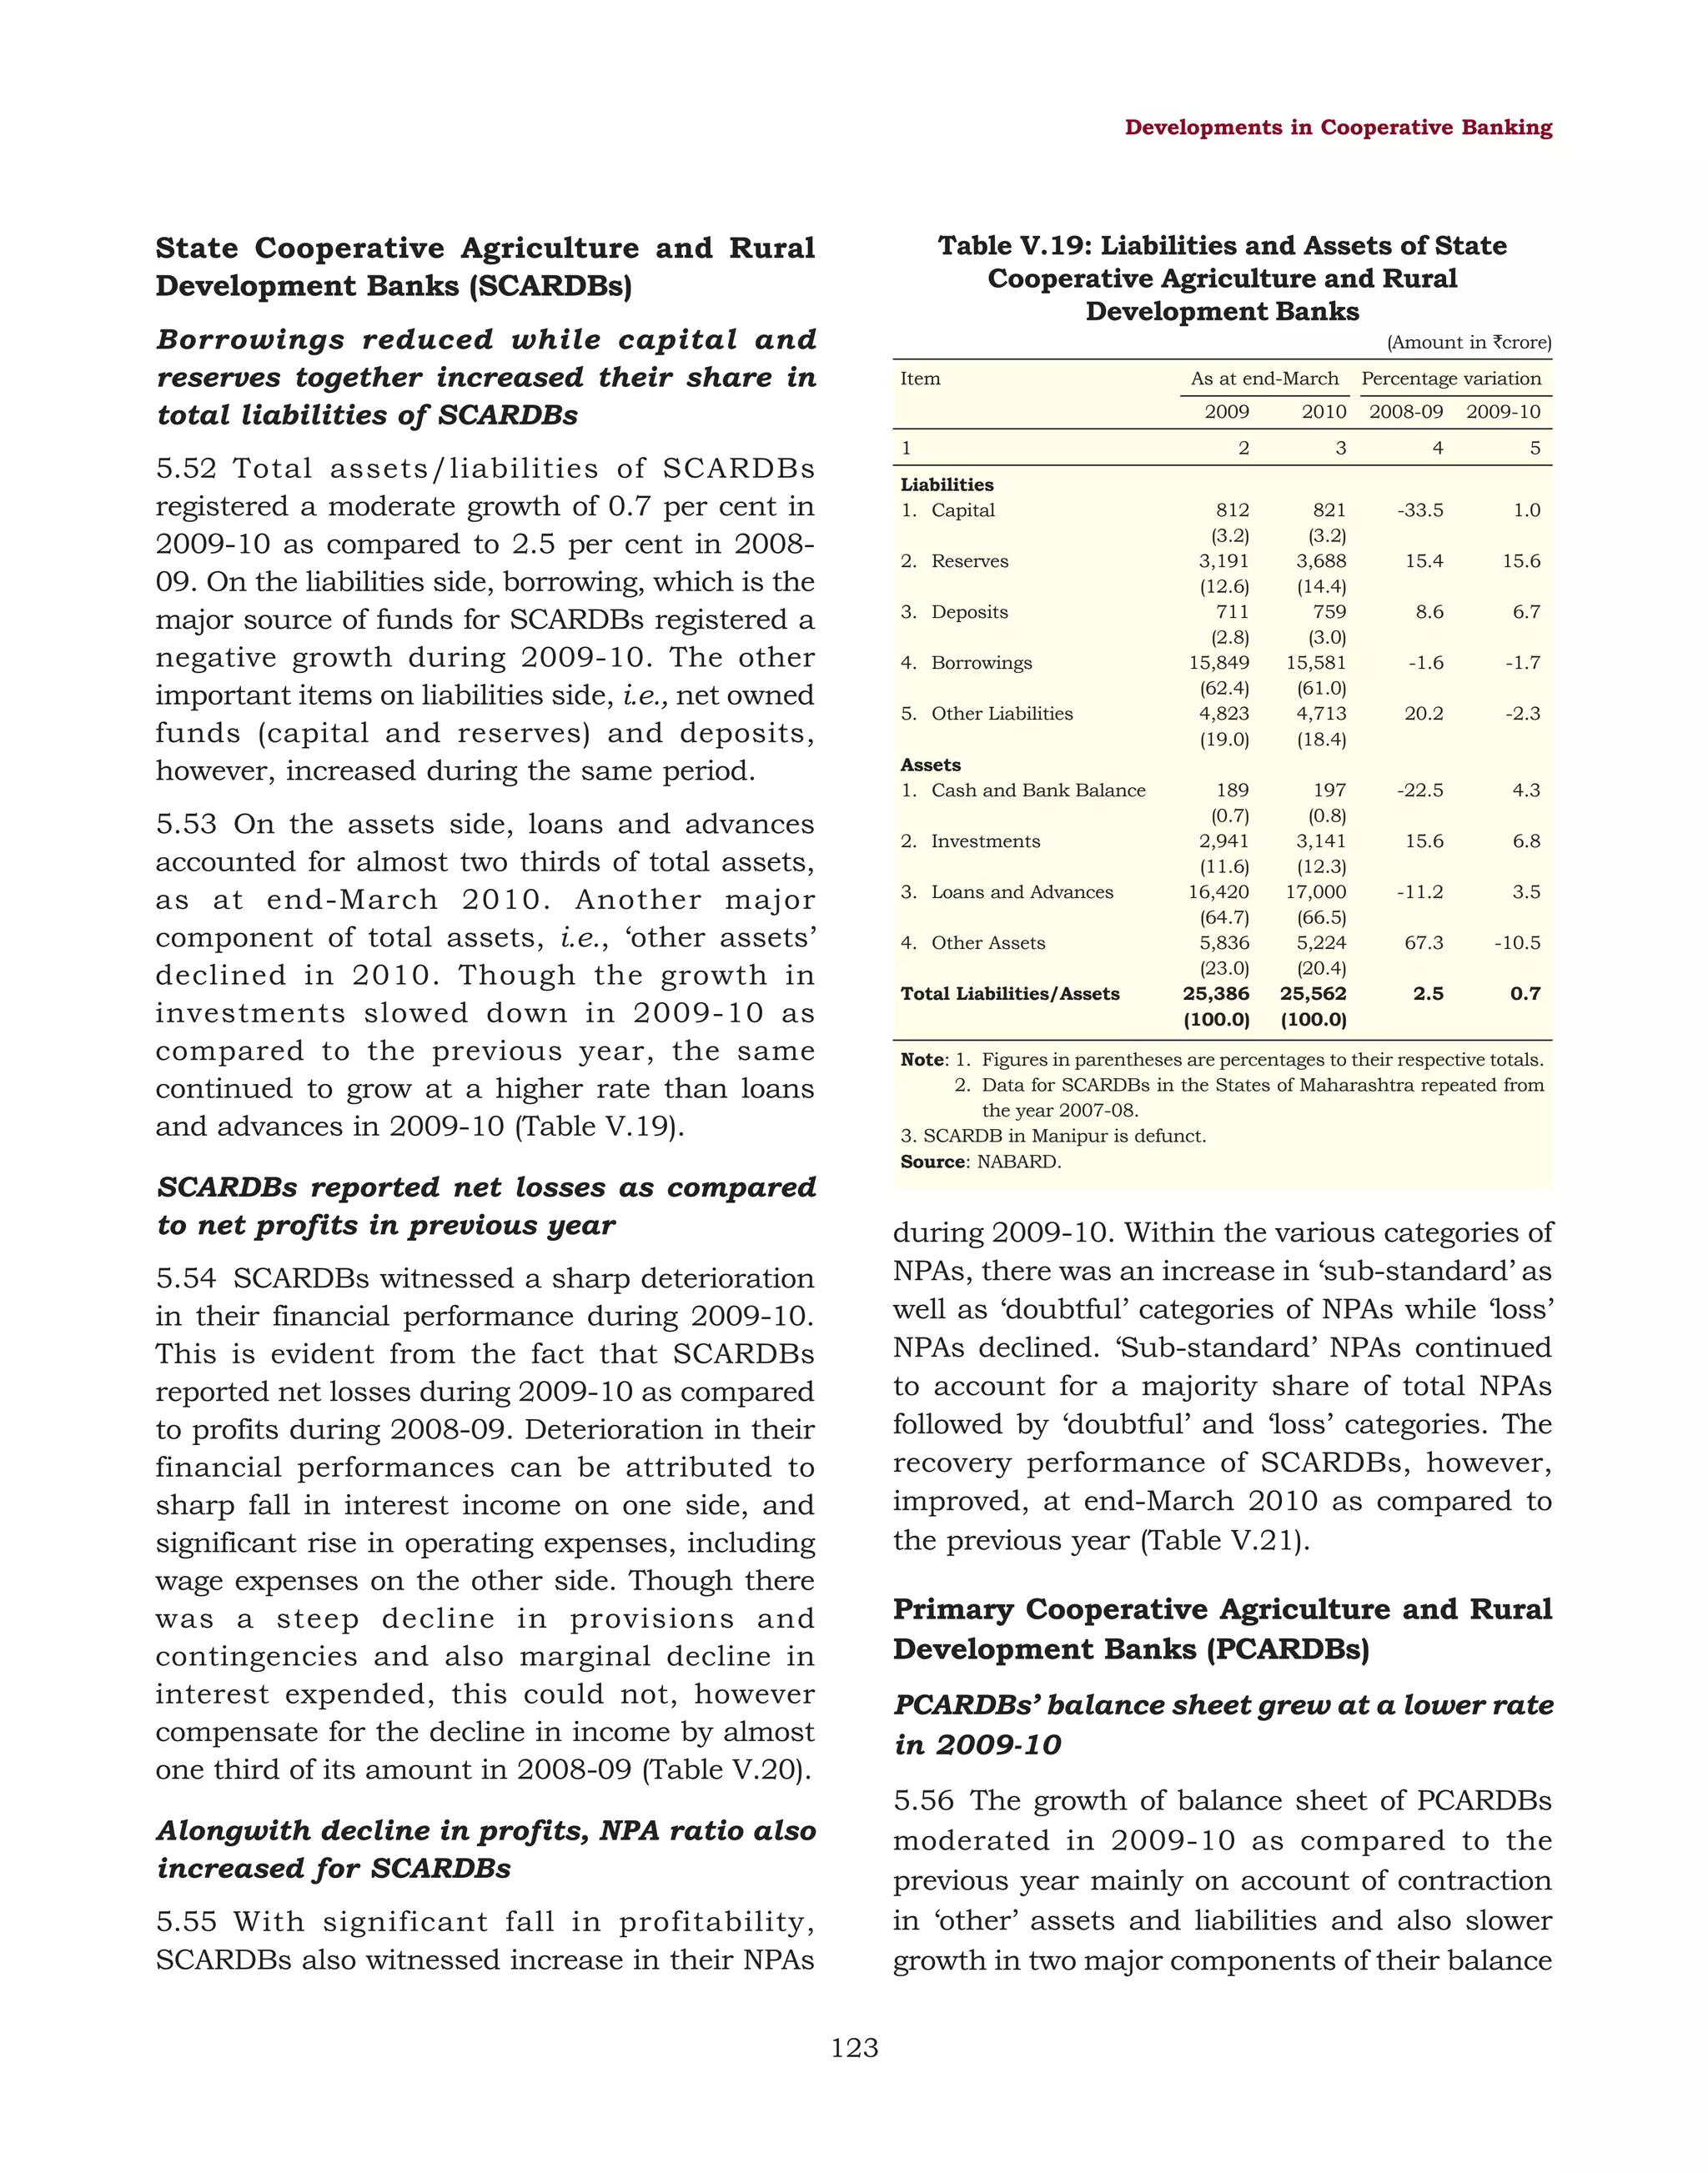
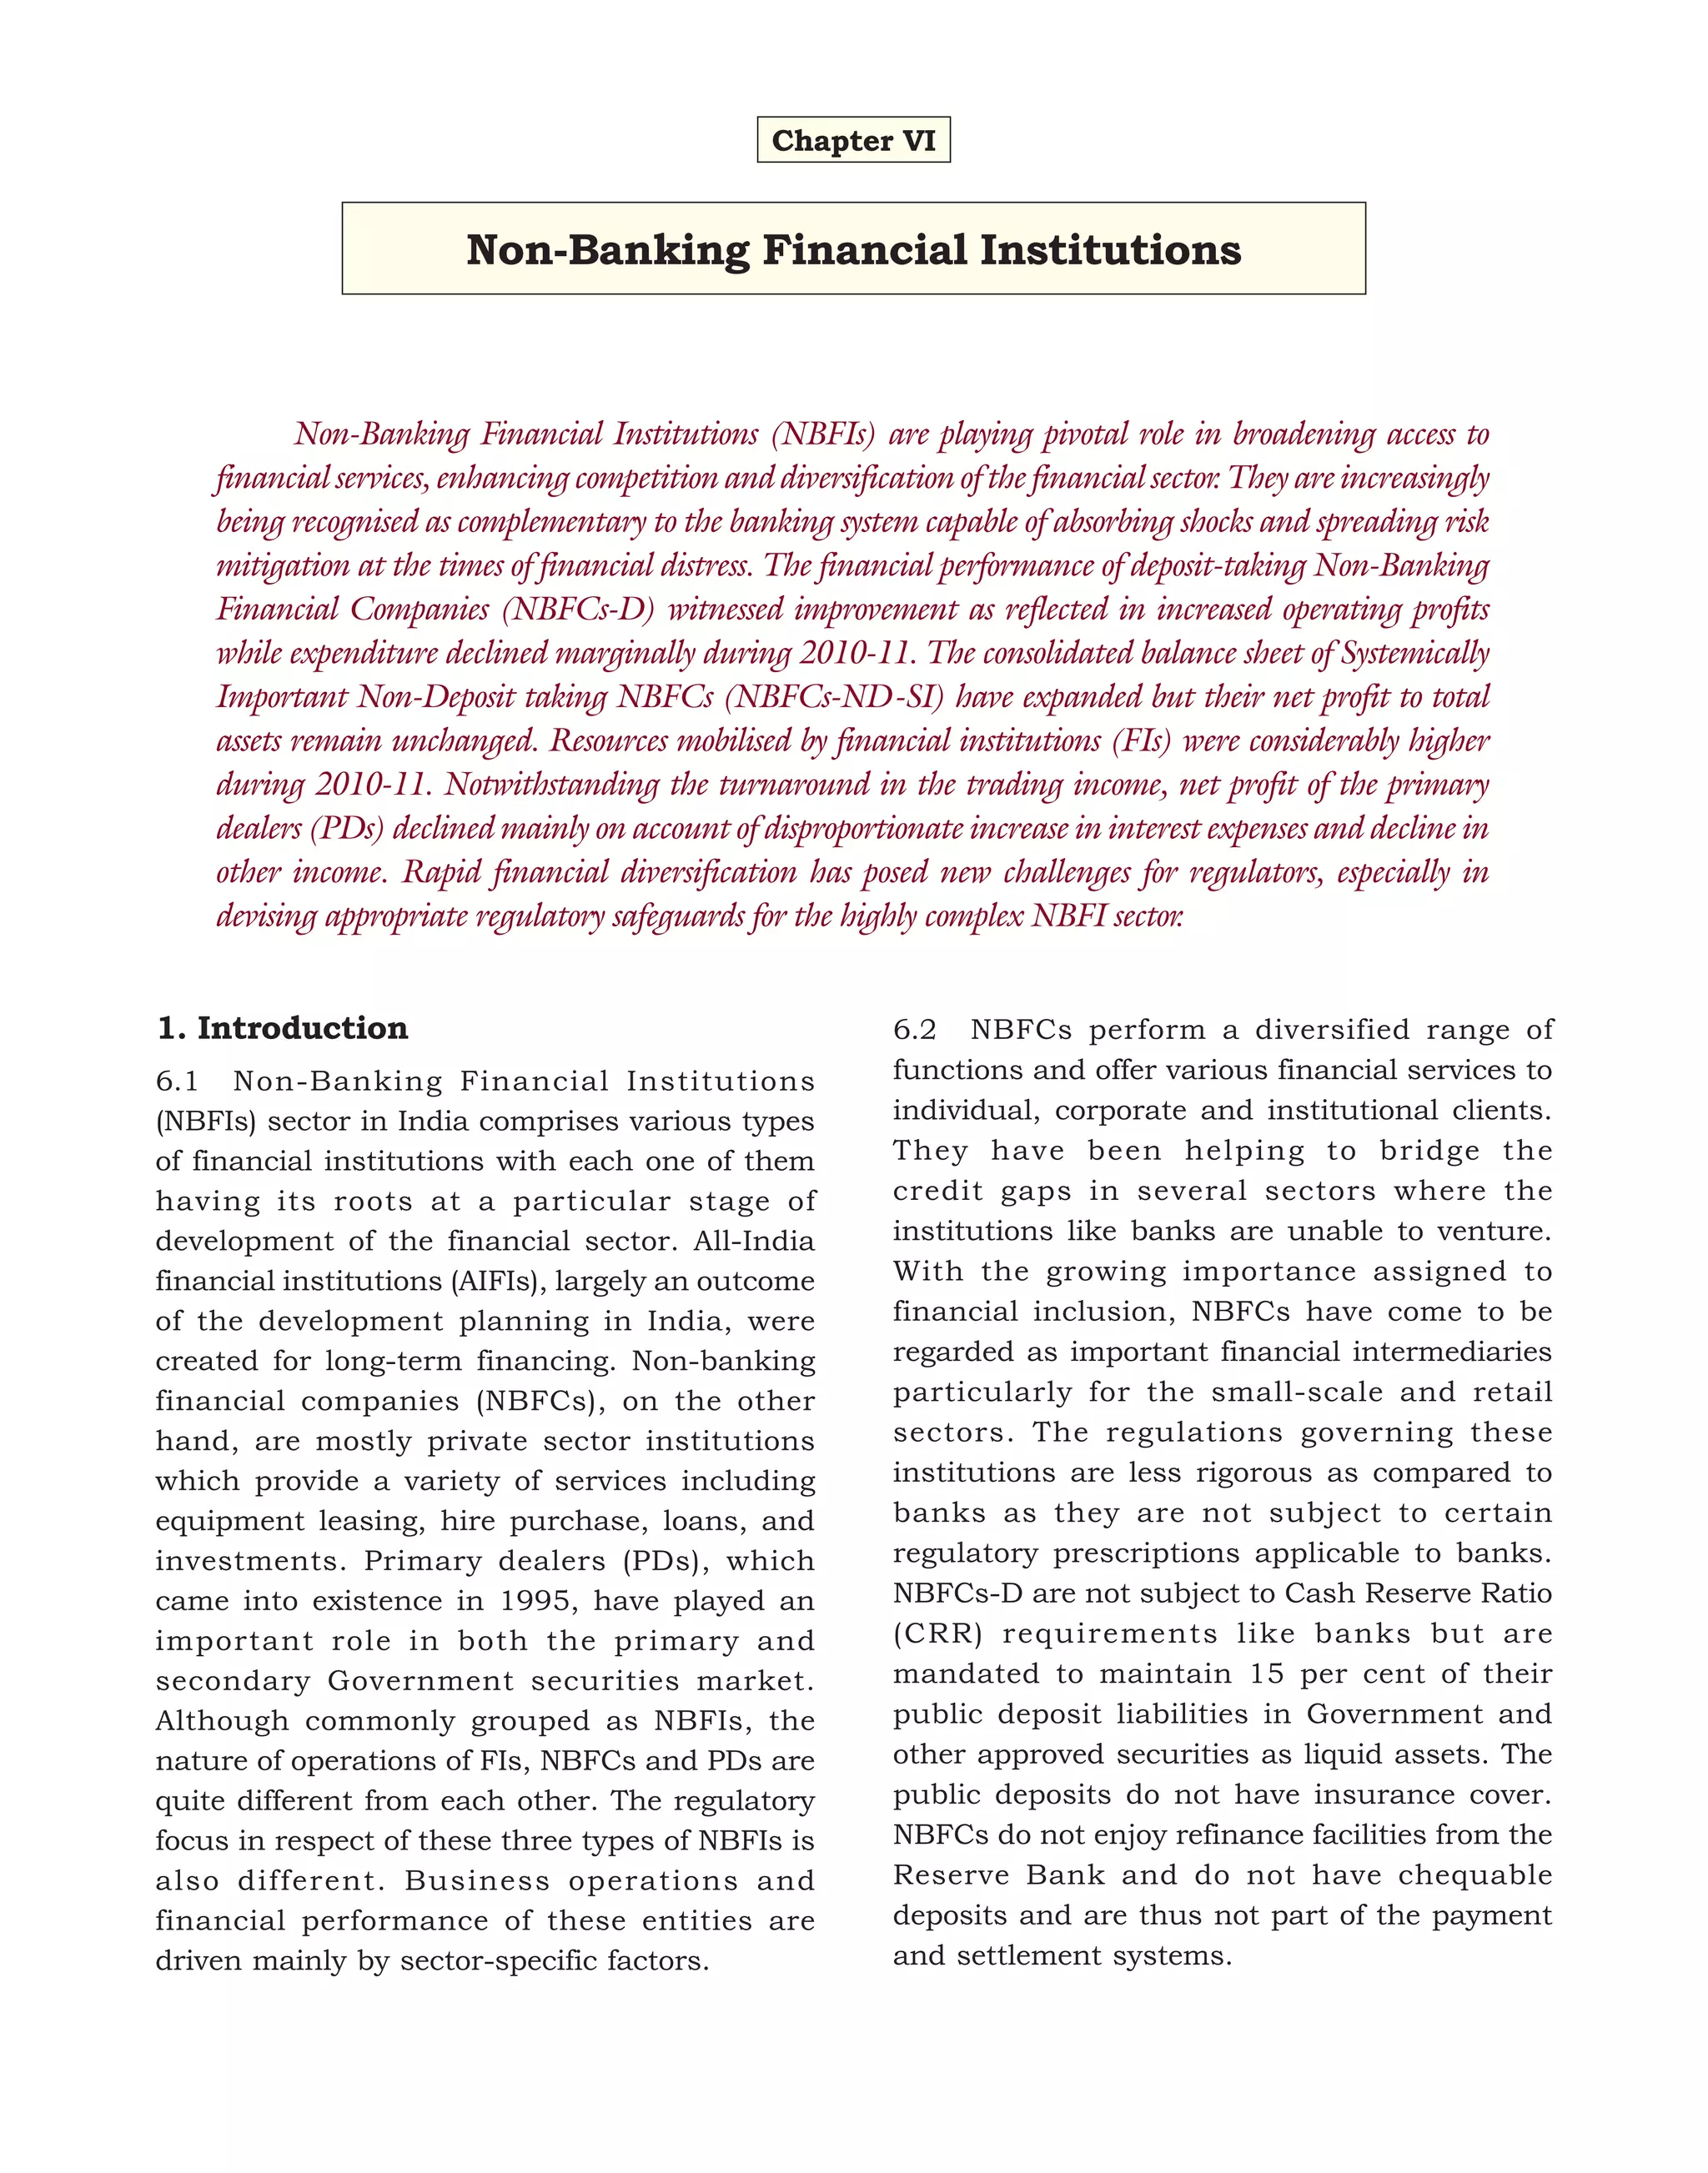
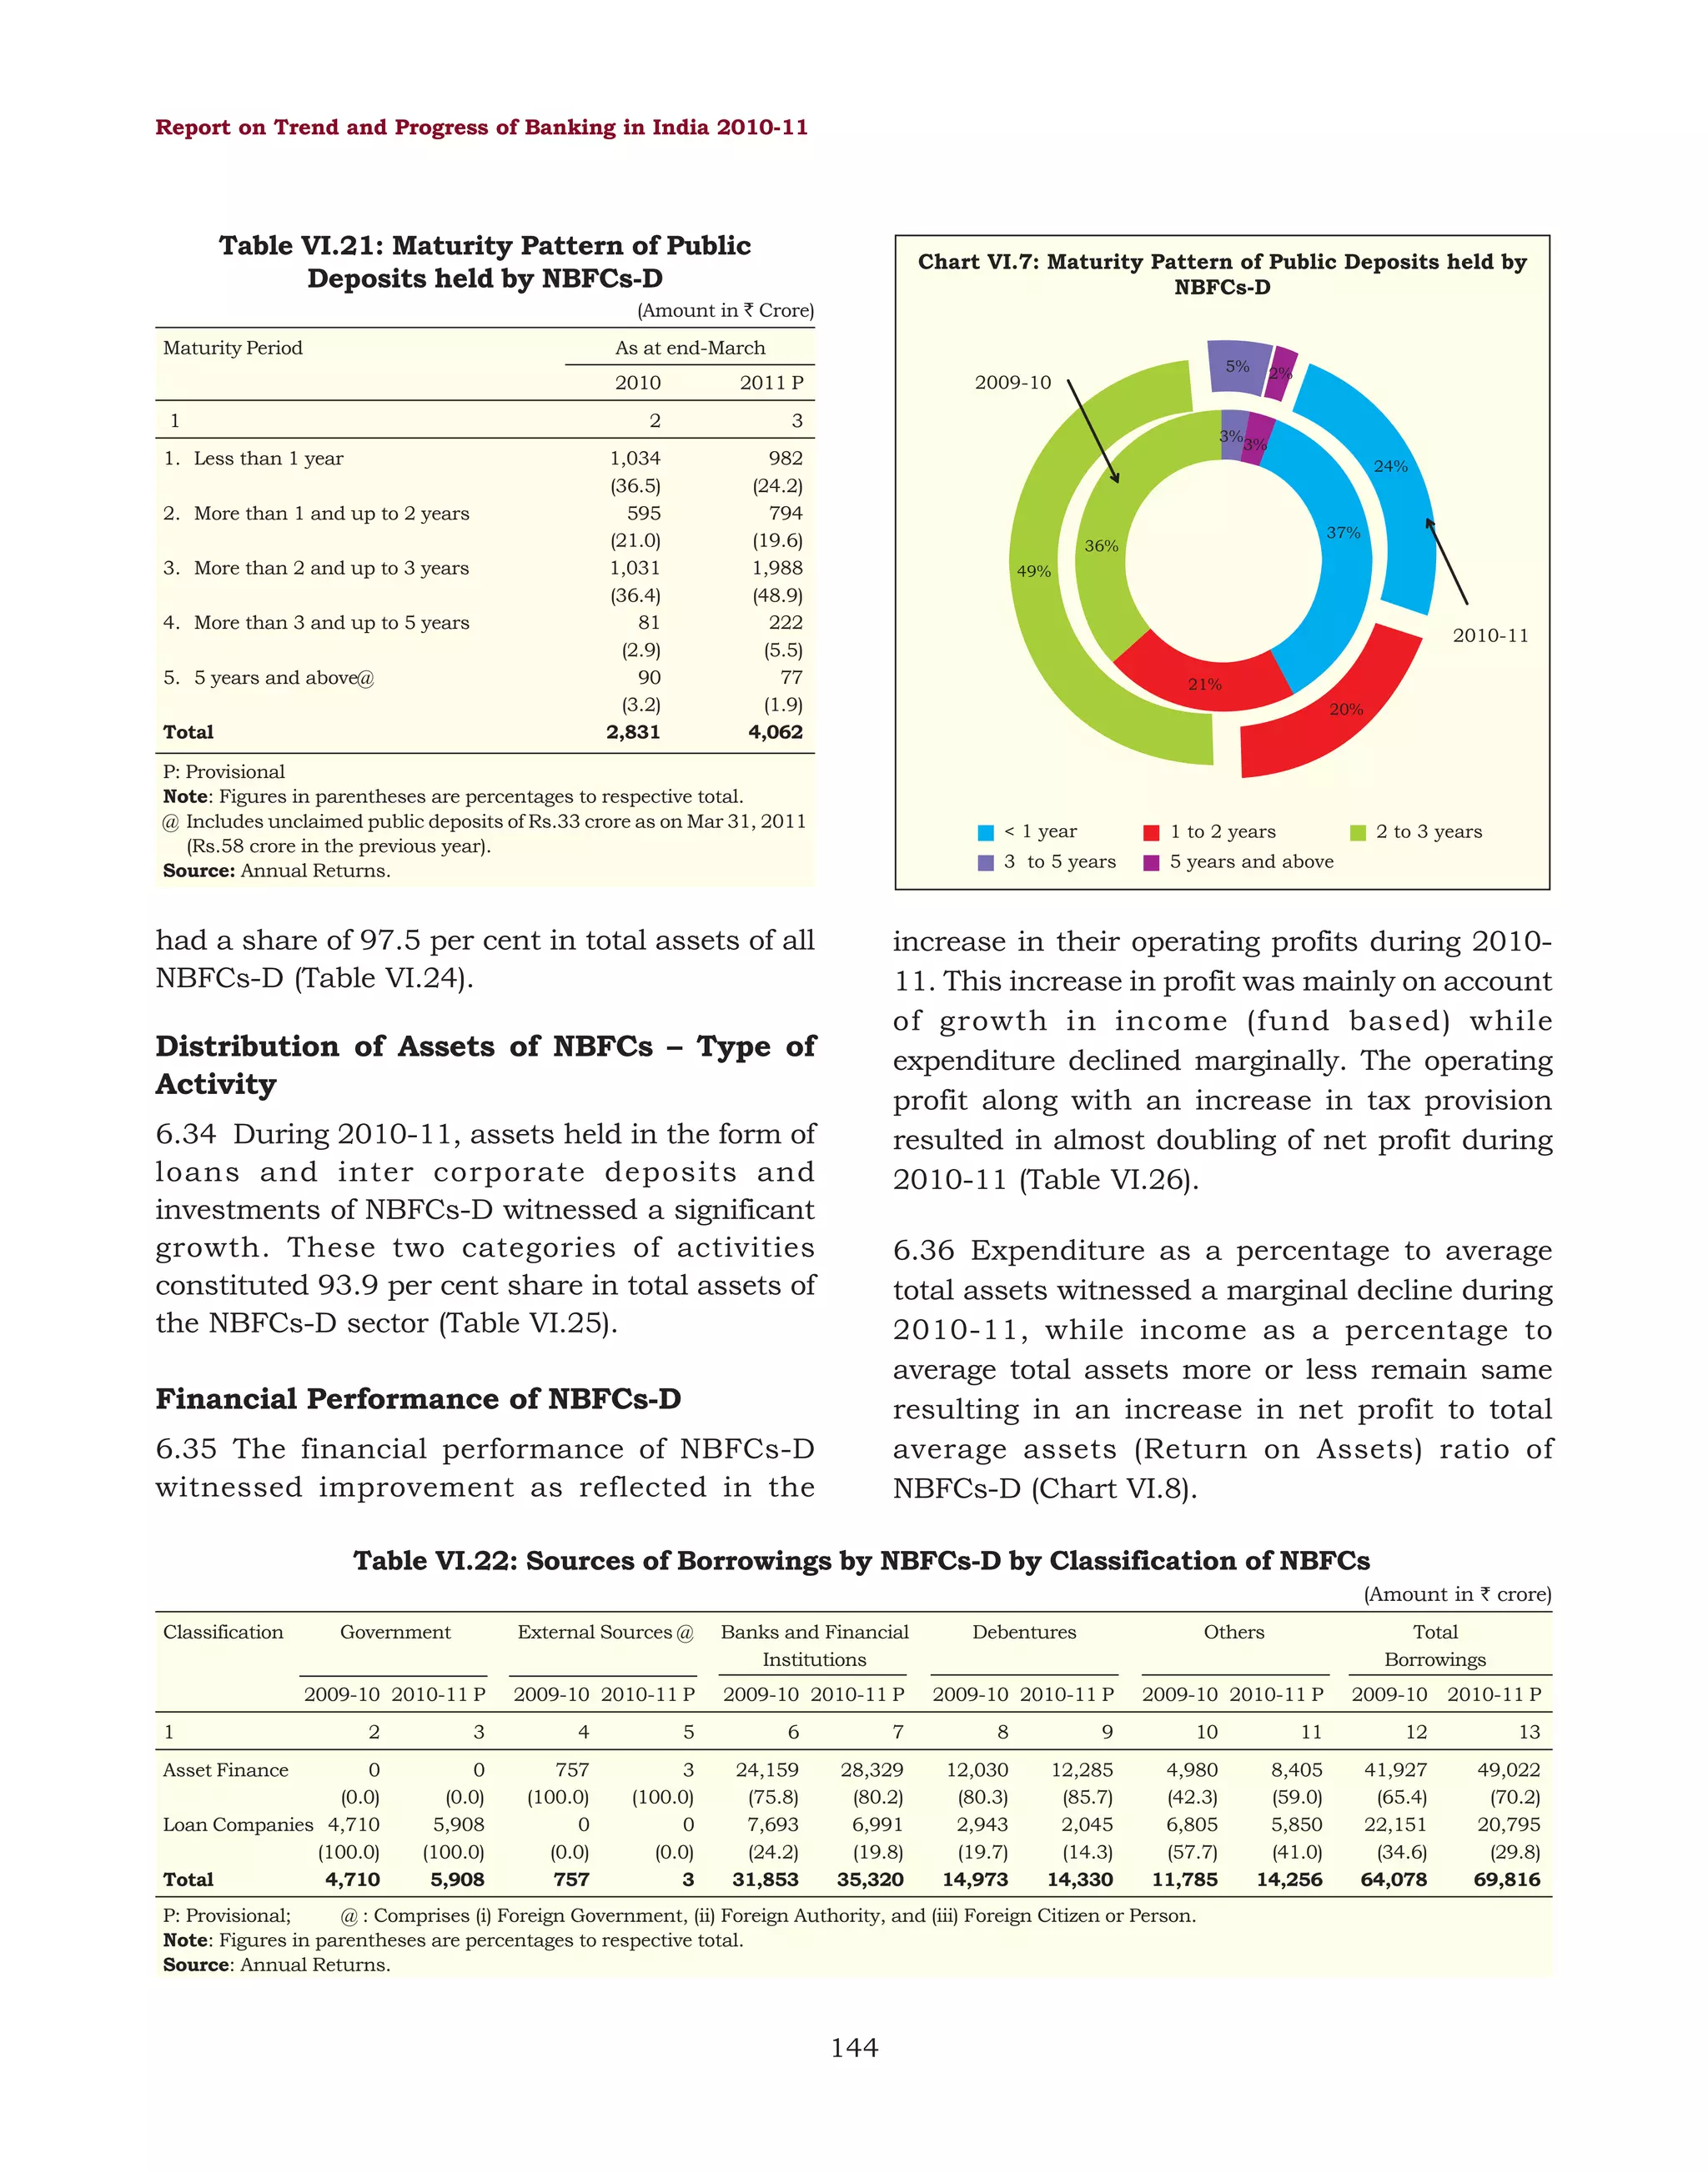
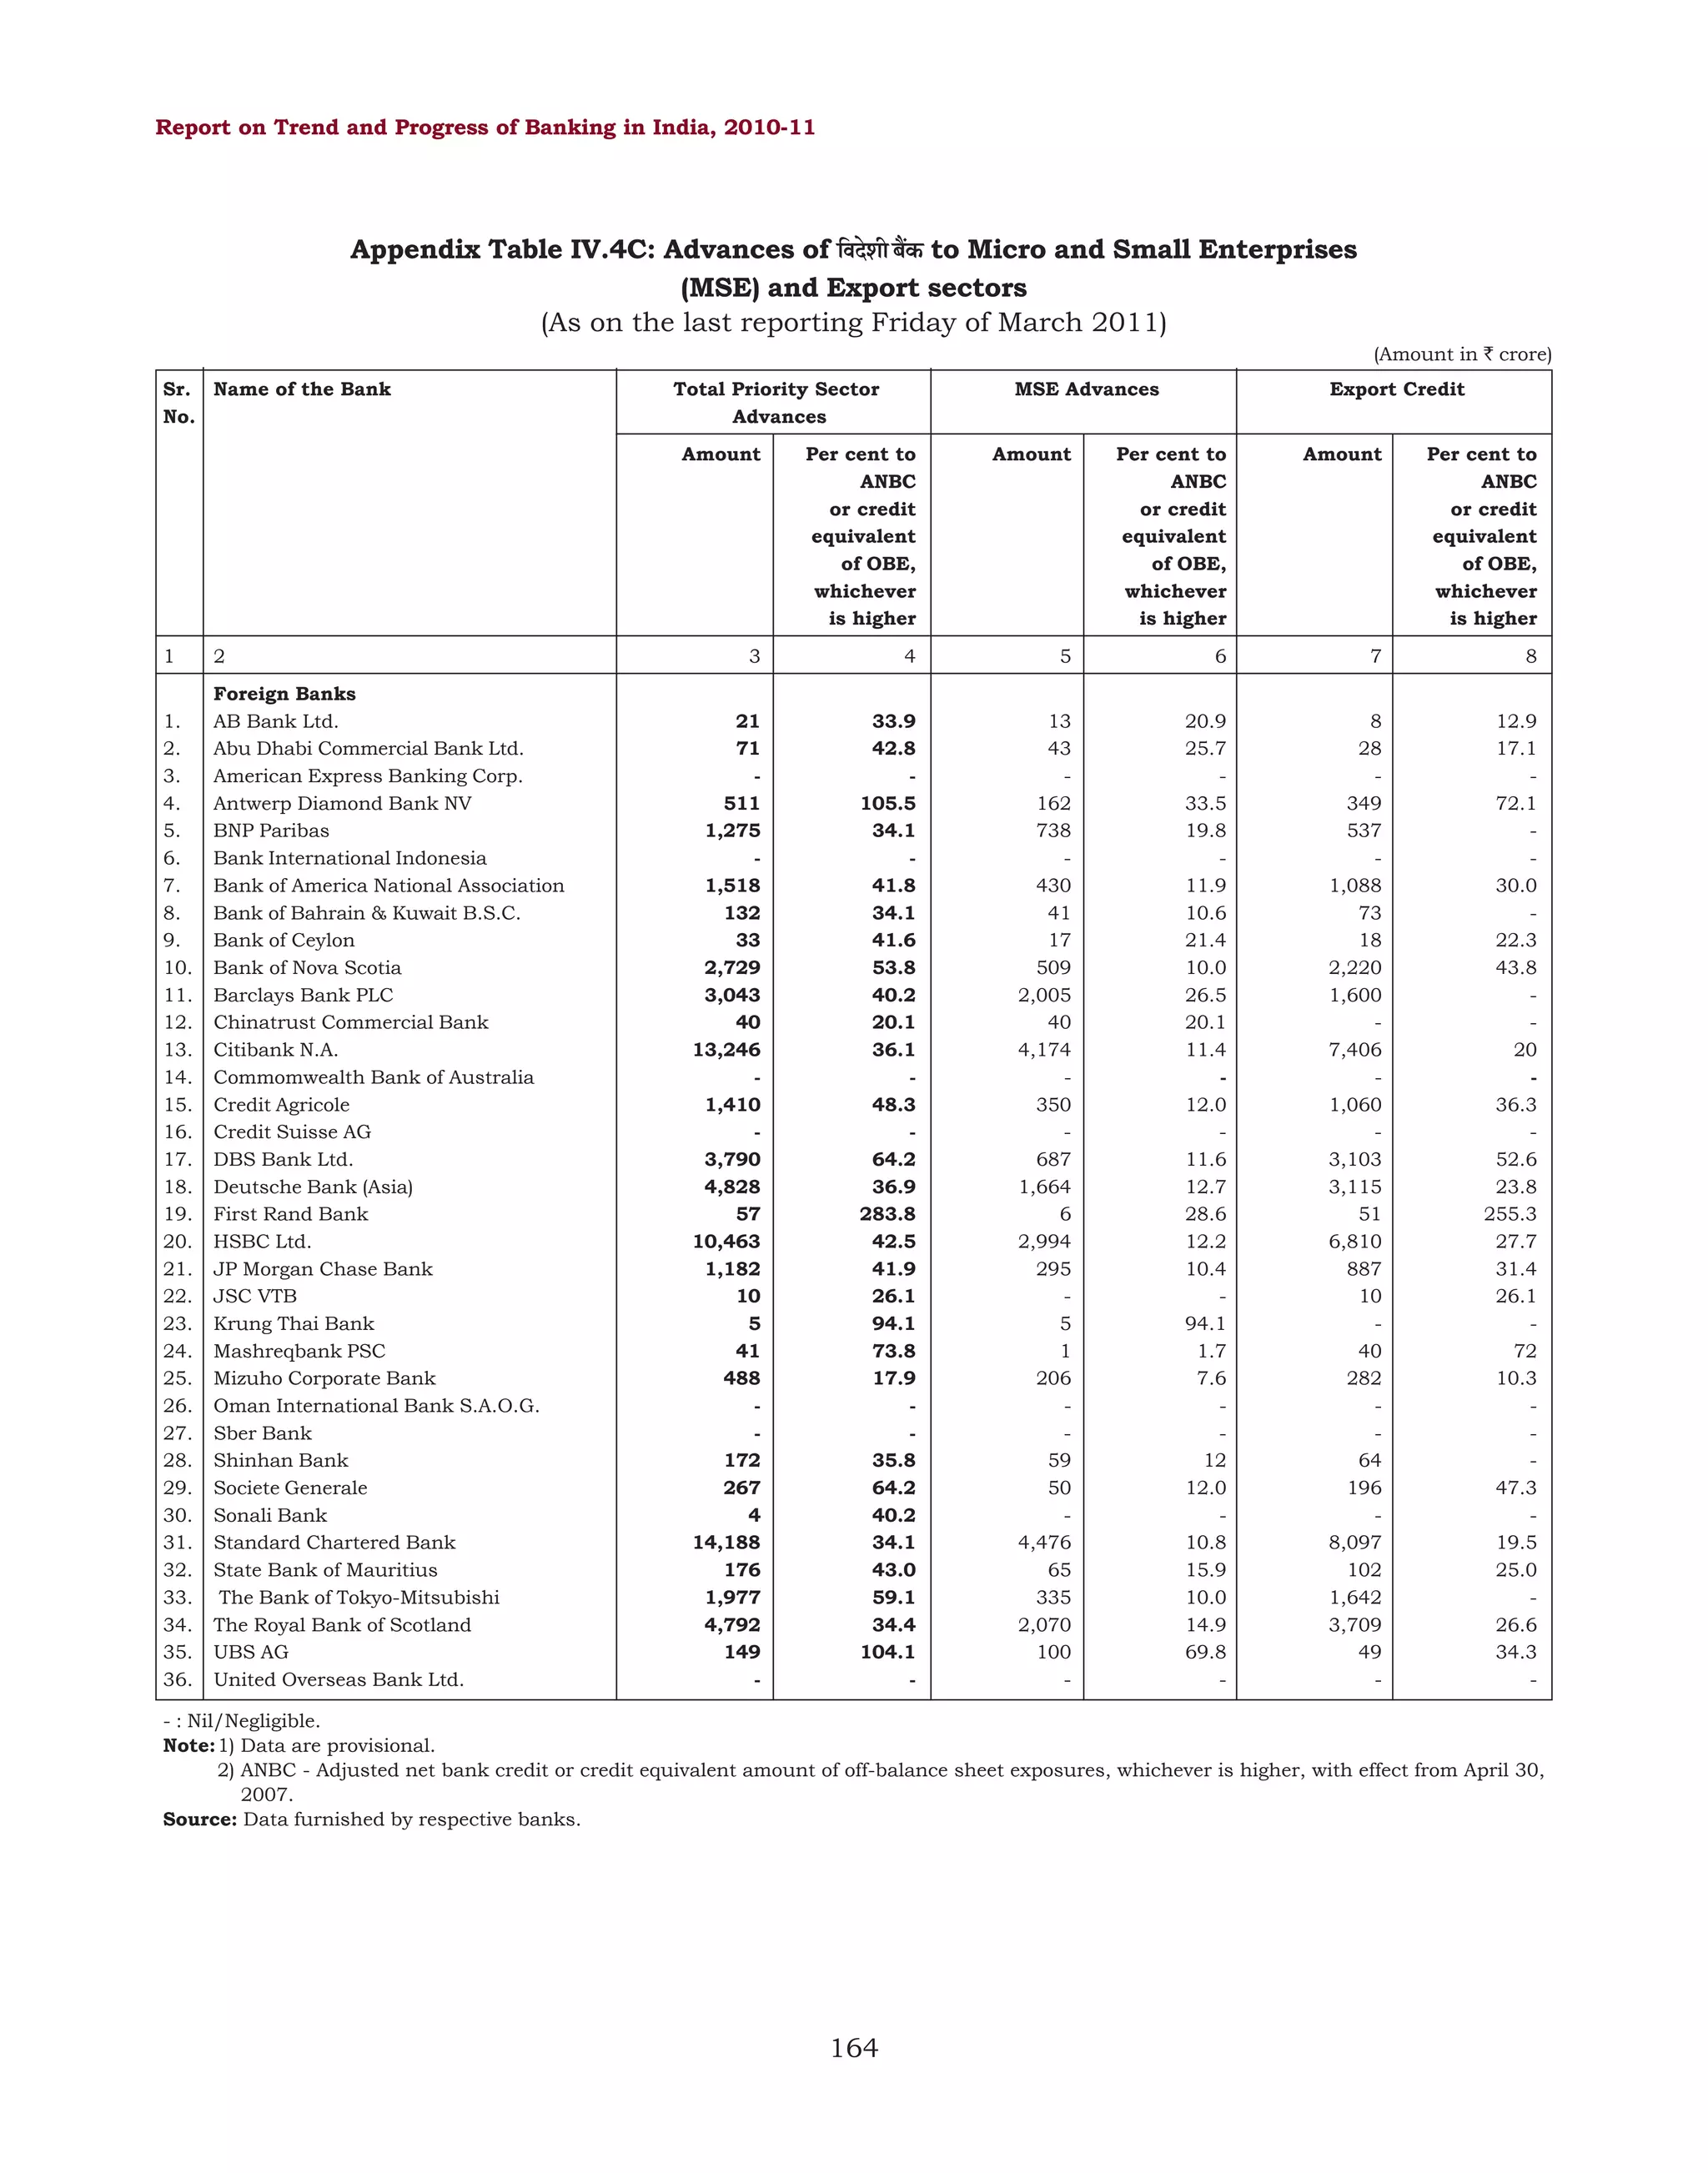
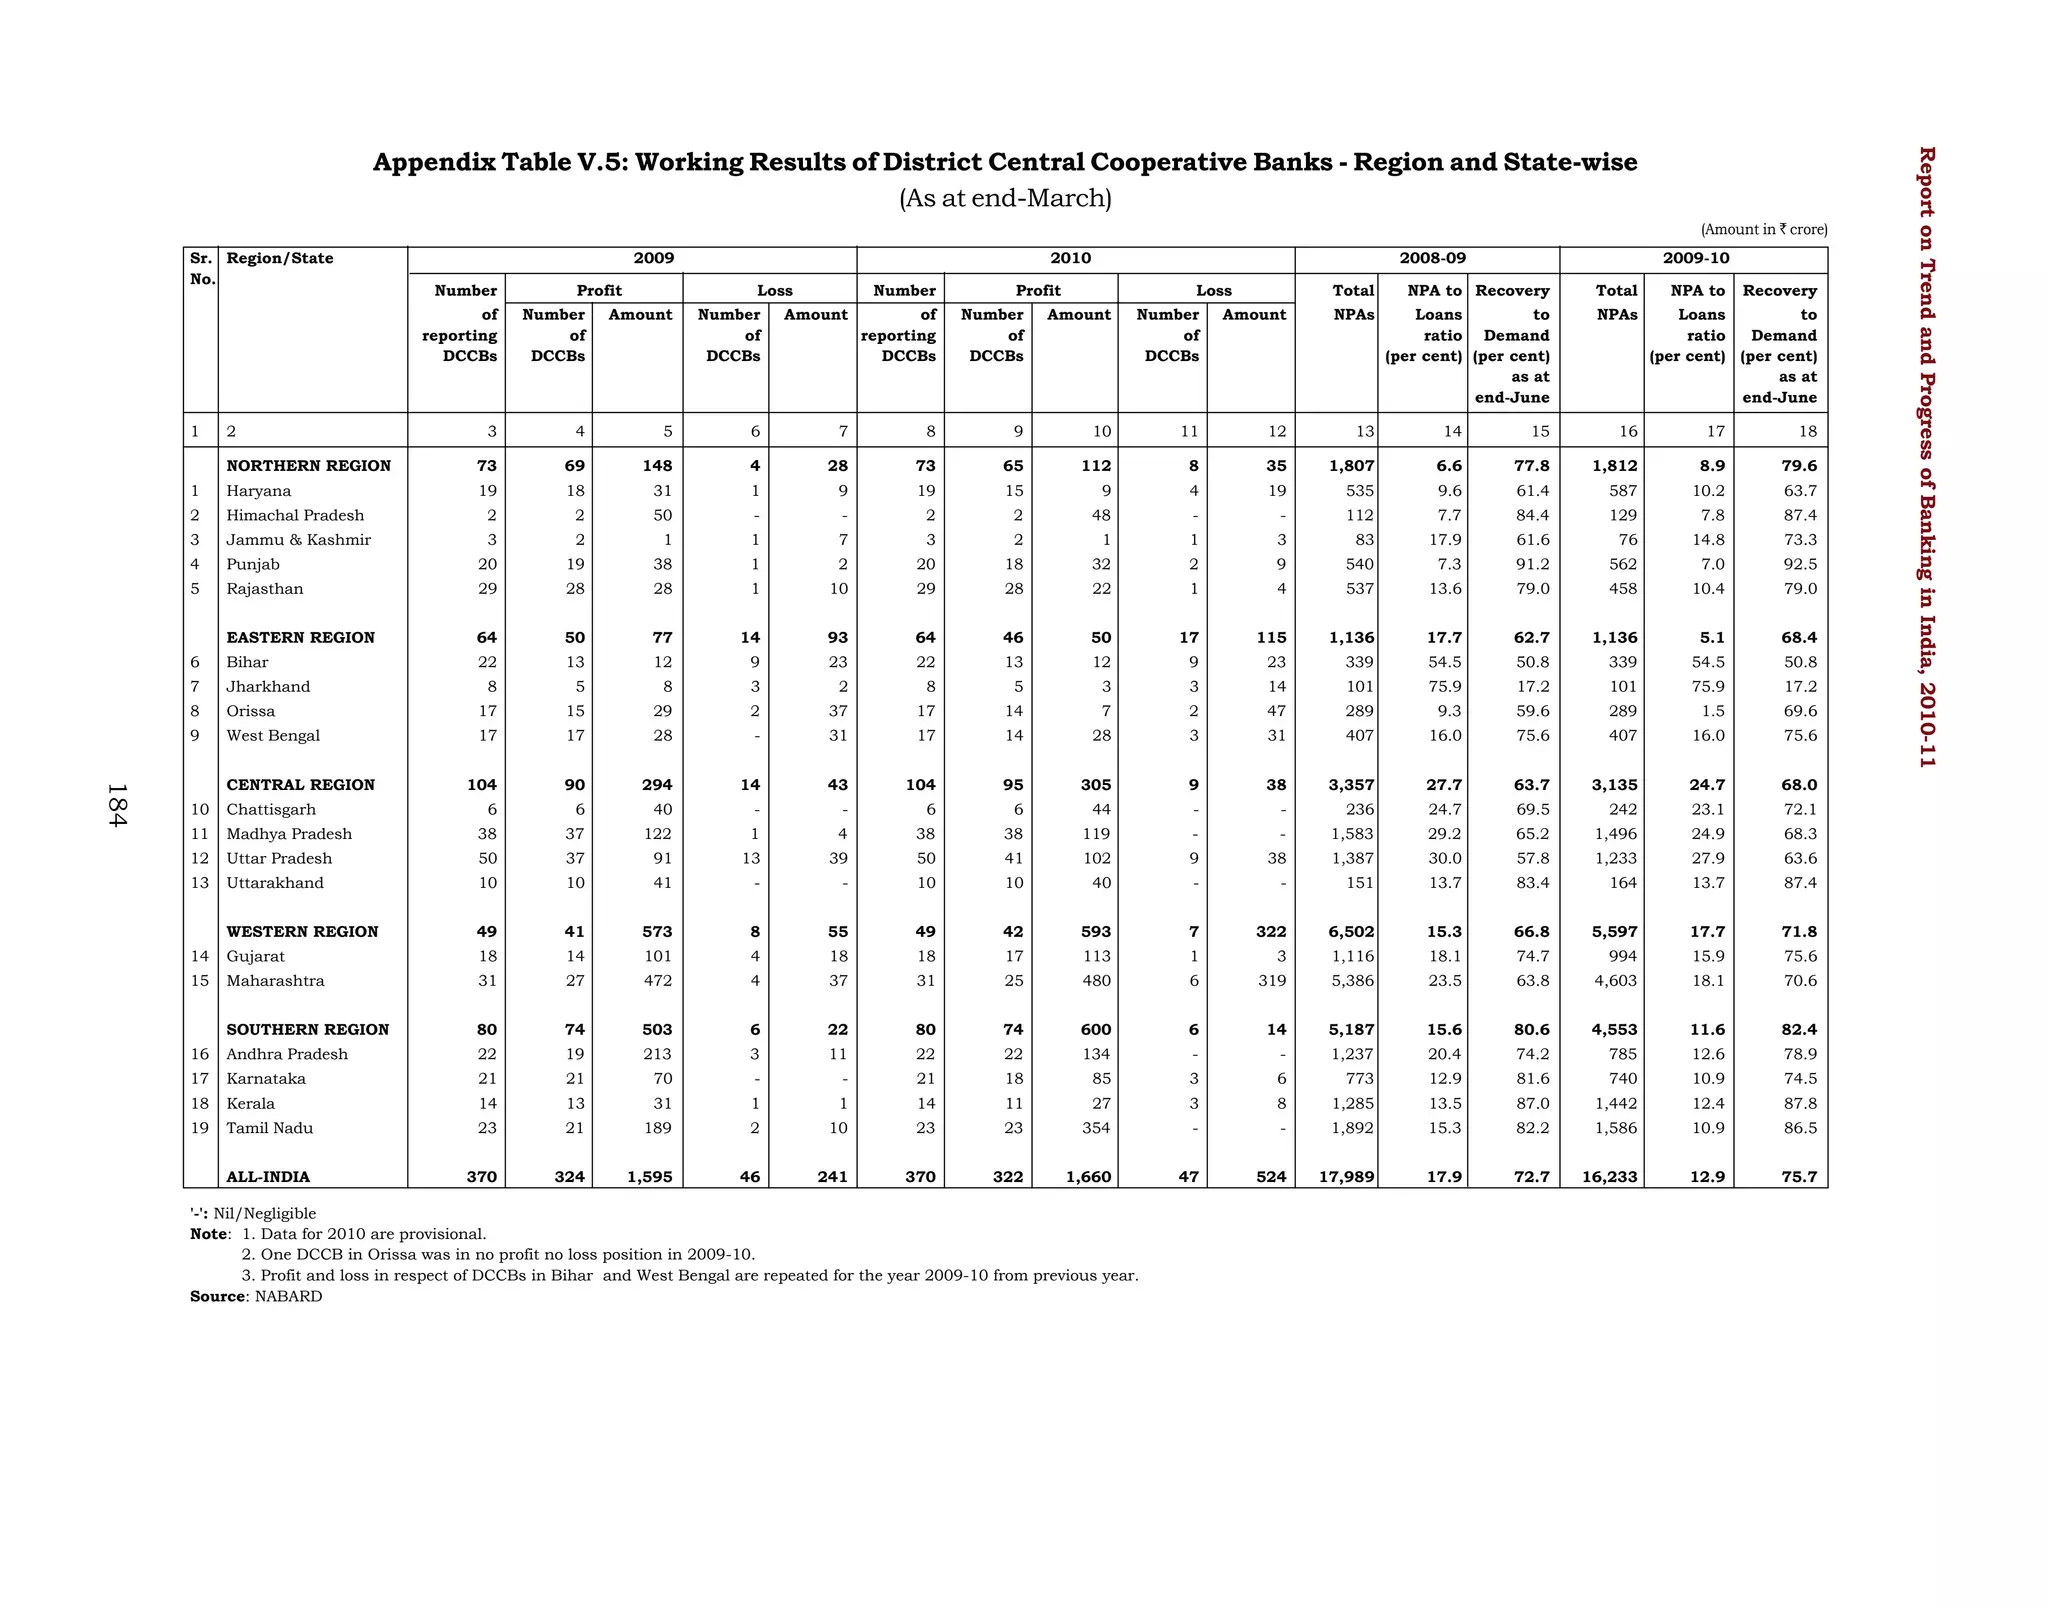
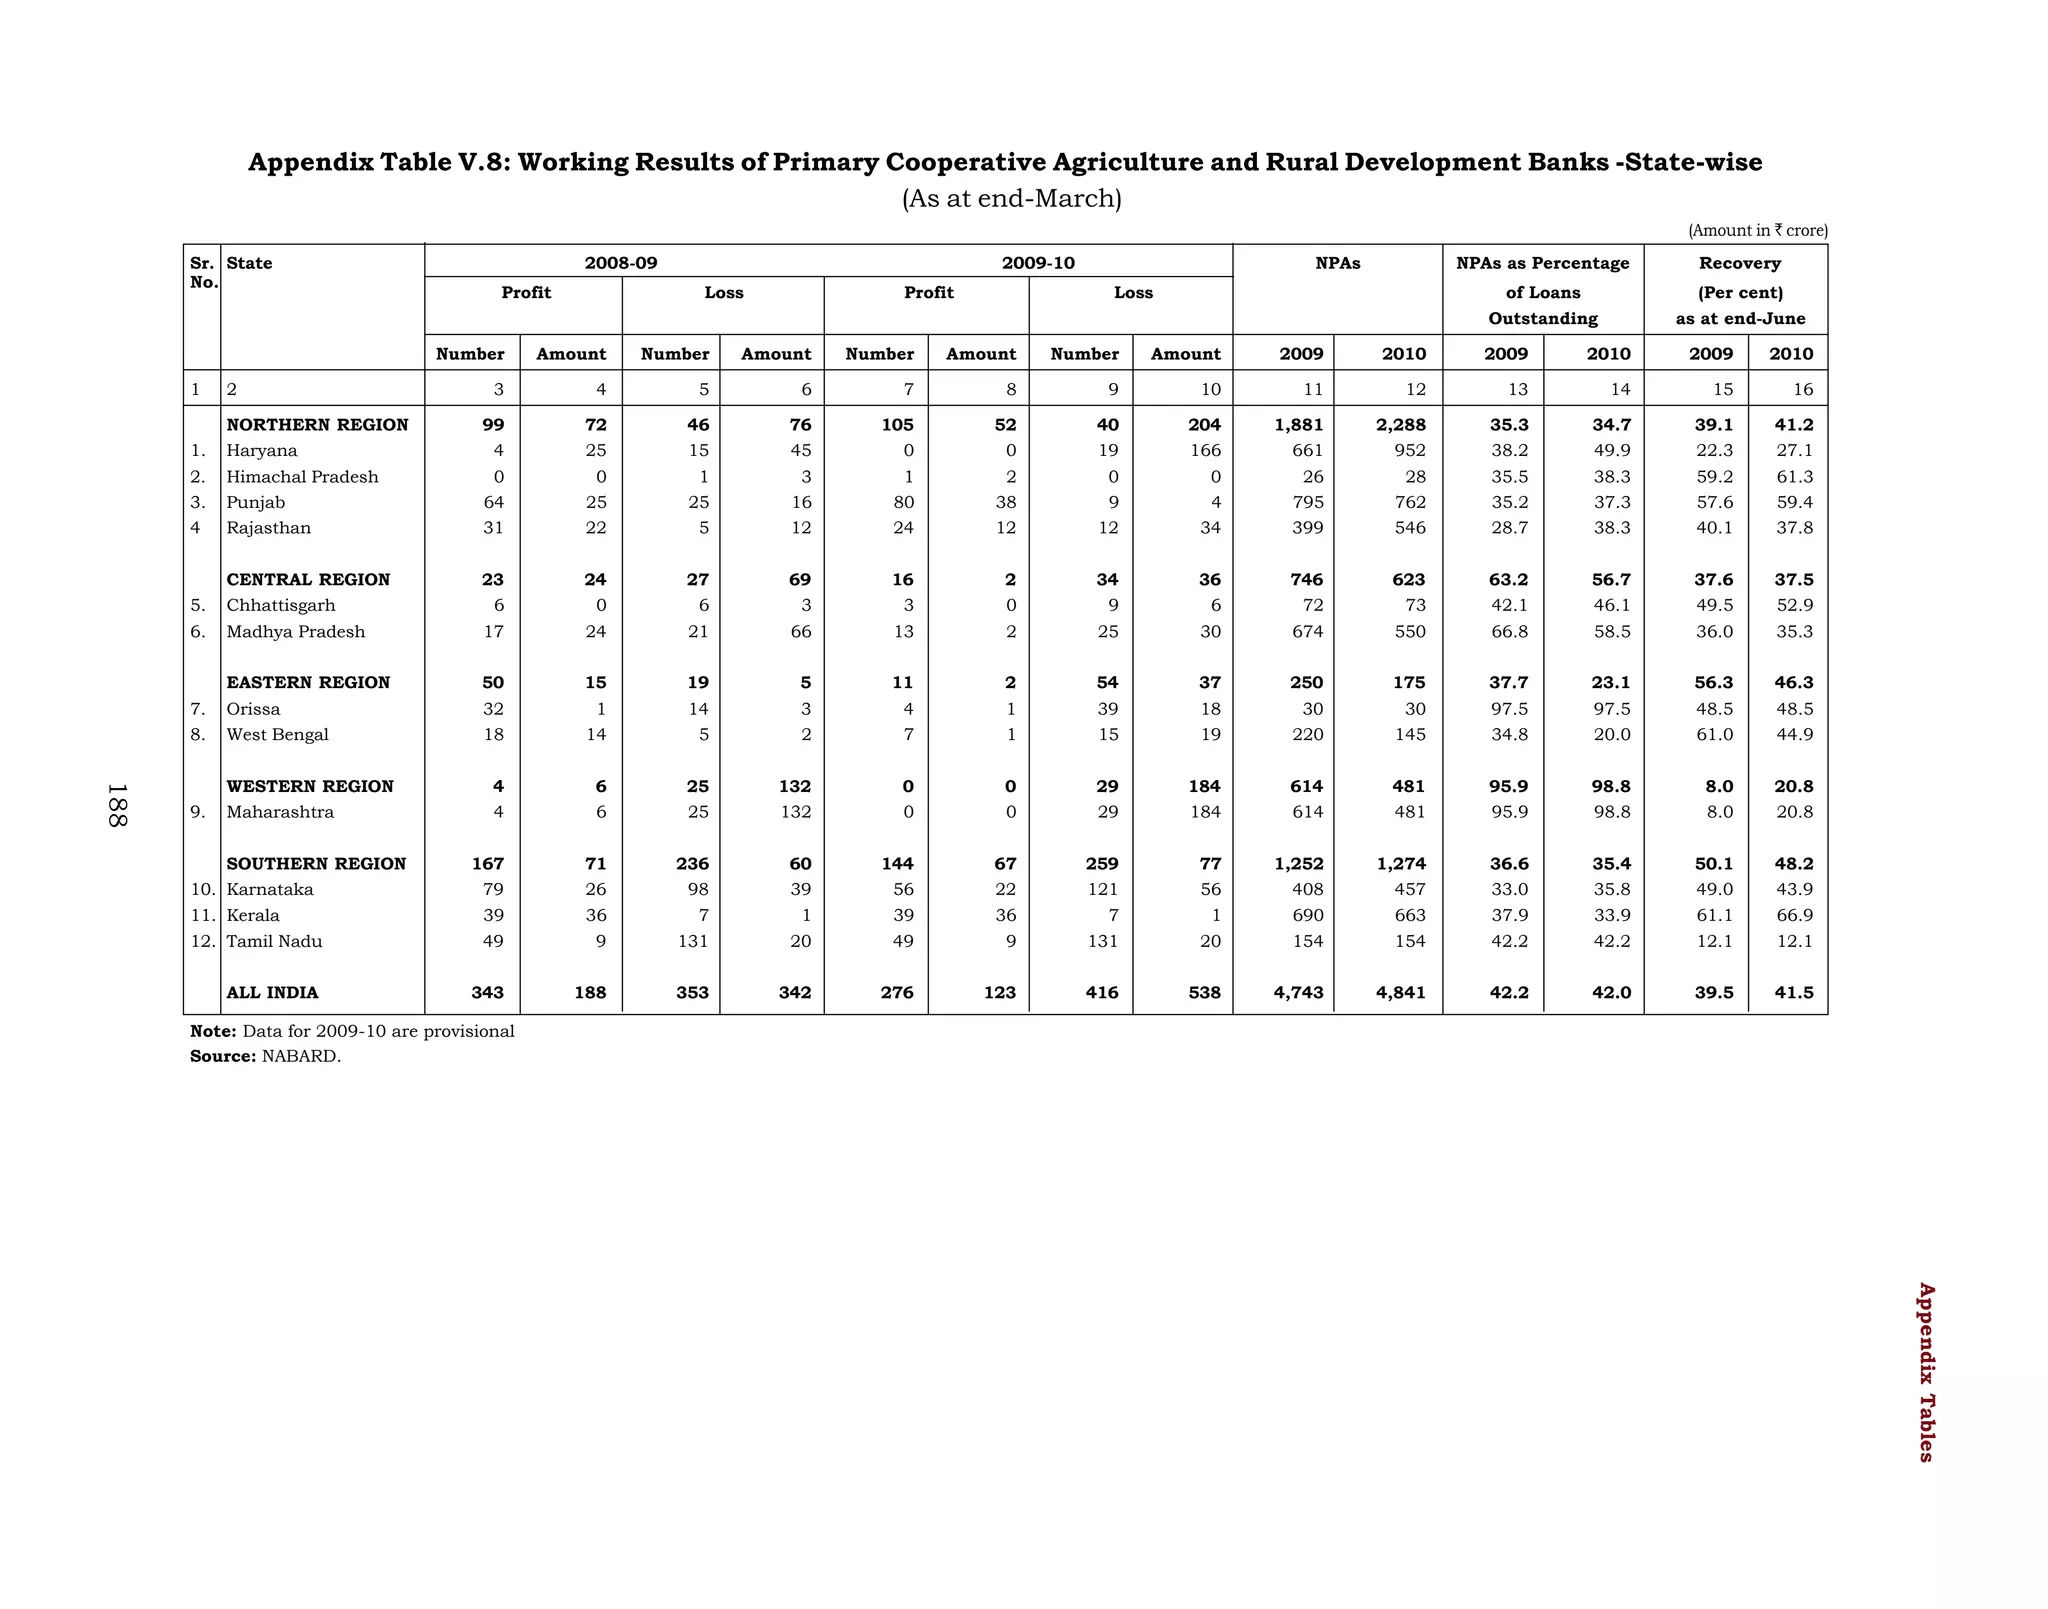
Table IV.39: Number of ATMs of SCBs Located
at Various Locations
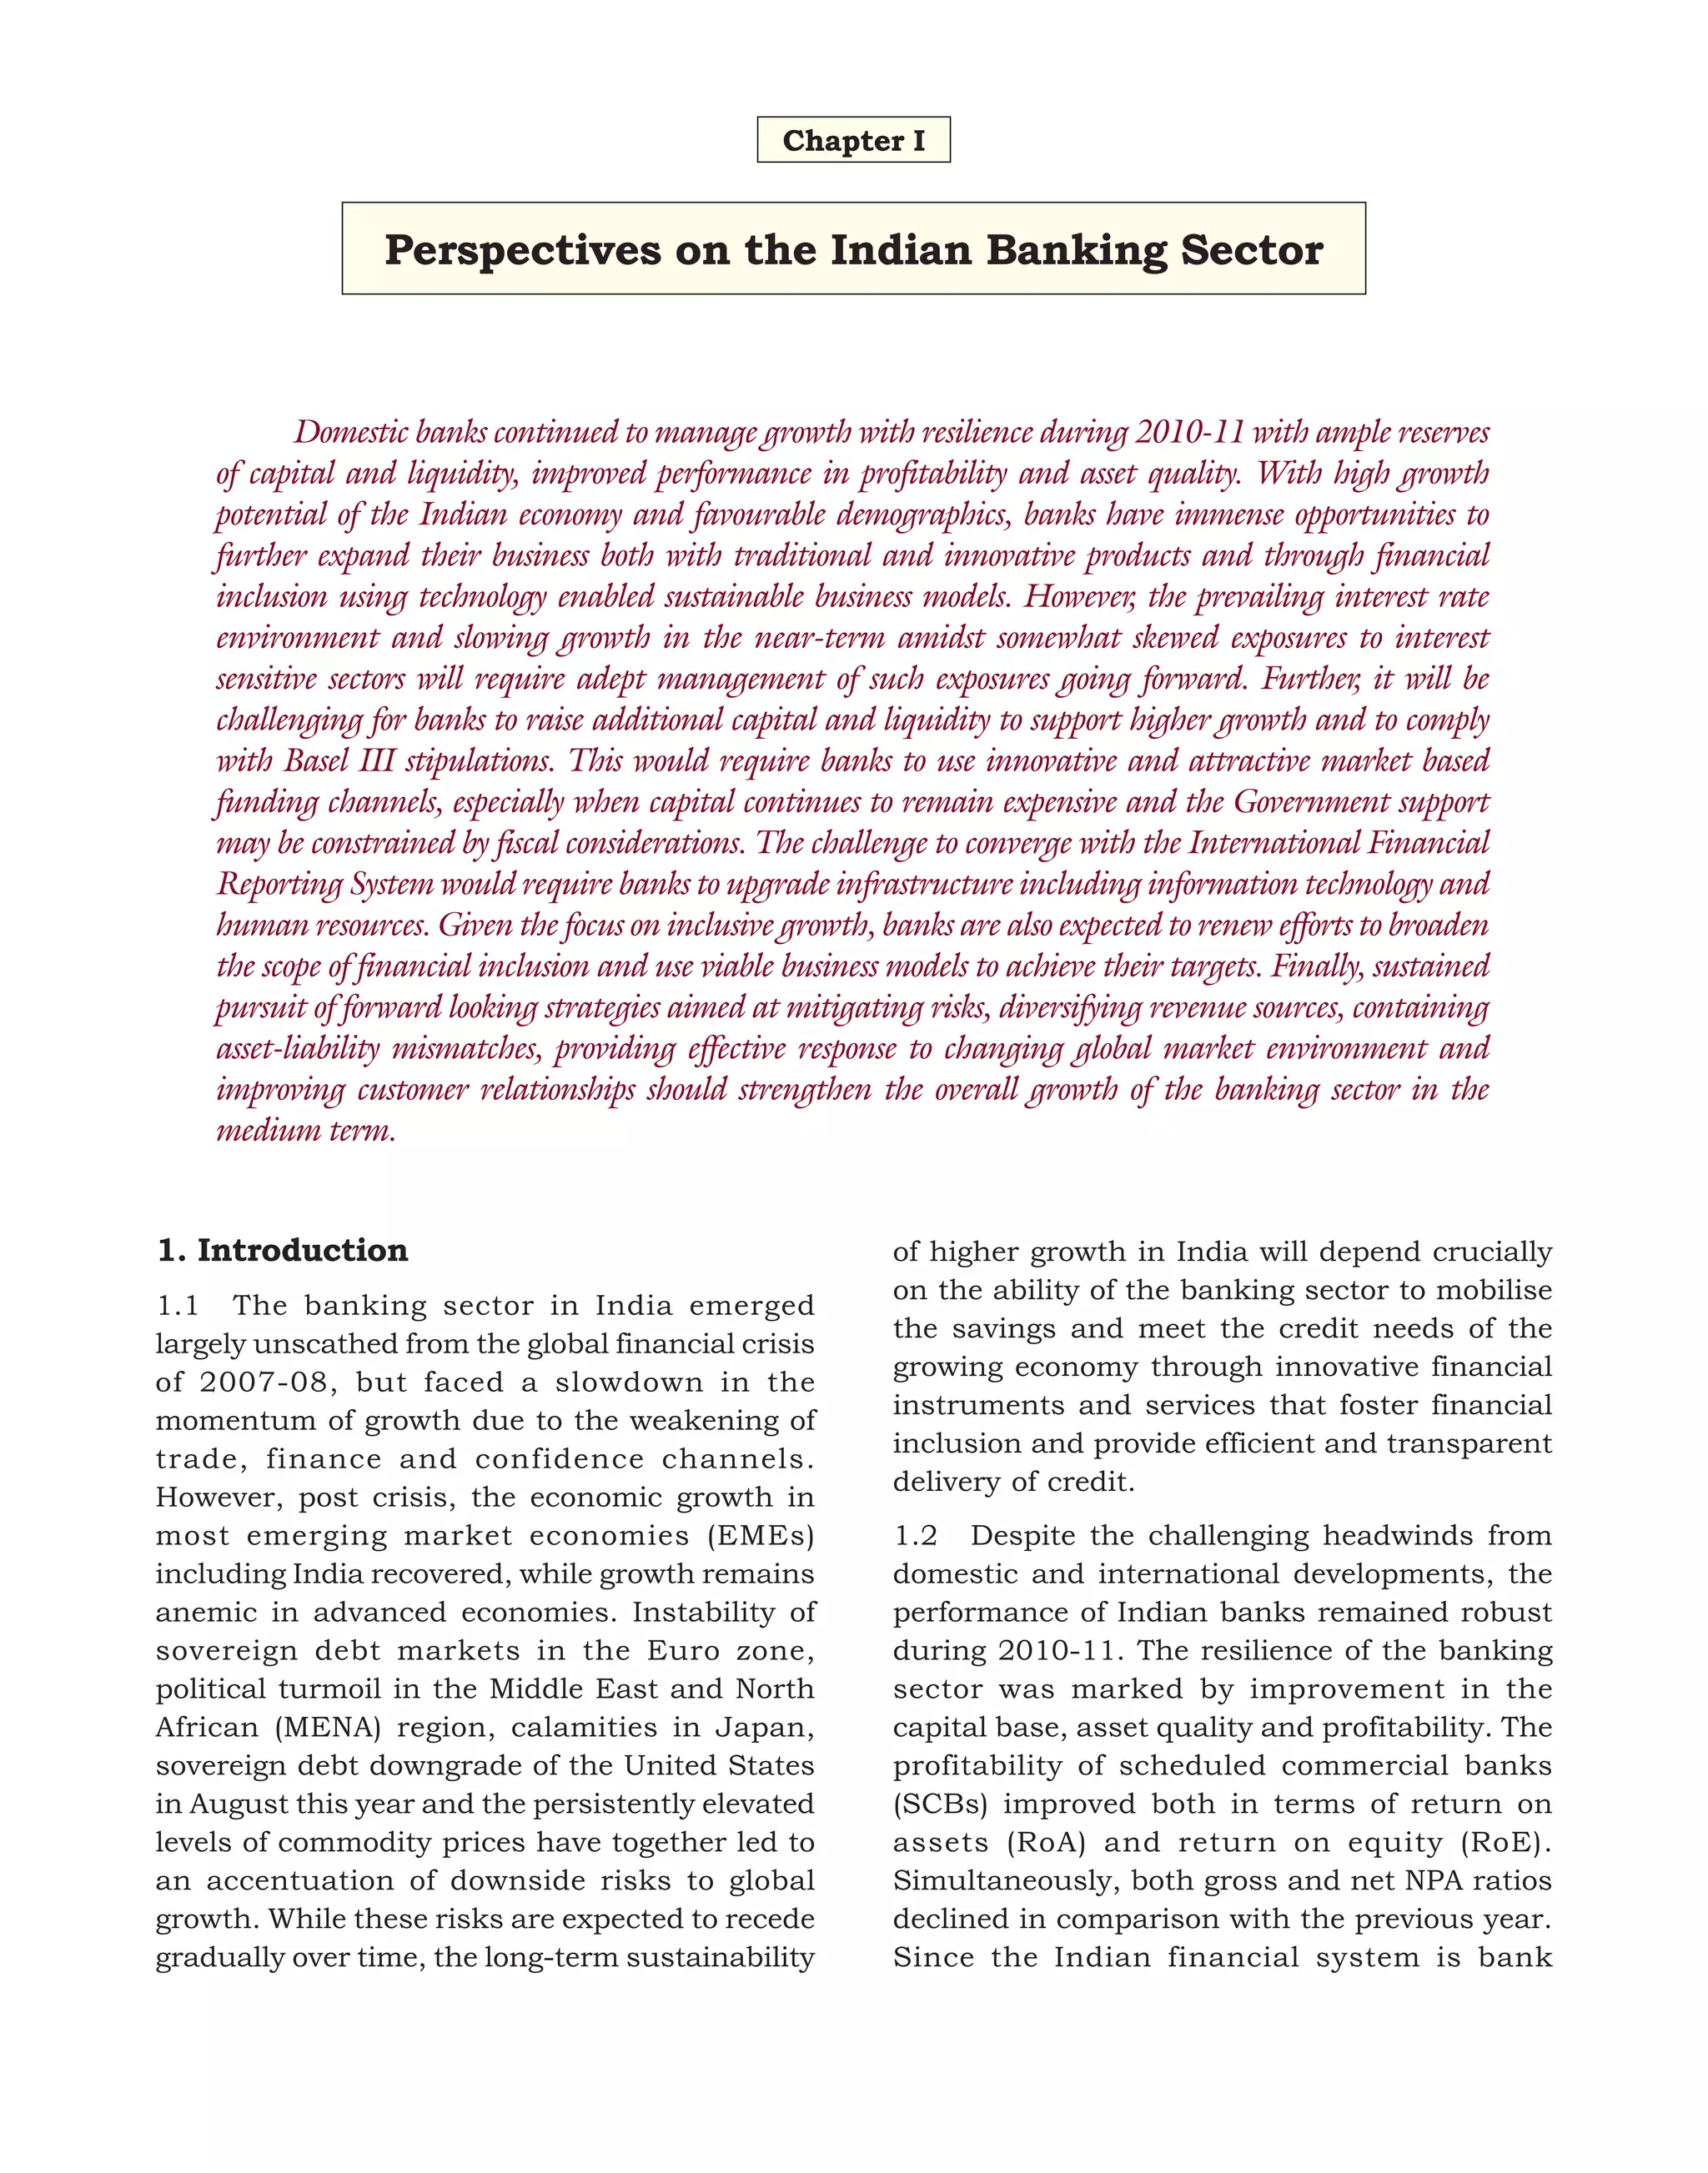
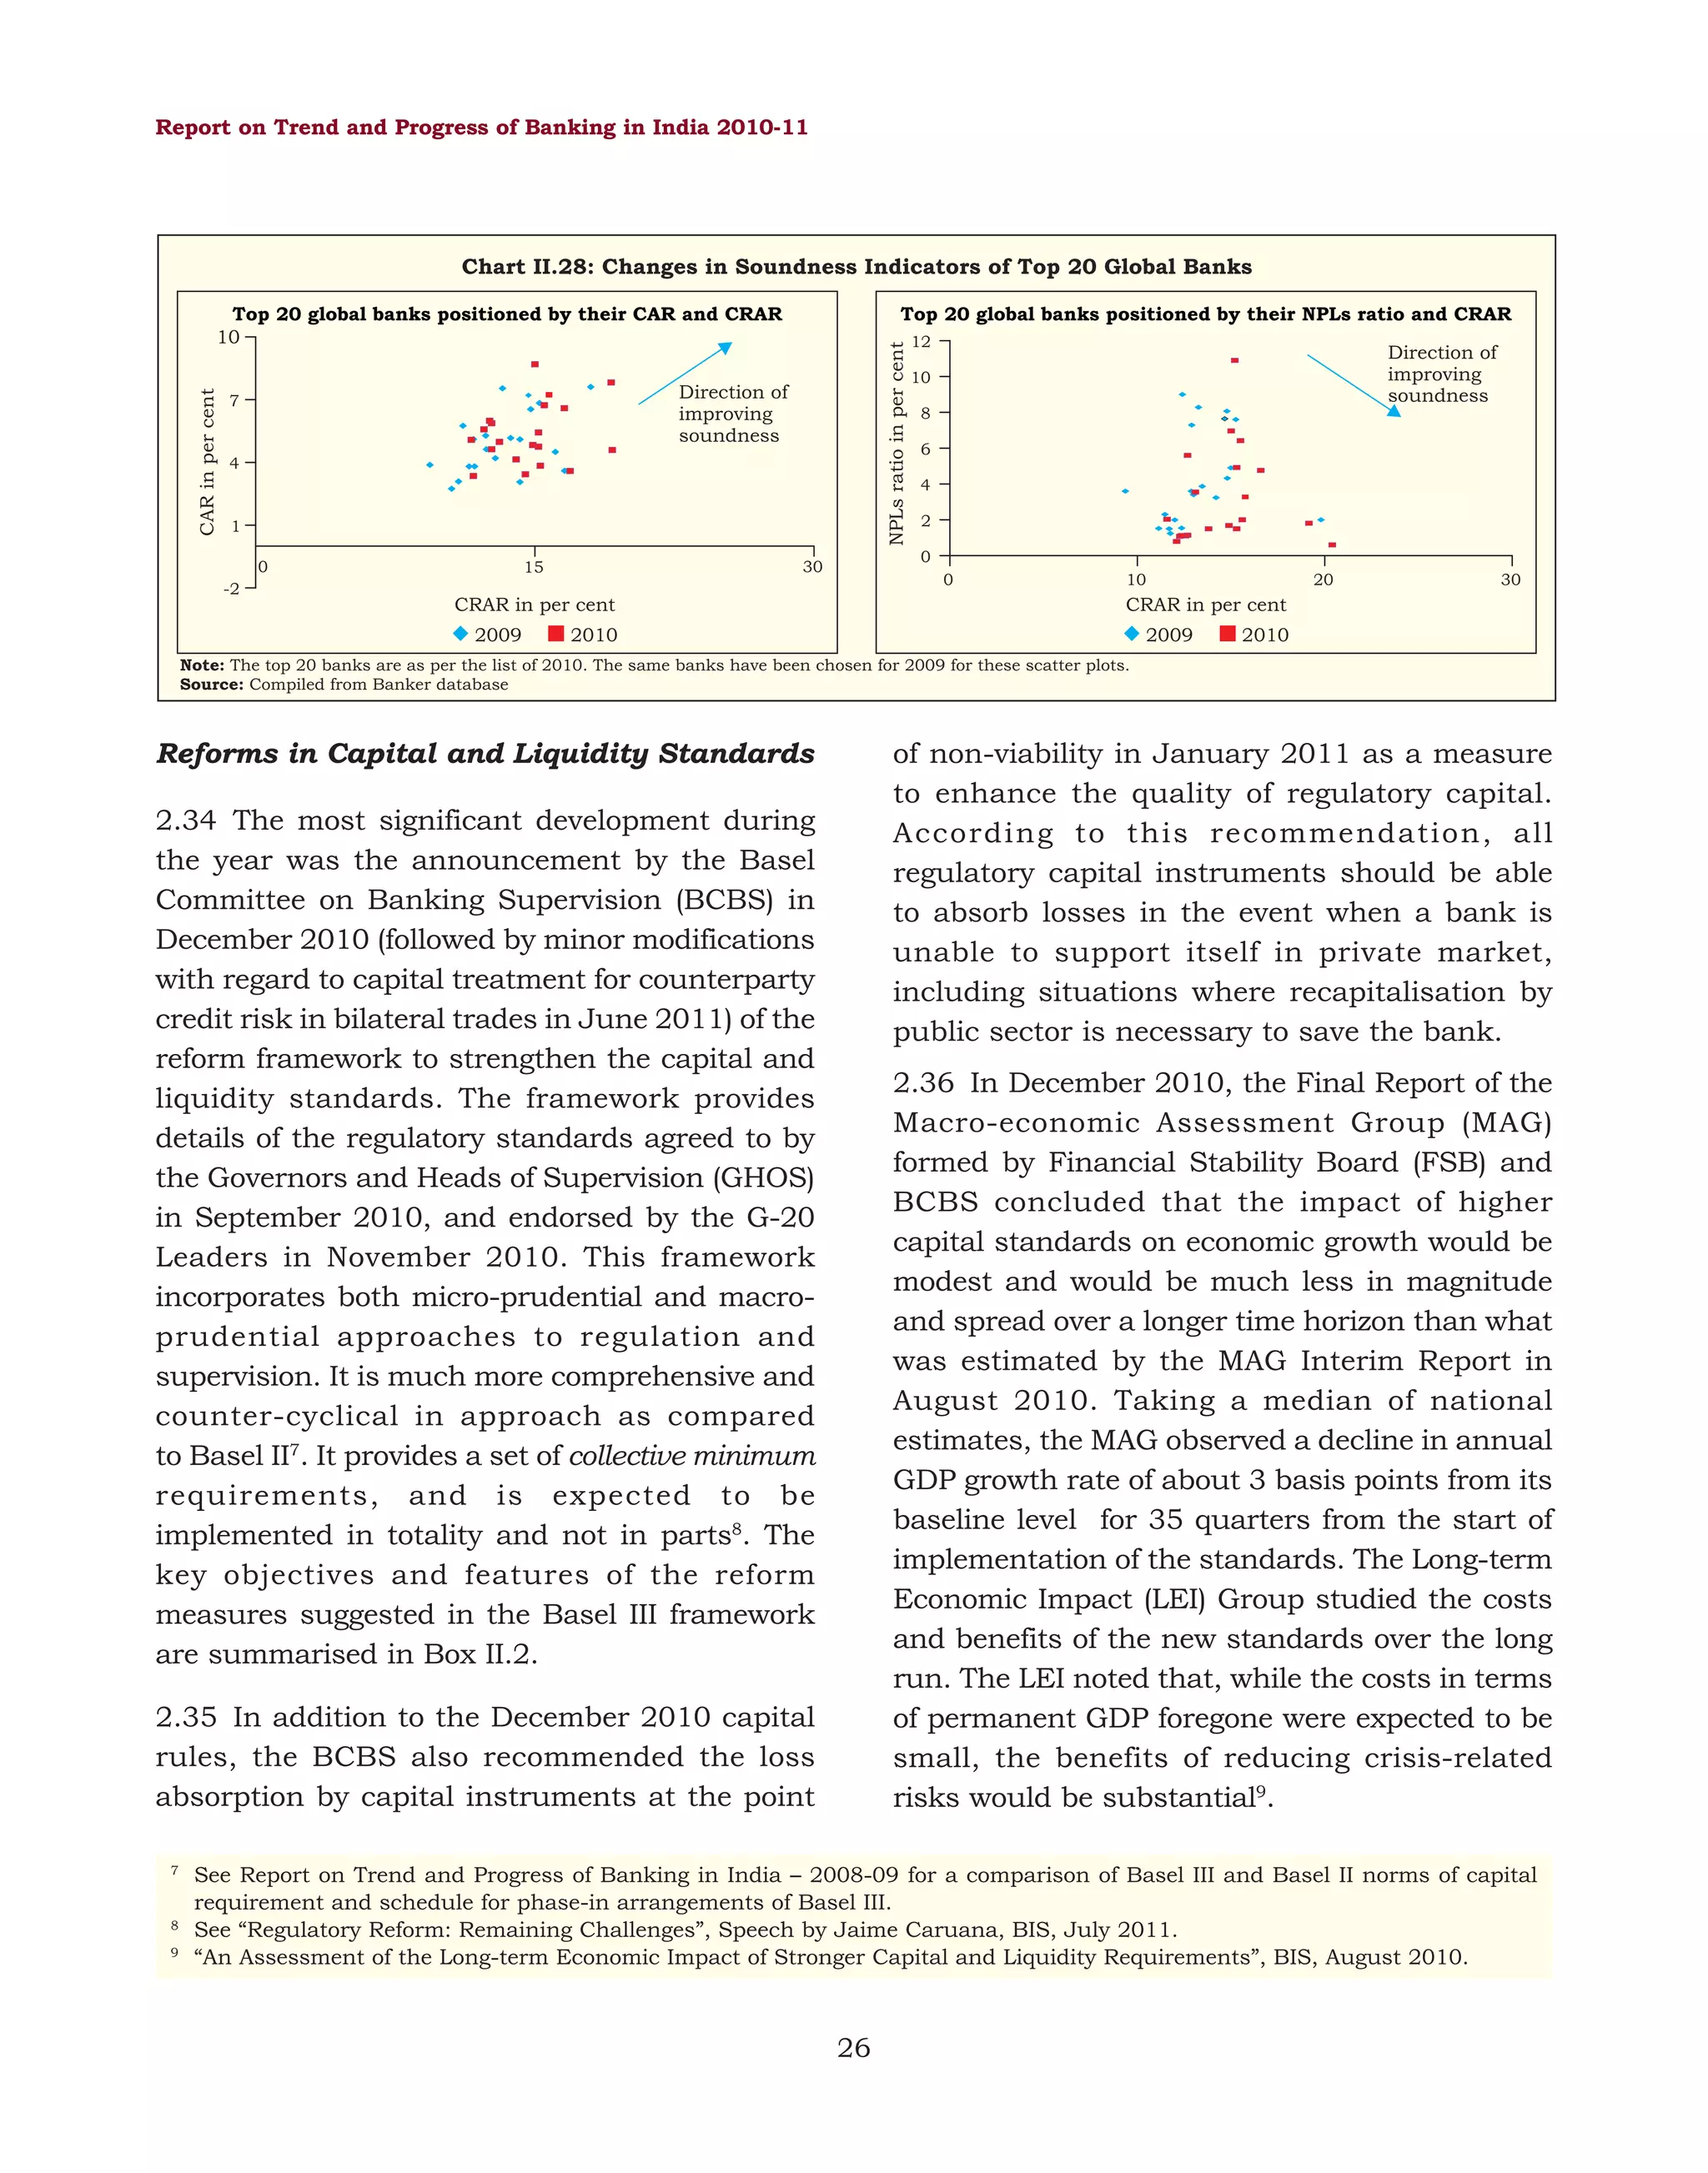
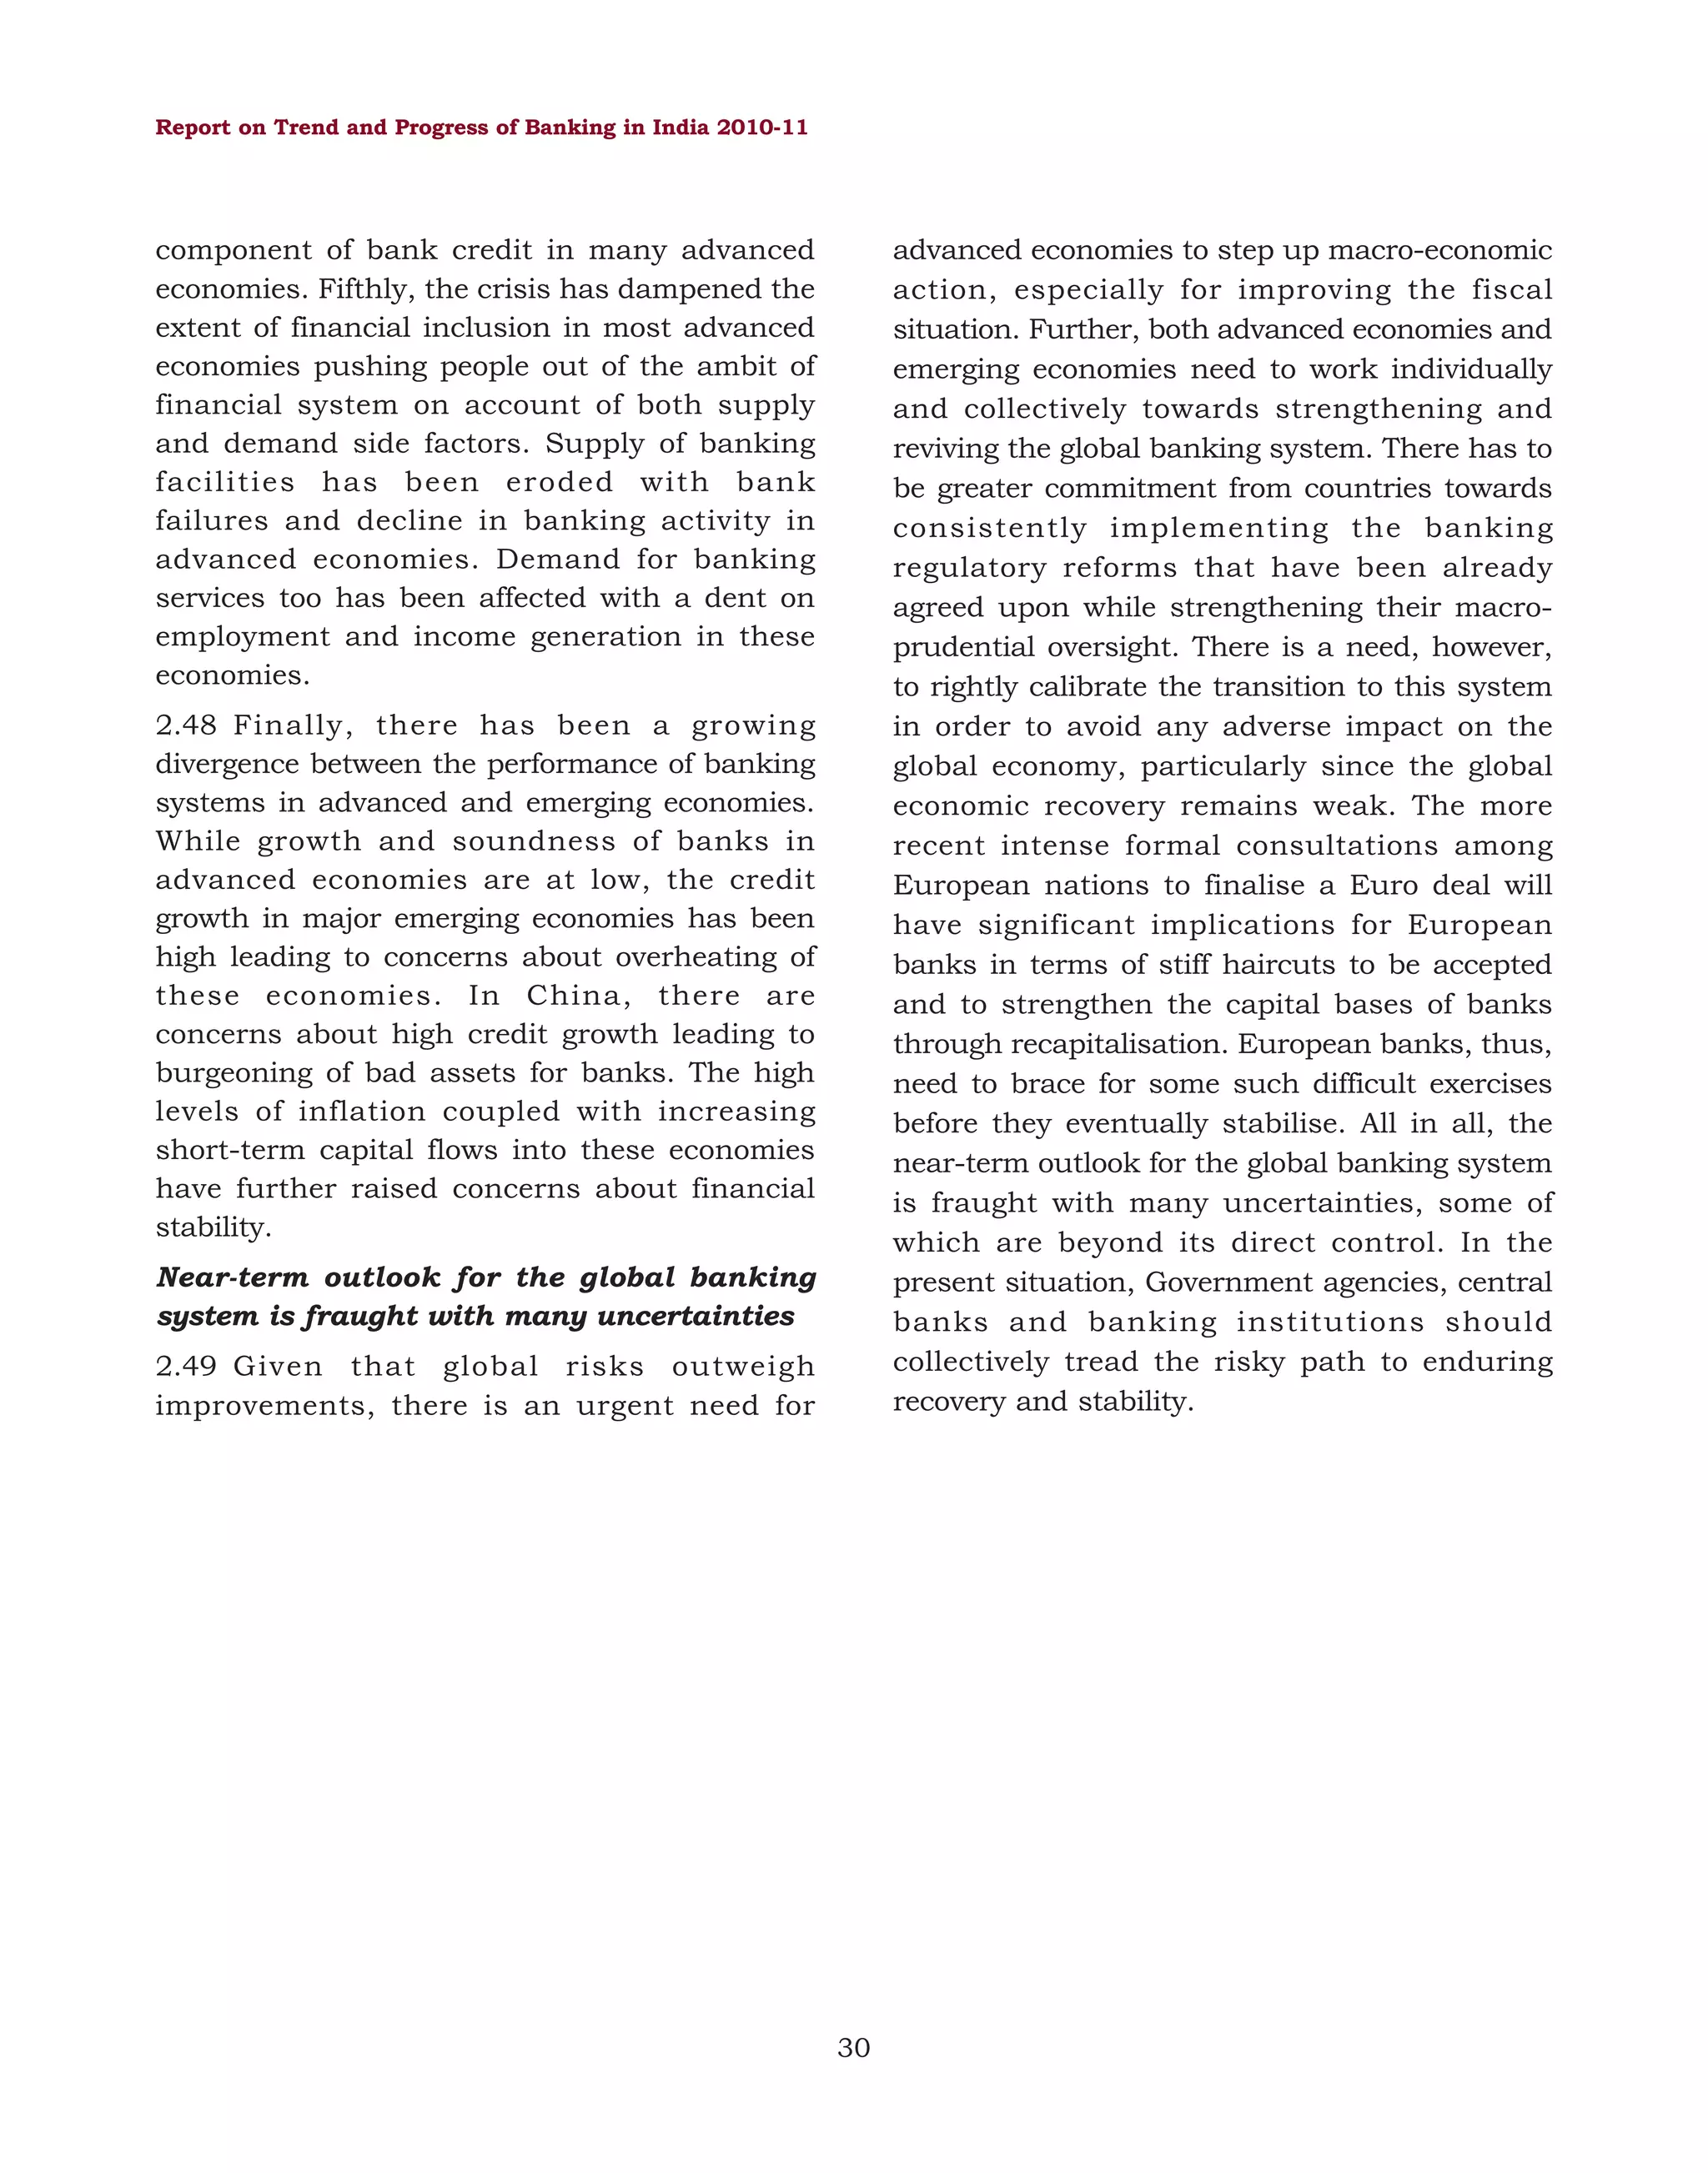
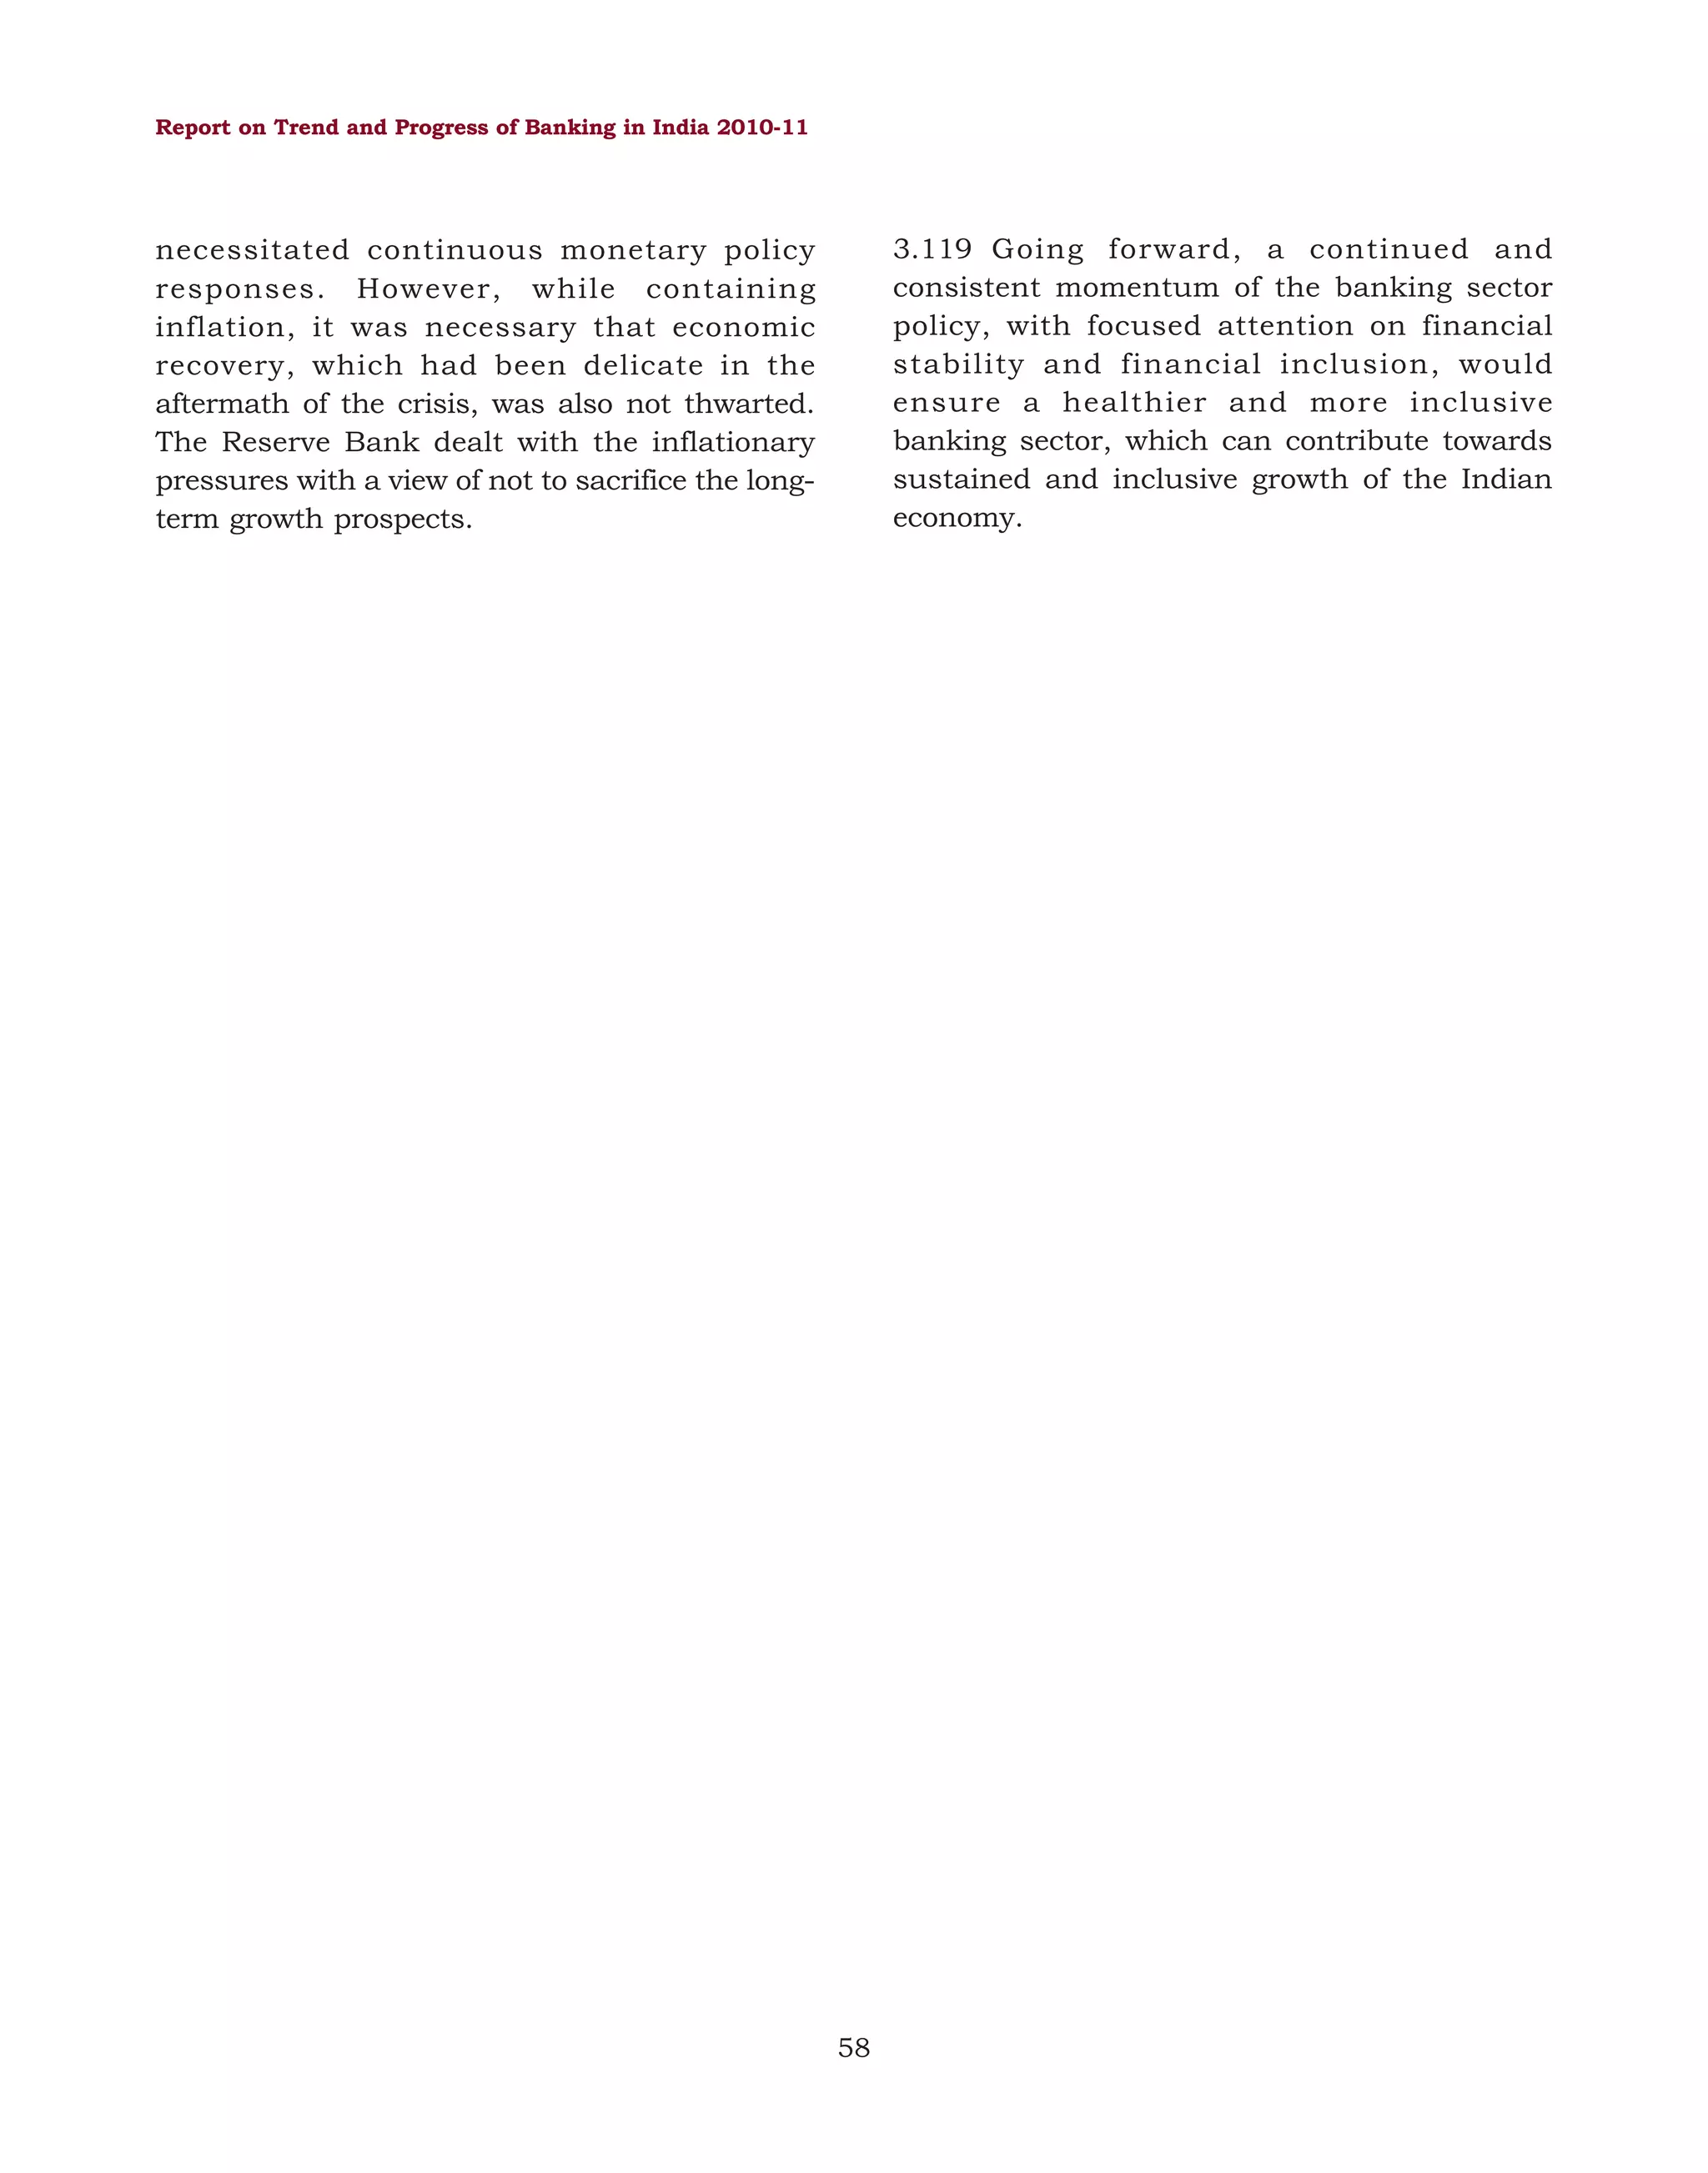
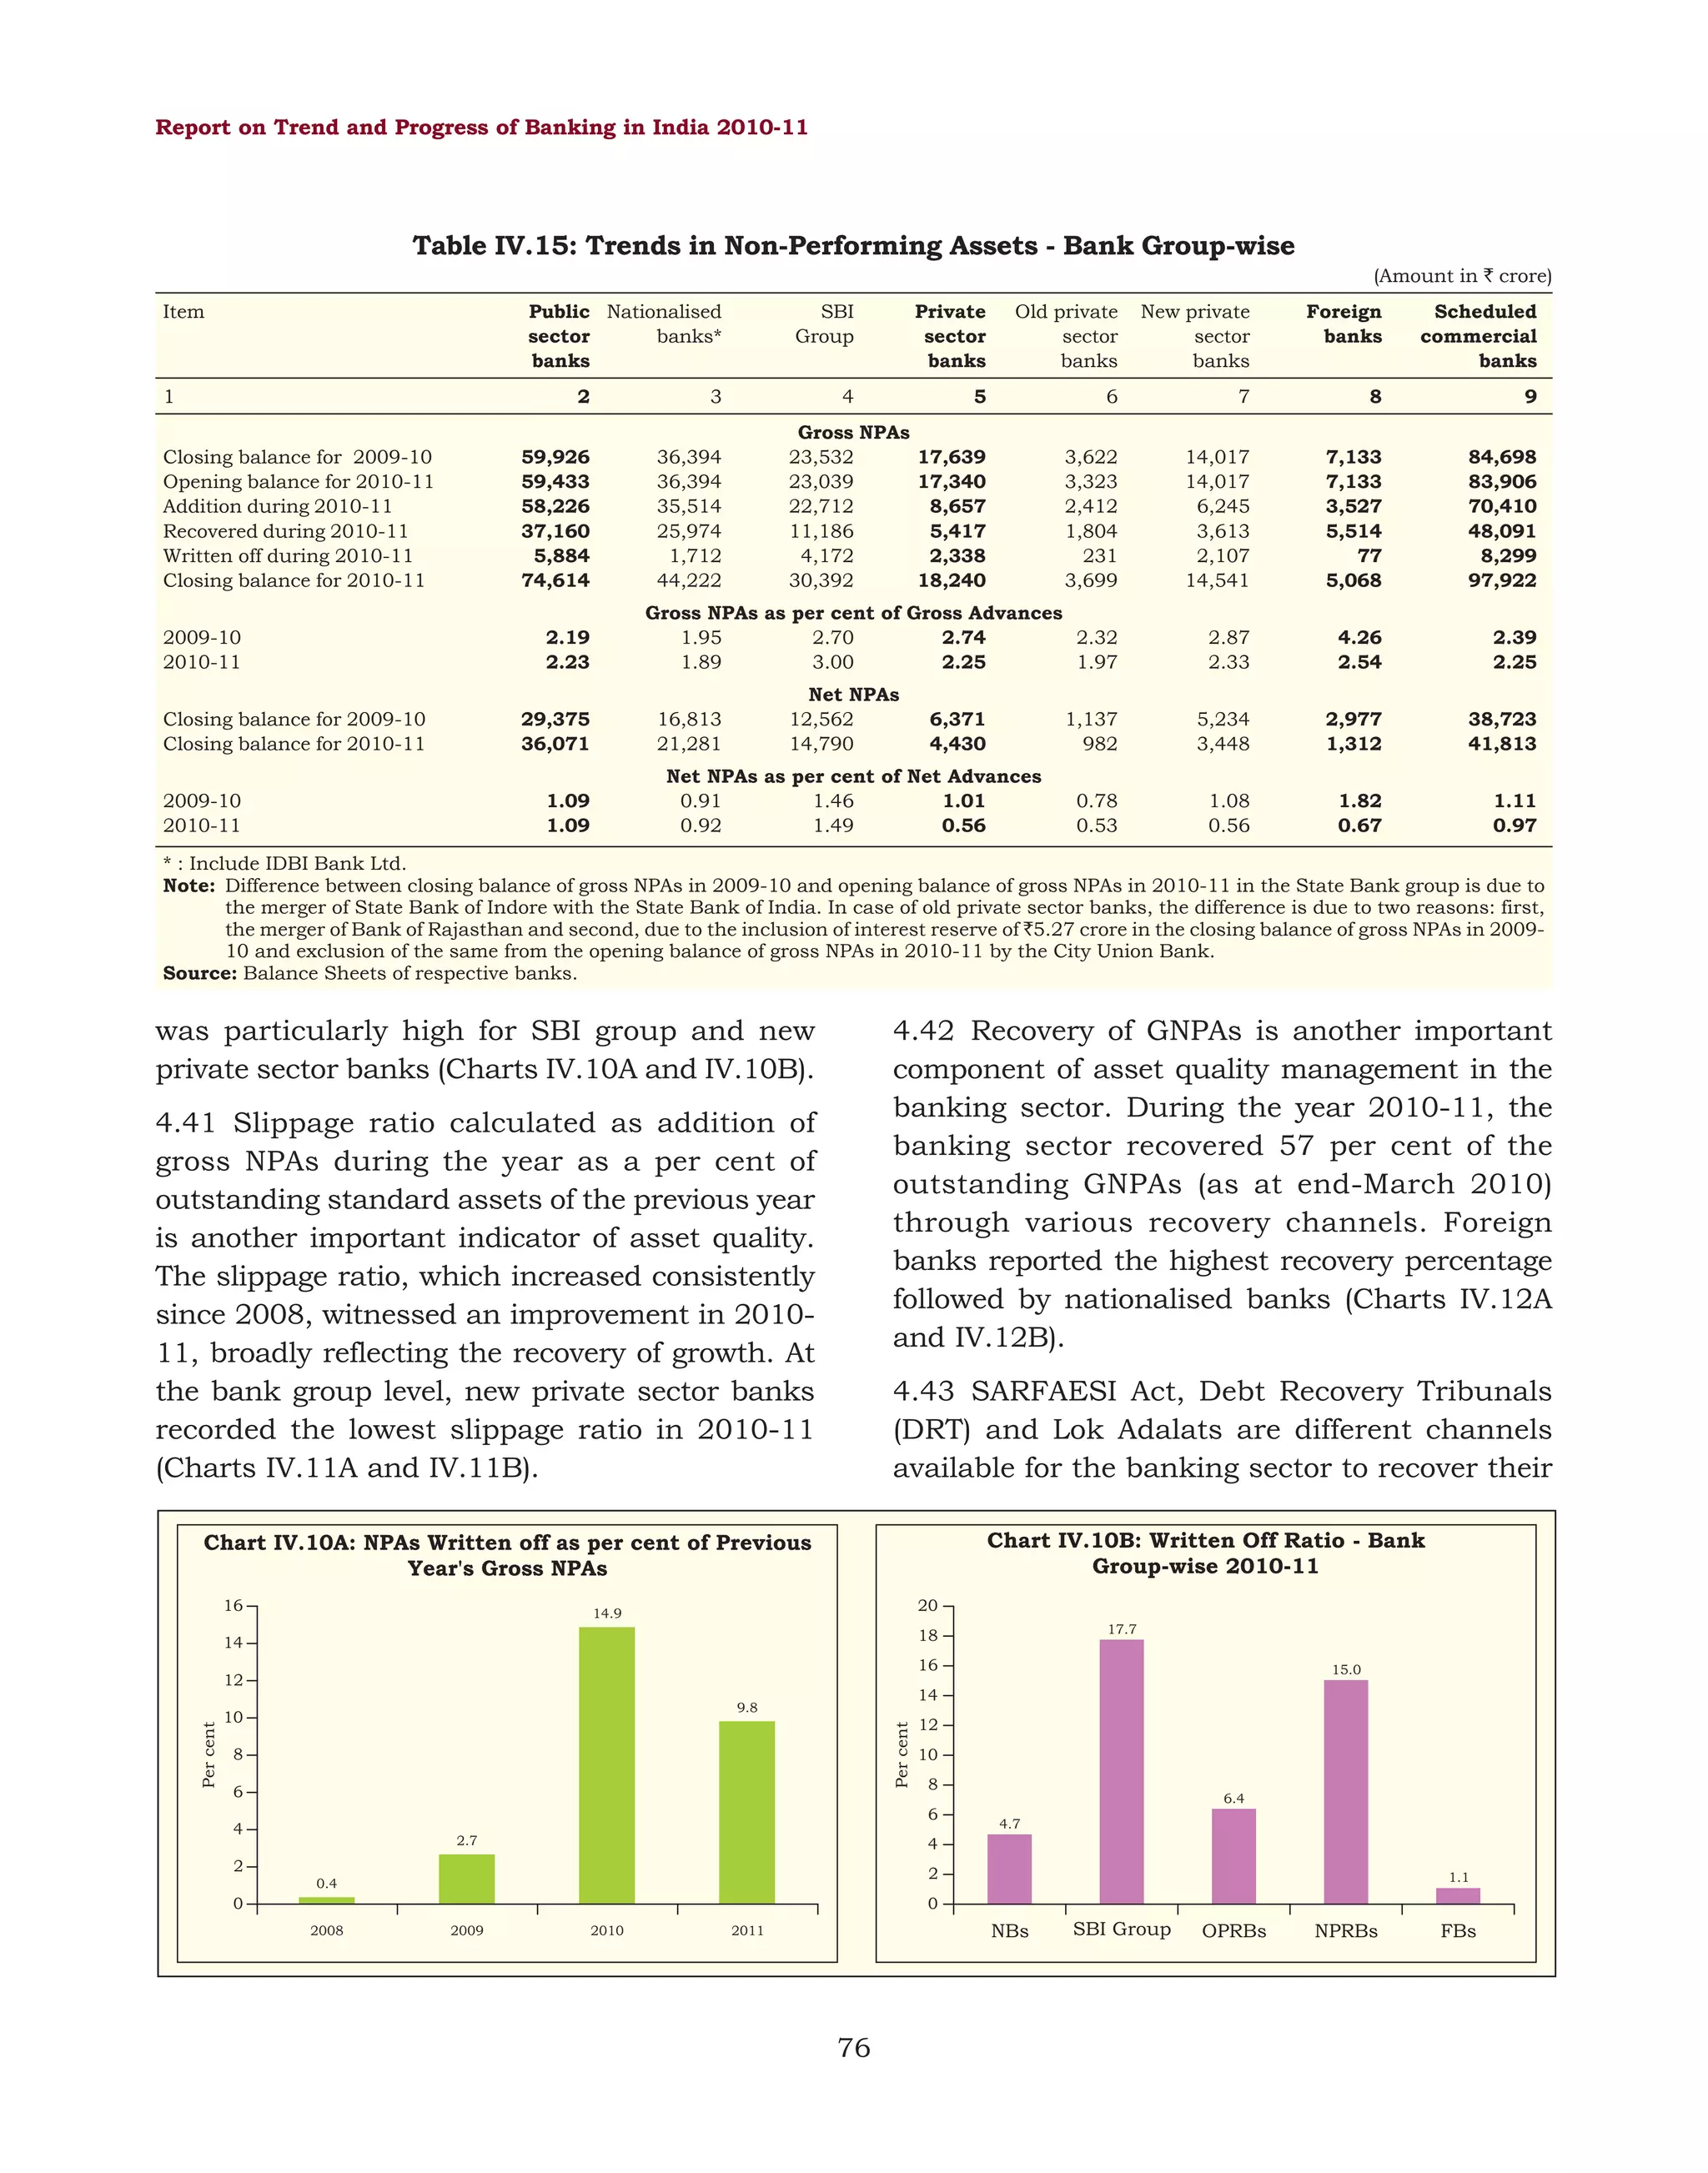
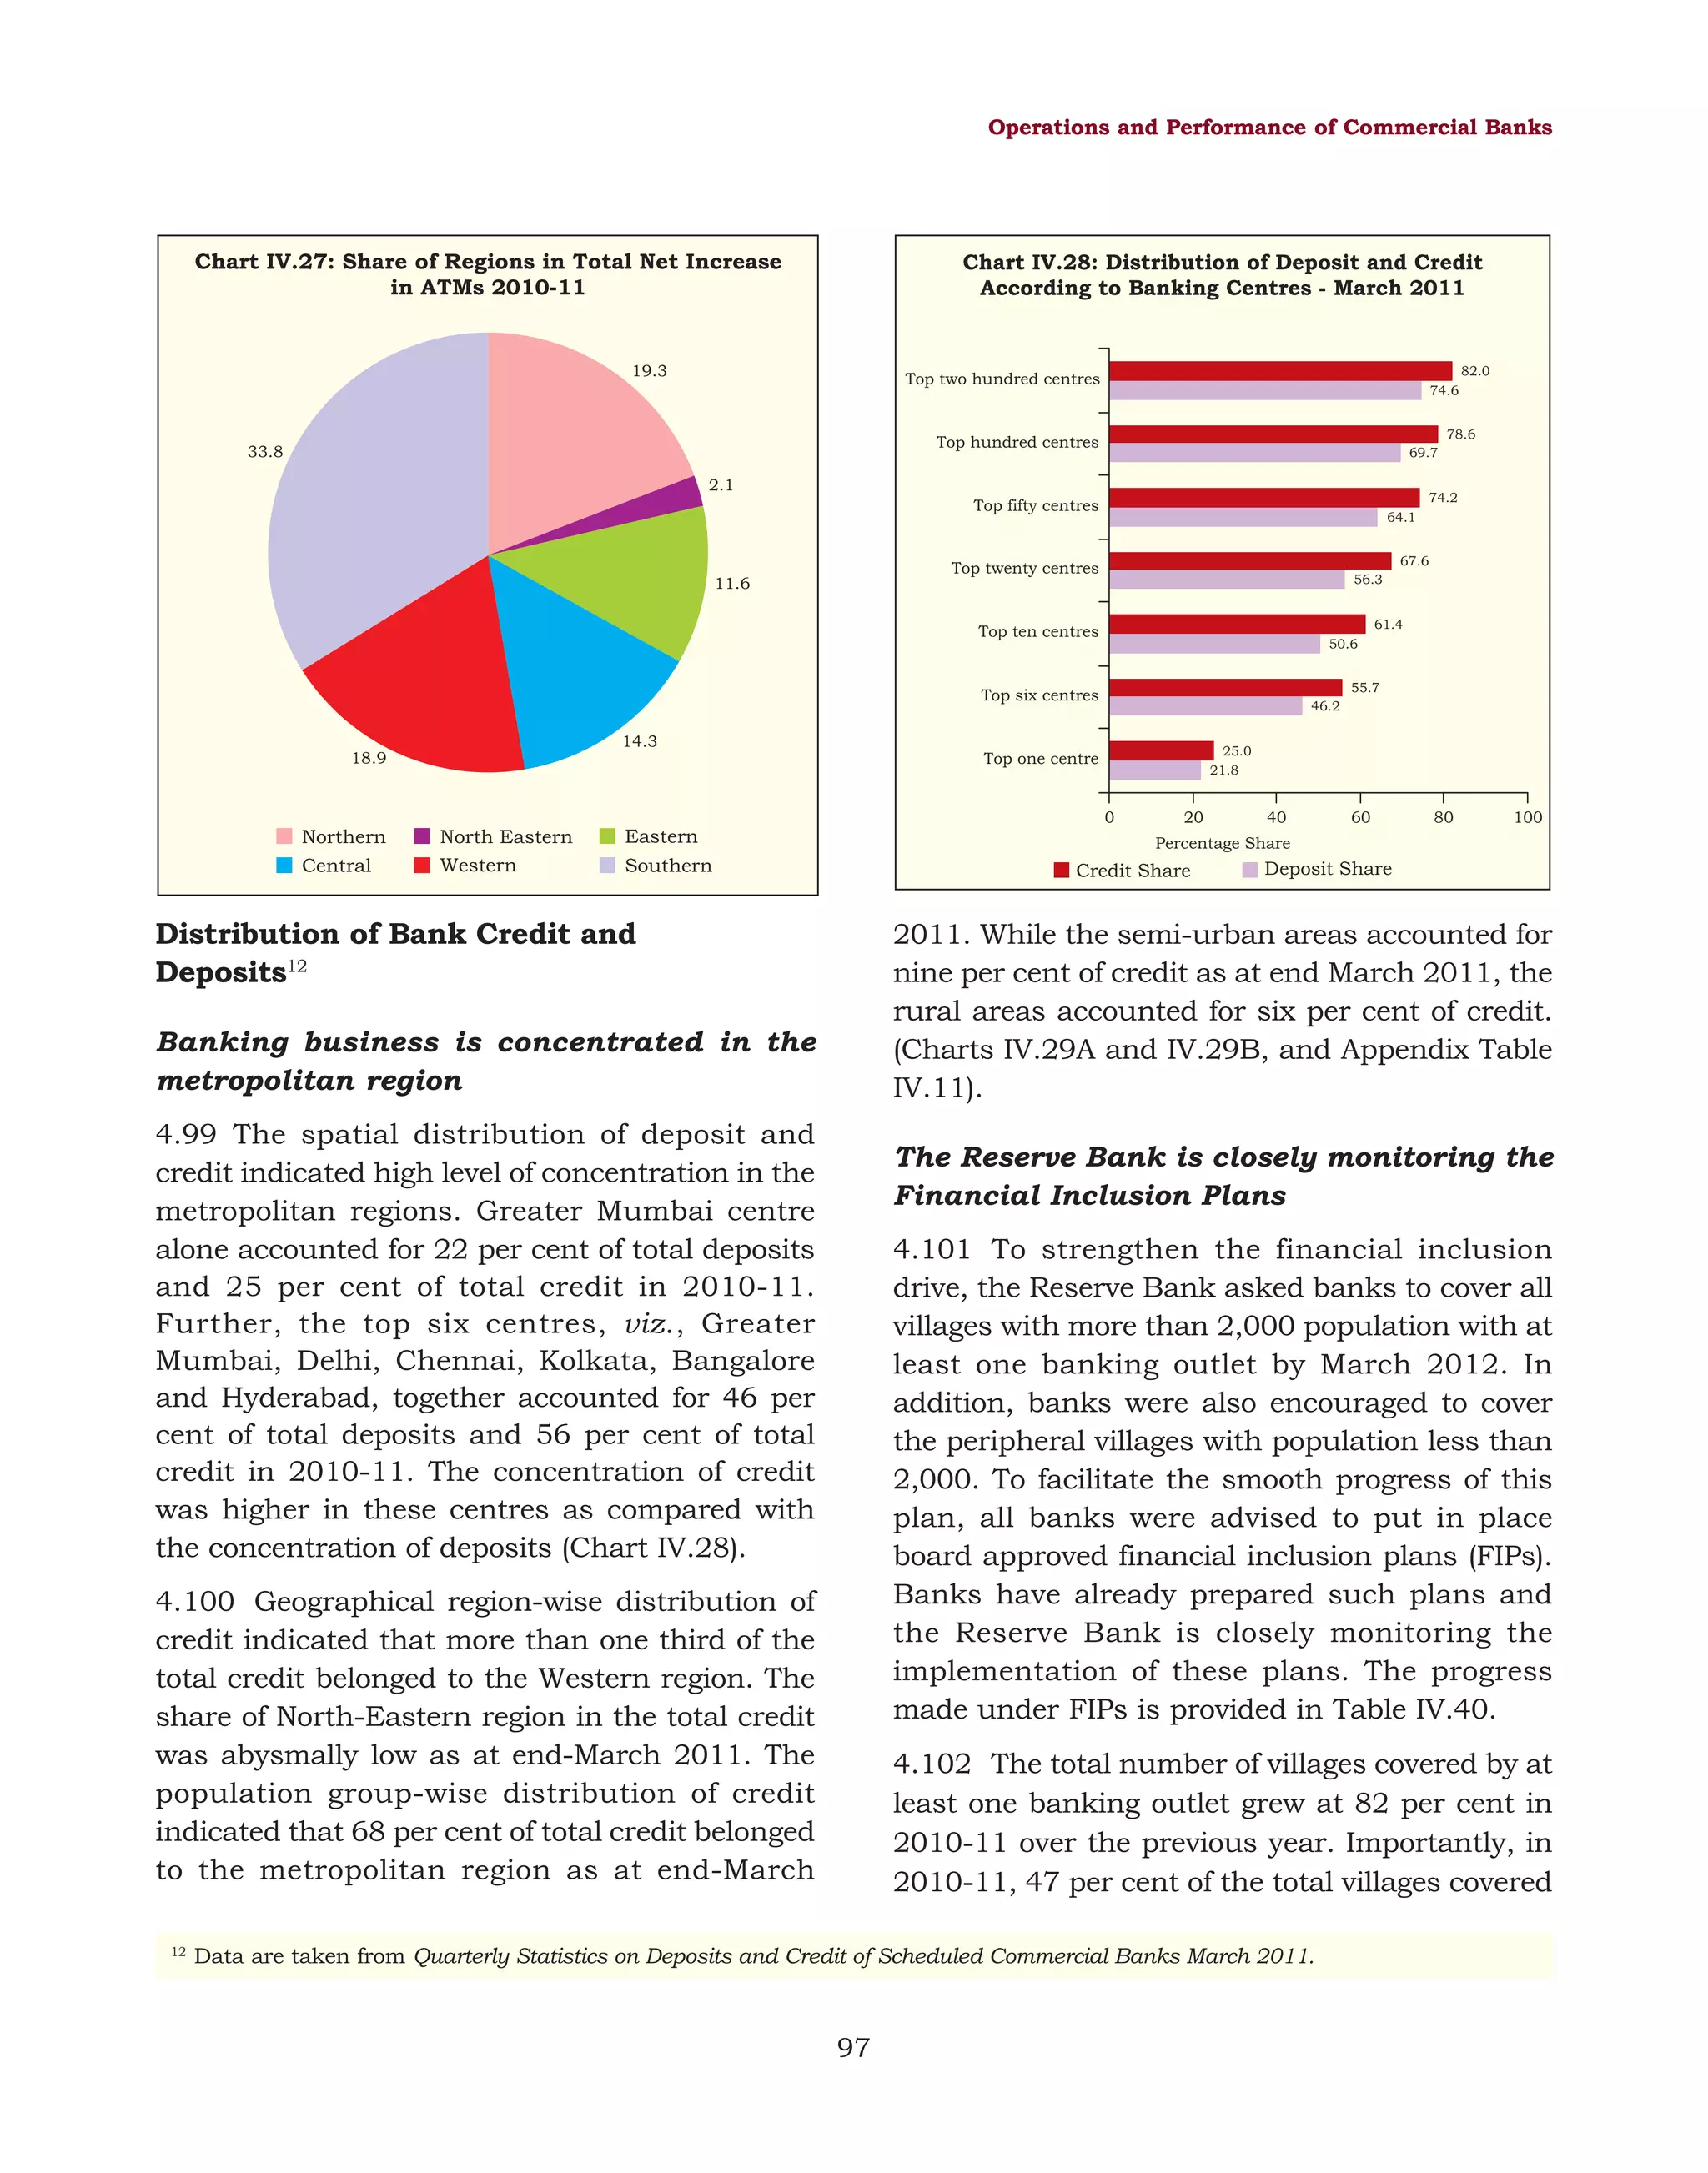
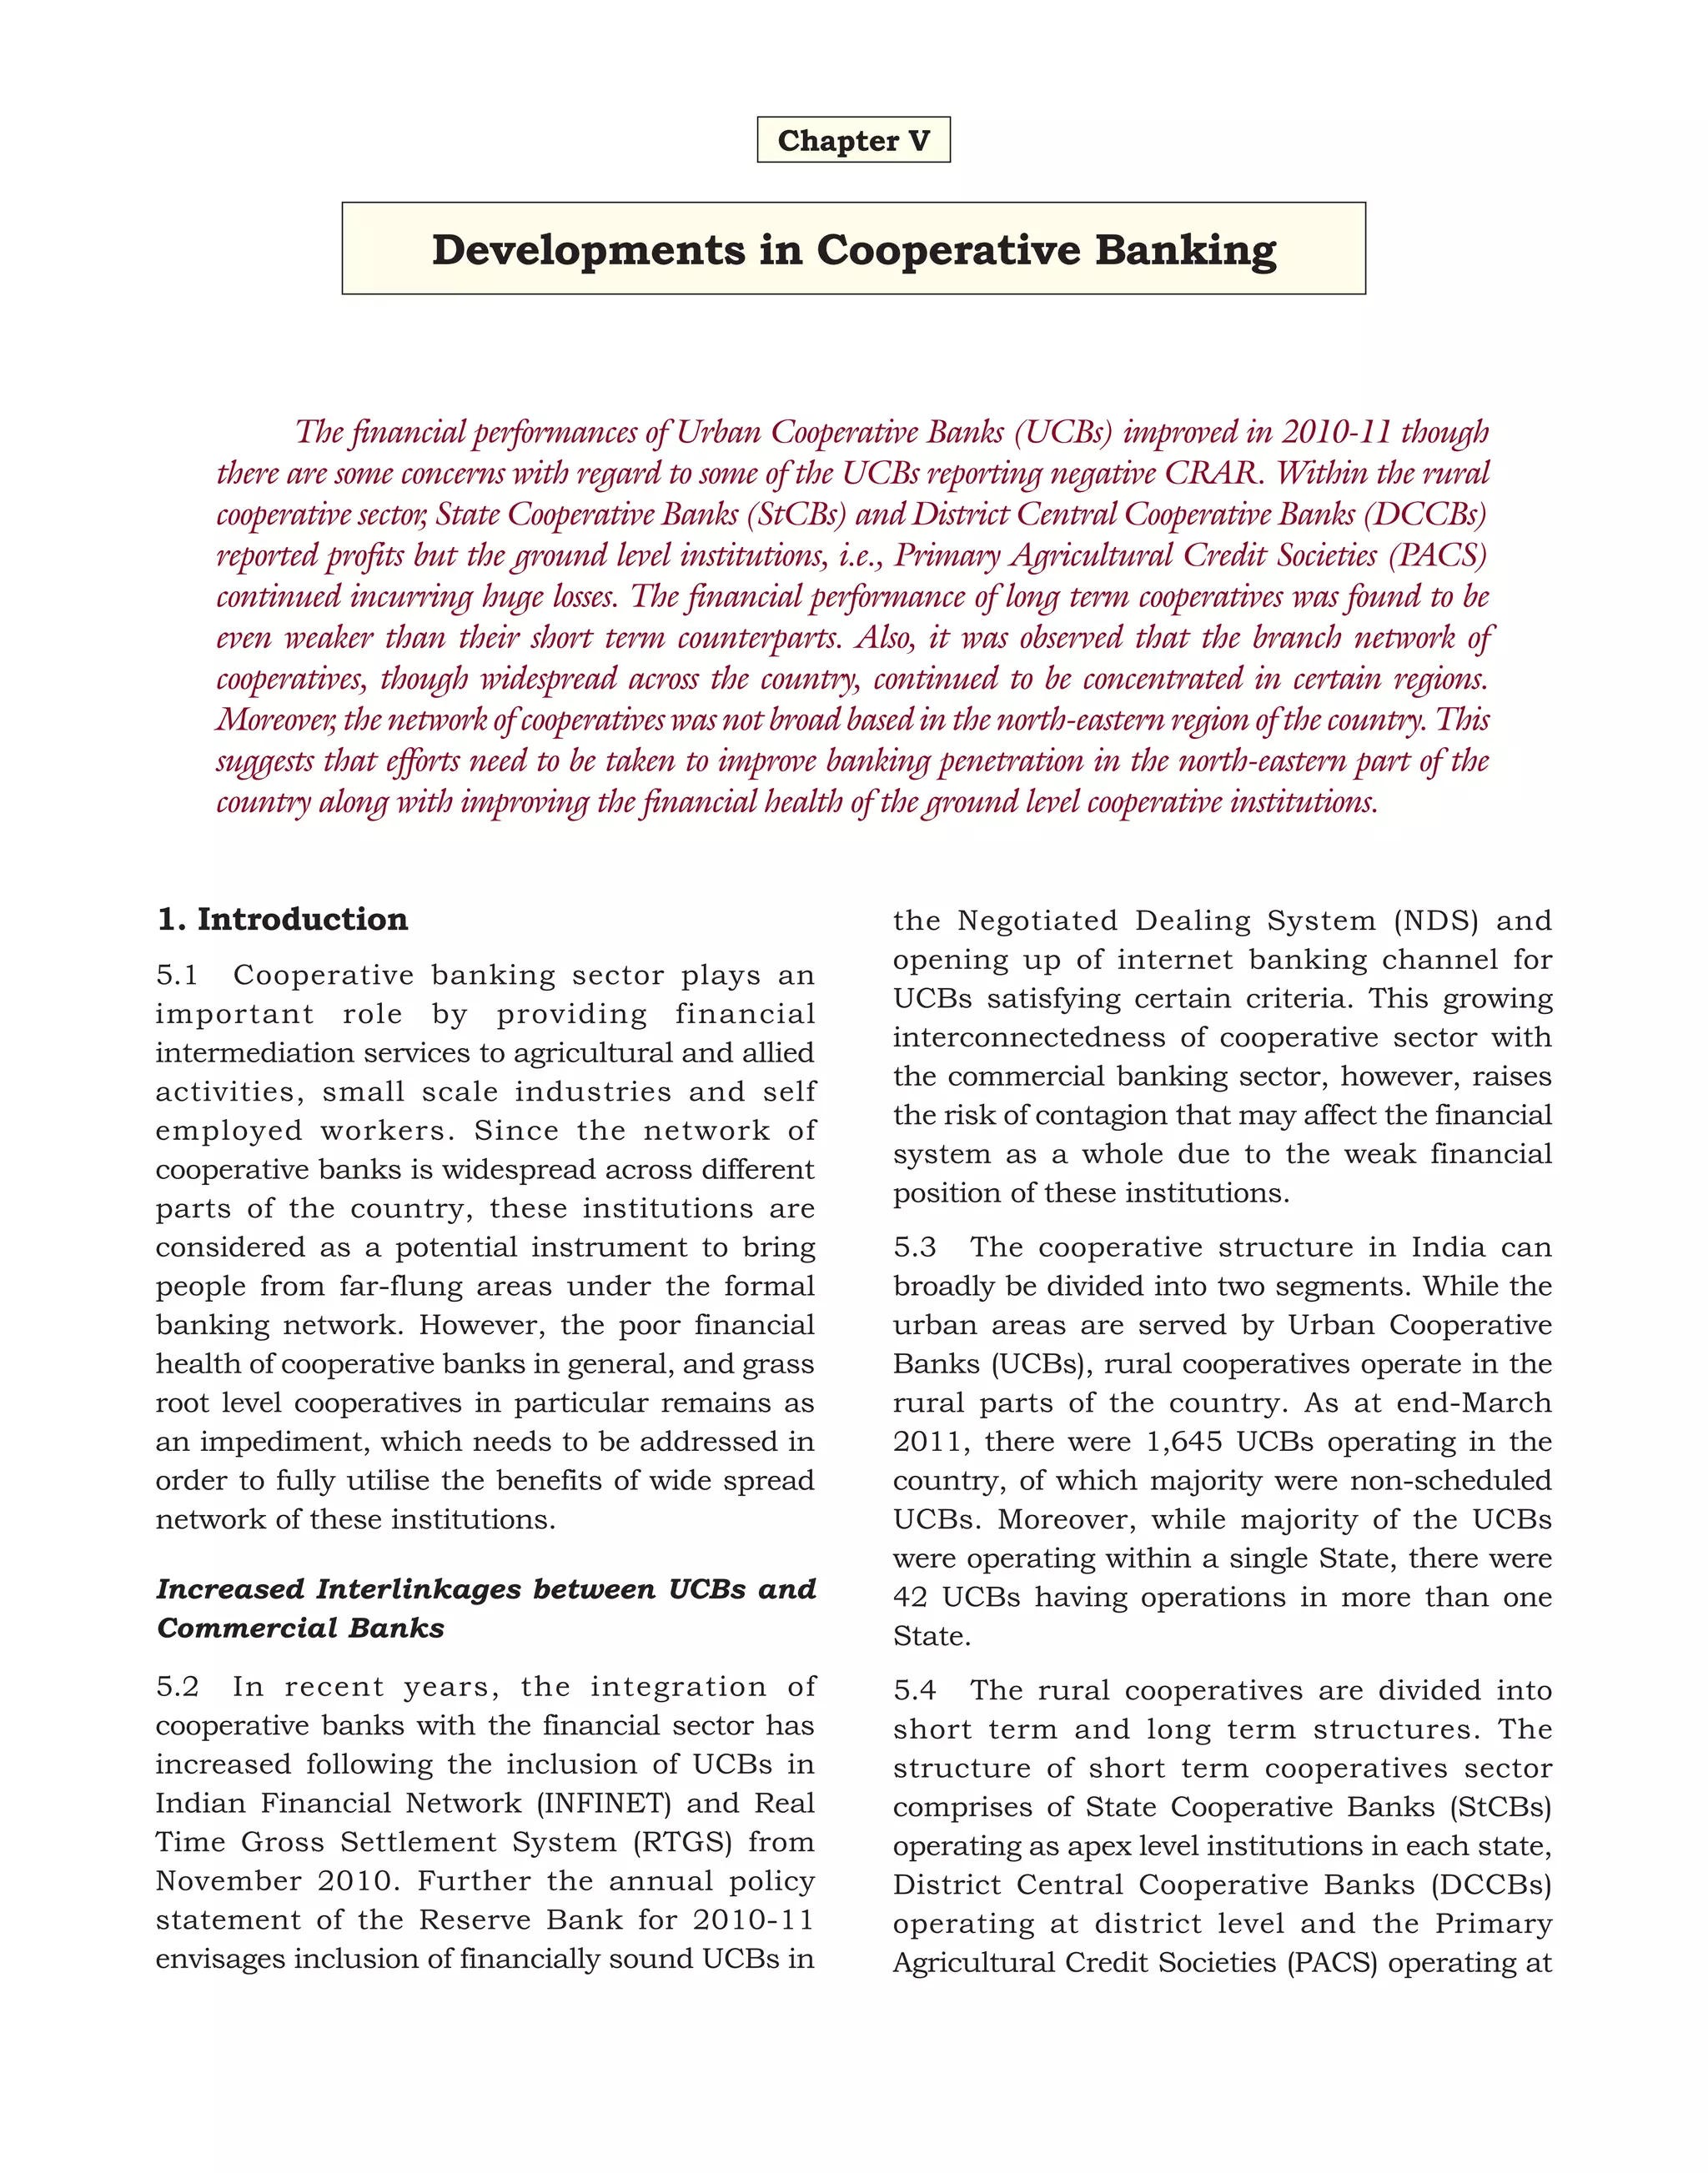
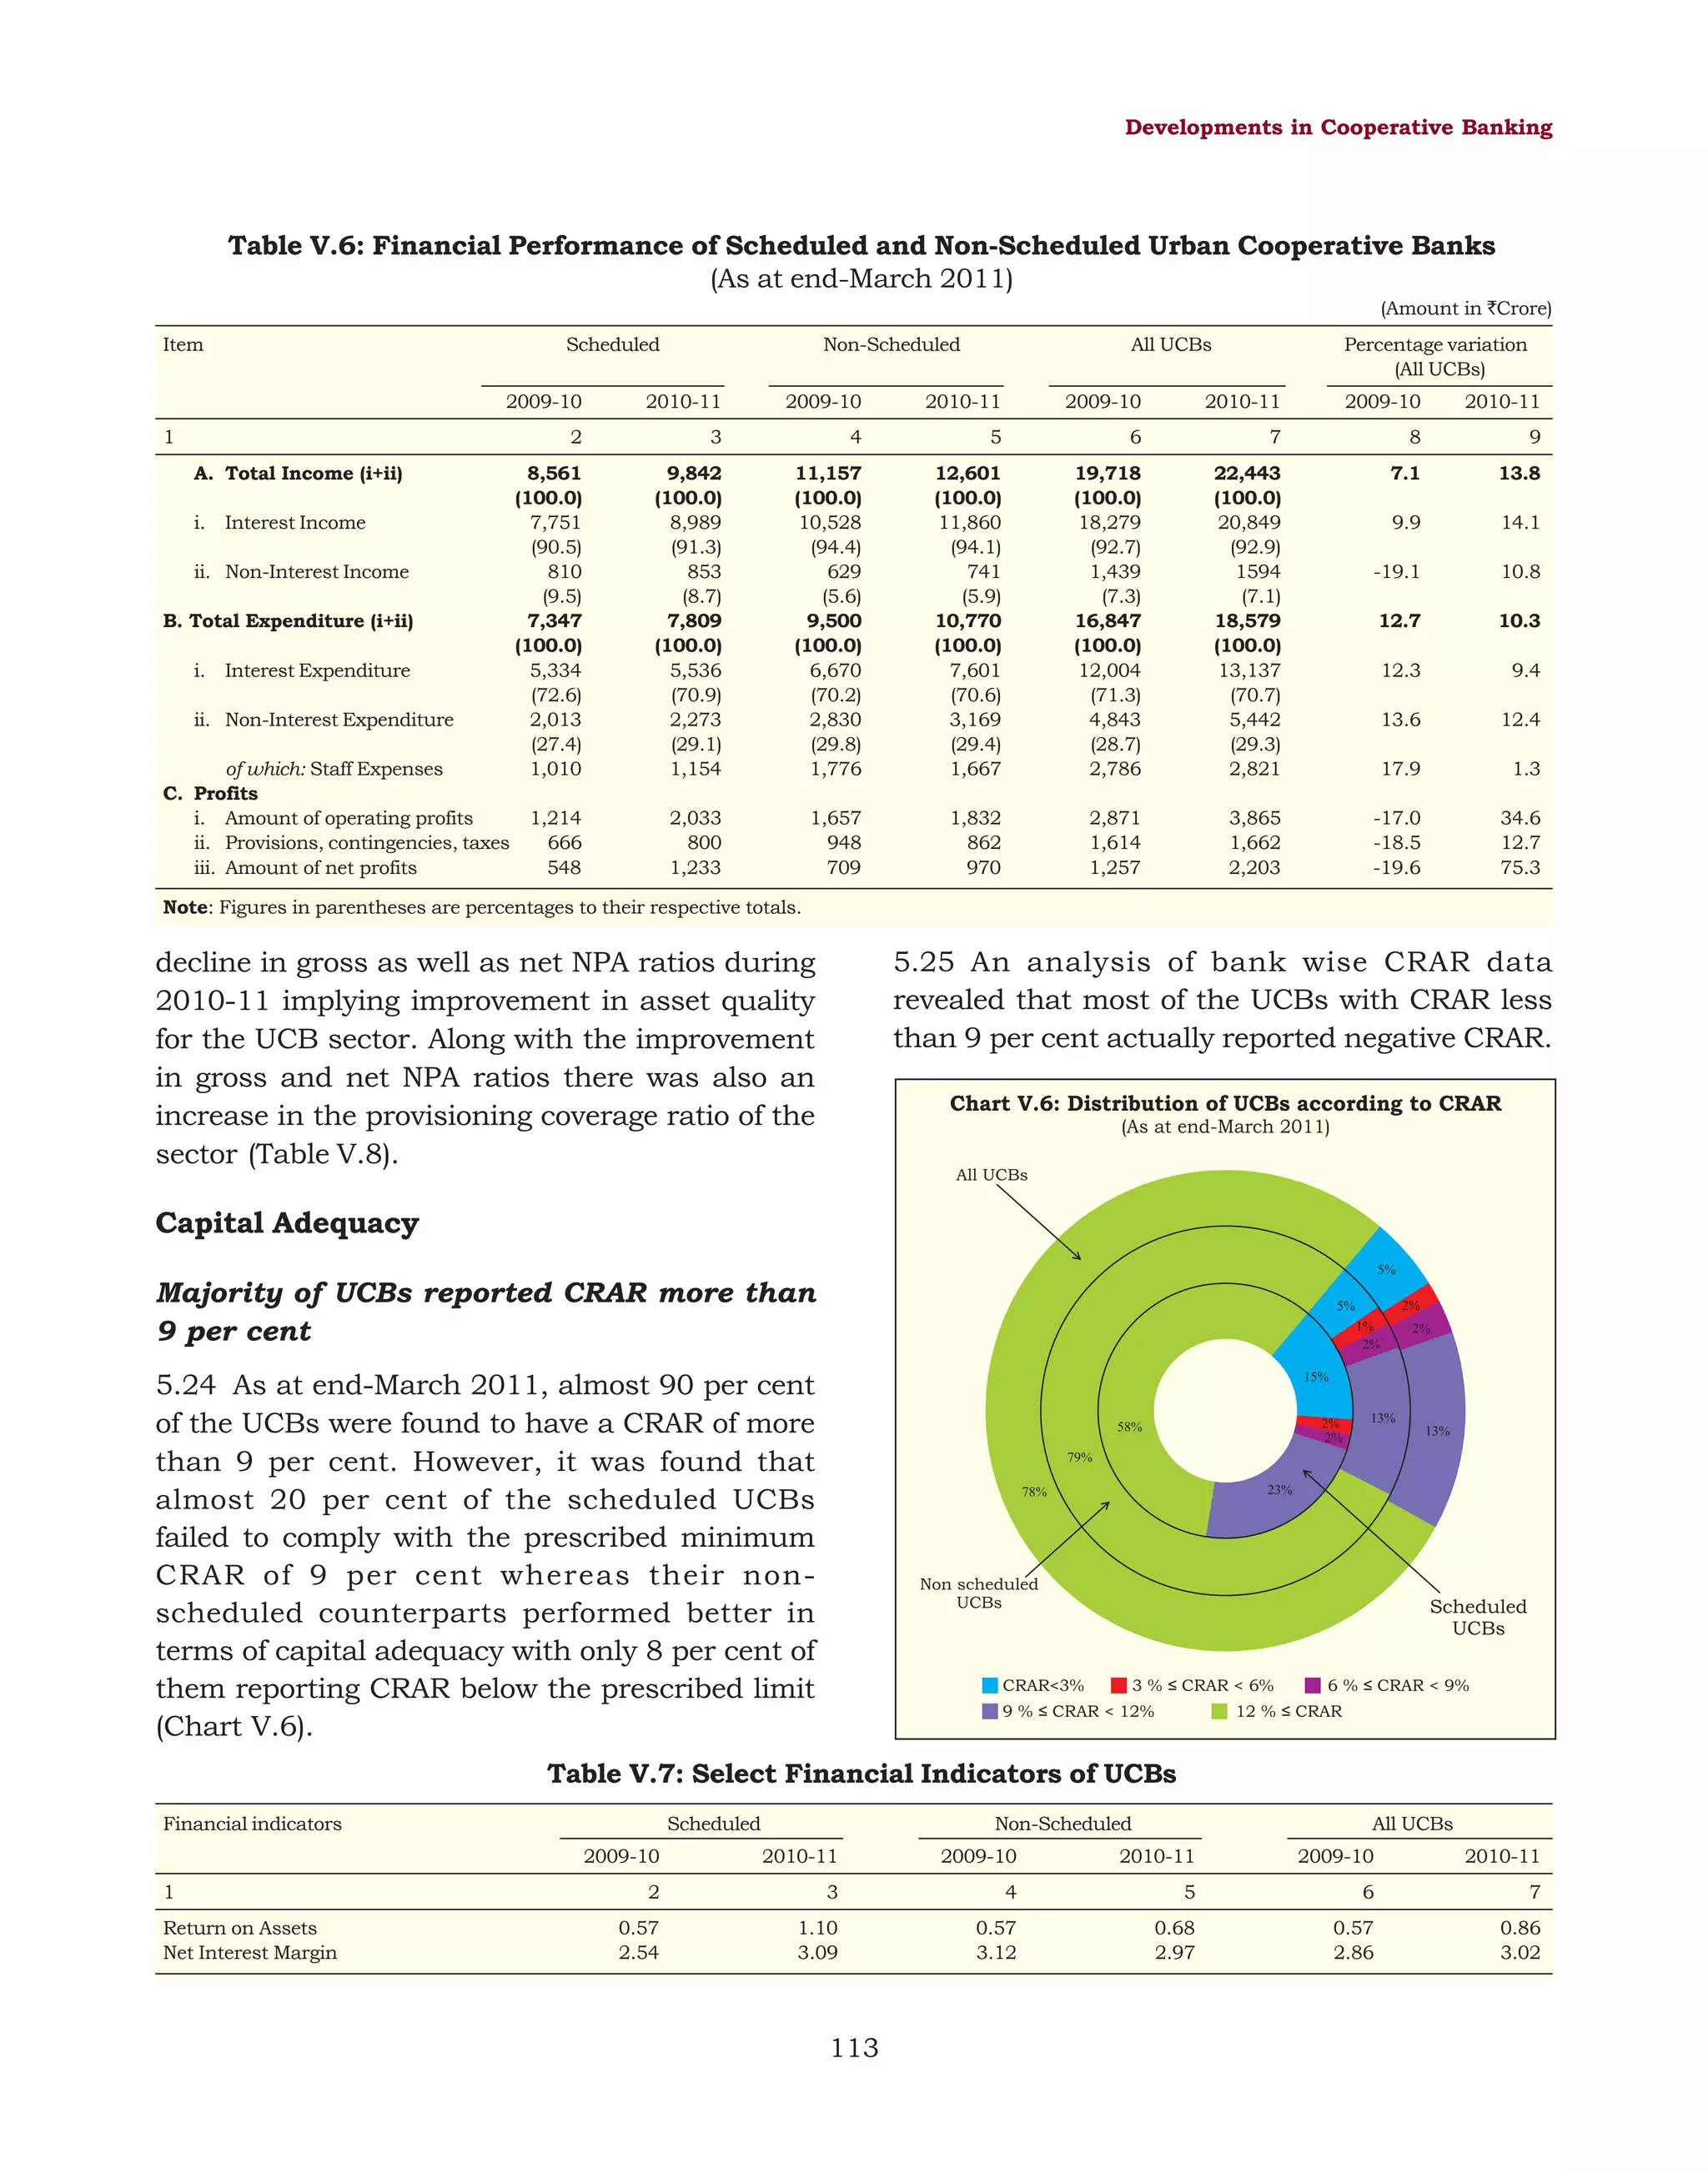
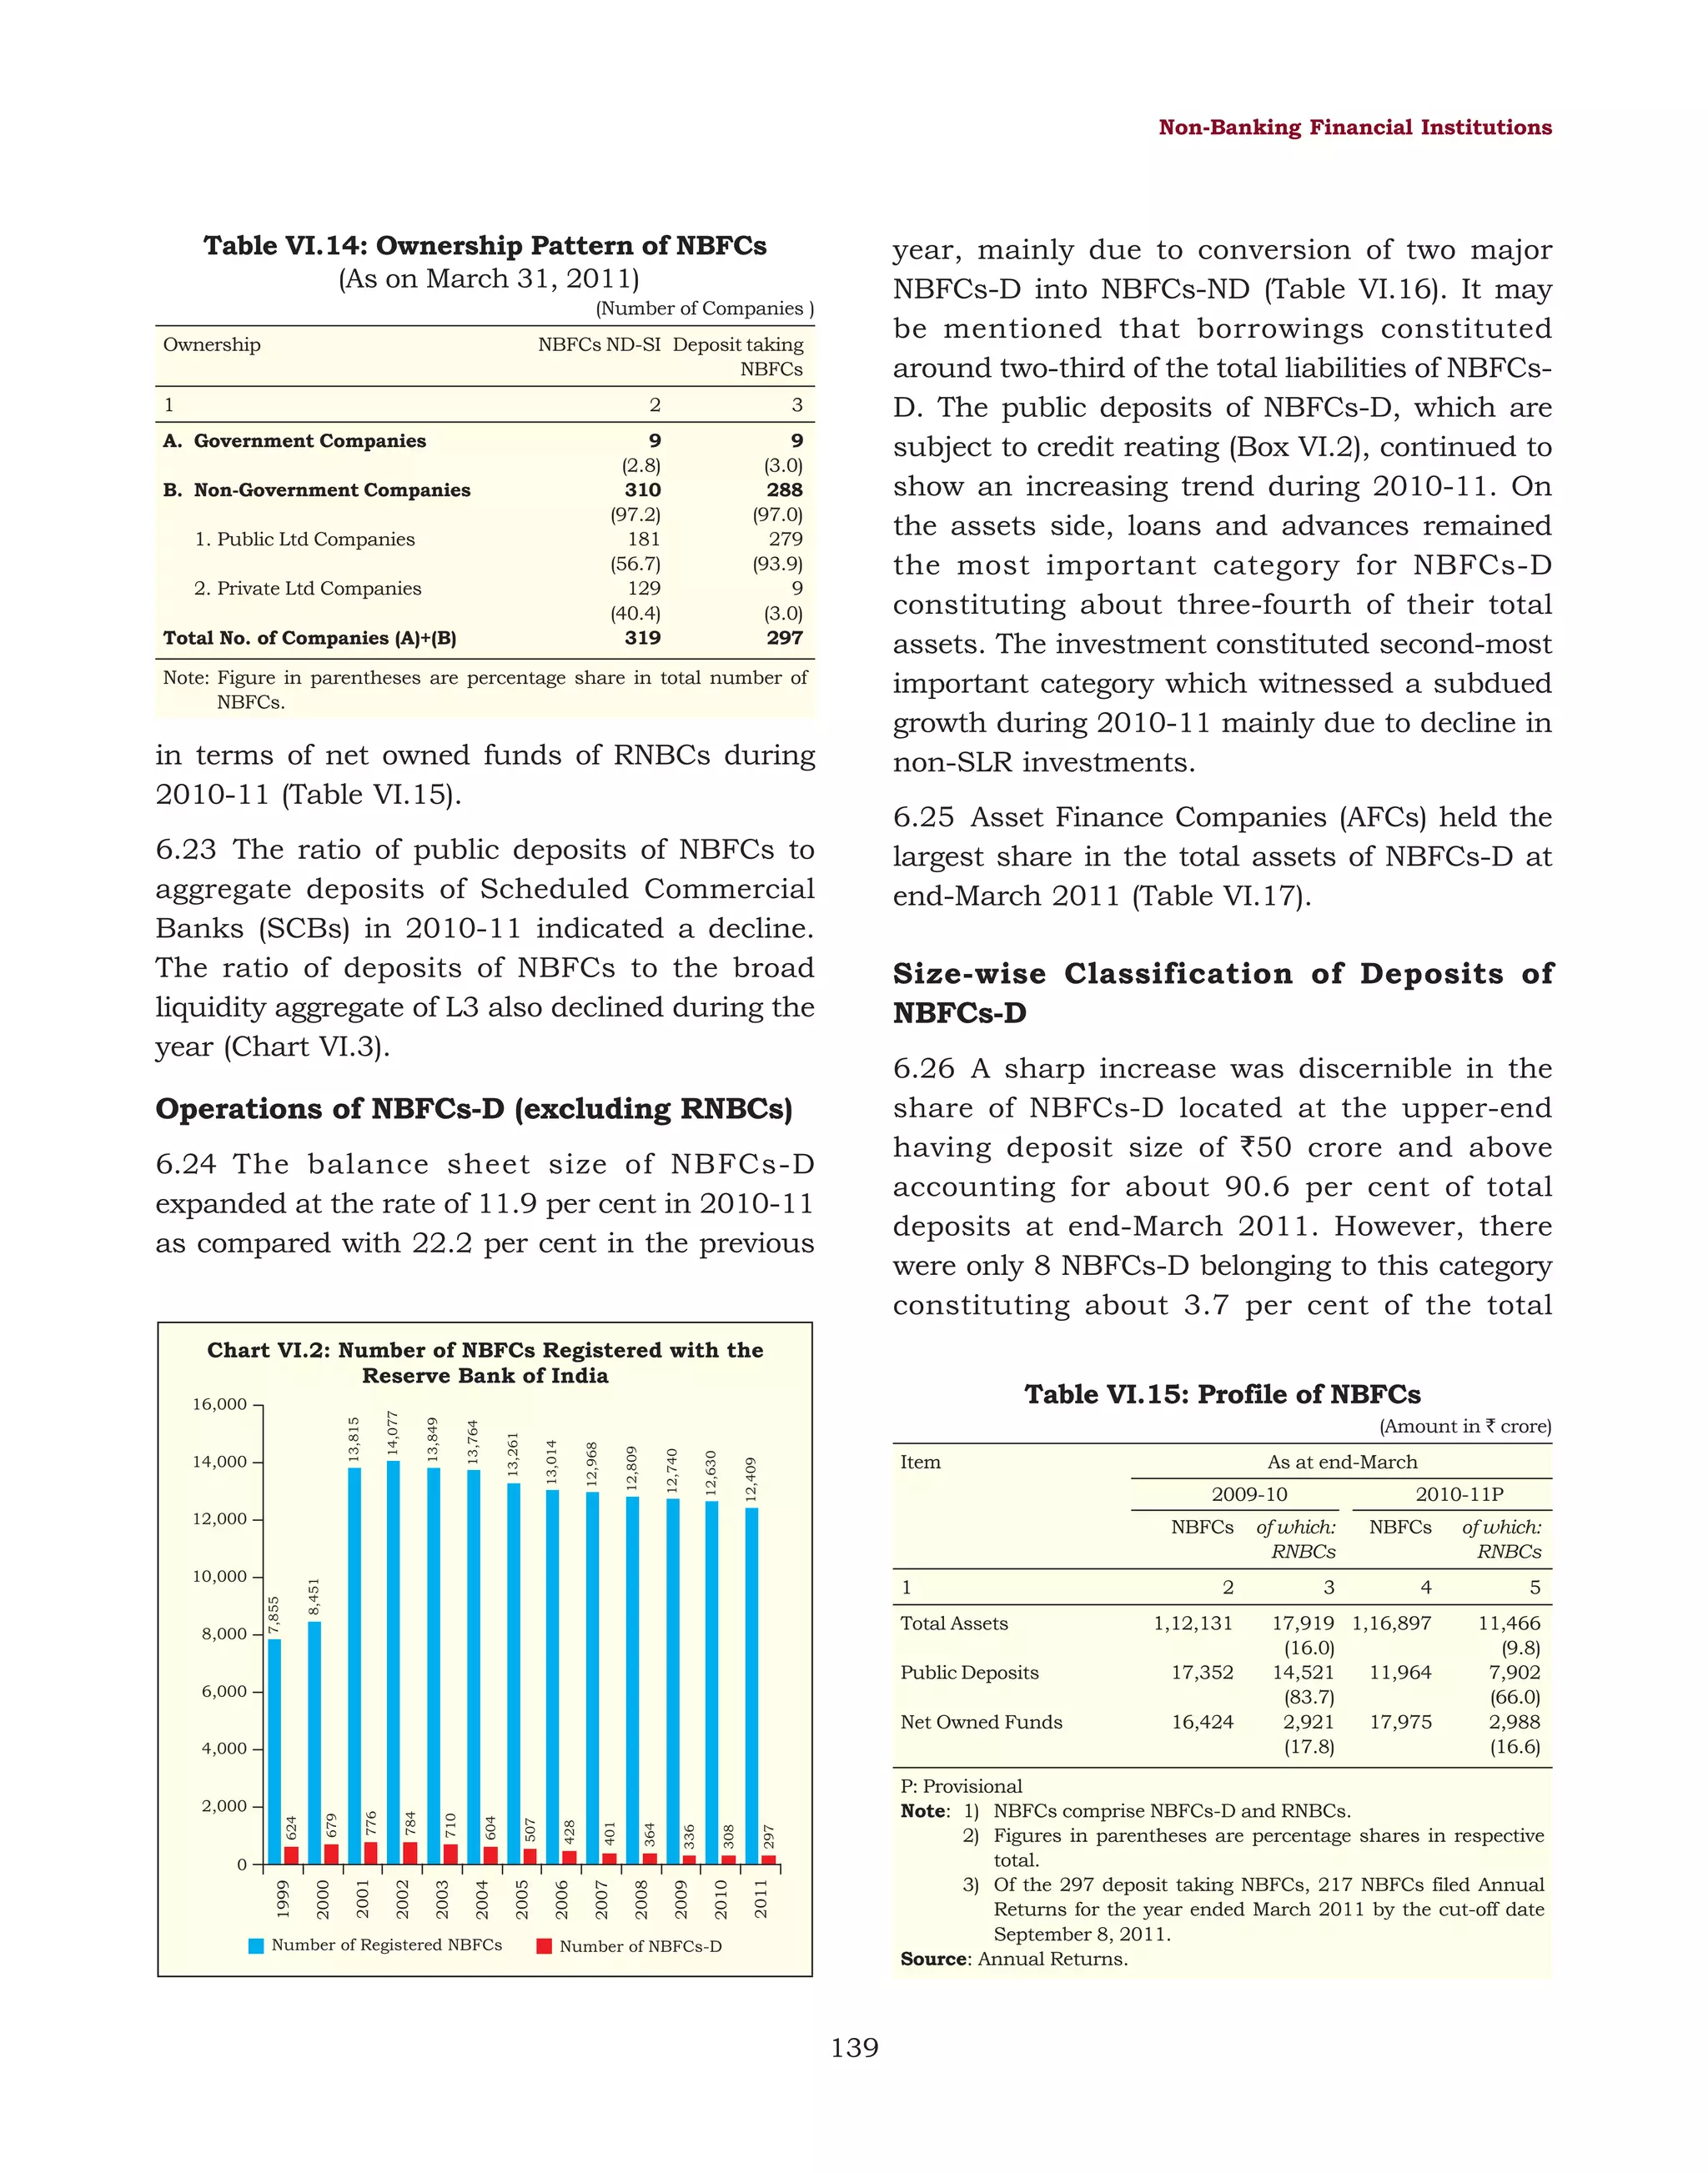
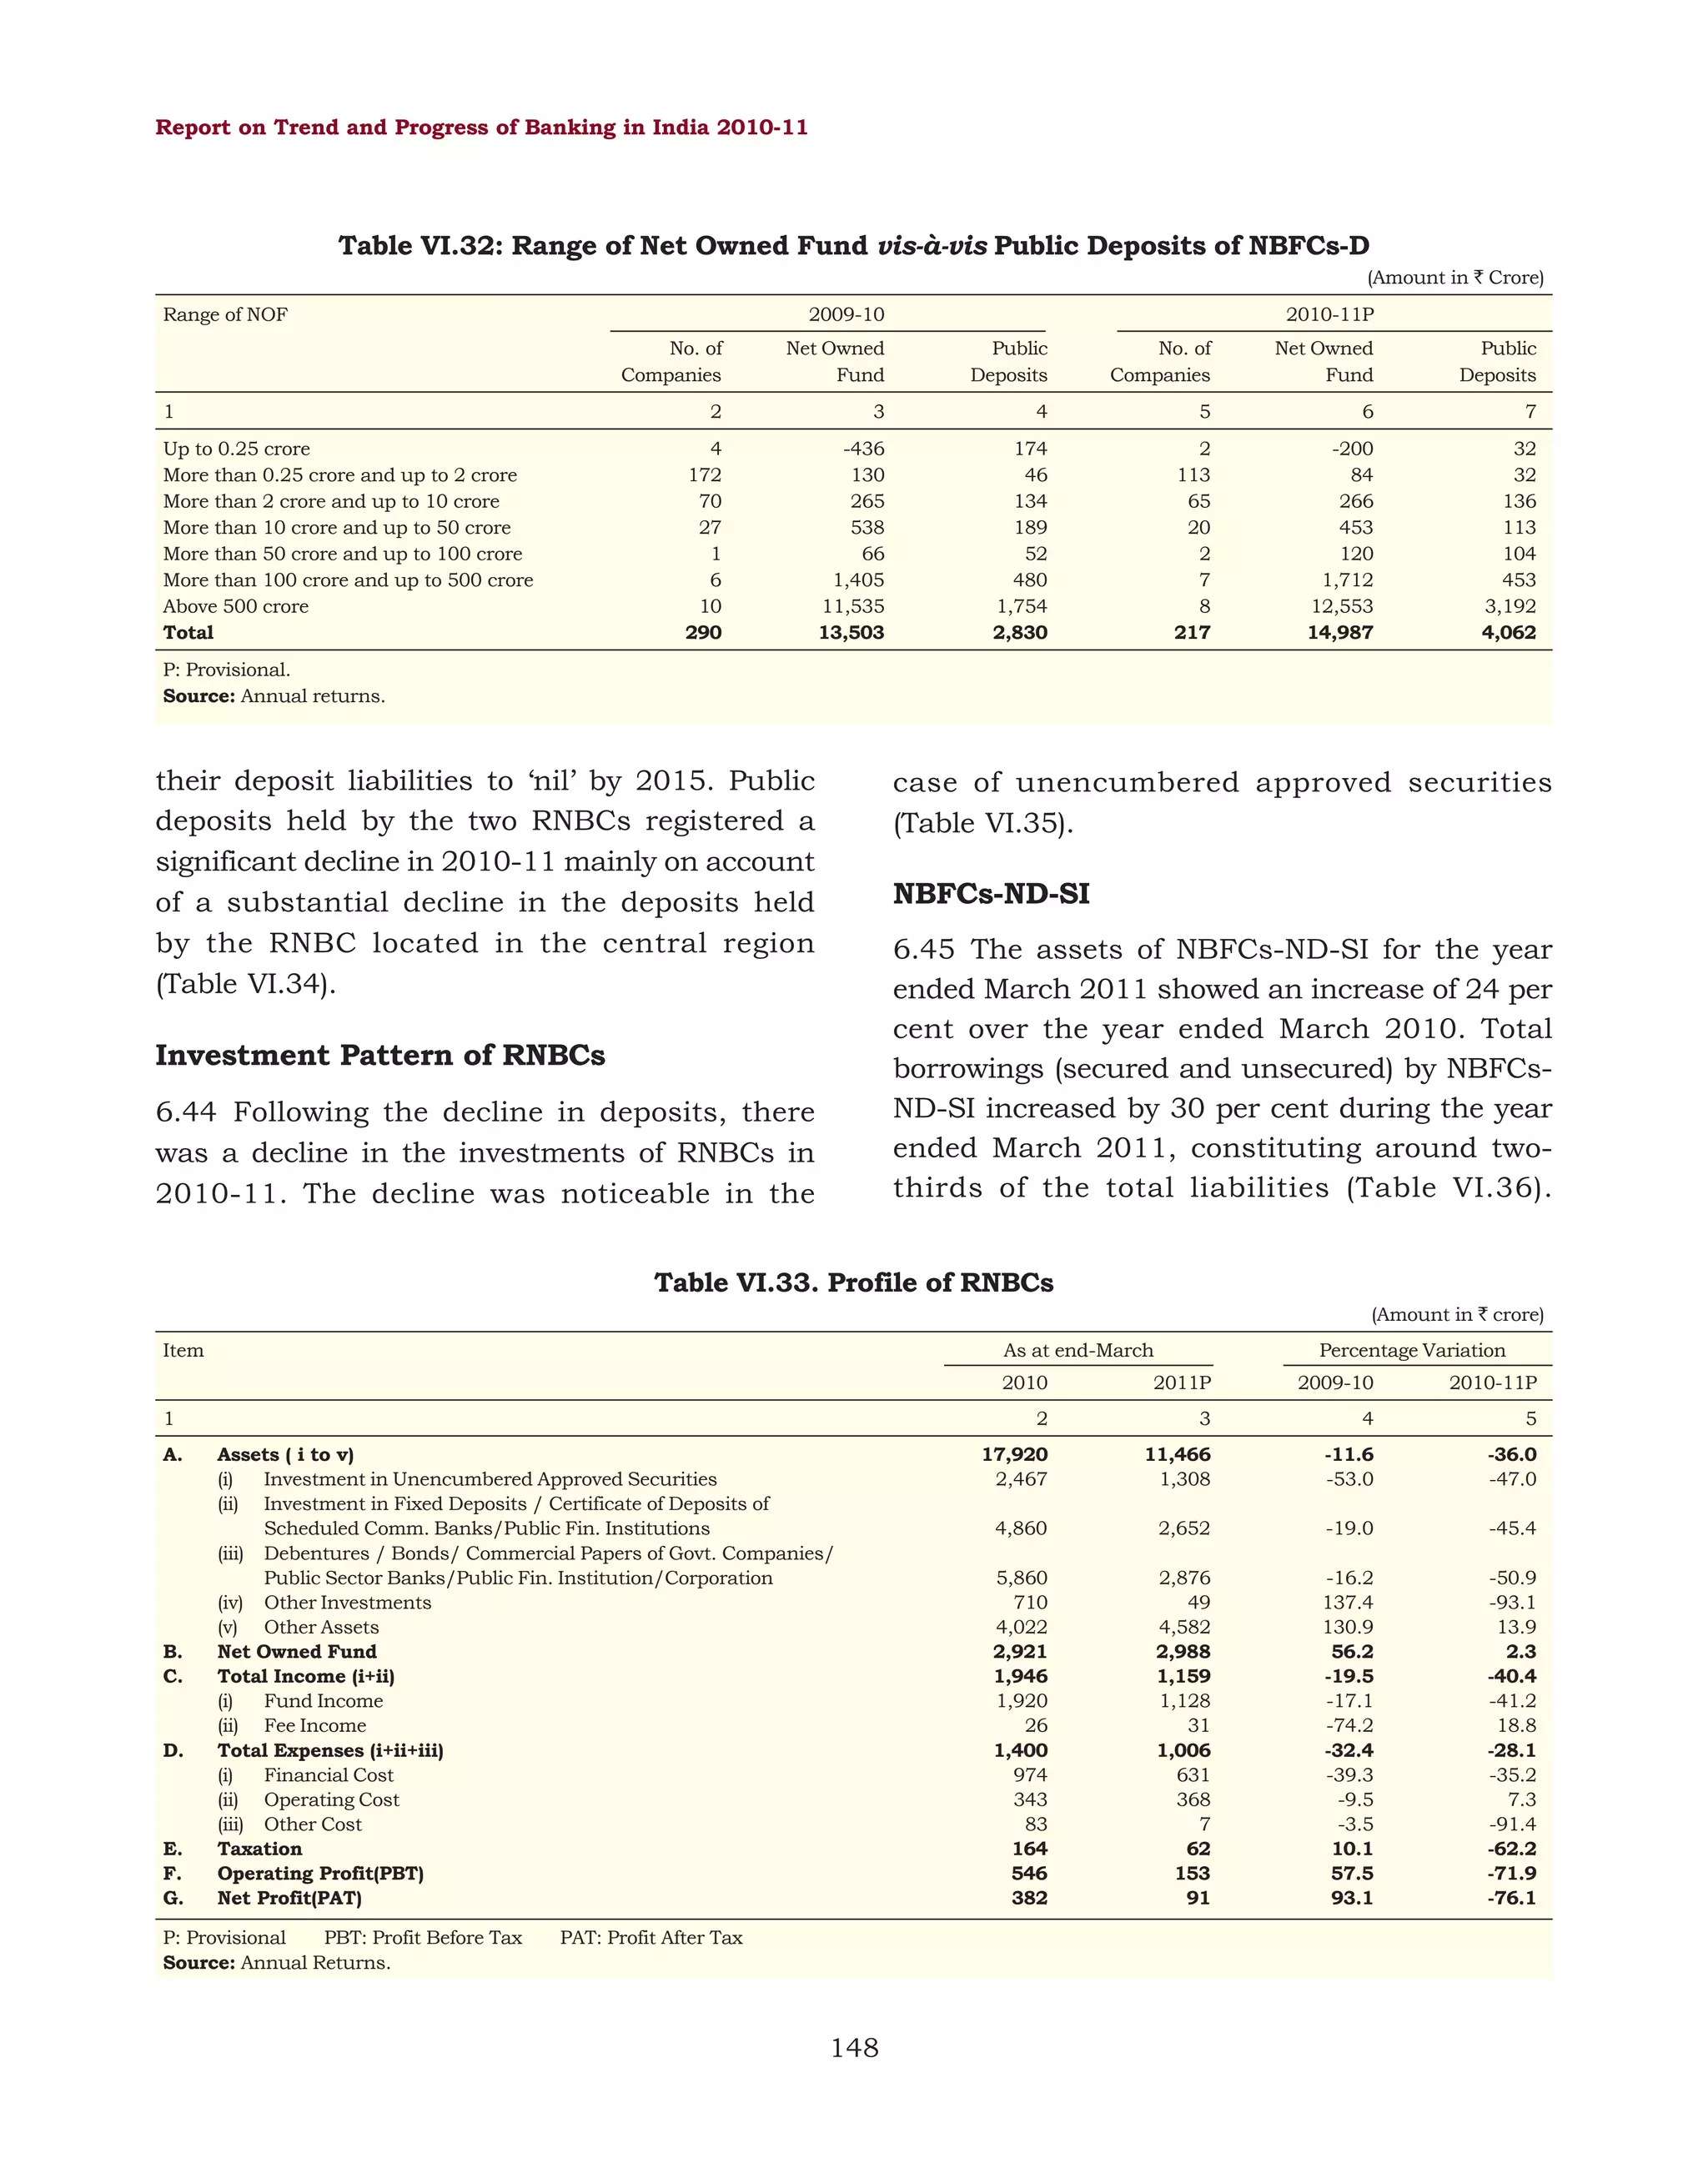
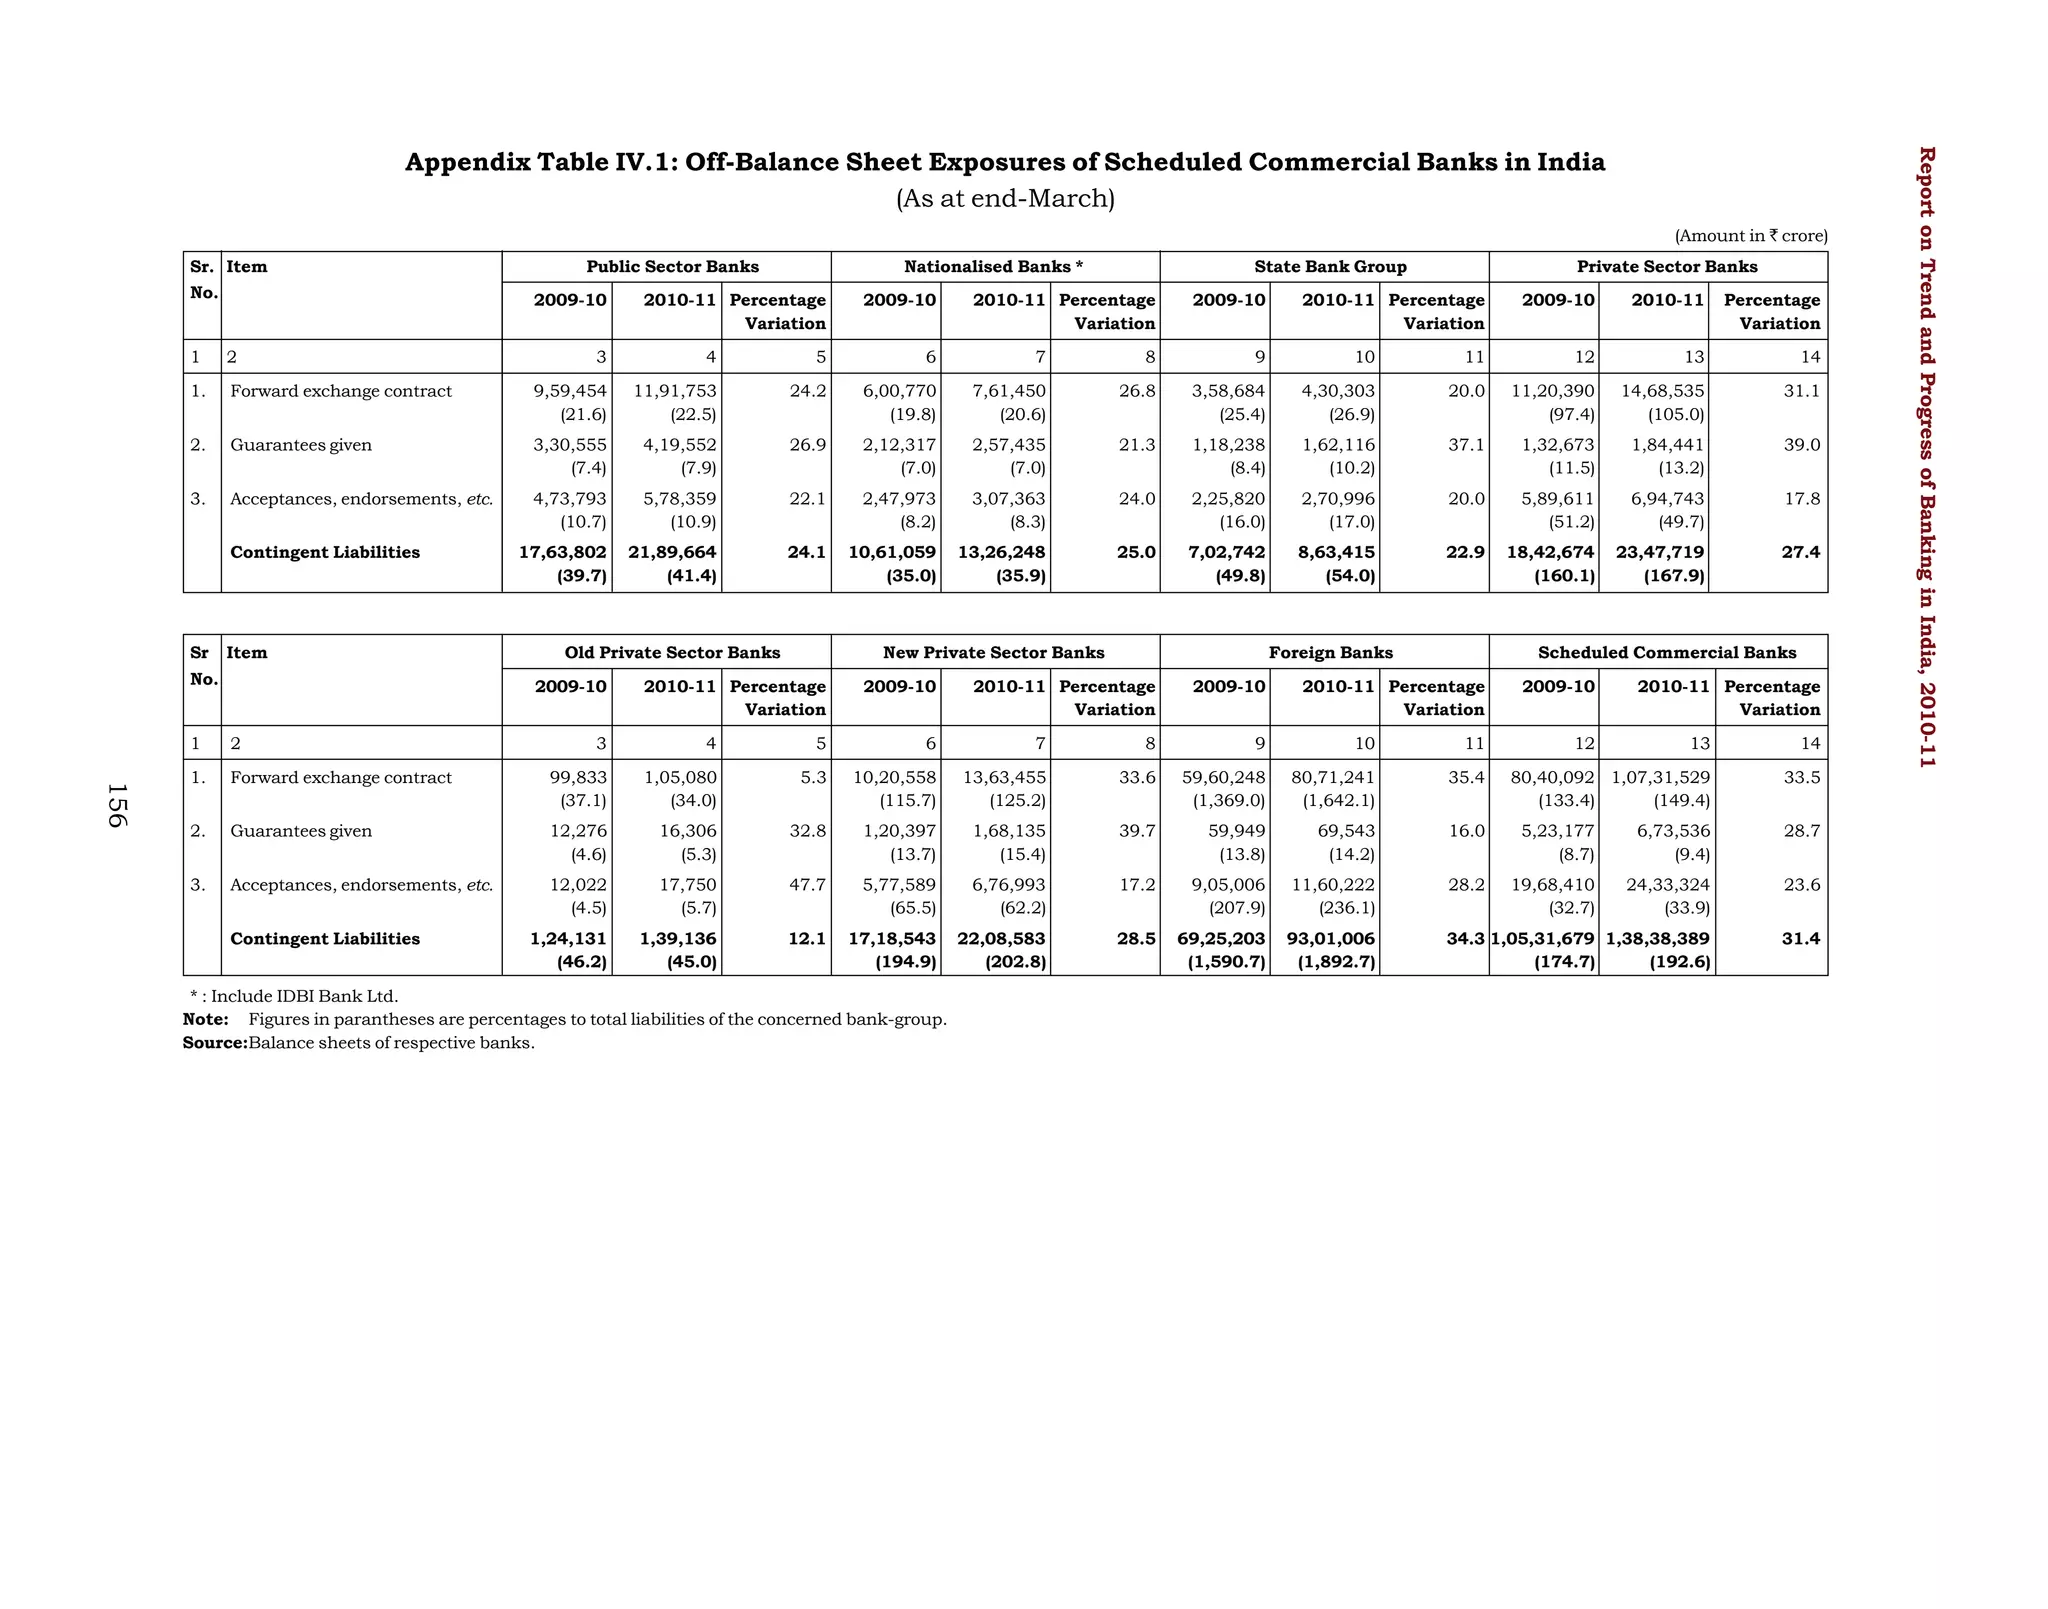
4.95 Despite the efforts taken, the population
per bank branch (after including branches of
RRBs) in North Eastern, Eastern and Central
regions continued to be substantially higher than
the national average in 2010-11 (Chart IV.25).
Bank group
(At end-March 2011)
Rural
1
Semi–
urban
Urban
Metro
politan
Total
2
3
4
5
6
5,872
(11.9)
Nationalised Banks*
2,718
(10.9)
State Bank Group
3,154
(12.8)
Private sector banks
1,262
(5.3)
Old Private Sector Banks
332
(8.0)
New Private Sector Banks
930
(4.8)
Foreign Banks
21
(1.5)
13,278
(26.8)
5,680
(22.9)
7,598
(30.8)
4,784
(20.2)
1,339
(32.5)
3,445
(17.6)
20
(1.5)
16,186
(32.7)
8,132
(32.7)
8,054
(32.7)
7,576
(32.0)
1,401
(34.0)
6,175
(31.6)
300
(21.9)
14,151
(28.6)
8,306
(33.4)
5,845
(23.7)
10,029
(42.4)
1,054
(25.5)
8,975
(46.0)
1,026
(75.1)
49,487
(100.0)
24,836
(100.0)
24,651
(100.0)
23,651
(100.0)
4,126
(100.0)
19,525
(100.0)
1,367
(100.0)
Total
18,082
(24.3)
[24.9]
24,062
(32.3)
[21.8]
25,206
(33.8)
[21.7]
74,505
(100.0)
[23.9]
Public sector banks
Expansion of Banking Network through
ATMs
Nearly 50 per cent of the net increase in
ATMs was at off-site locations
4.96 From the point of view of banking
penetration, off-site ATMs have more relevance
than on-site ATMs. Out of the total net increase
in ATMs in 2010-11, 44 per cent were off-site
ATMs. Sixty three per cent of the net addition of
ATMs by new private sector banks and 98 per
cent of net addition of ATMs by foreign banks
were at off-site locations in 2010-11. Almost 41
per cent and 49 per cent, respectively of the net
addition of ATMs by nationalised banks and old
private sector banks were also at off-site
locations.
7,155
(9.6)
[37.7]
*: Include IDBI Bank Ltd.
Note: 1) Figures in parentheses indicate percentage share of total ATMs
under each bank group.
2) Figures in square brackets are percentage variation over the
previous year.
followed by nationalised banks (38 per cent)
(Table IV.39 and Chart IV.26).
4.98 The share of the North Eastern region was
the lowest in the incremental deployment of
ATMs in 2010-11 (Chart IV.27).
Chart IV.25: Region-wise Population per Bank Branch
(end March 2011)
Chart IV.26: Population Group-wise Distribution of ATMs
(end-March 2011)
17,260
20000
18000
19,255
4.97 In 2010-11, almost one tenth of the total
ATMs were located in rural areas out of which
the State Bank group accounted for 44 per cent
18,328
Rural areas accounted for ten per cent of
total outstanding ATMs
North-Eastern region had the lowest share in
the incremental increase in the deployment
of ATMs
Metropolitan
centres, 33.8
10000
10,077
Population
12000
All India (13,466)
10,043
14000
12,496
16000
Public Sector
Banks, 82.1
Rural
centres, 9.6
8000
6000
Private Sector
Banks, 17.6
Urban
centres,
32.3
4000
FB, 0.3
2000
Semi–urban
centres, 24.3
0
Southern Northern Western
Central
Population per Bank Branch
Eastern
North
Eastern
All-India
96](https://image.slidesharecdn.com/0tpbi121111full-140101004243-phpapp02/75/0-tpbi121111-full-116-2048.jpg)

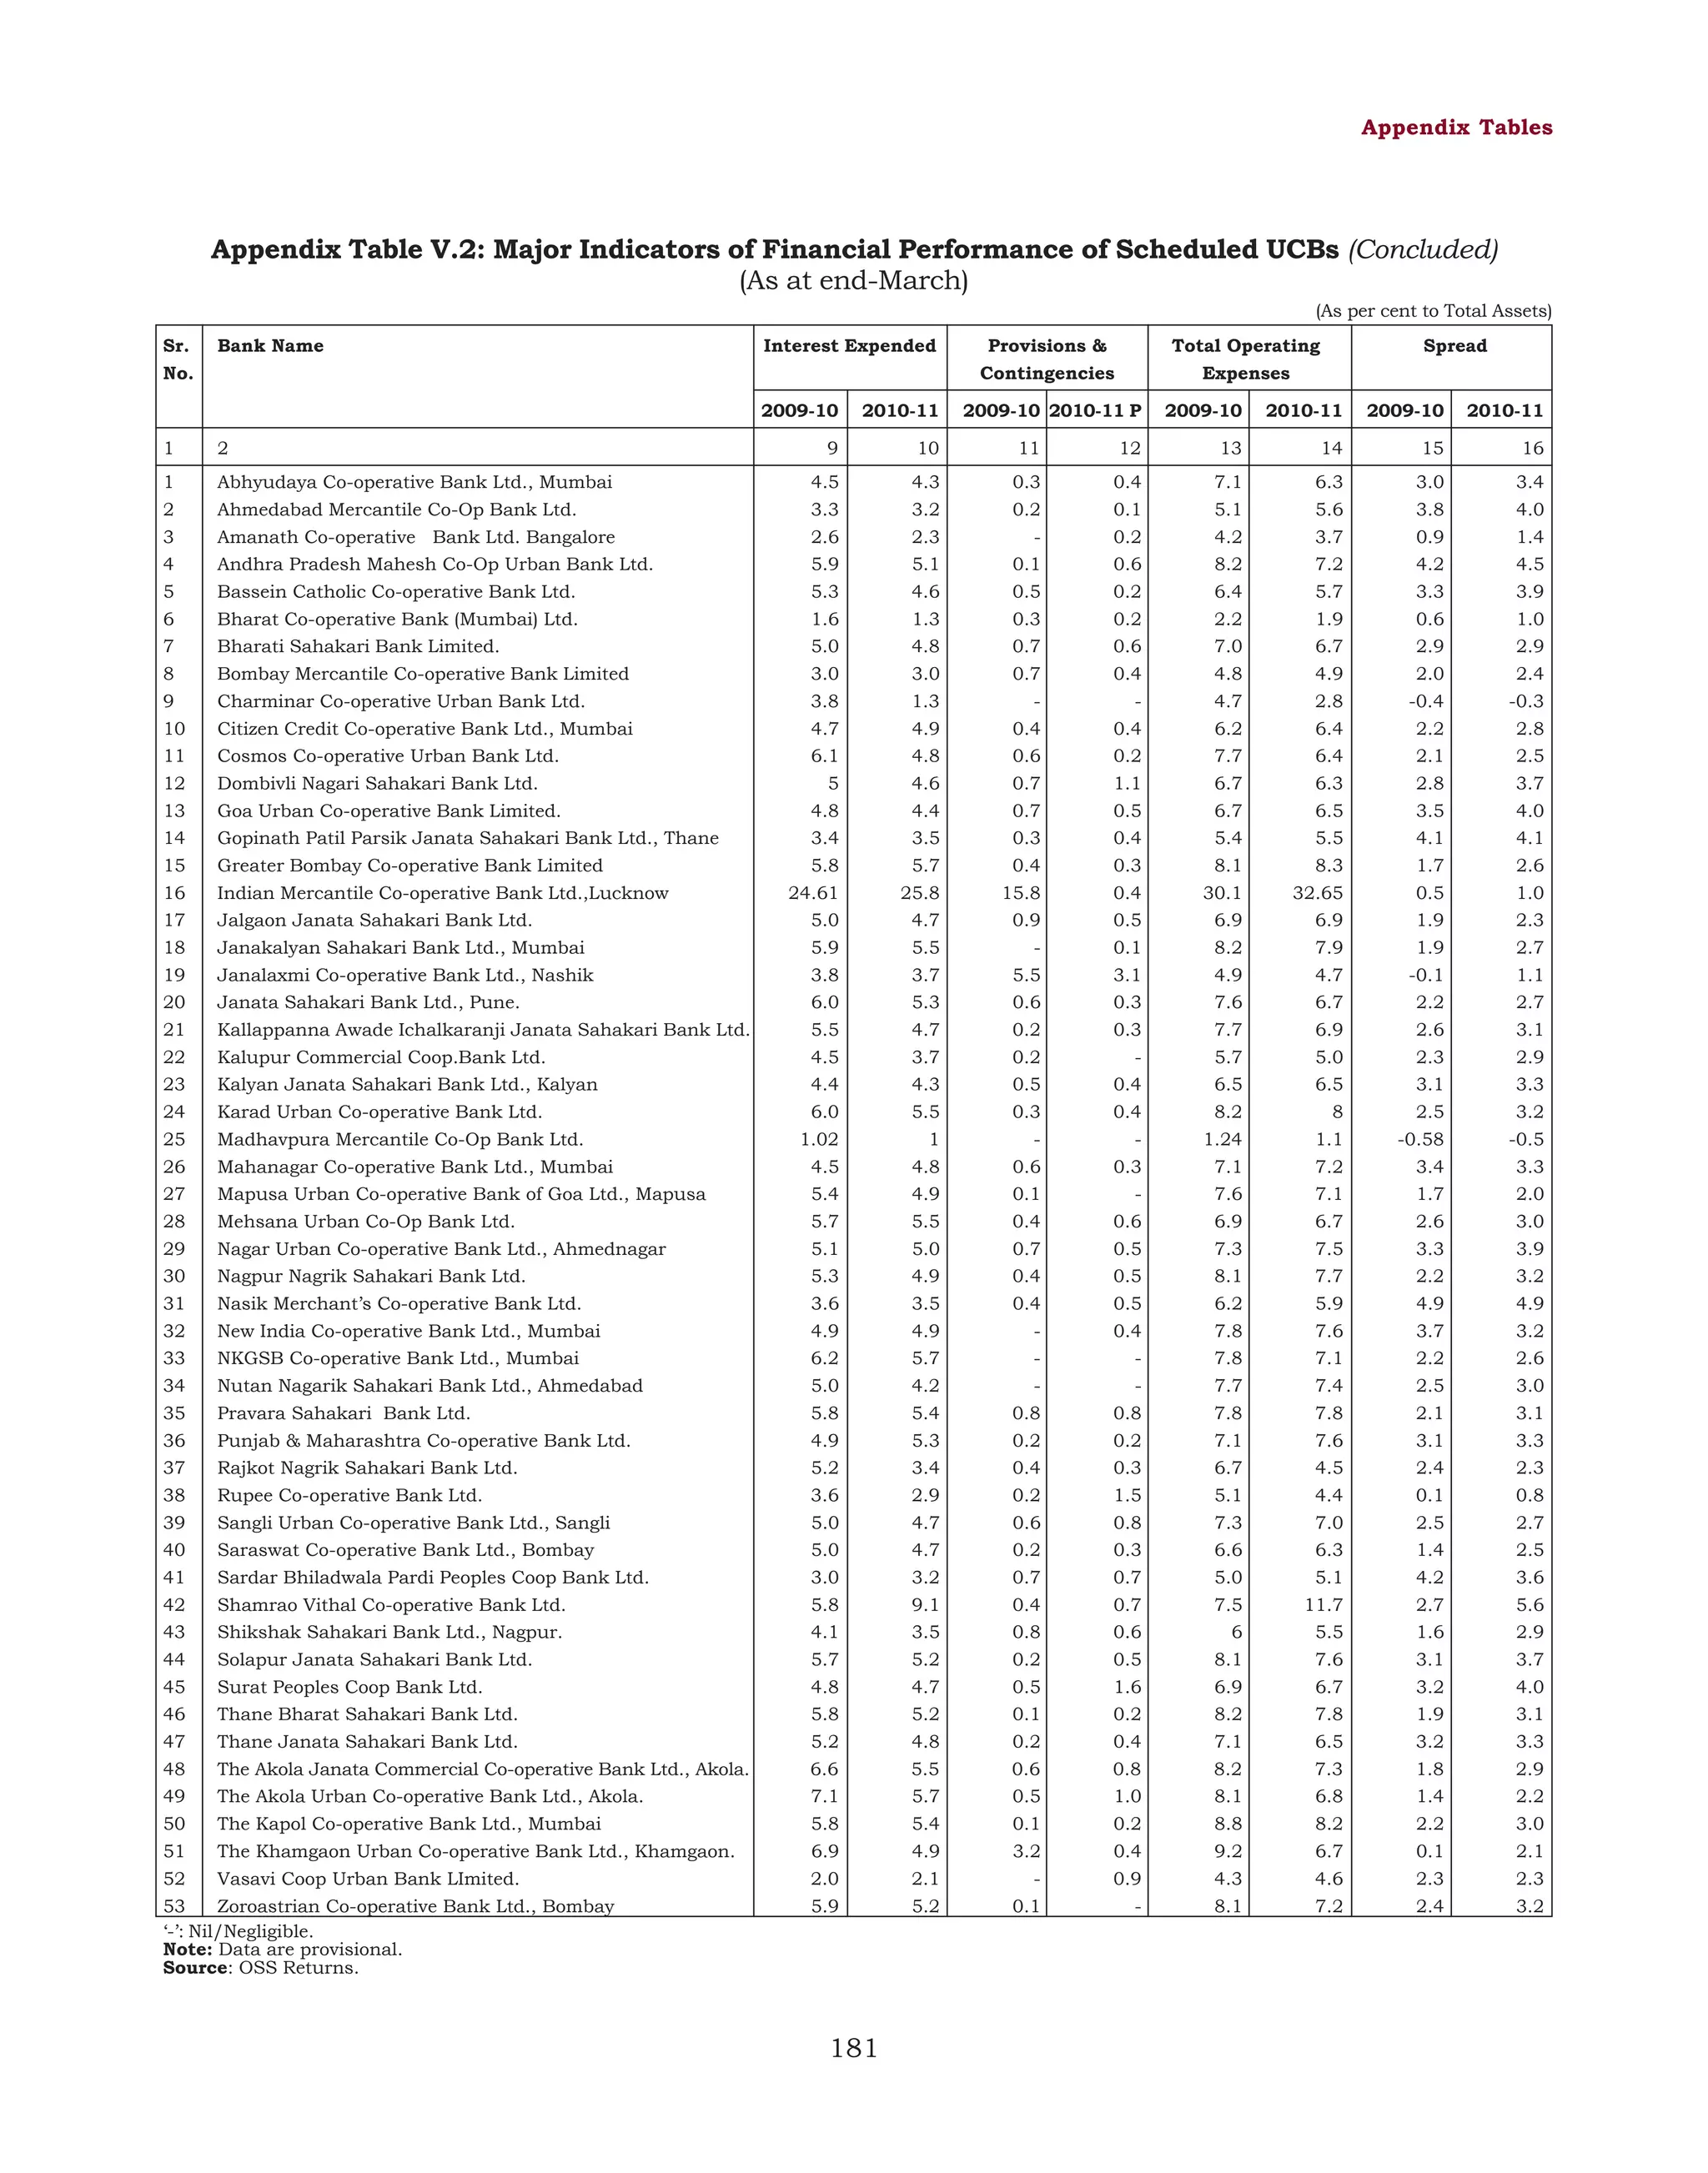
![Developments in Cooperative Banking
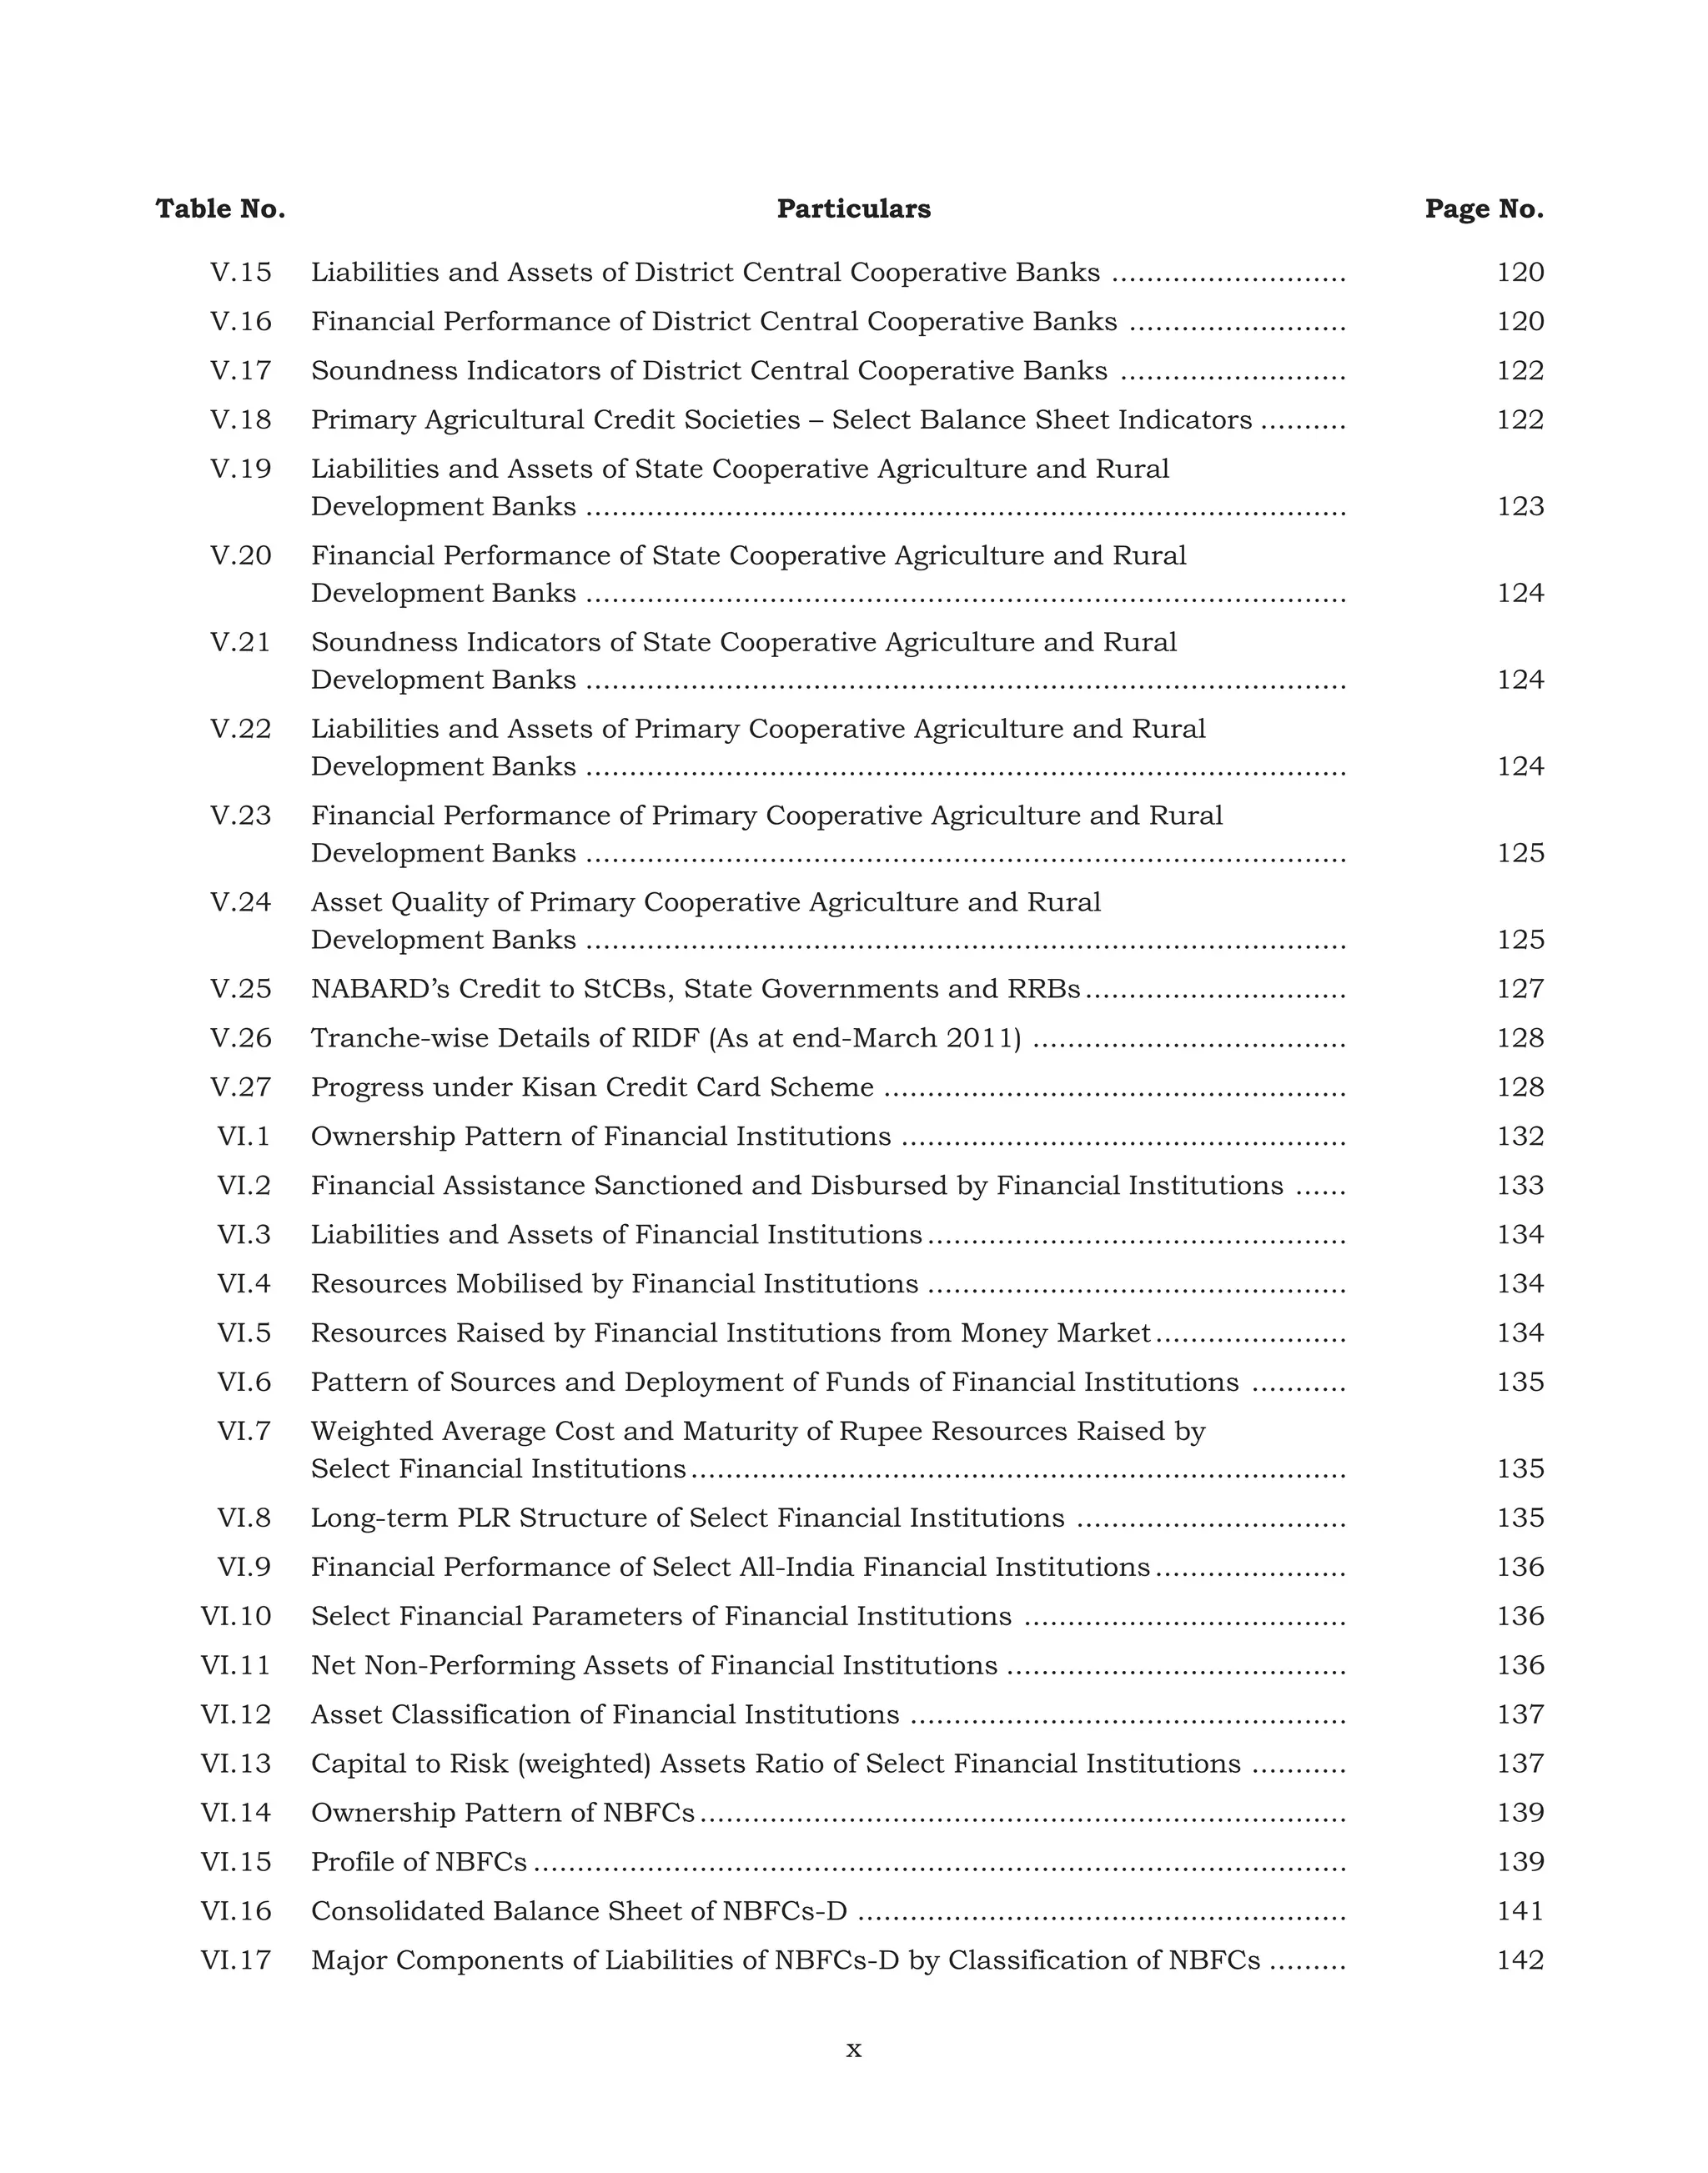
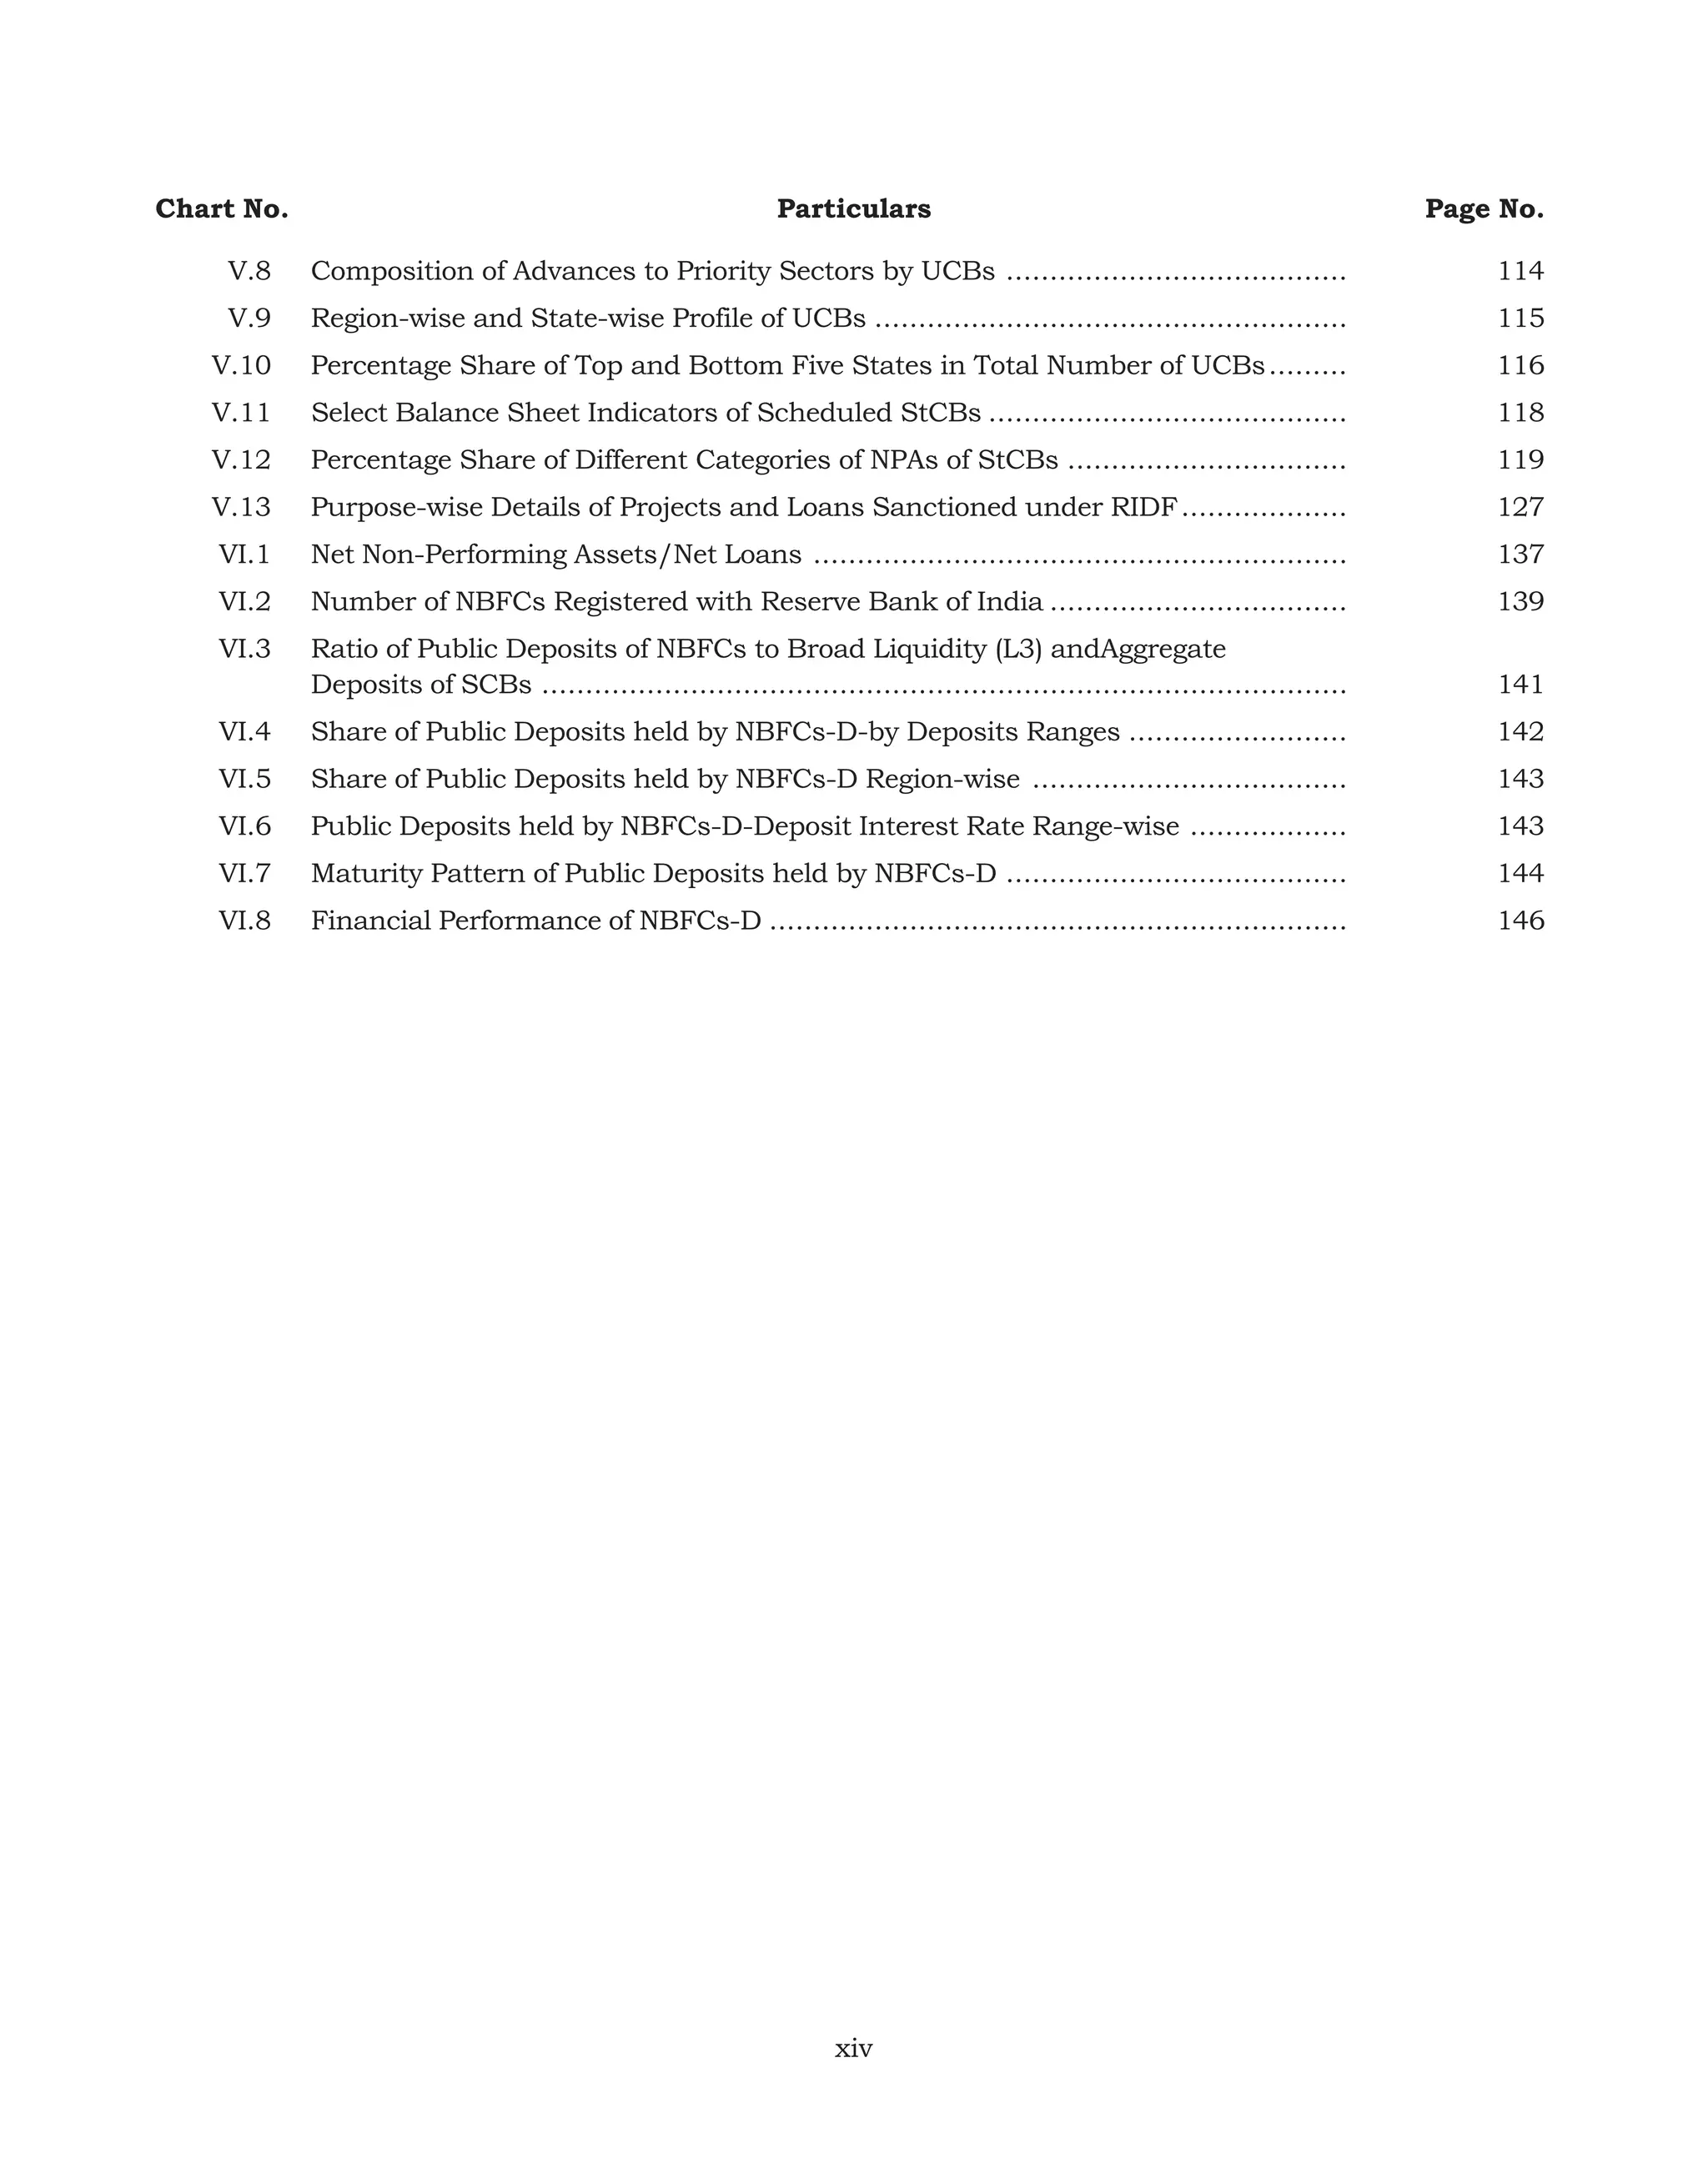
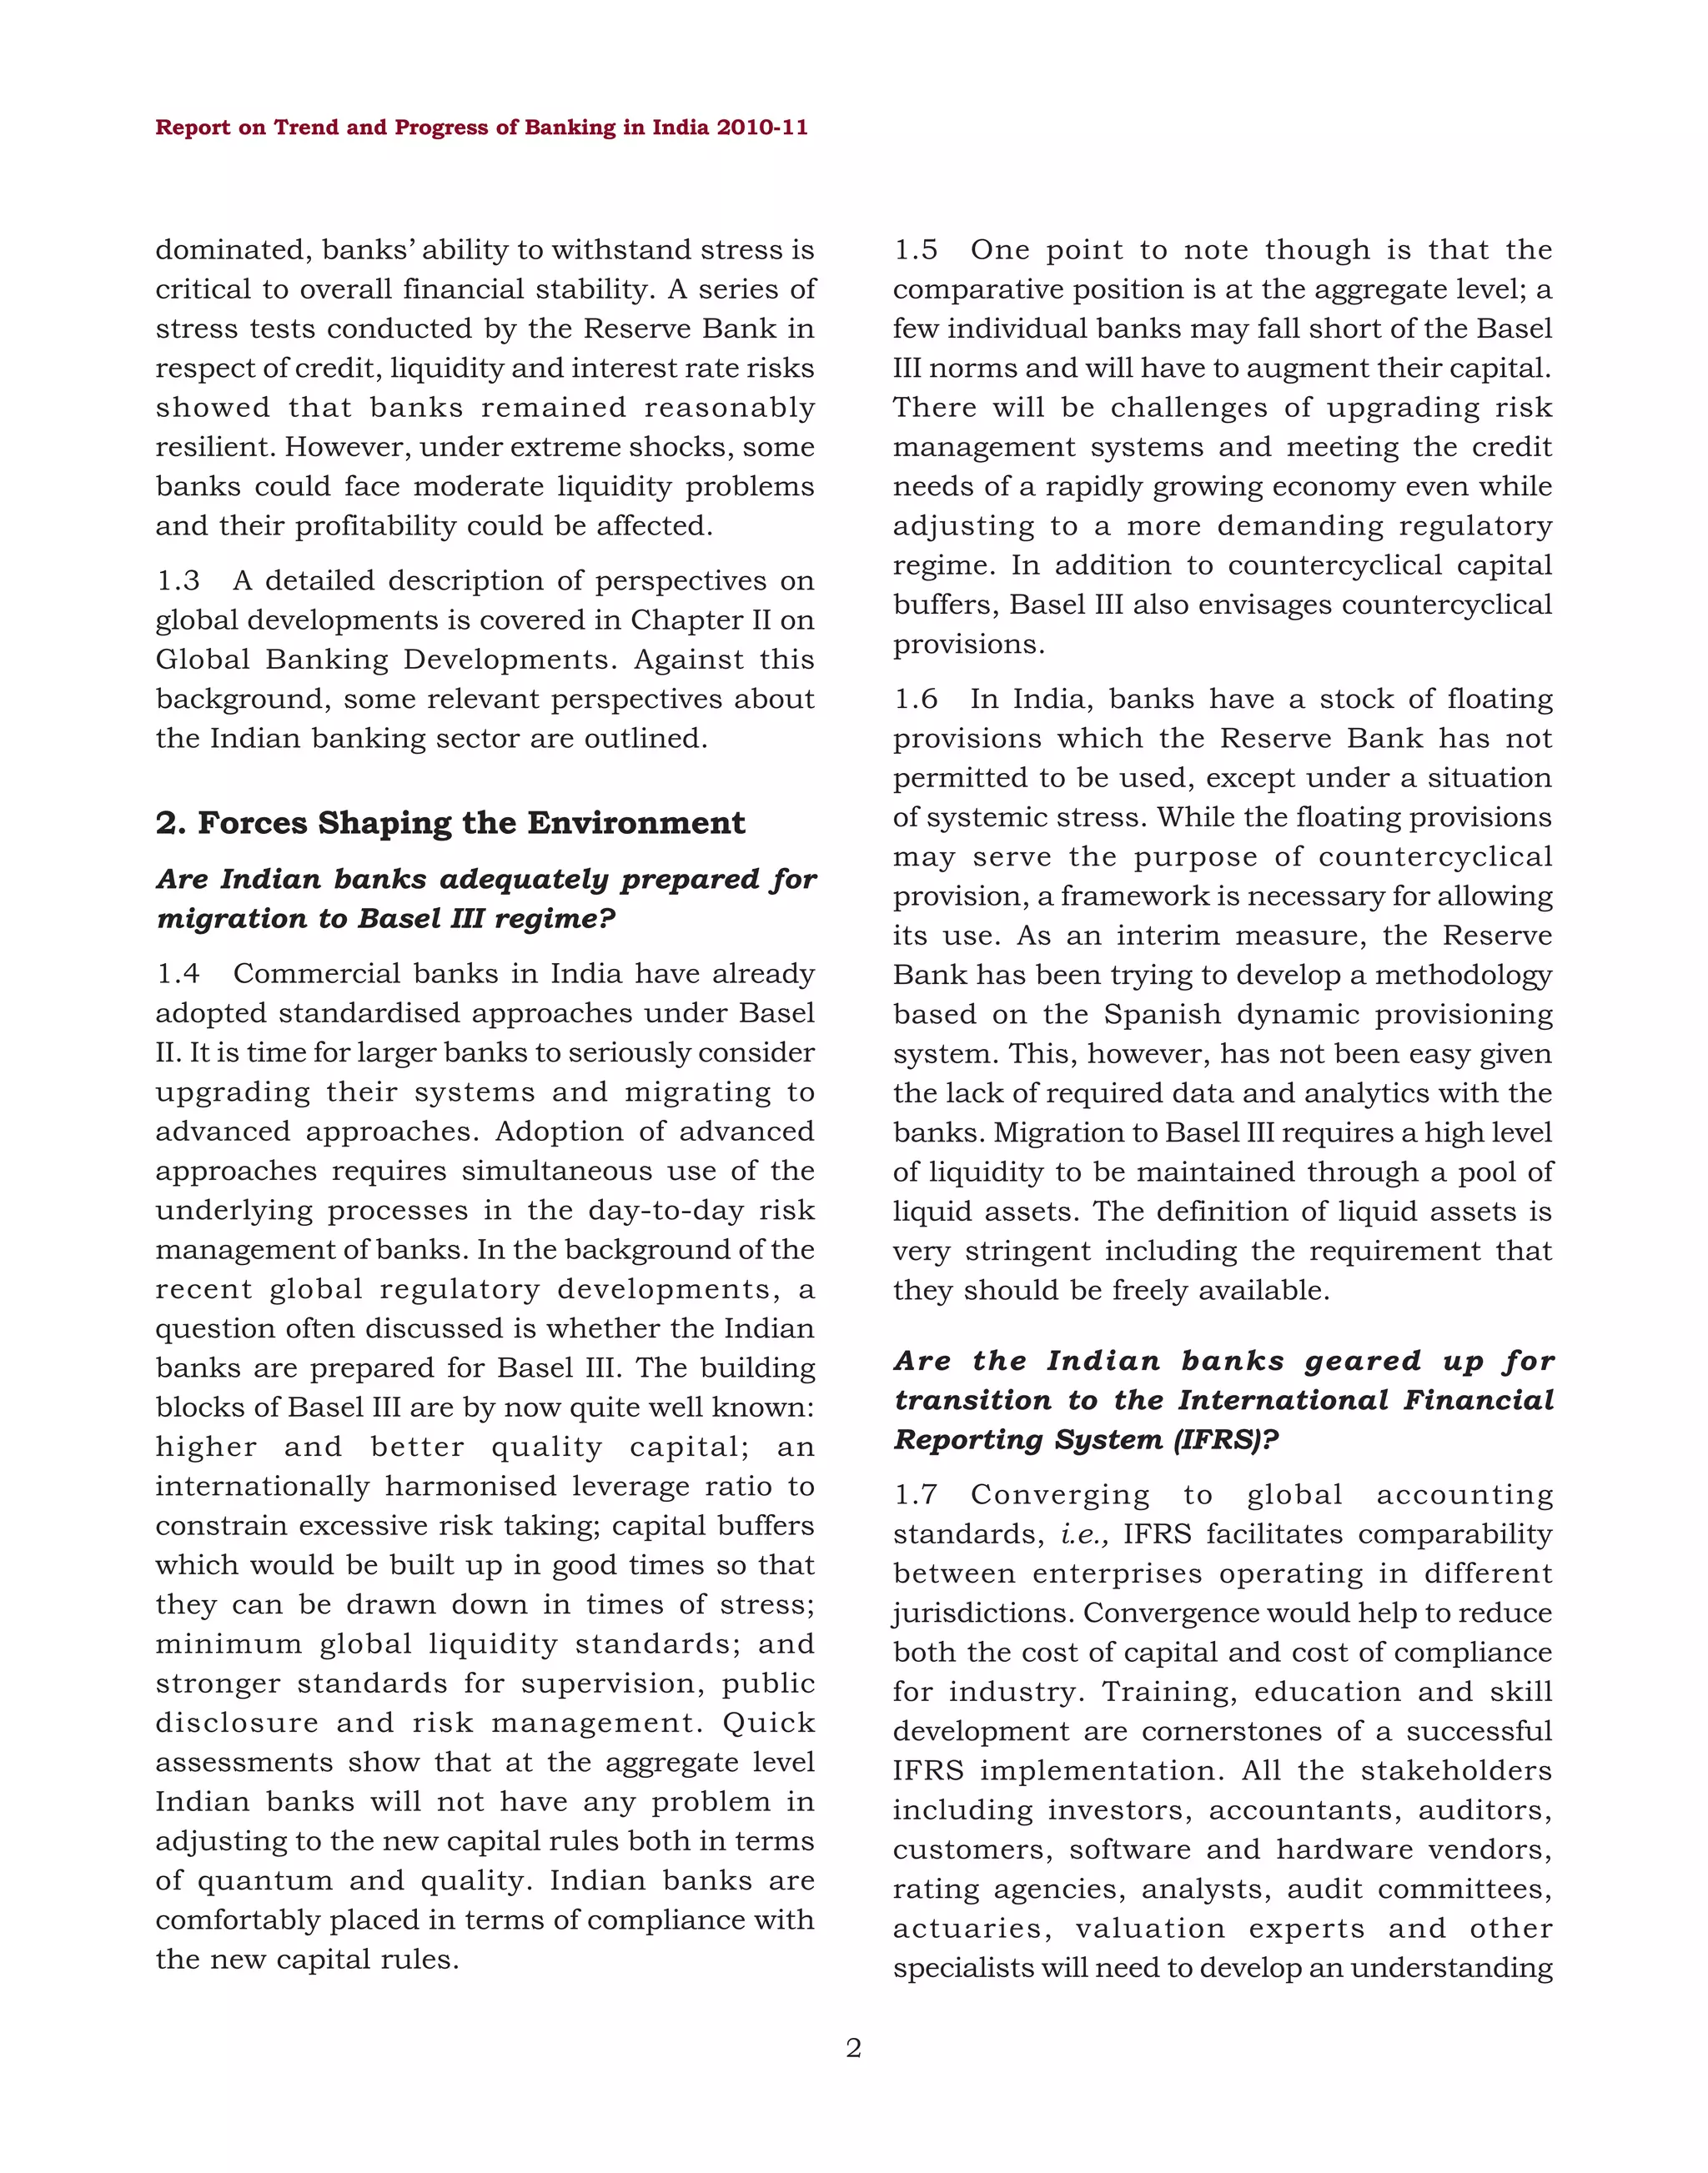
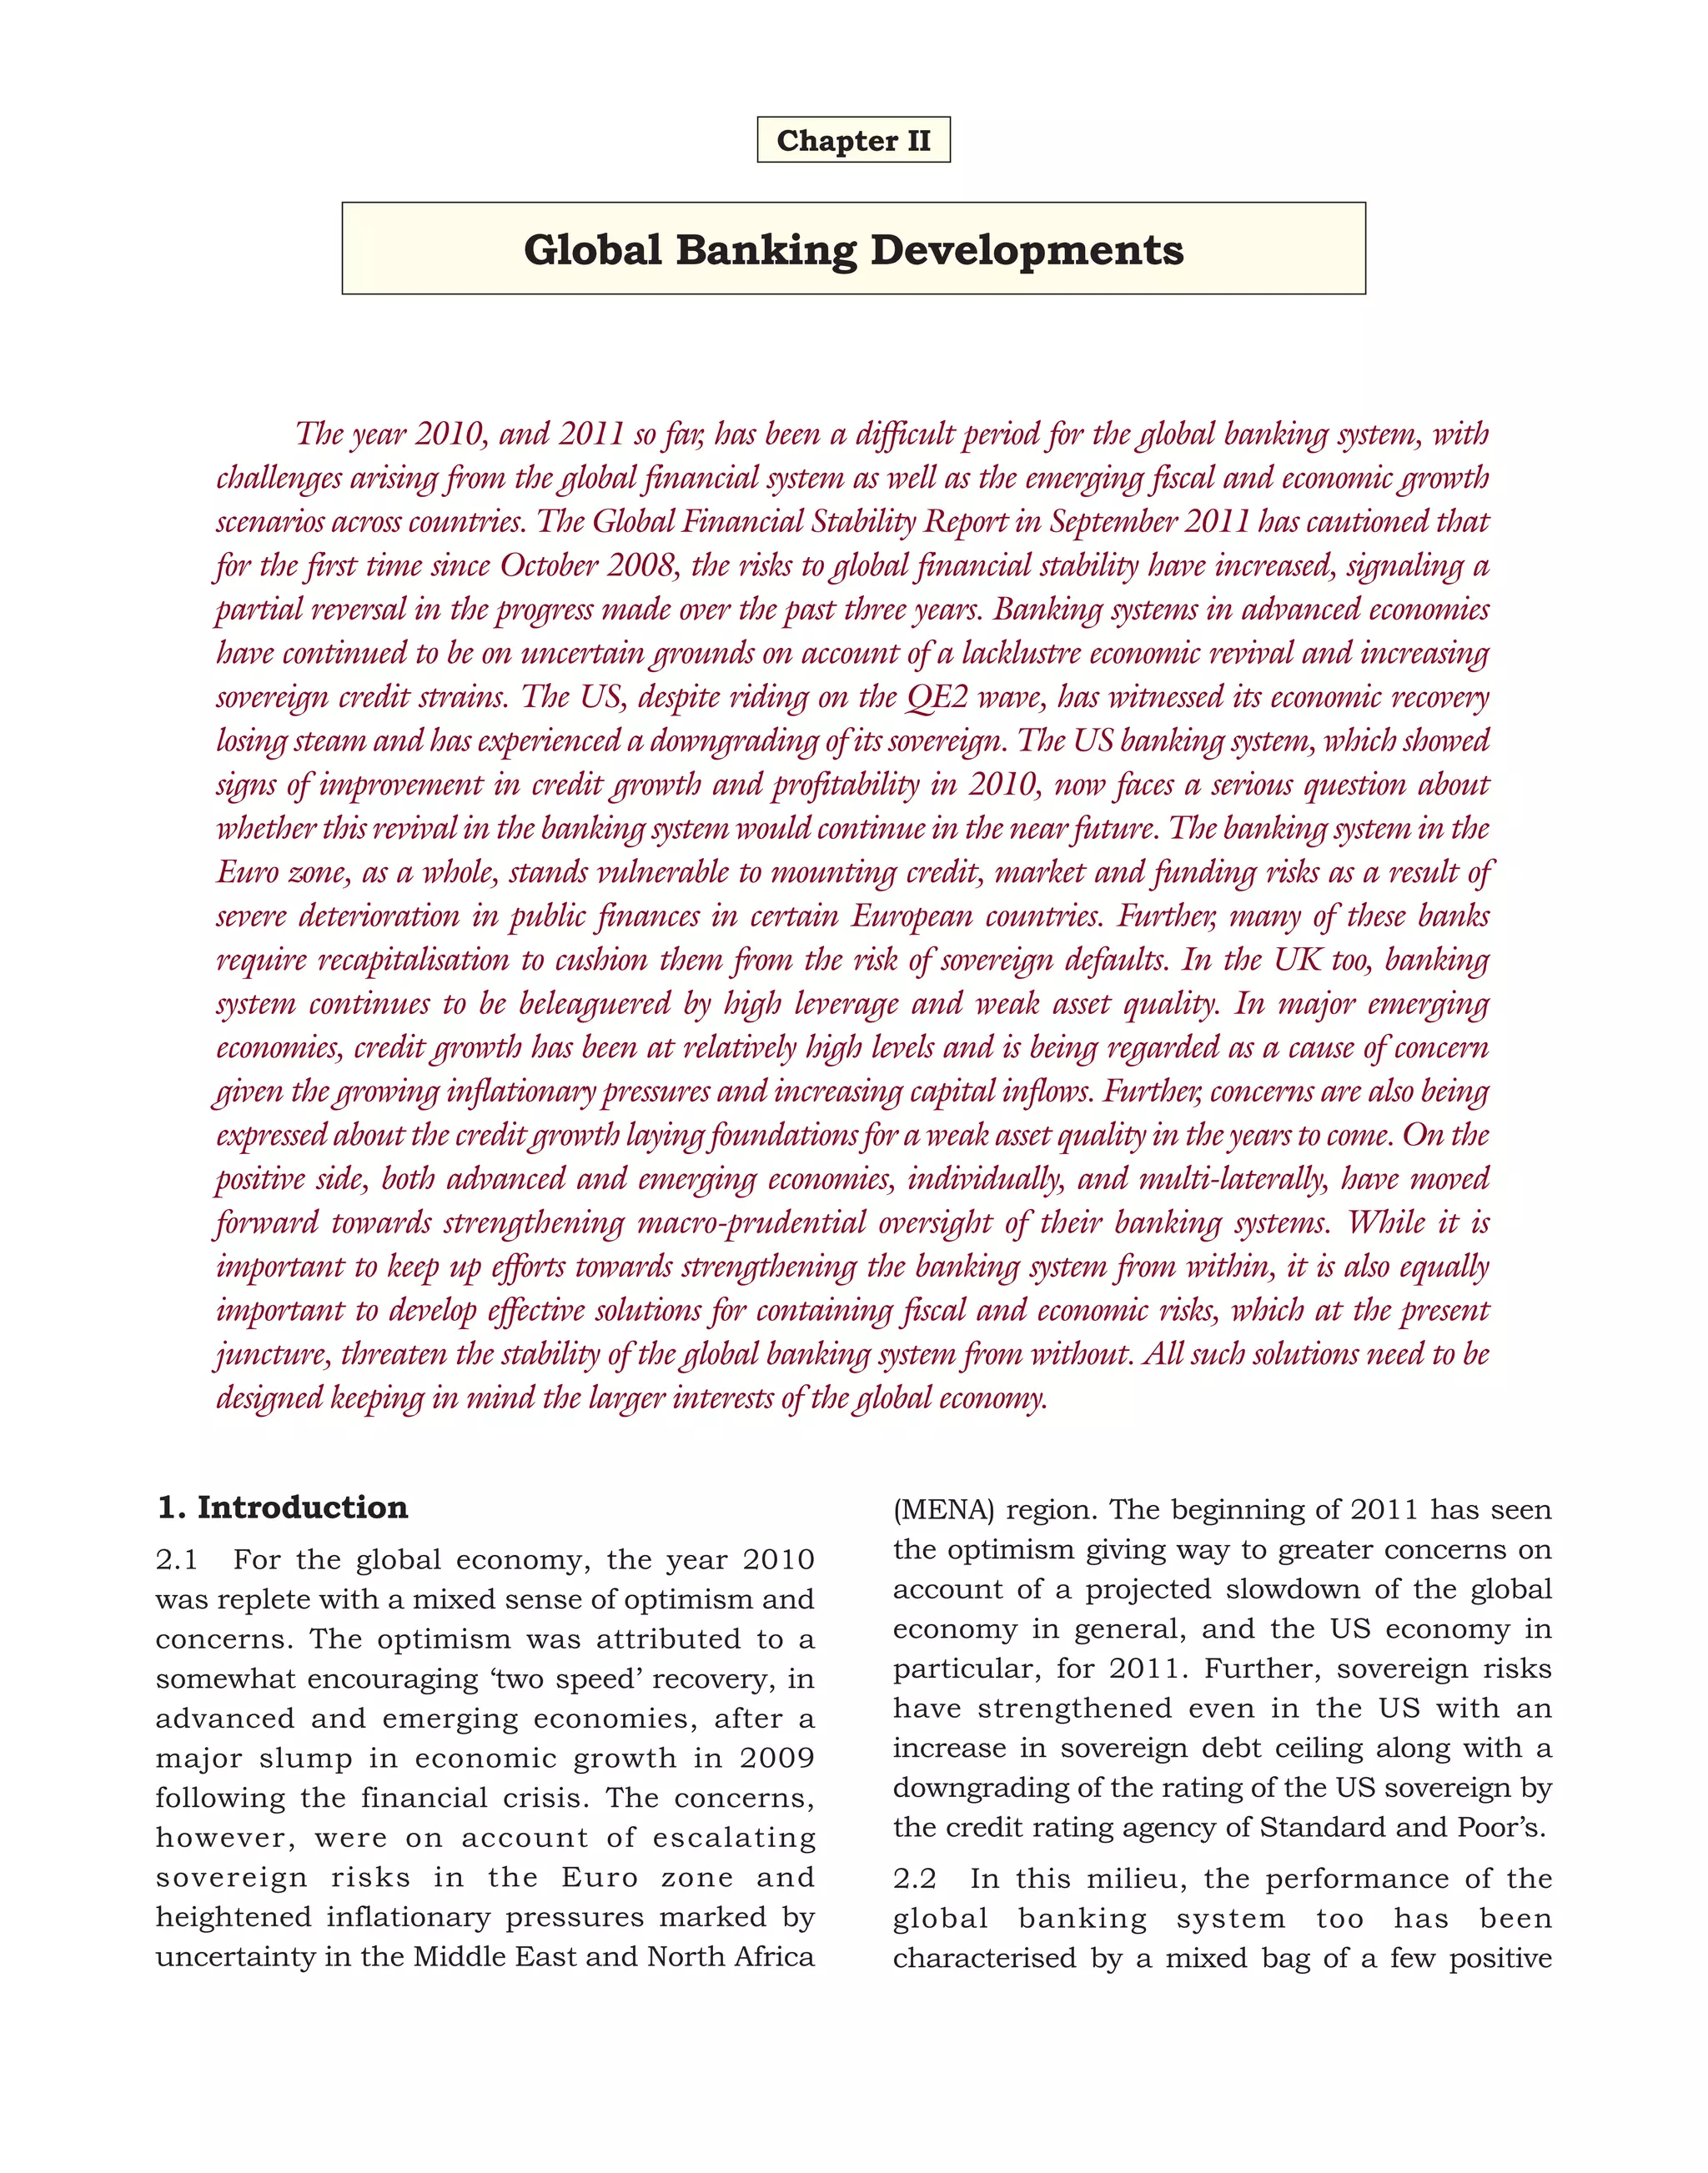
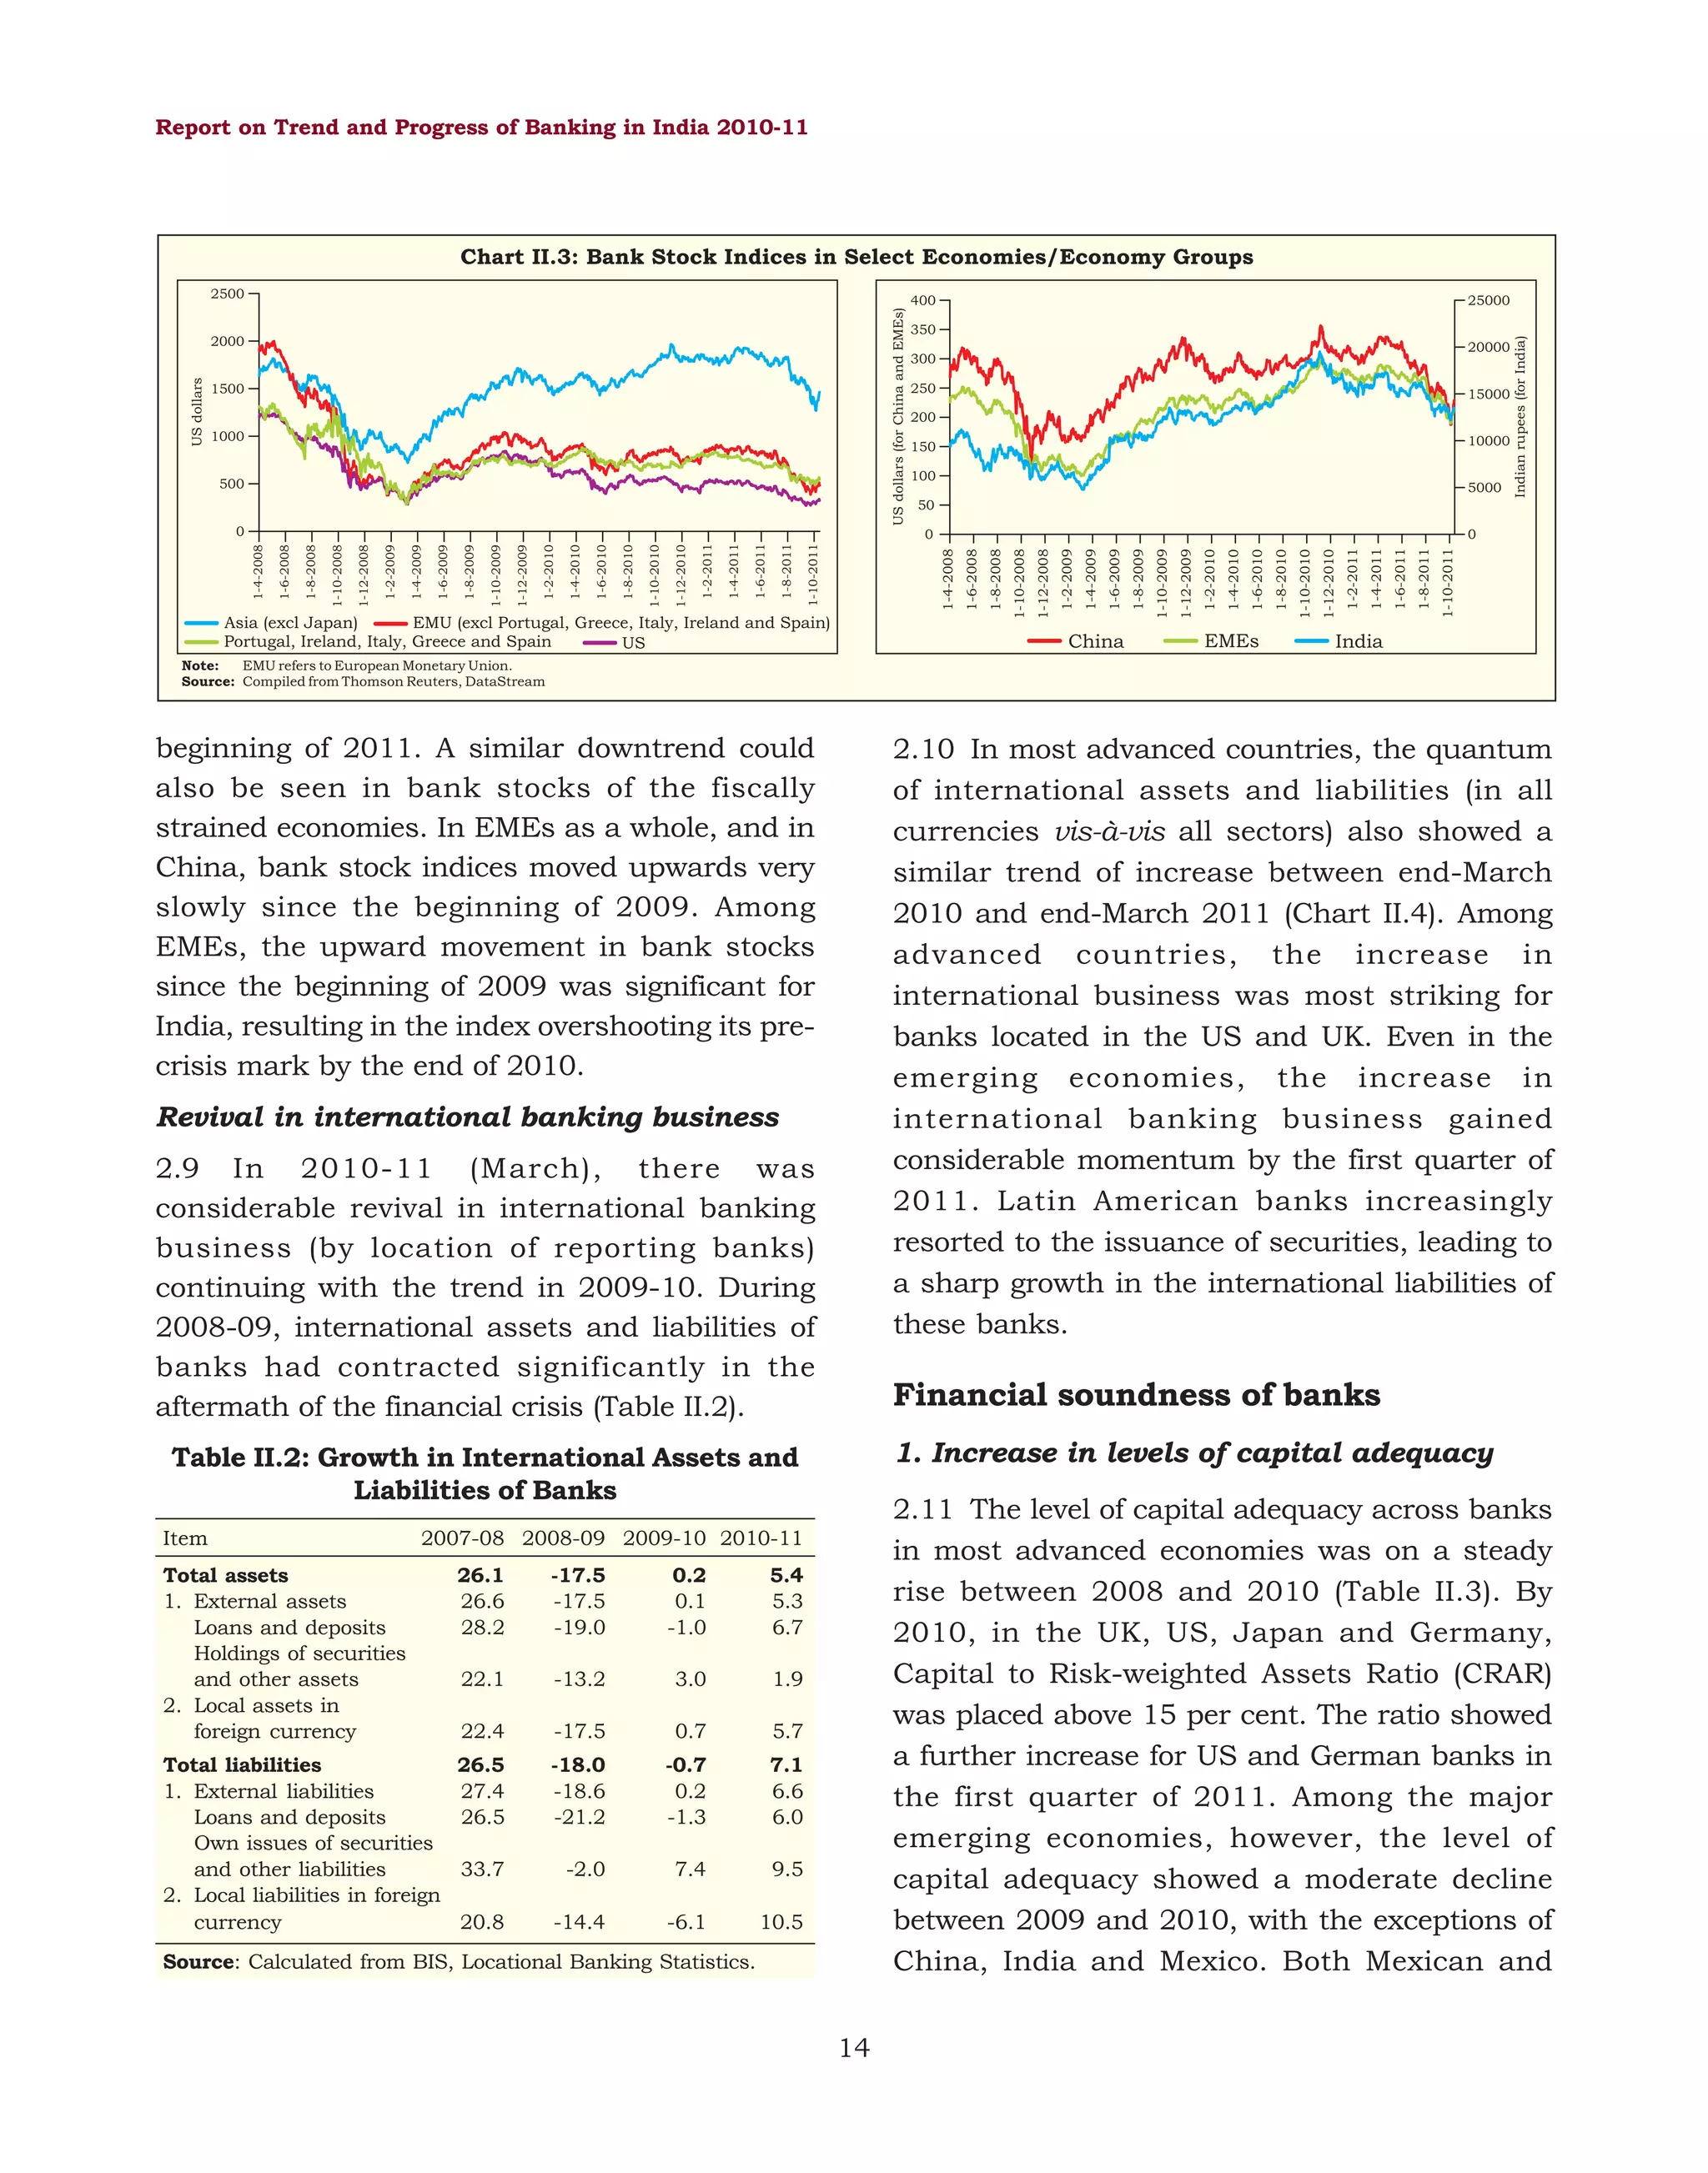
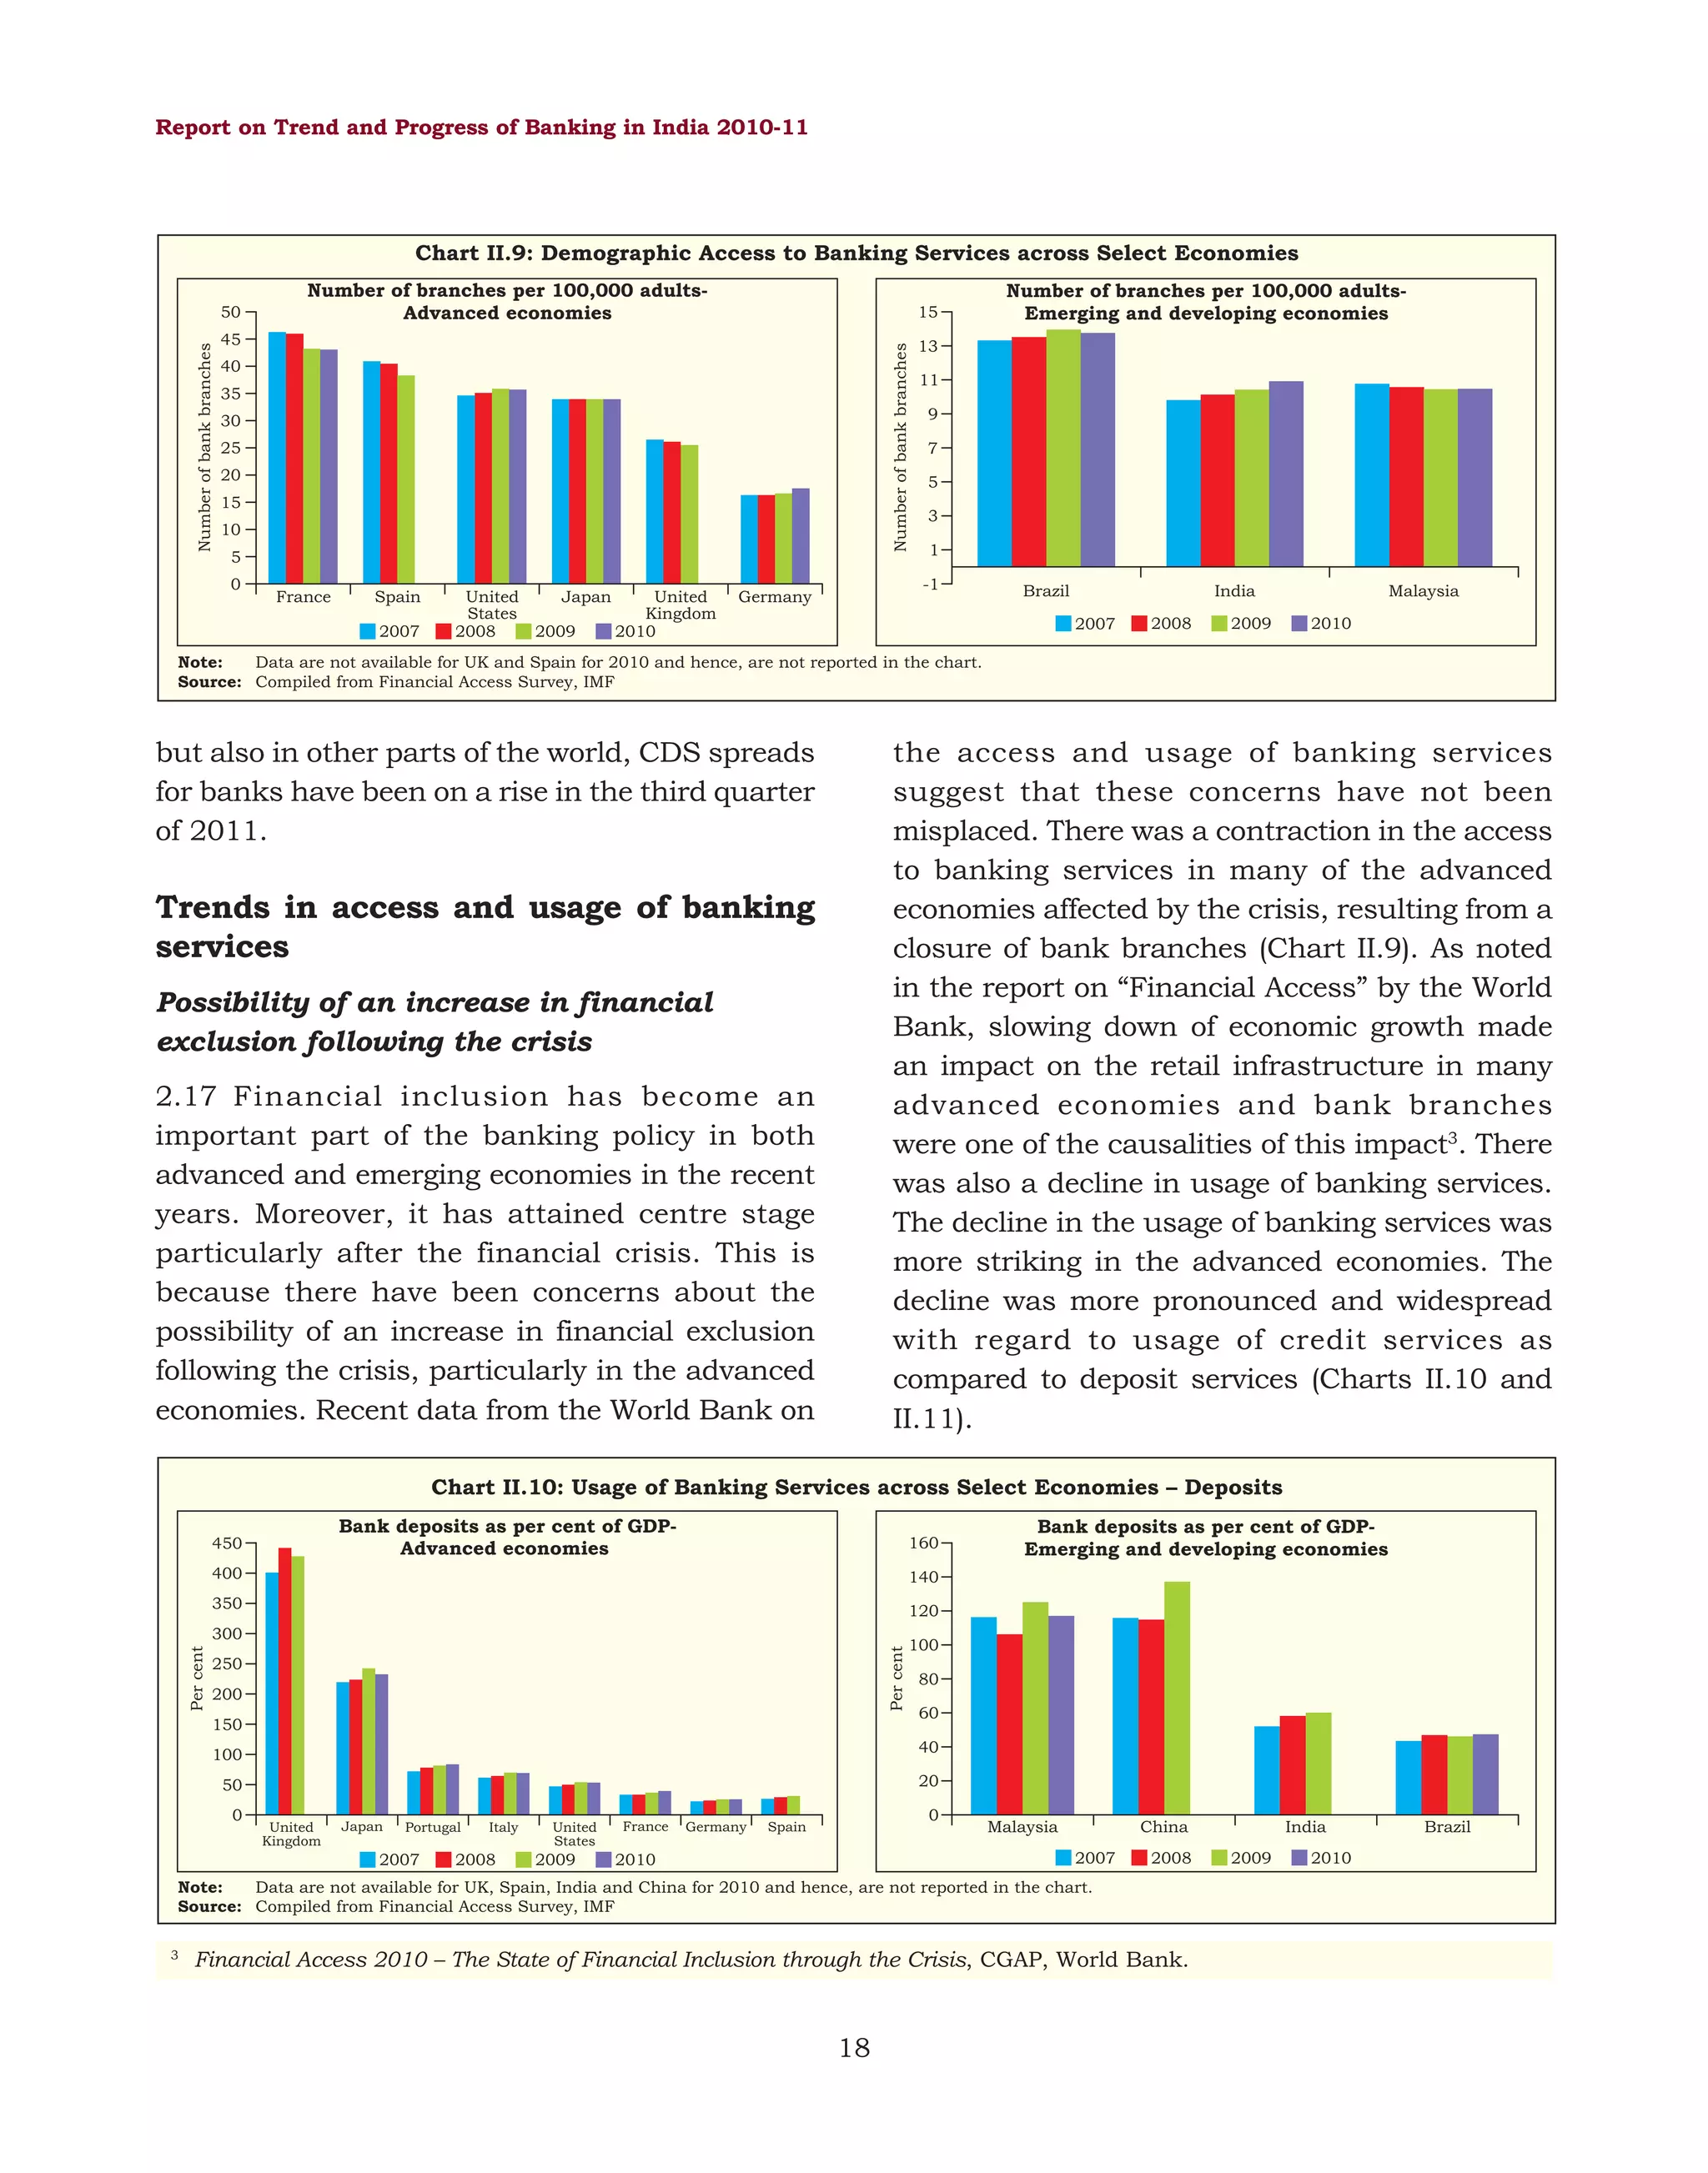
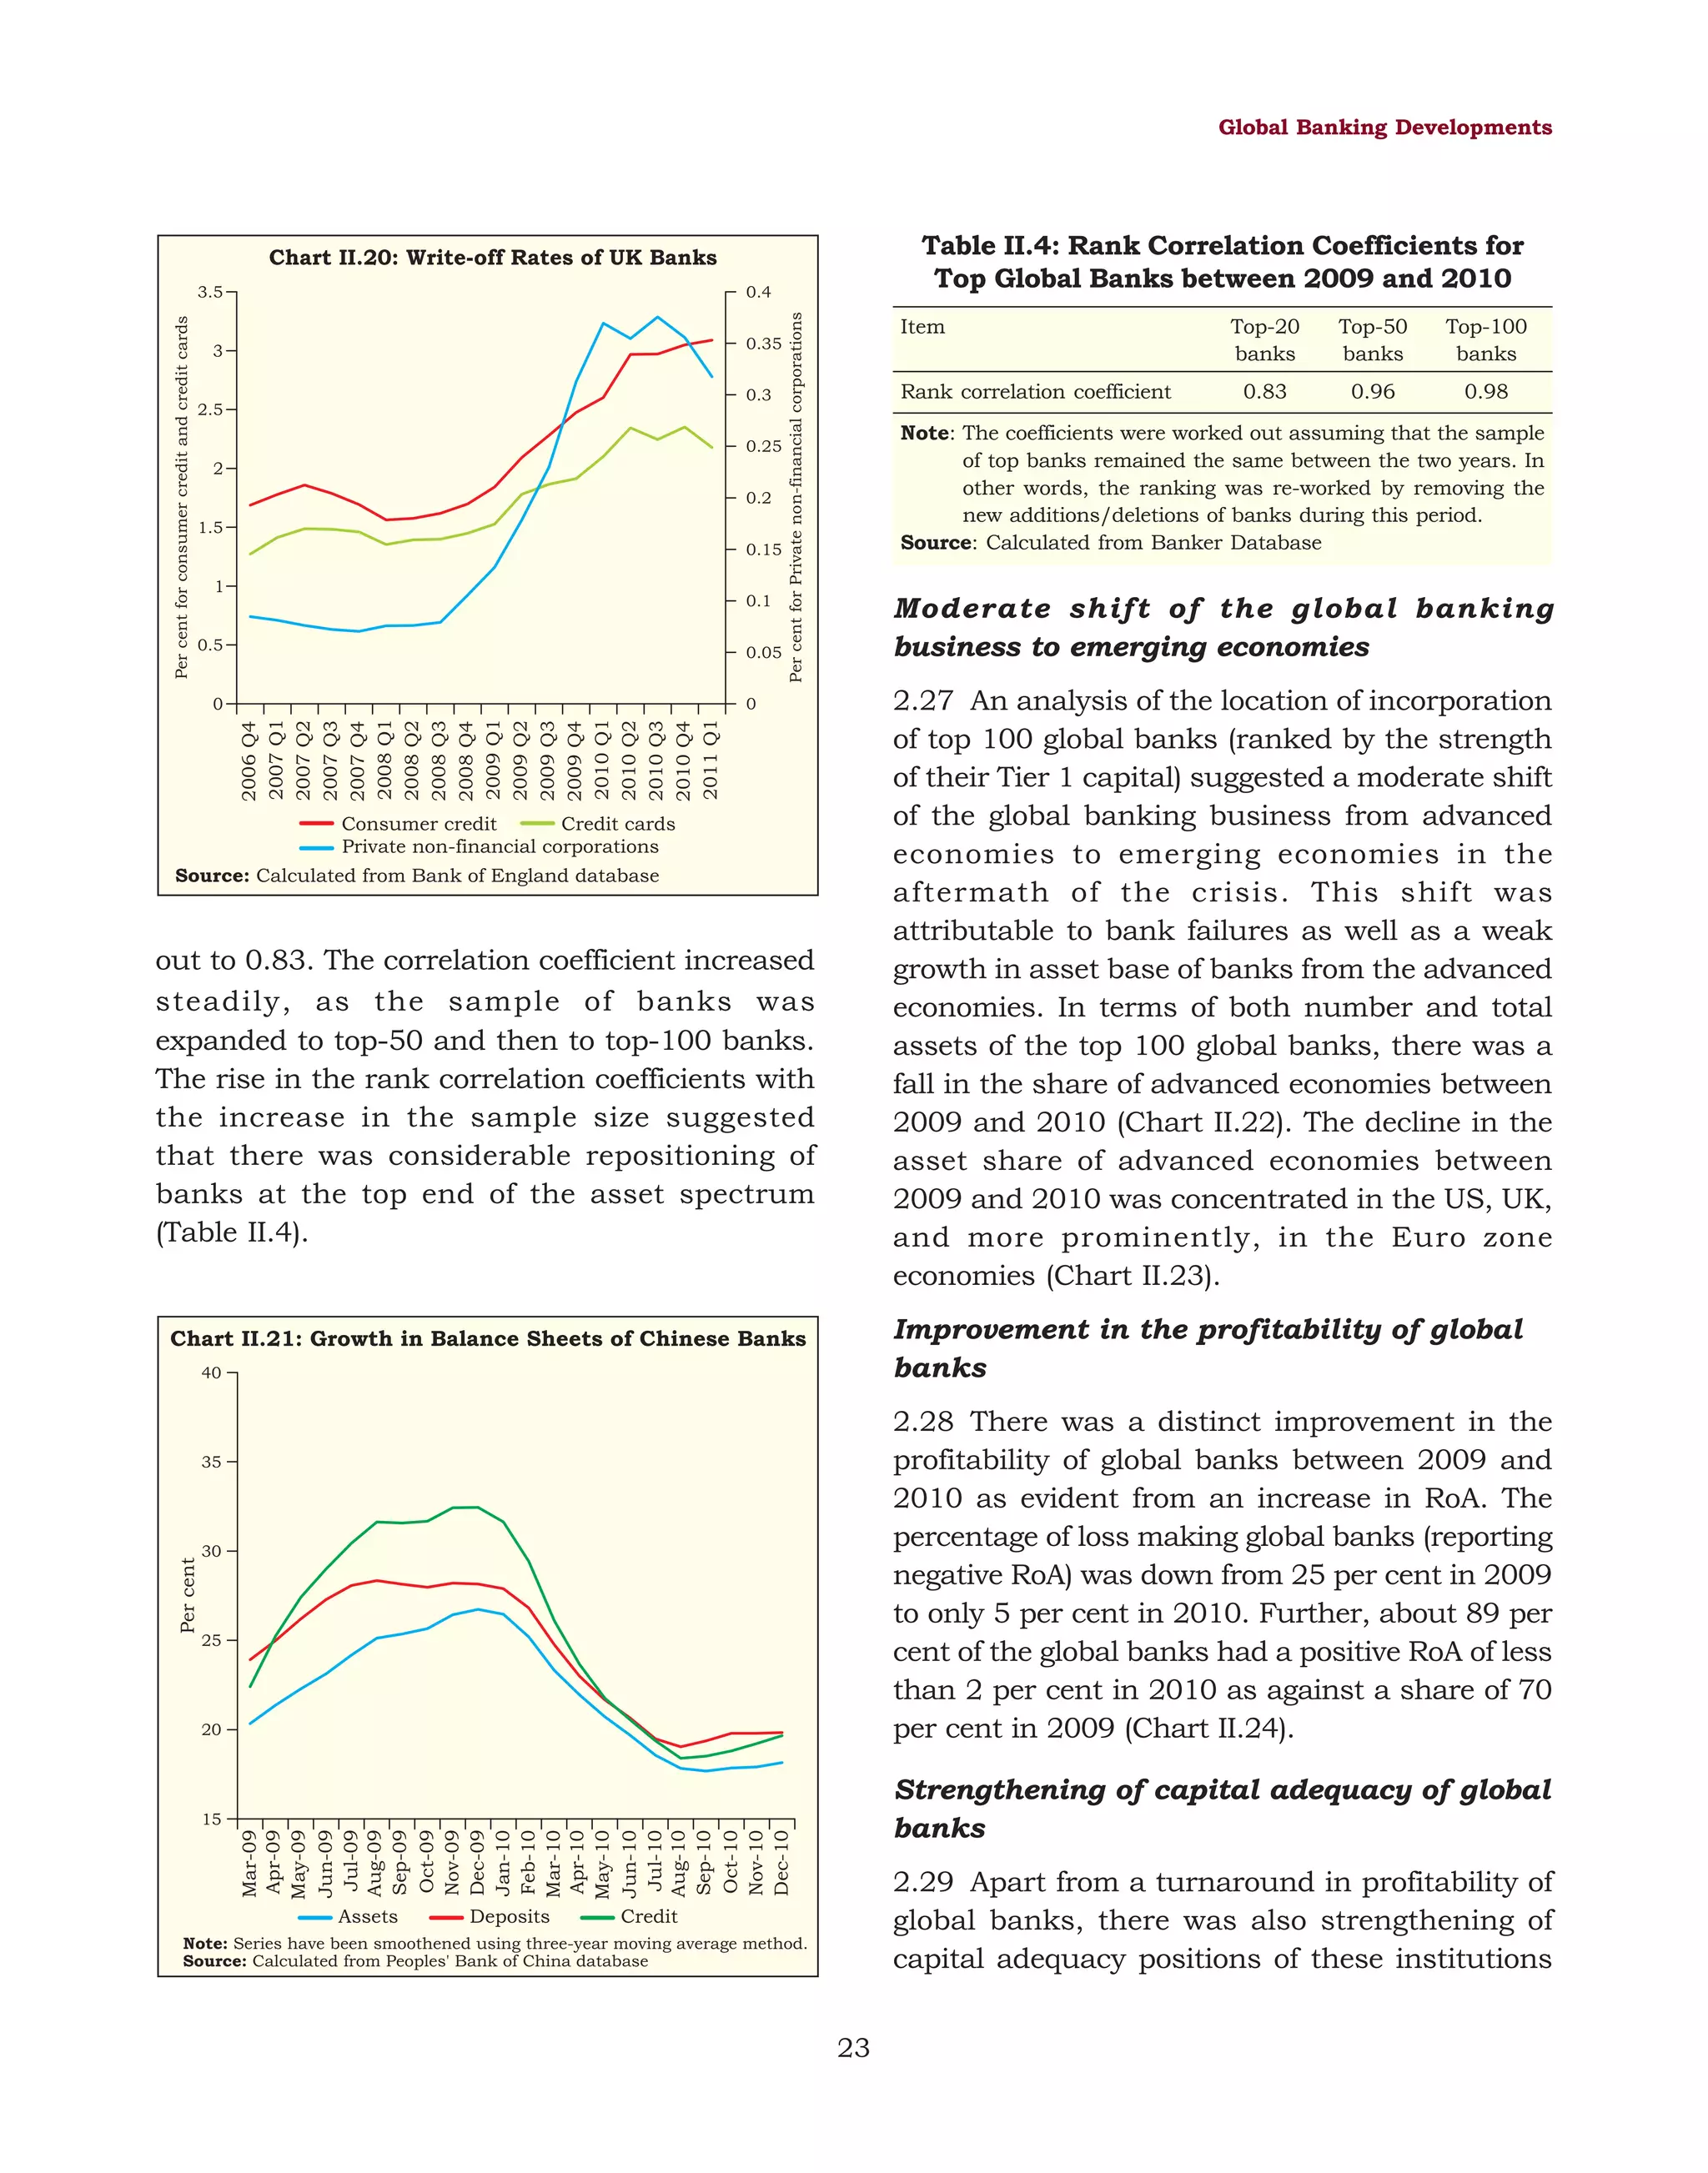
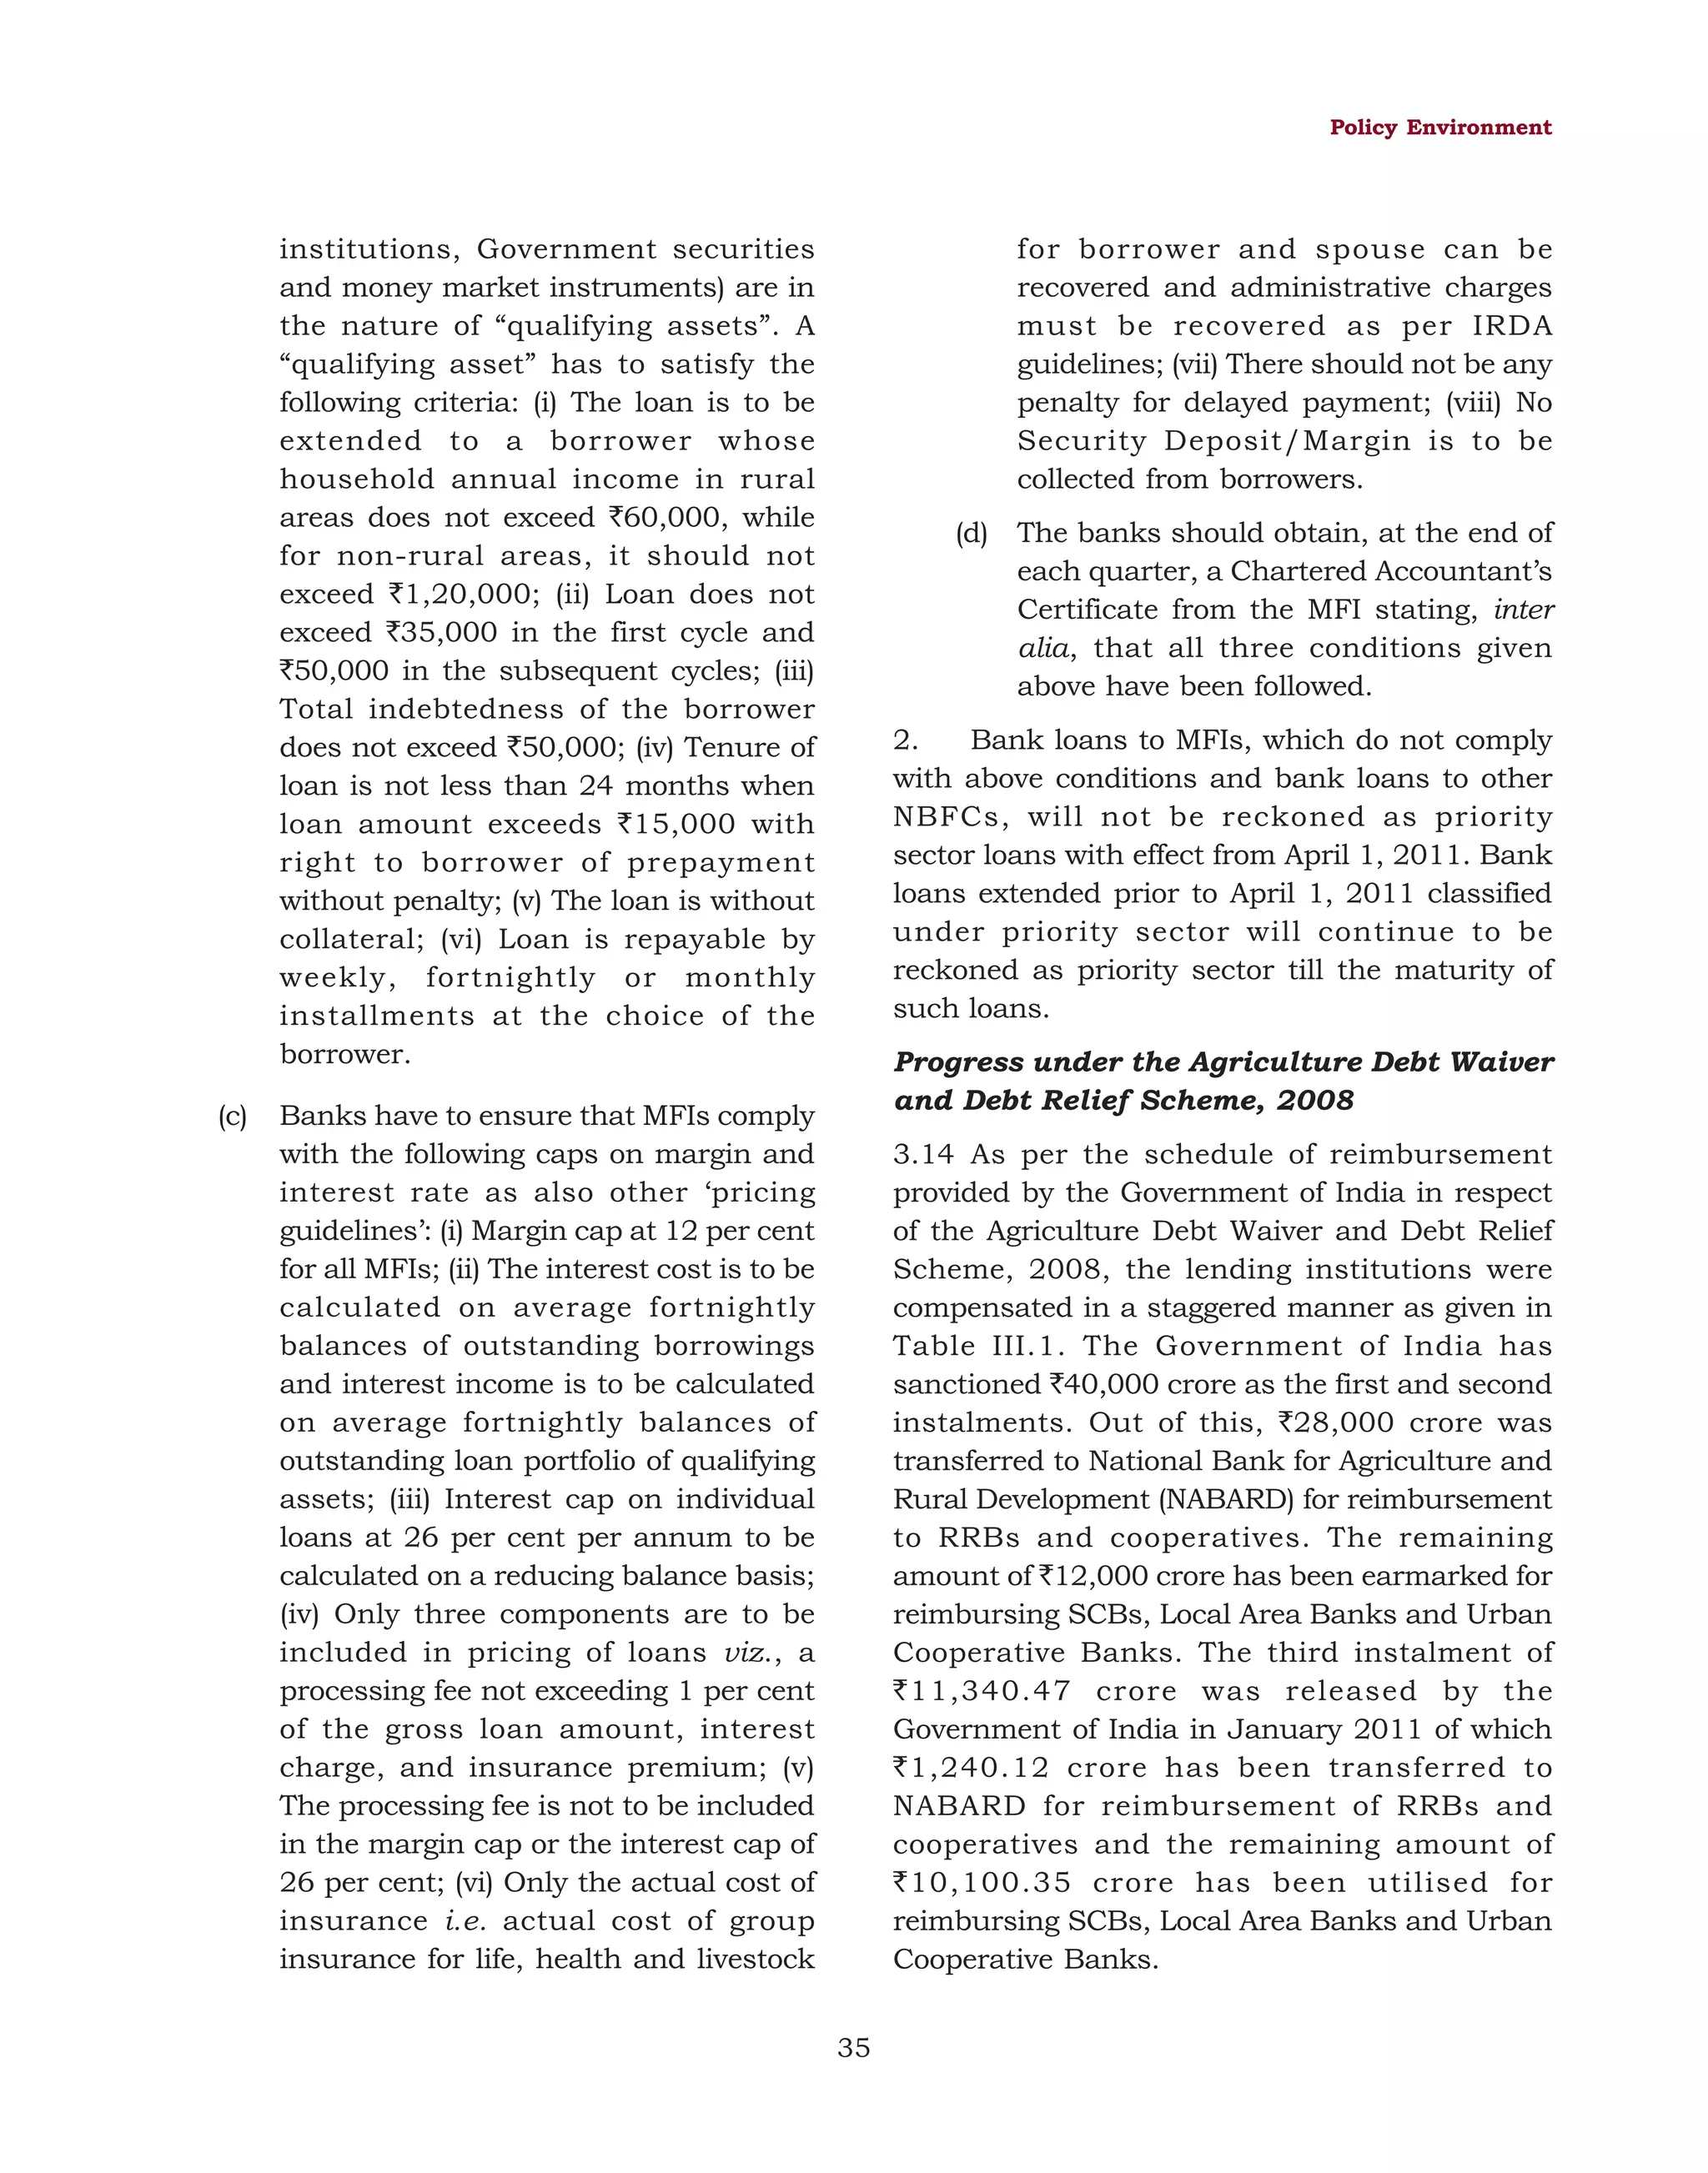
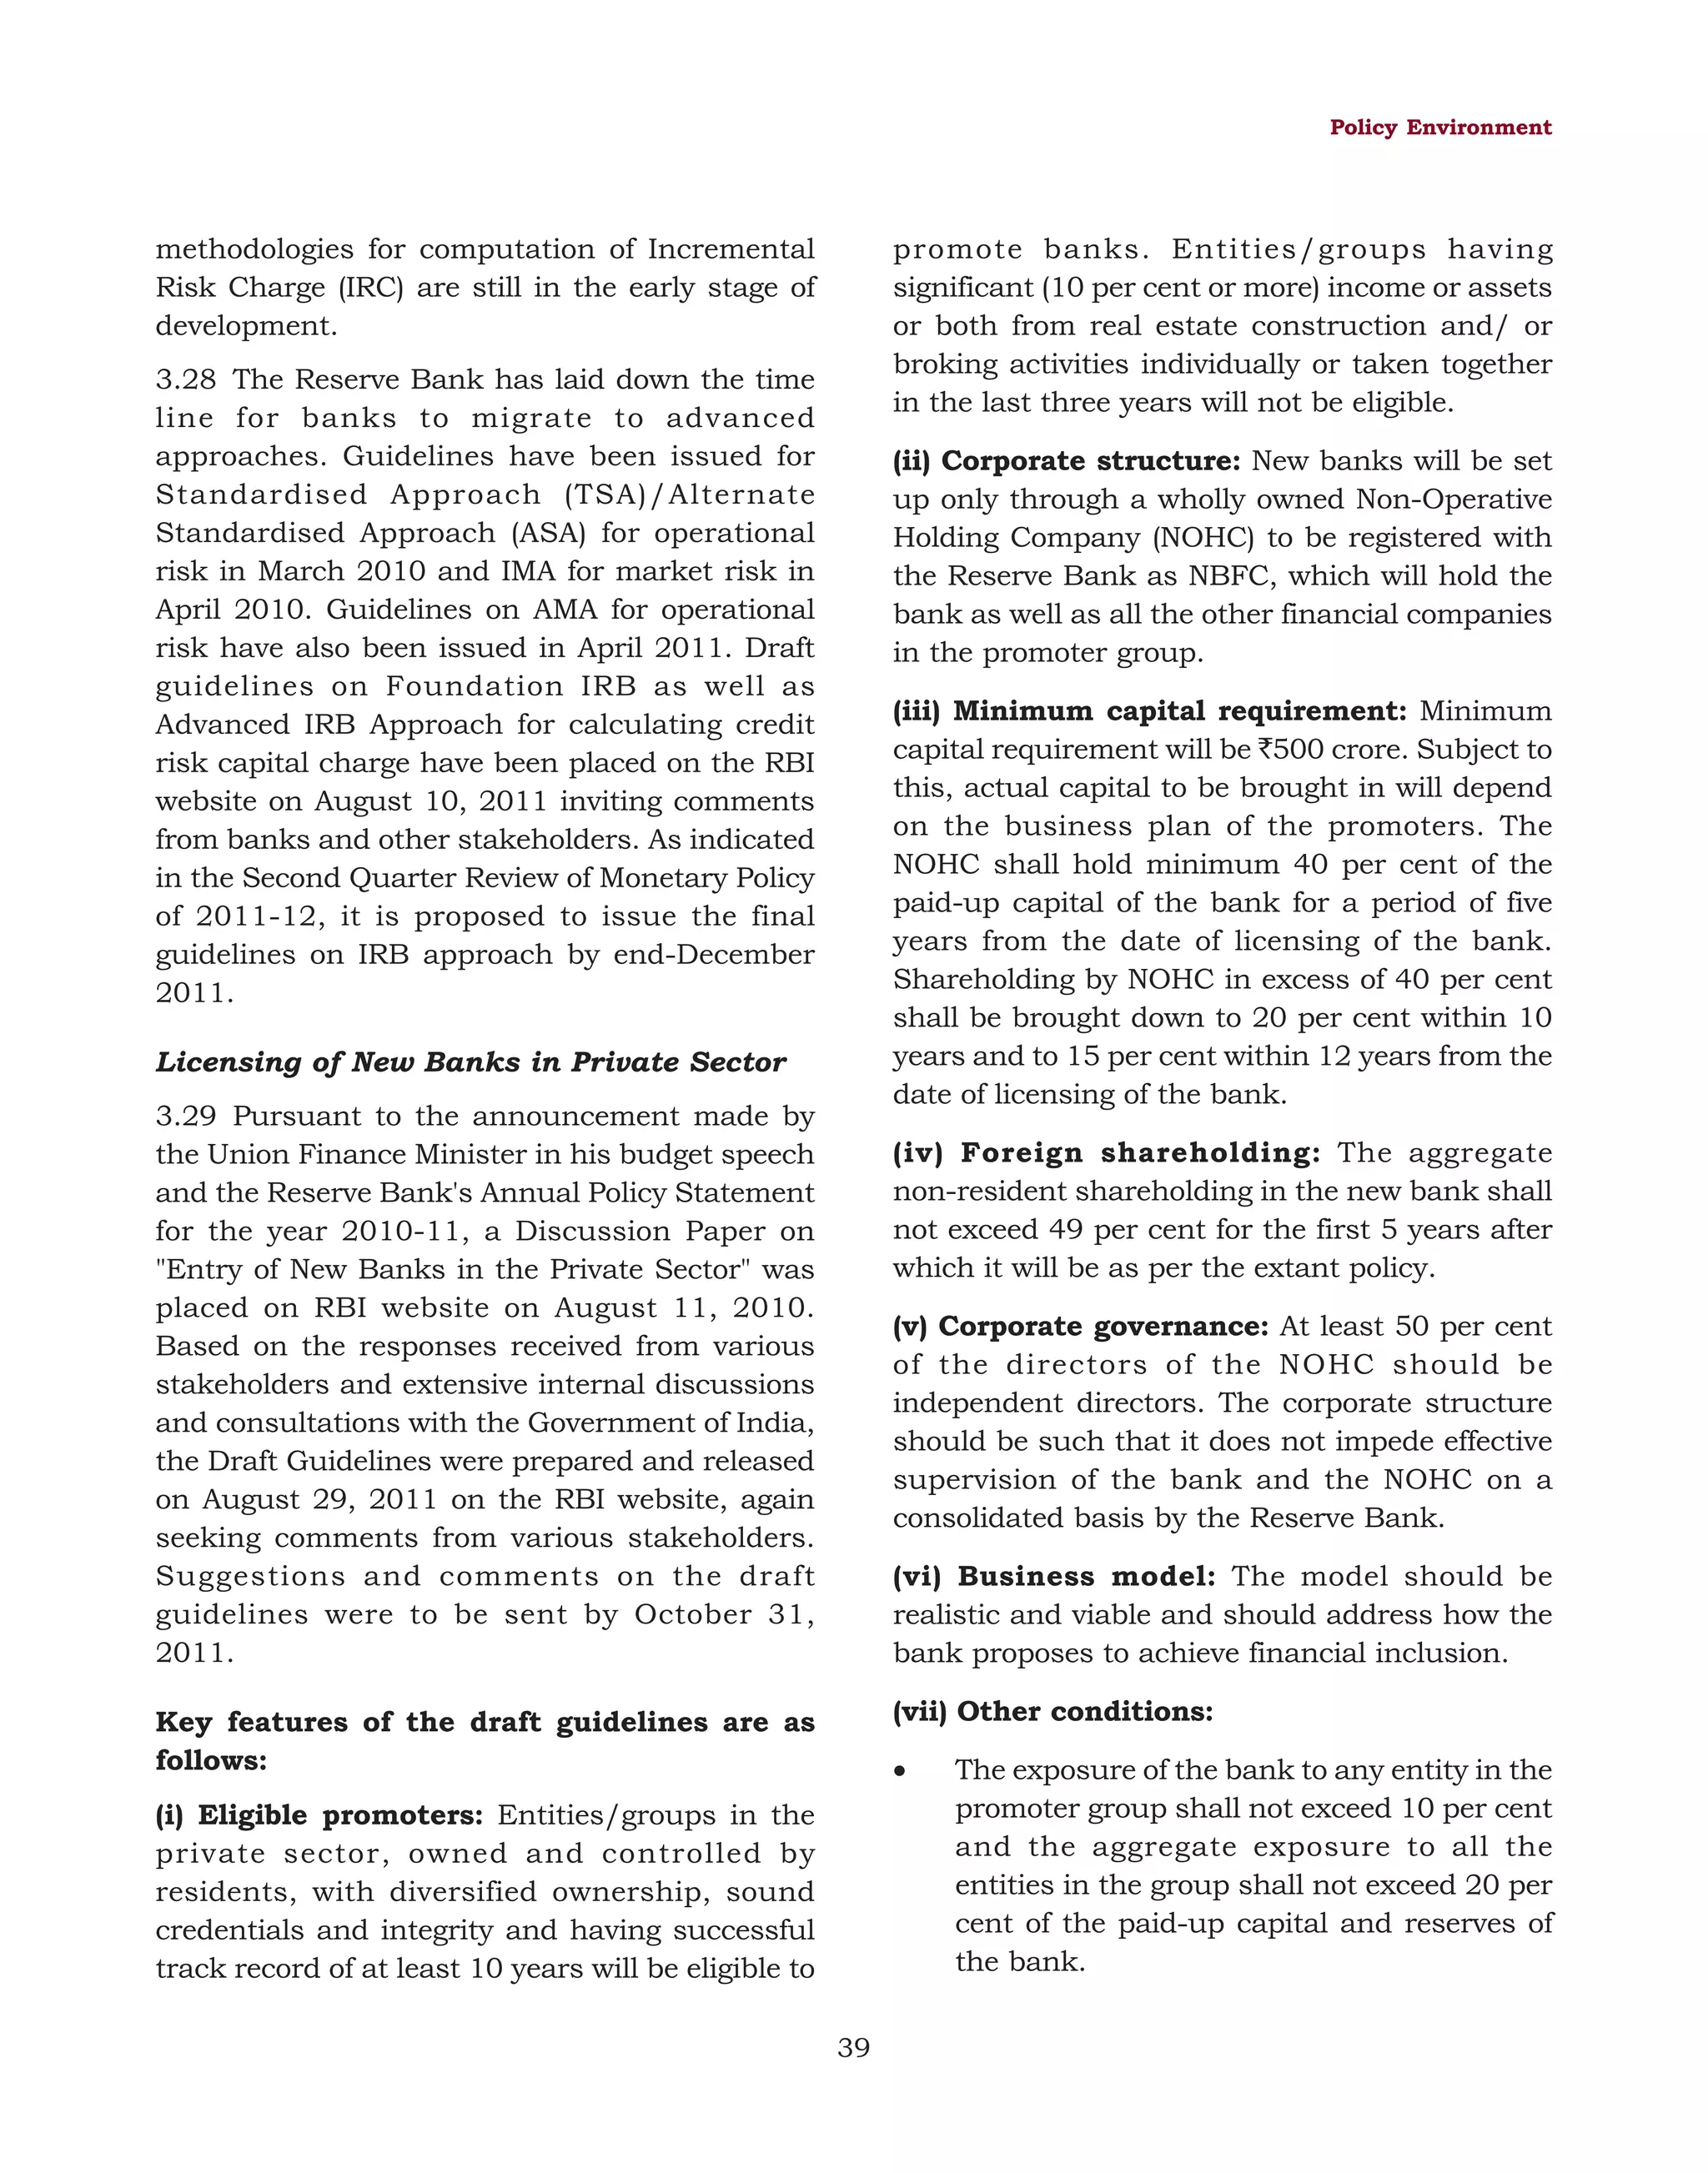
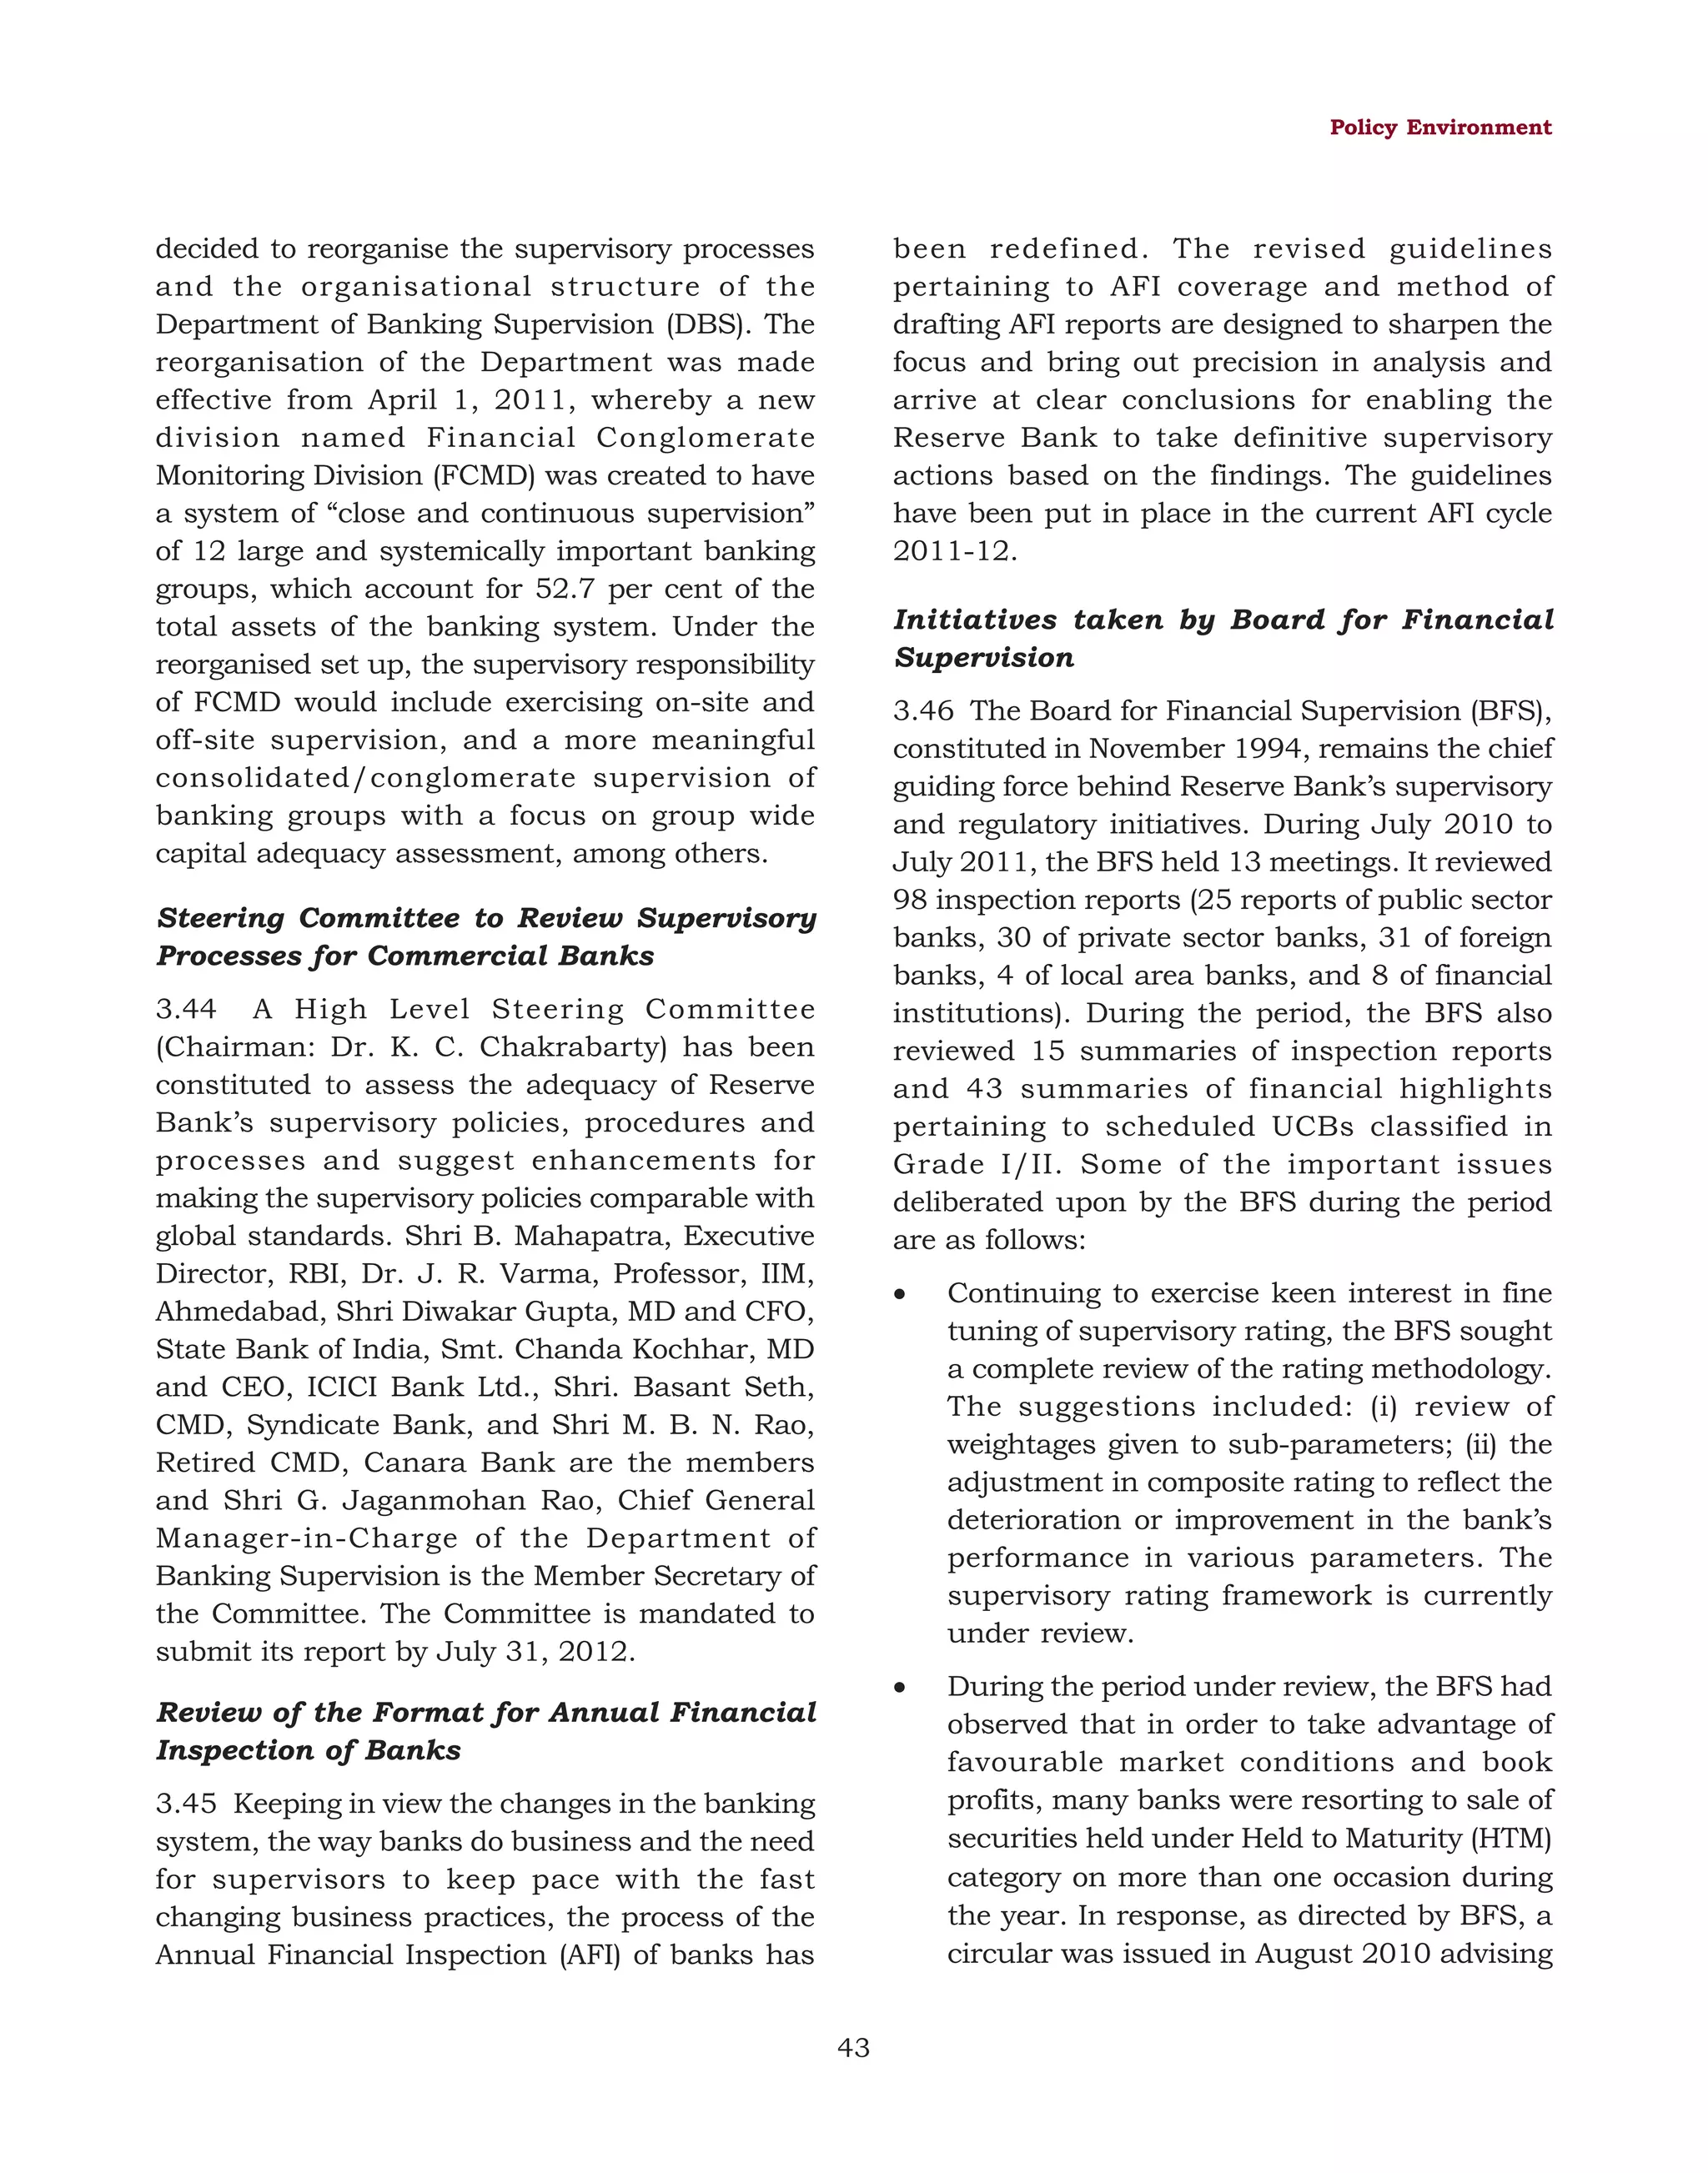
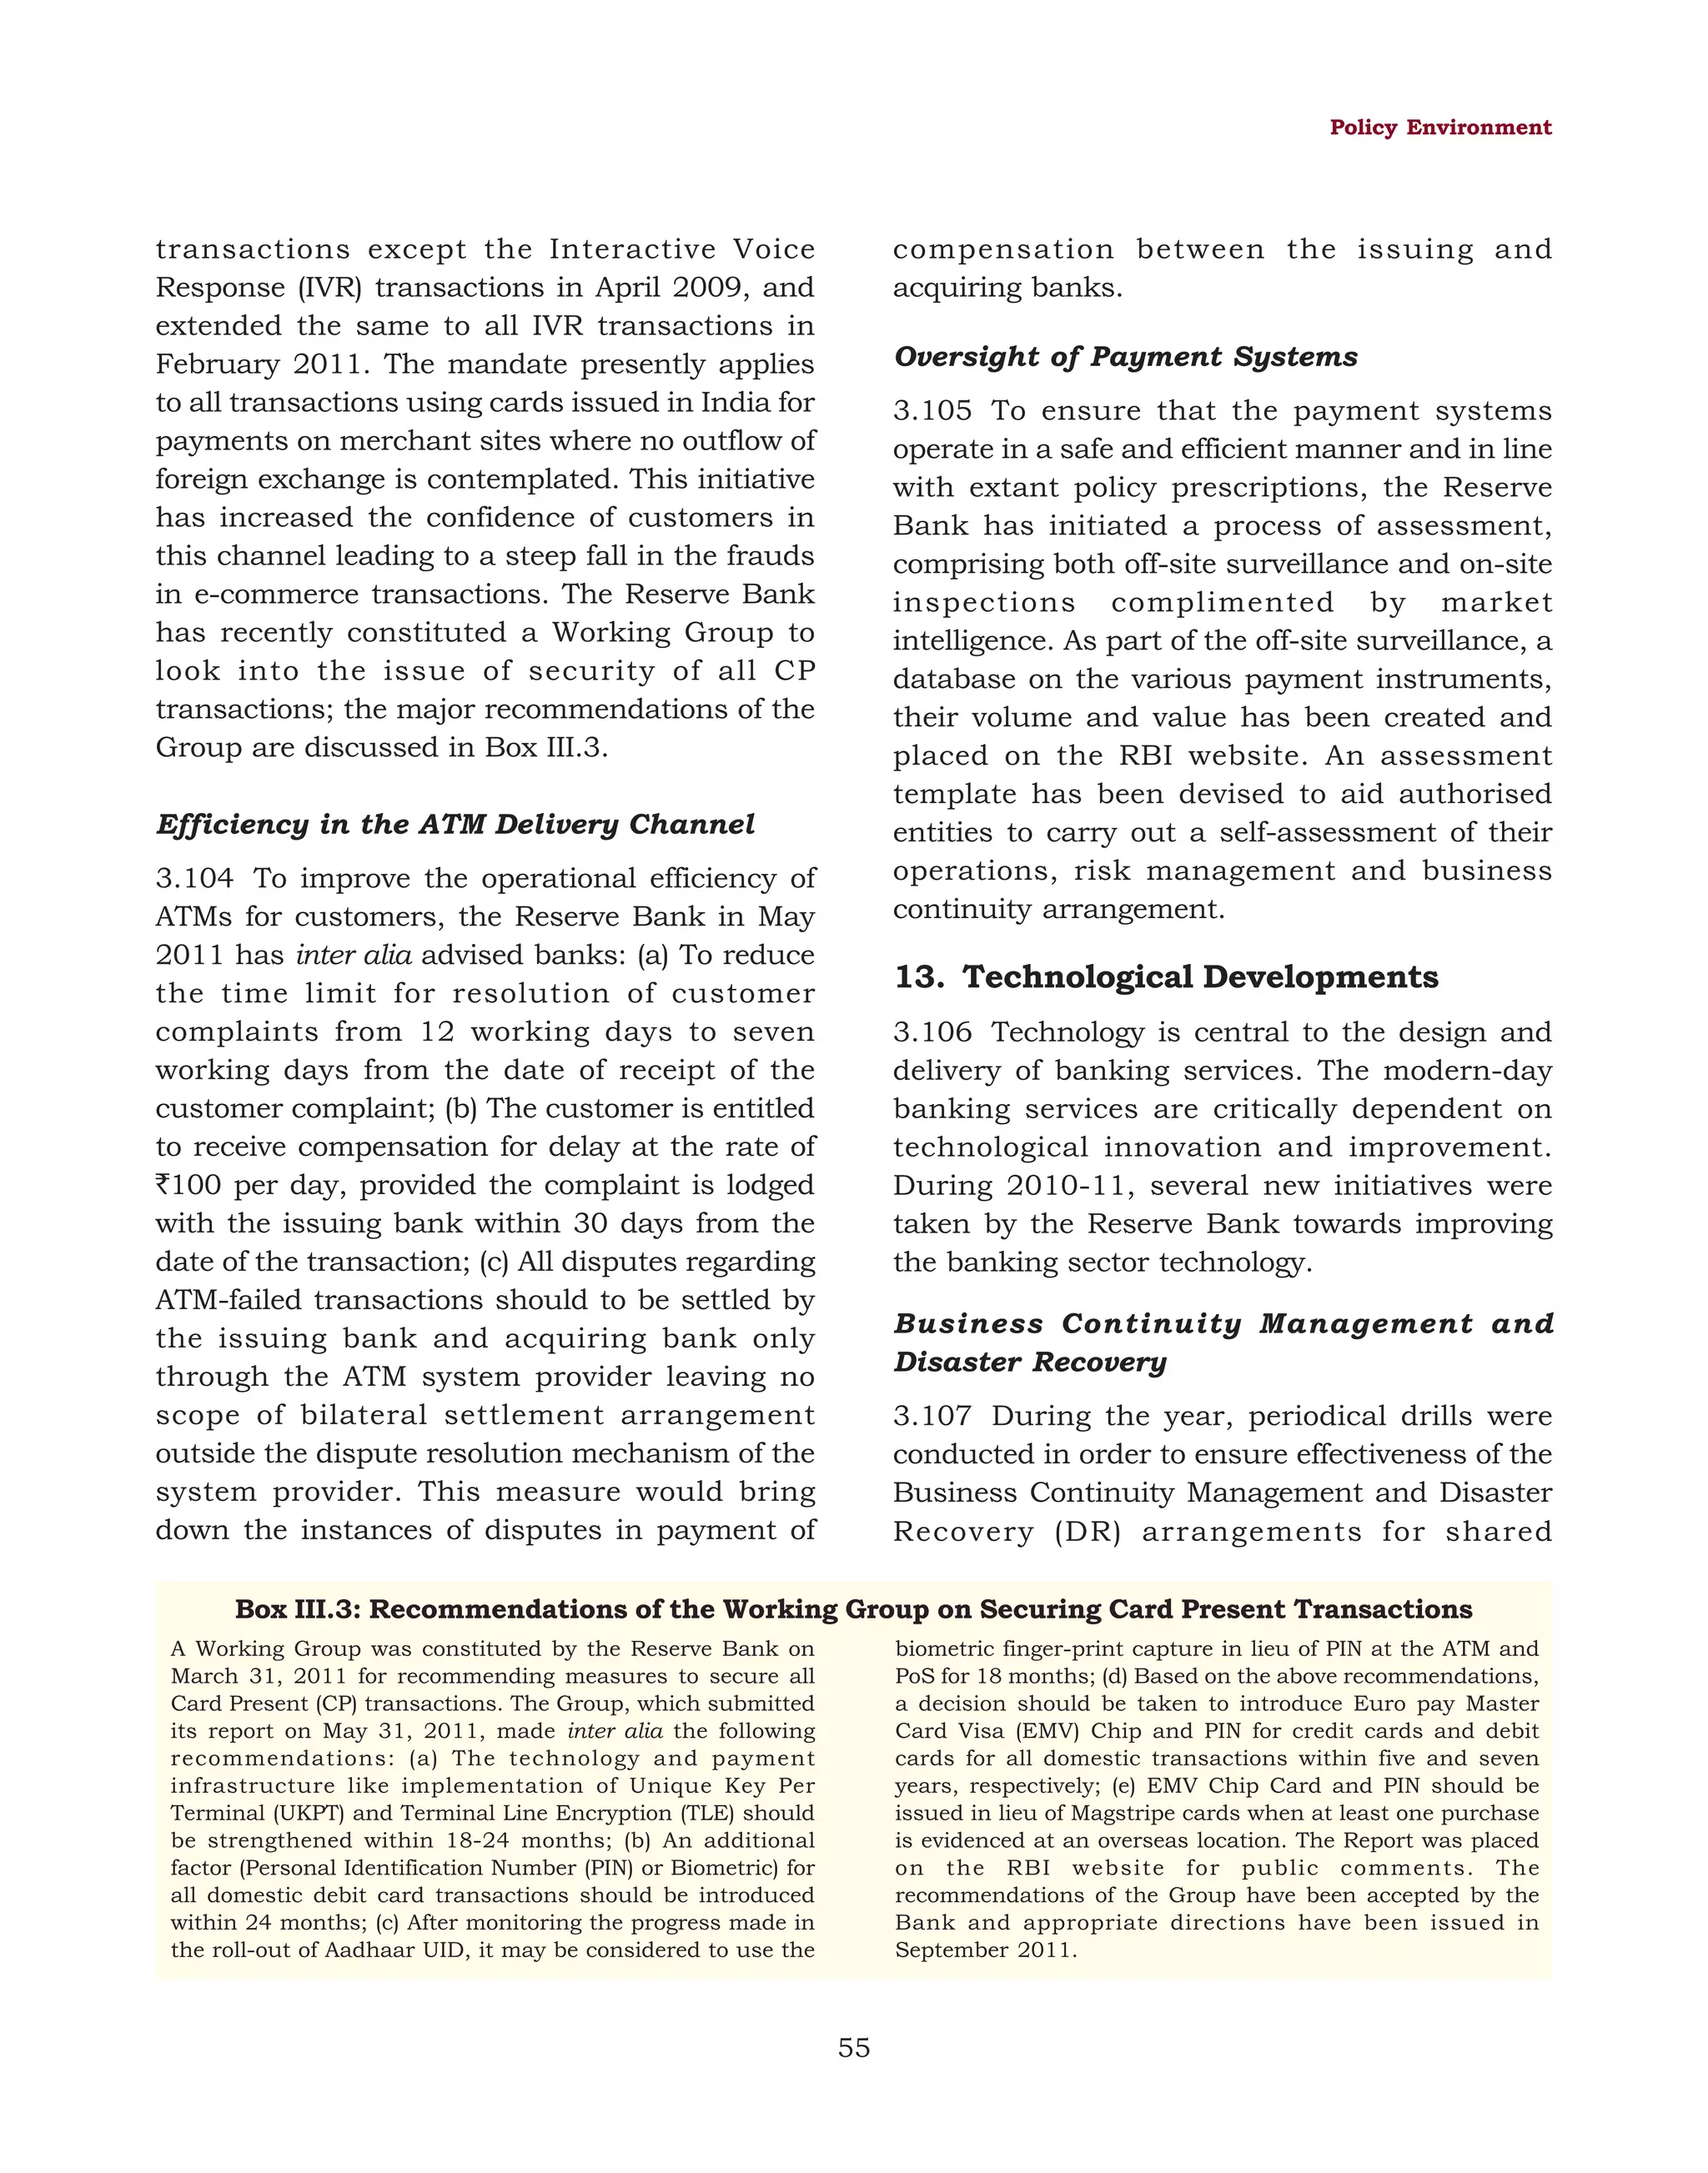
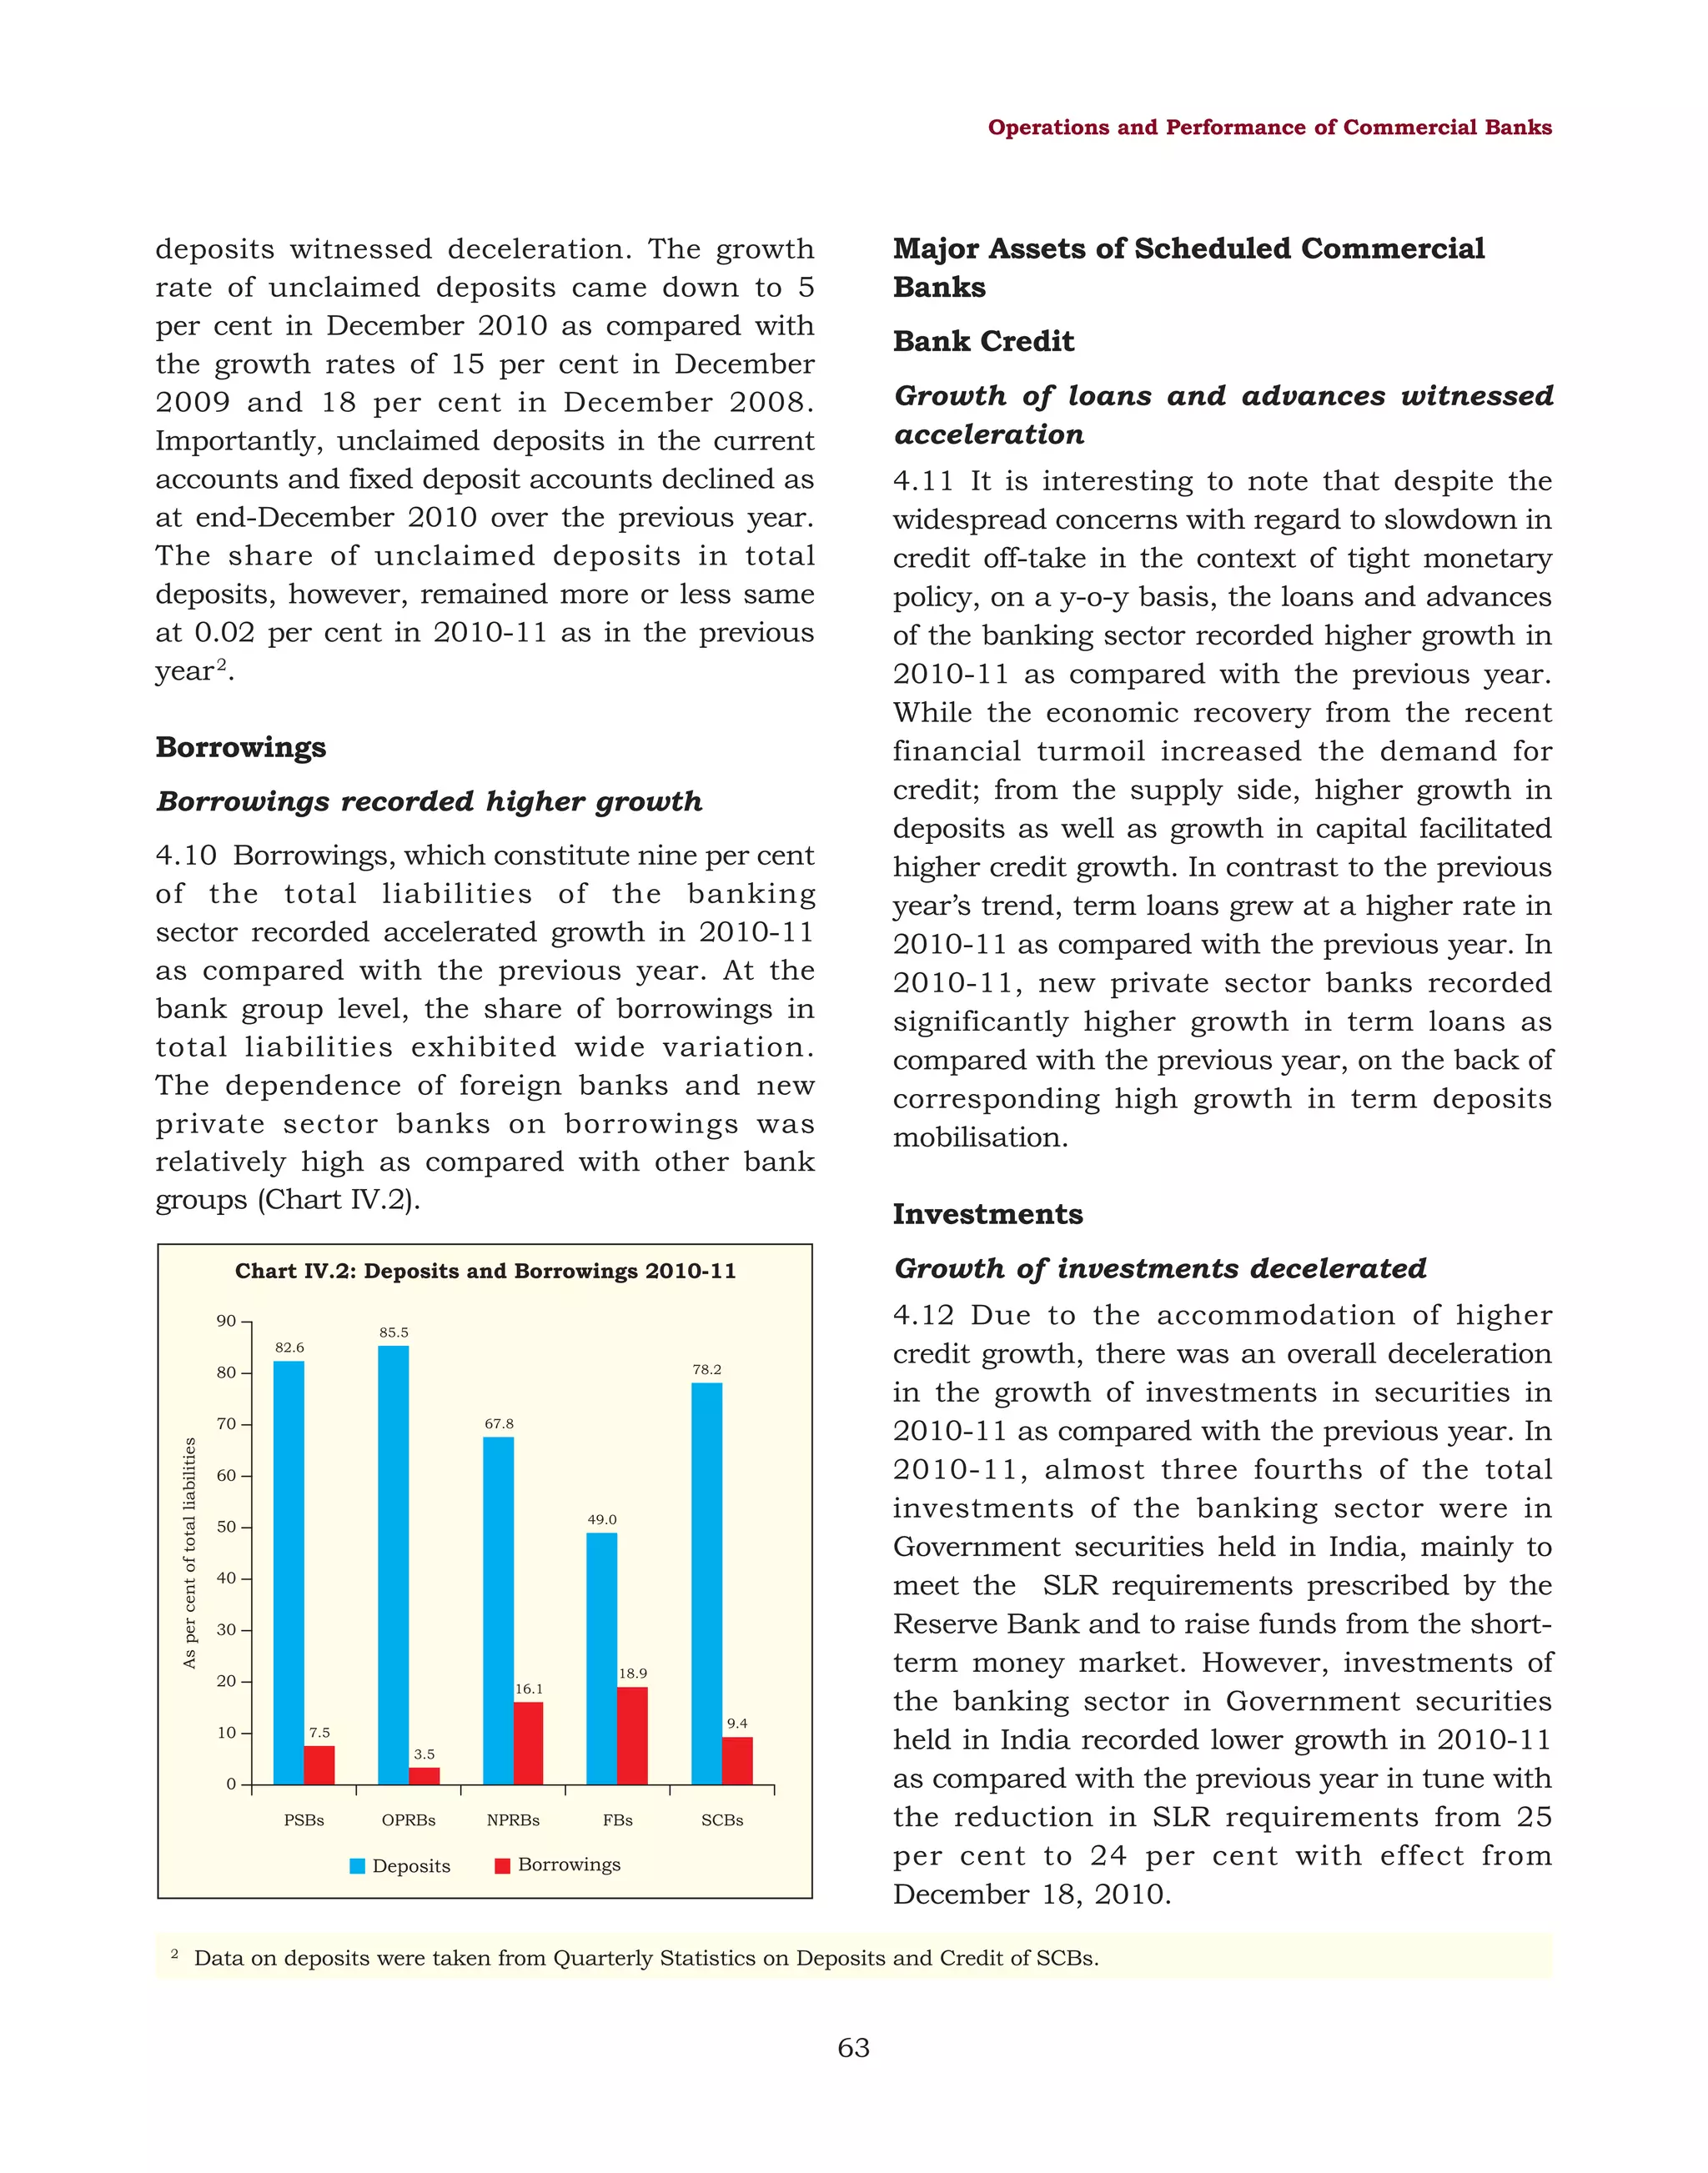
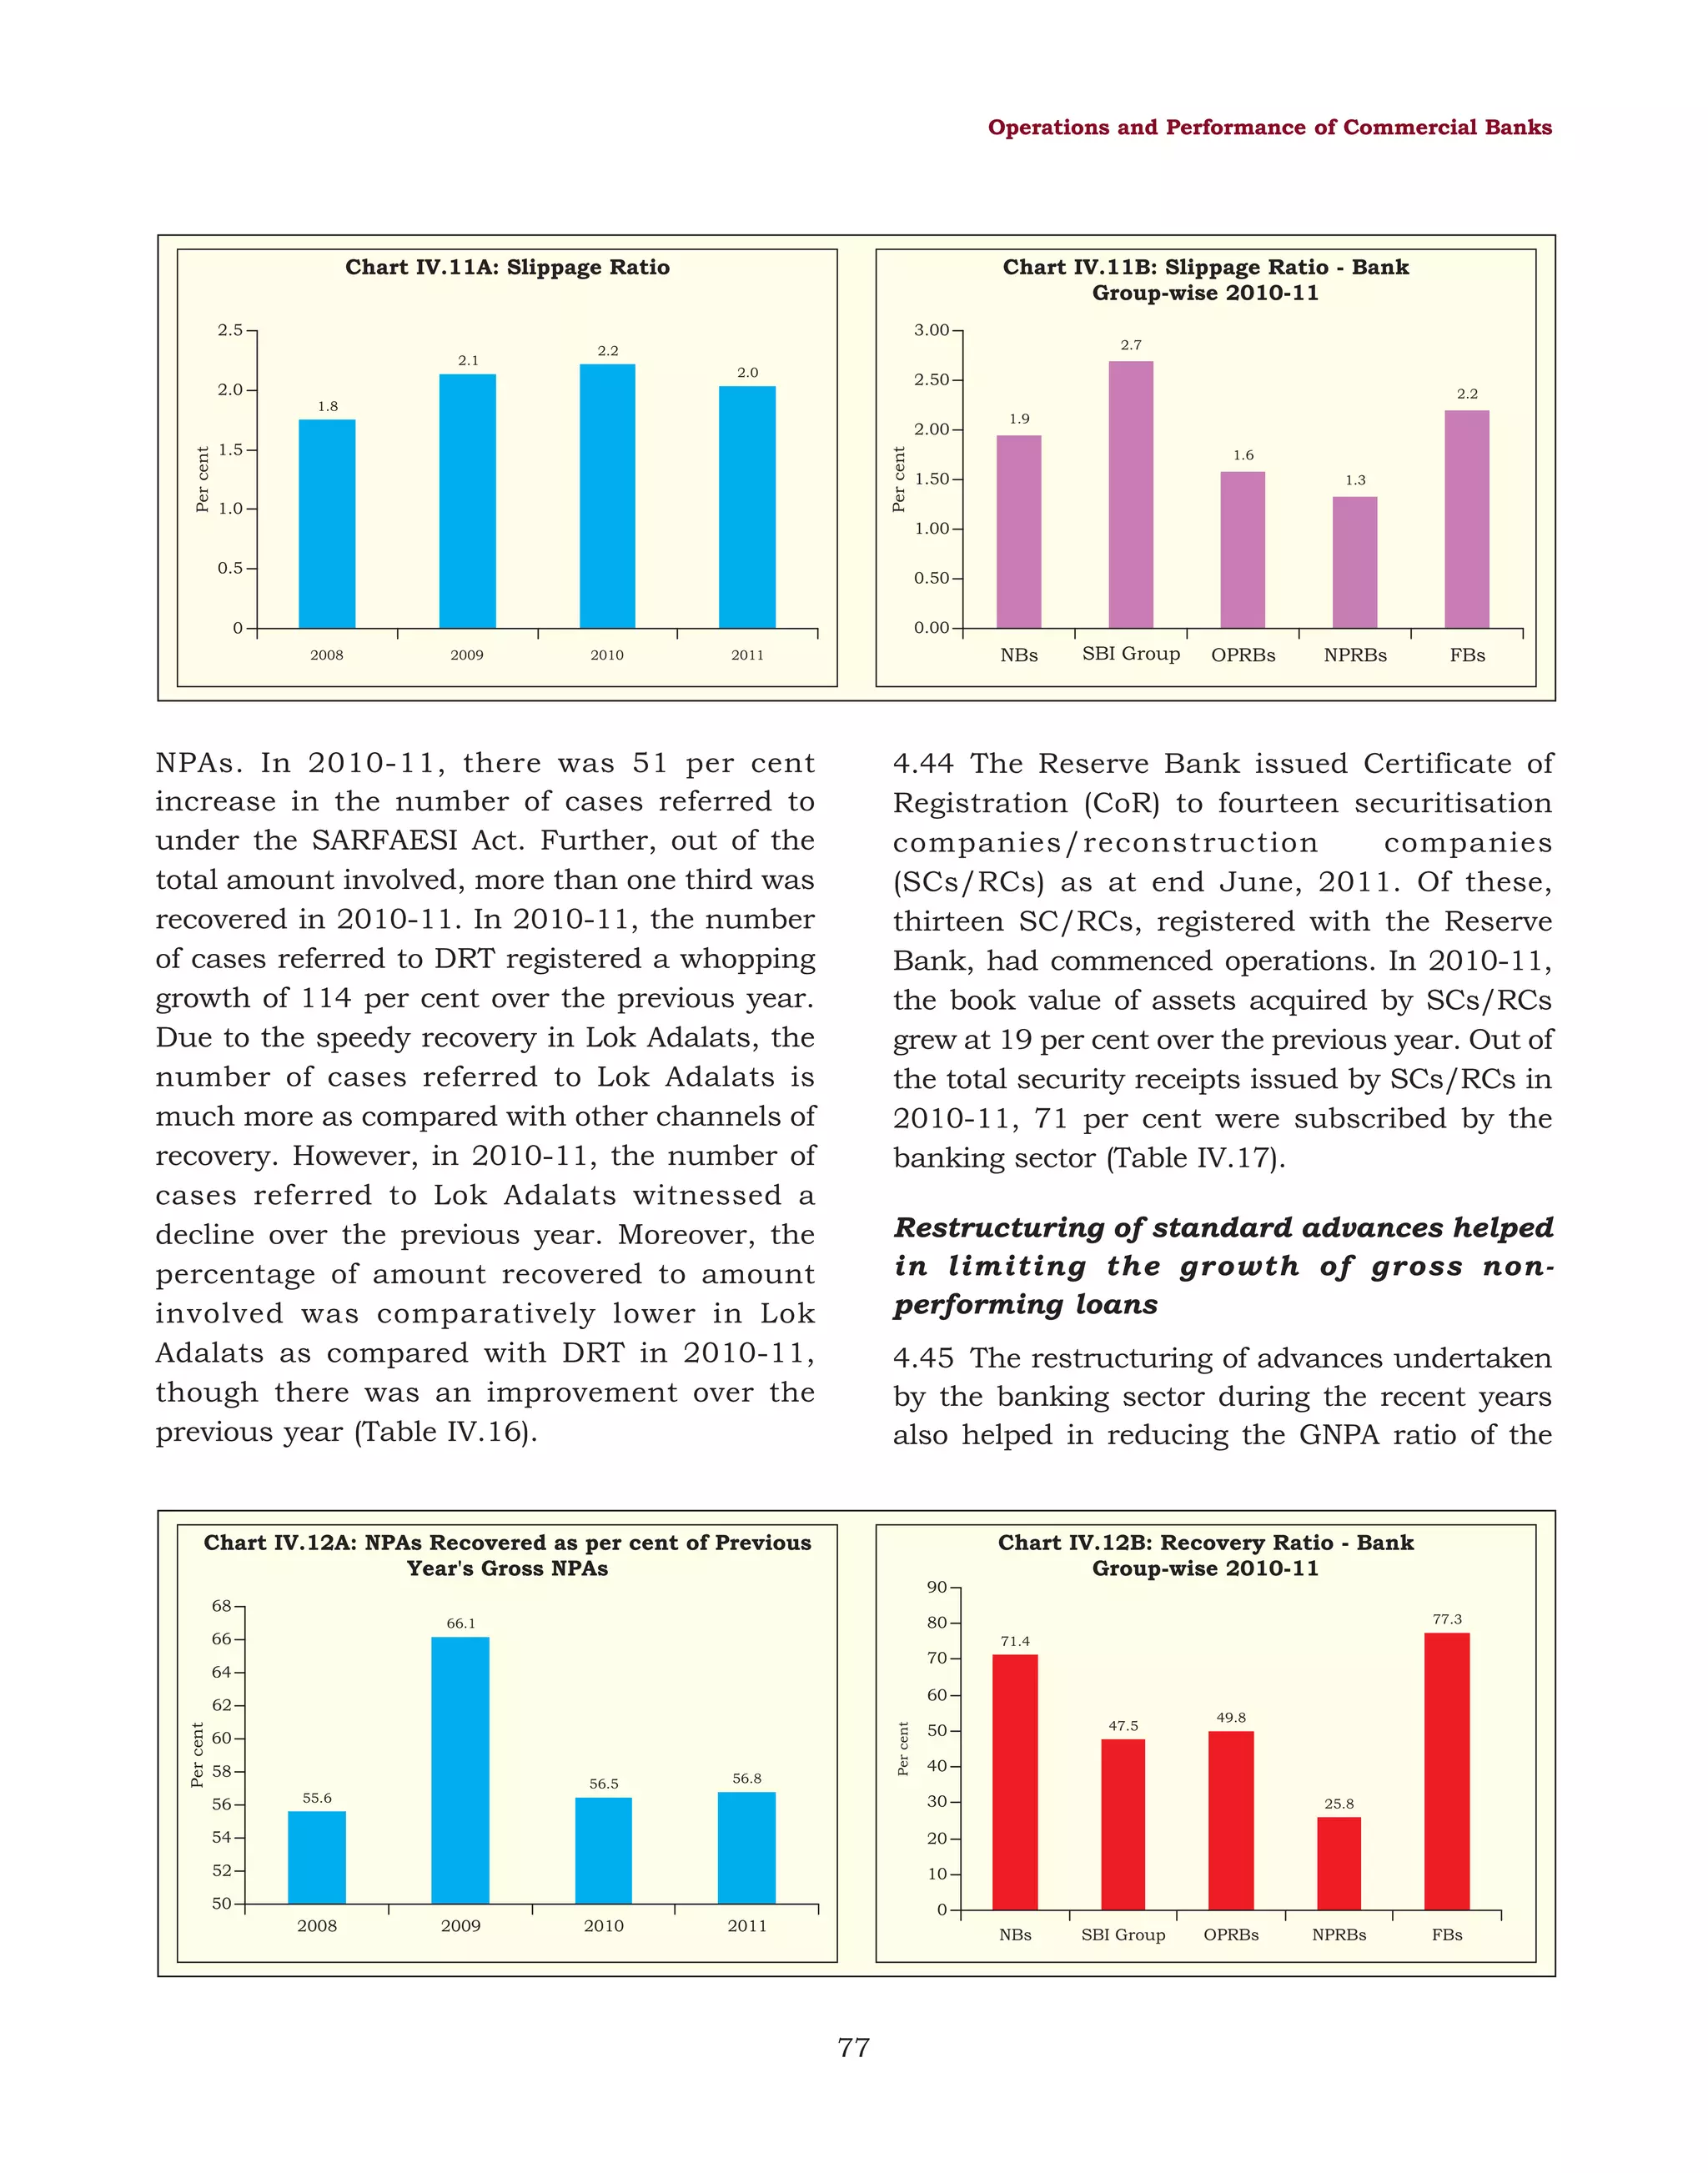
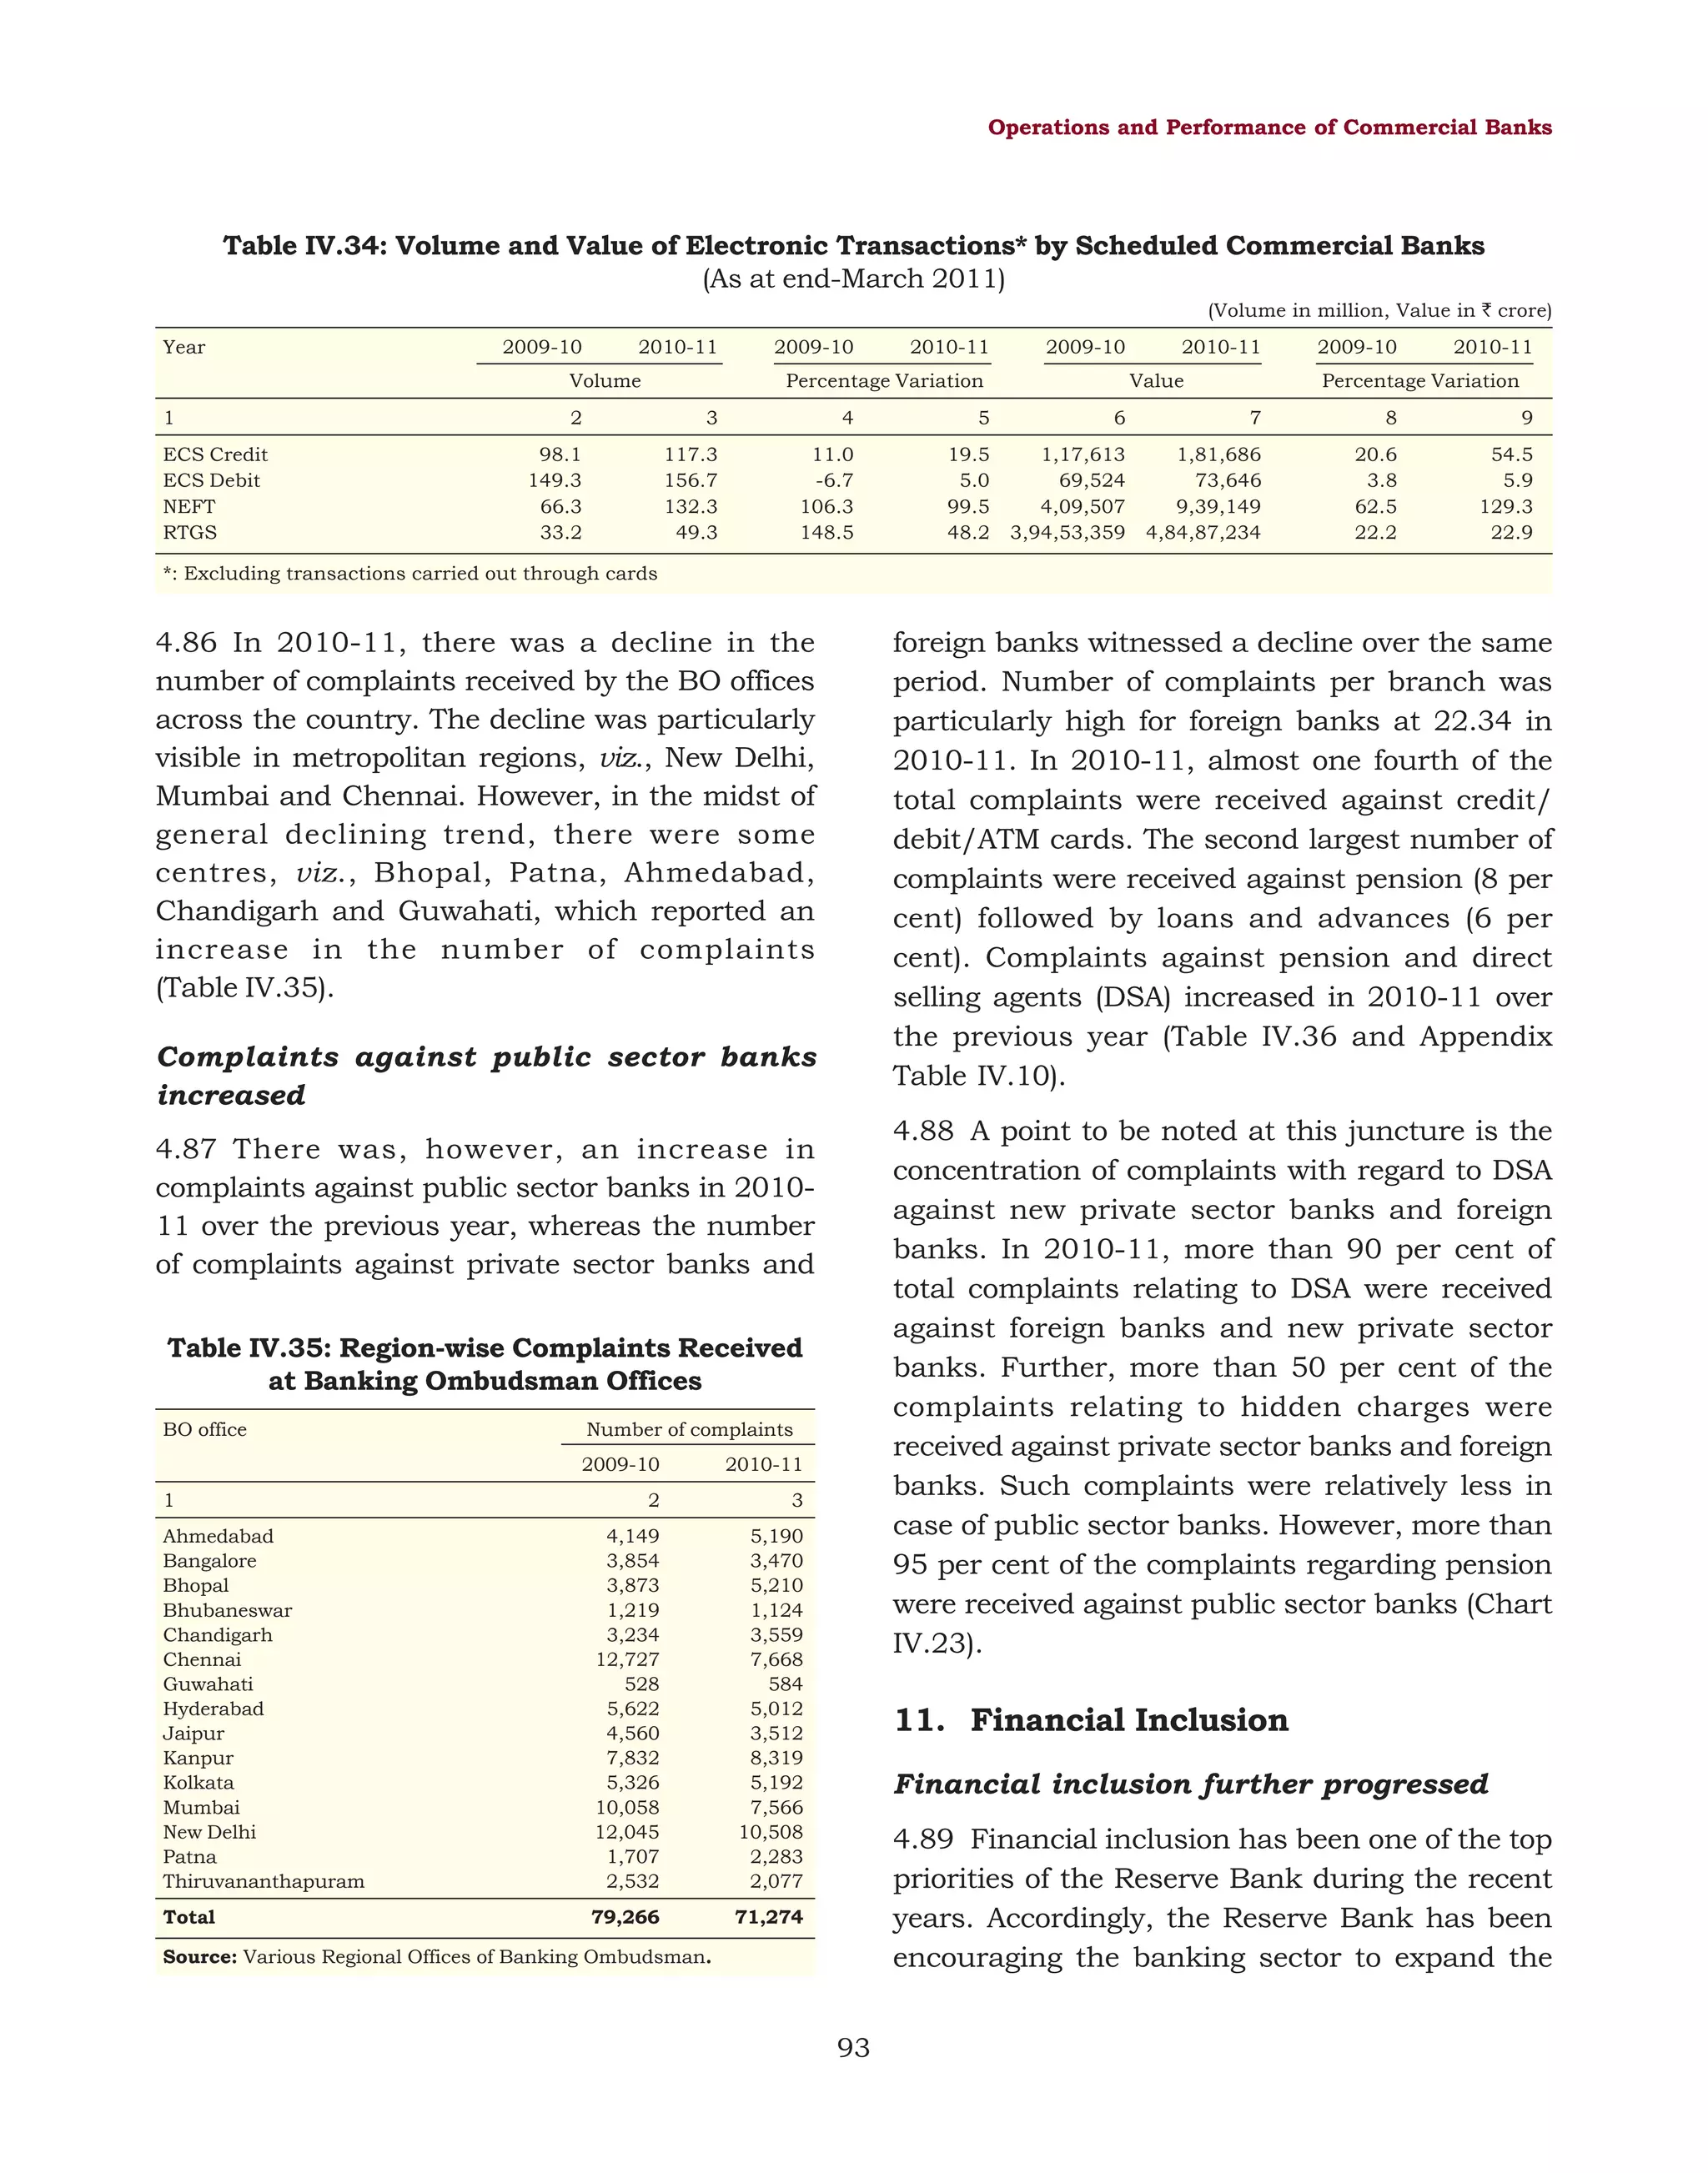
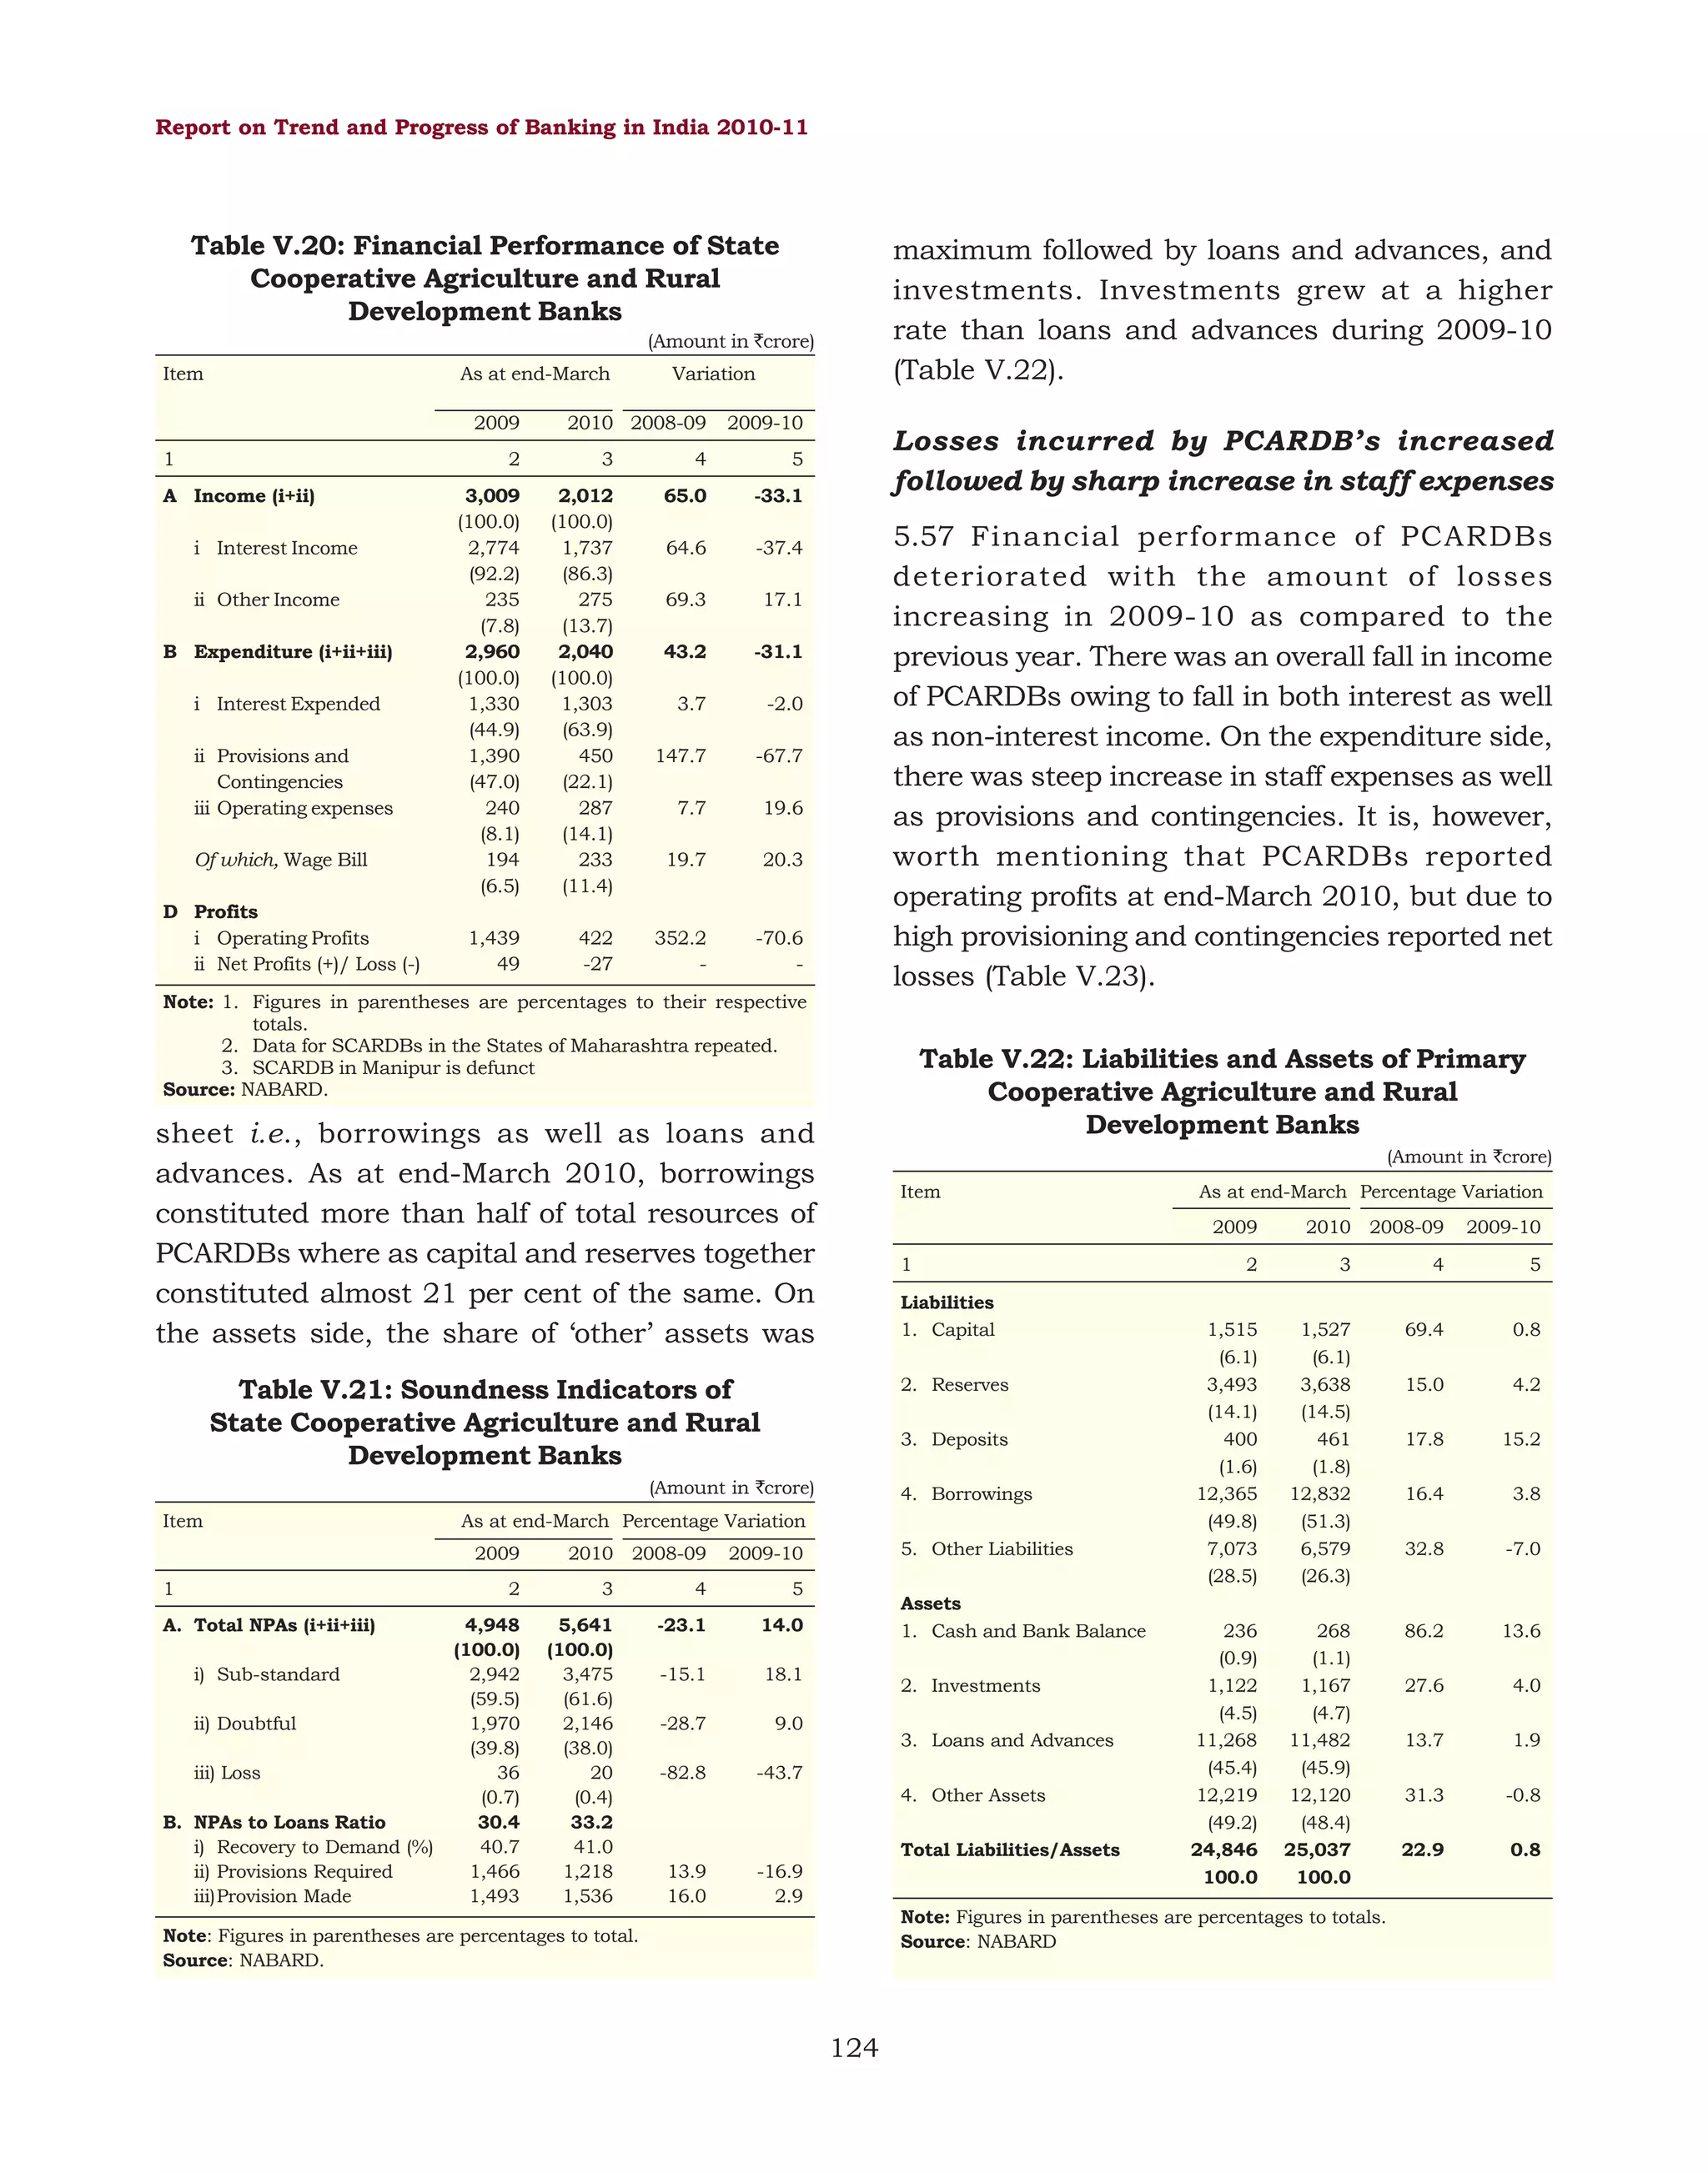
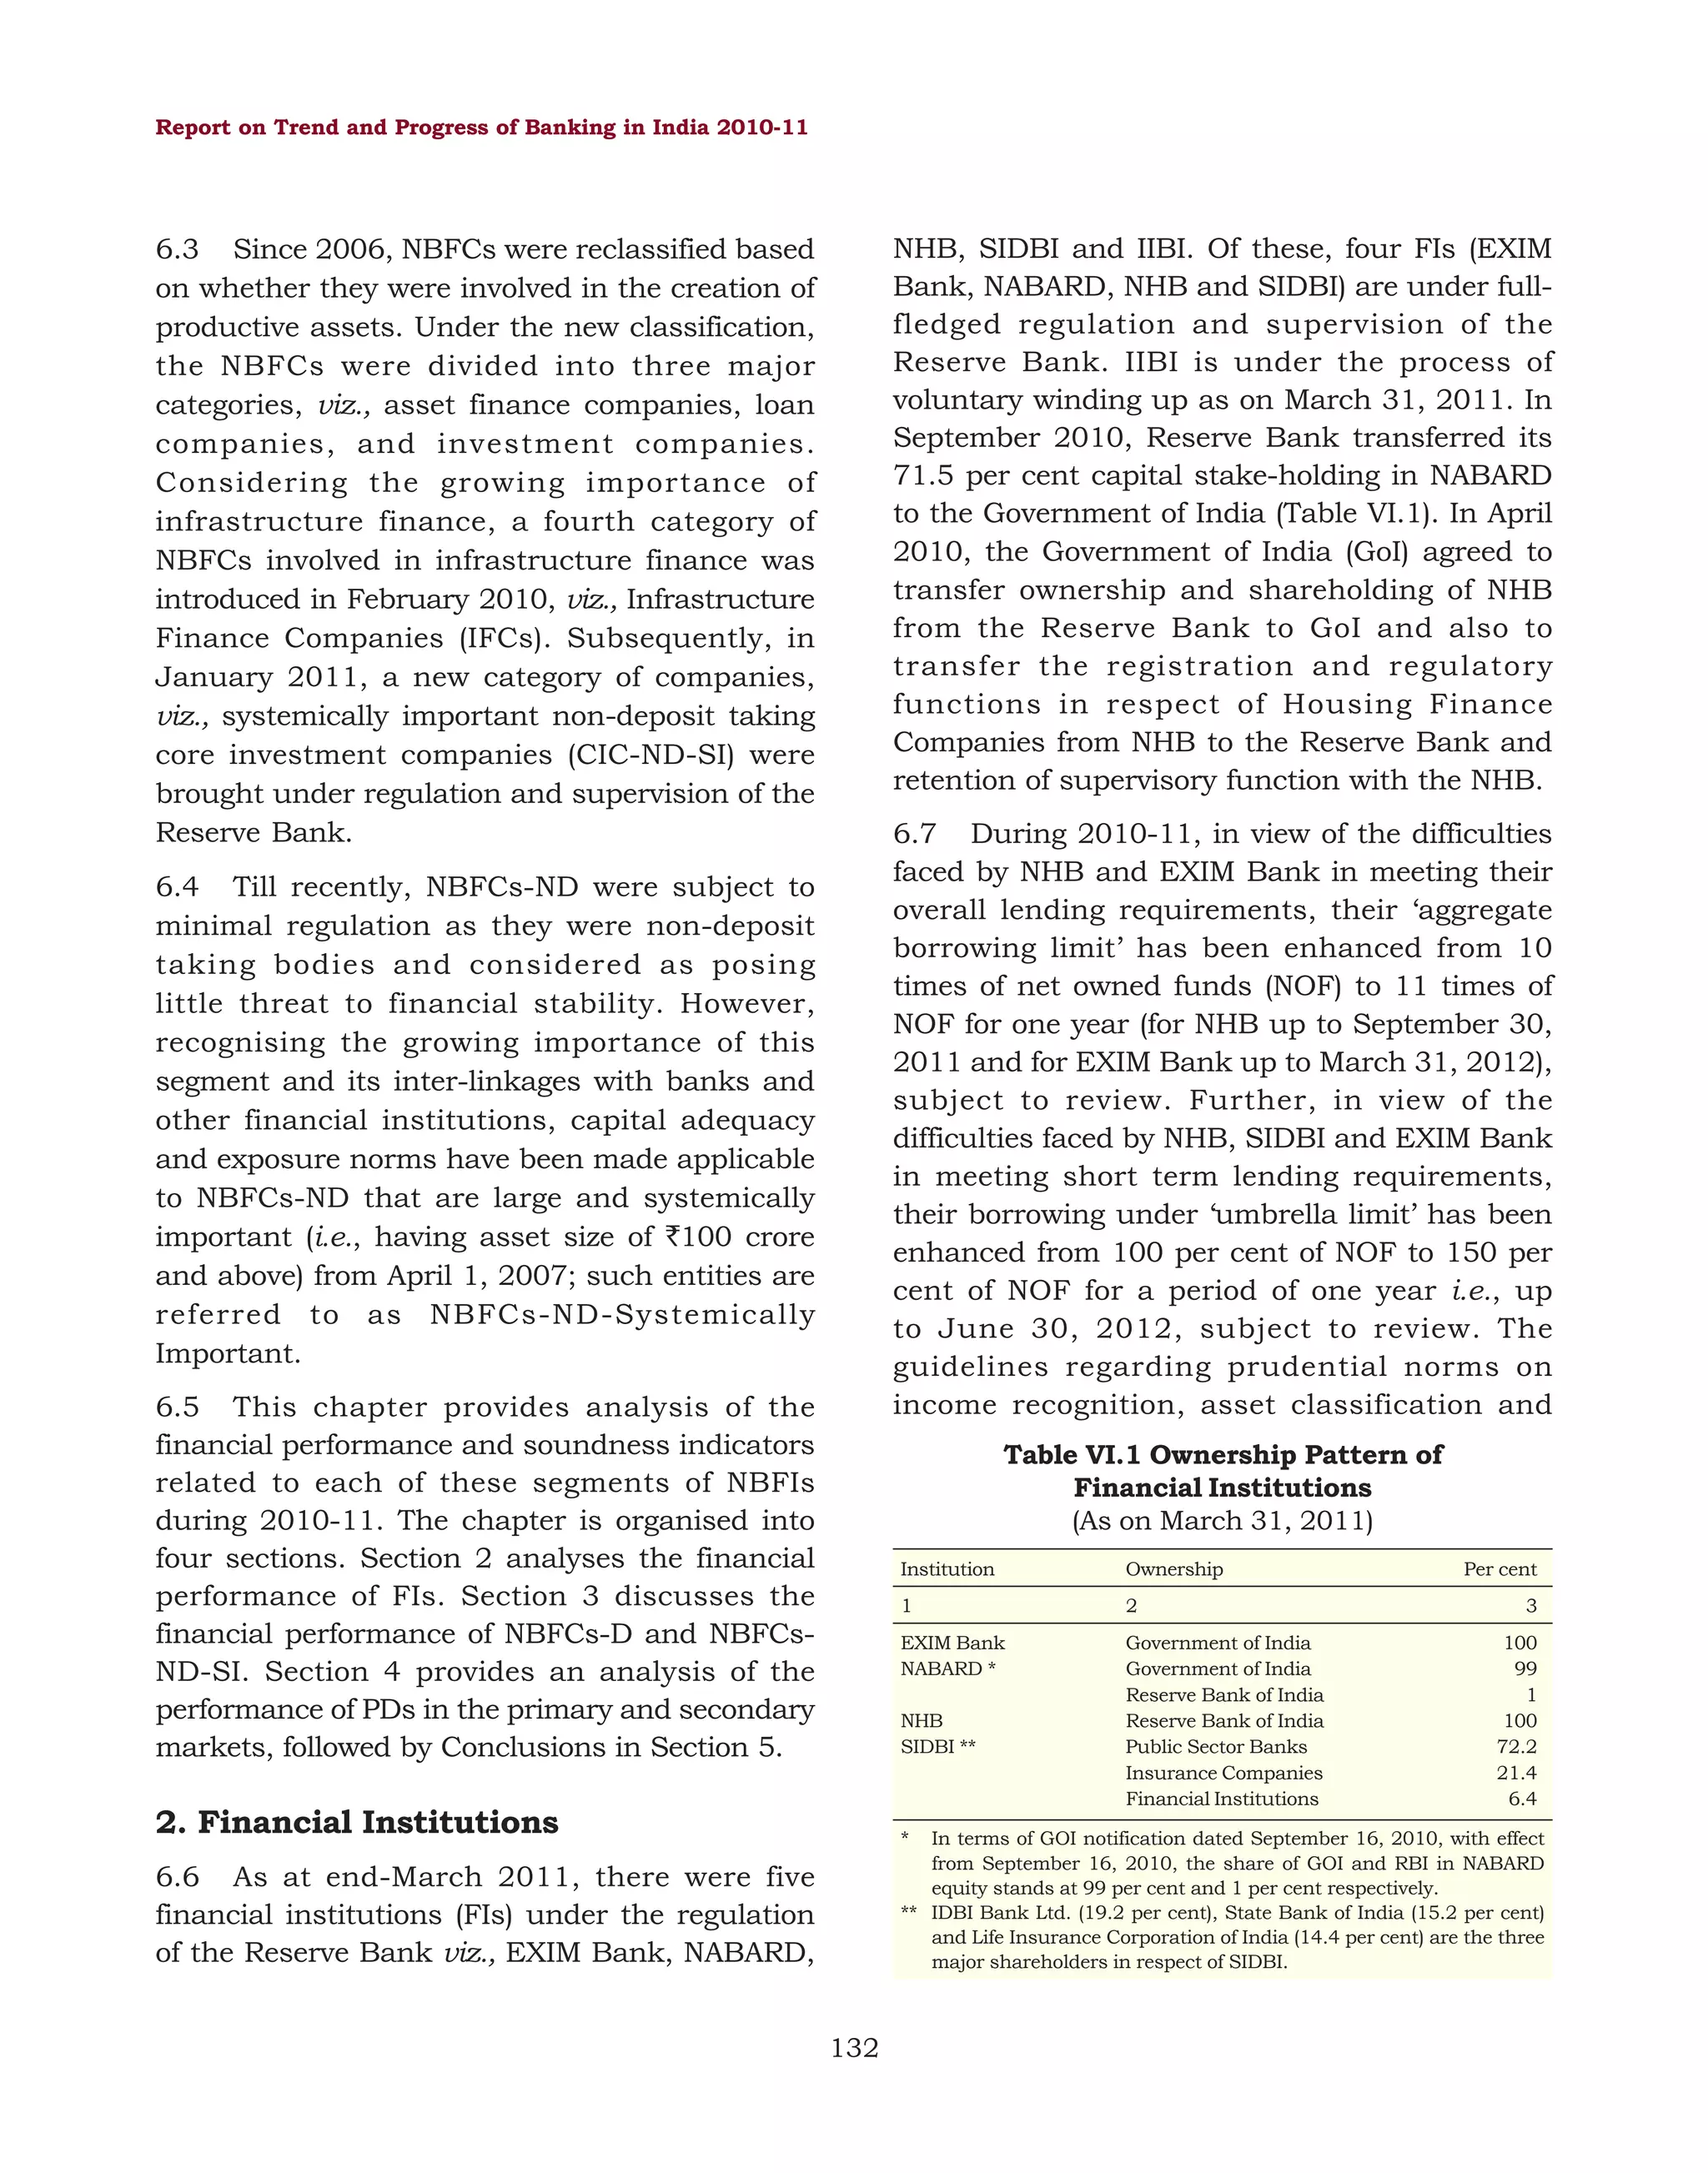
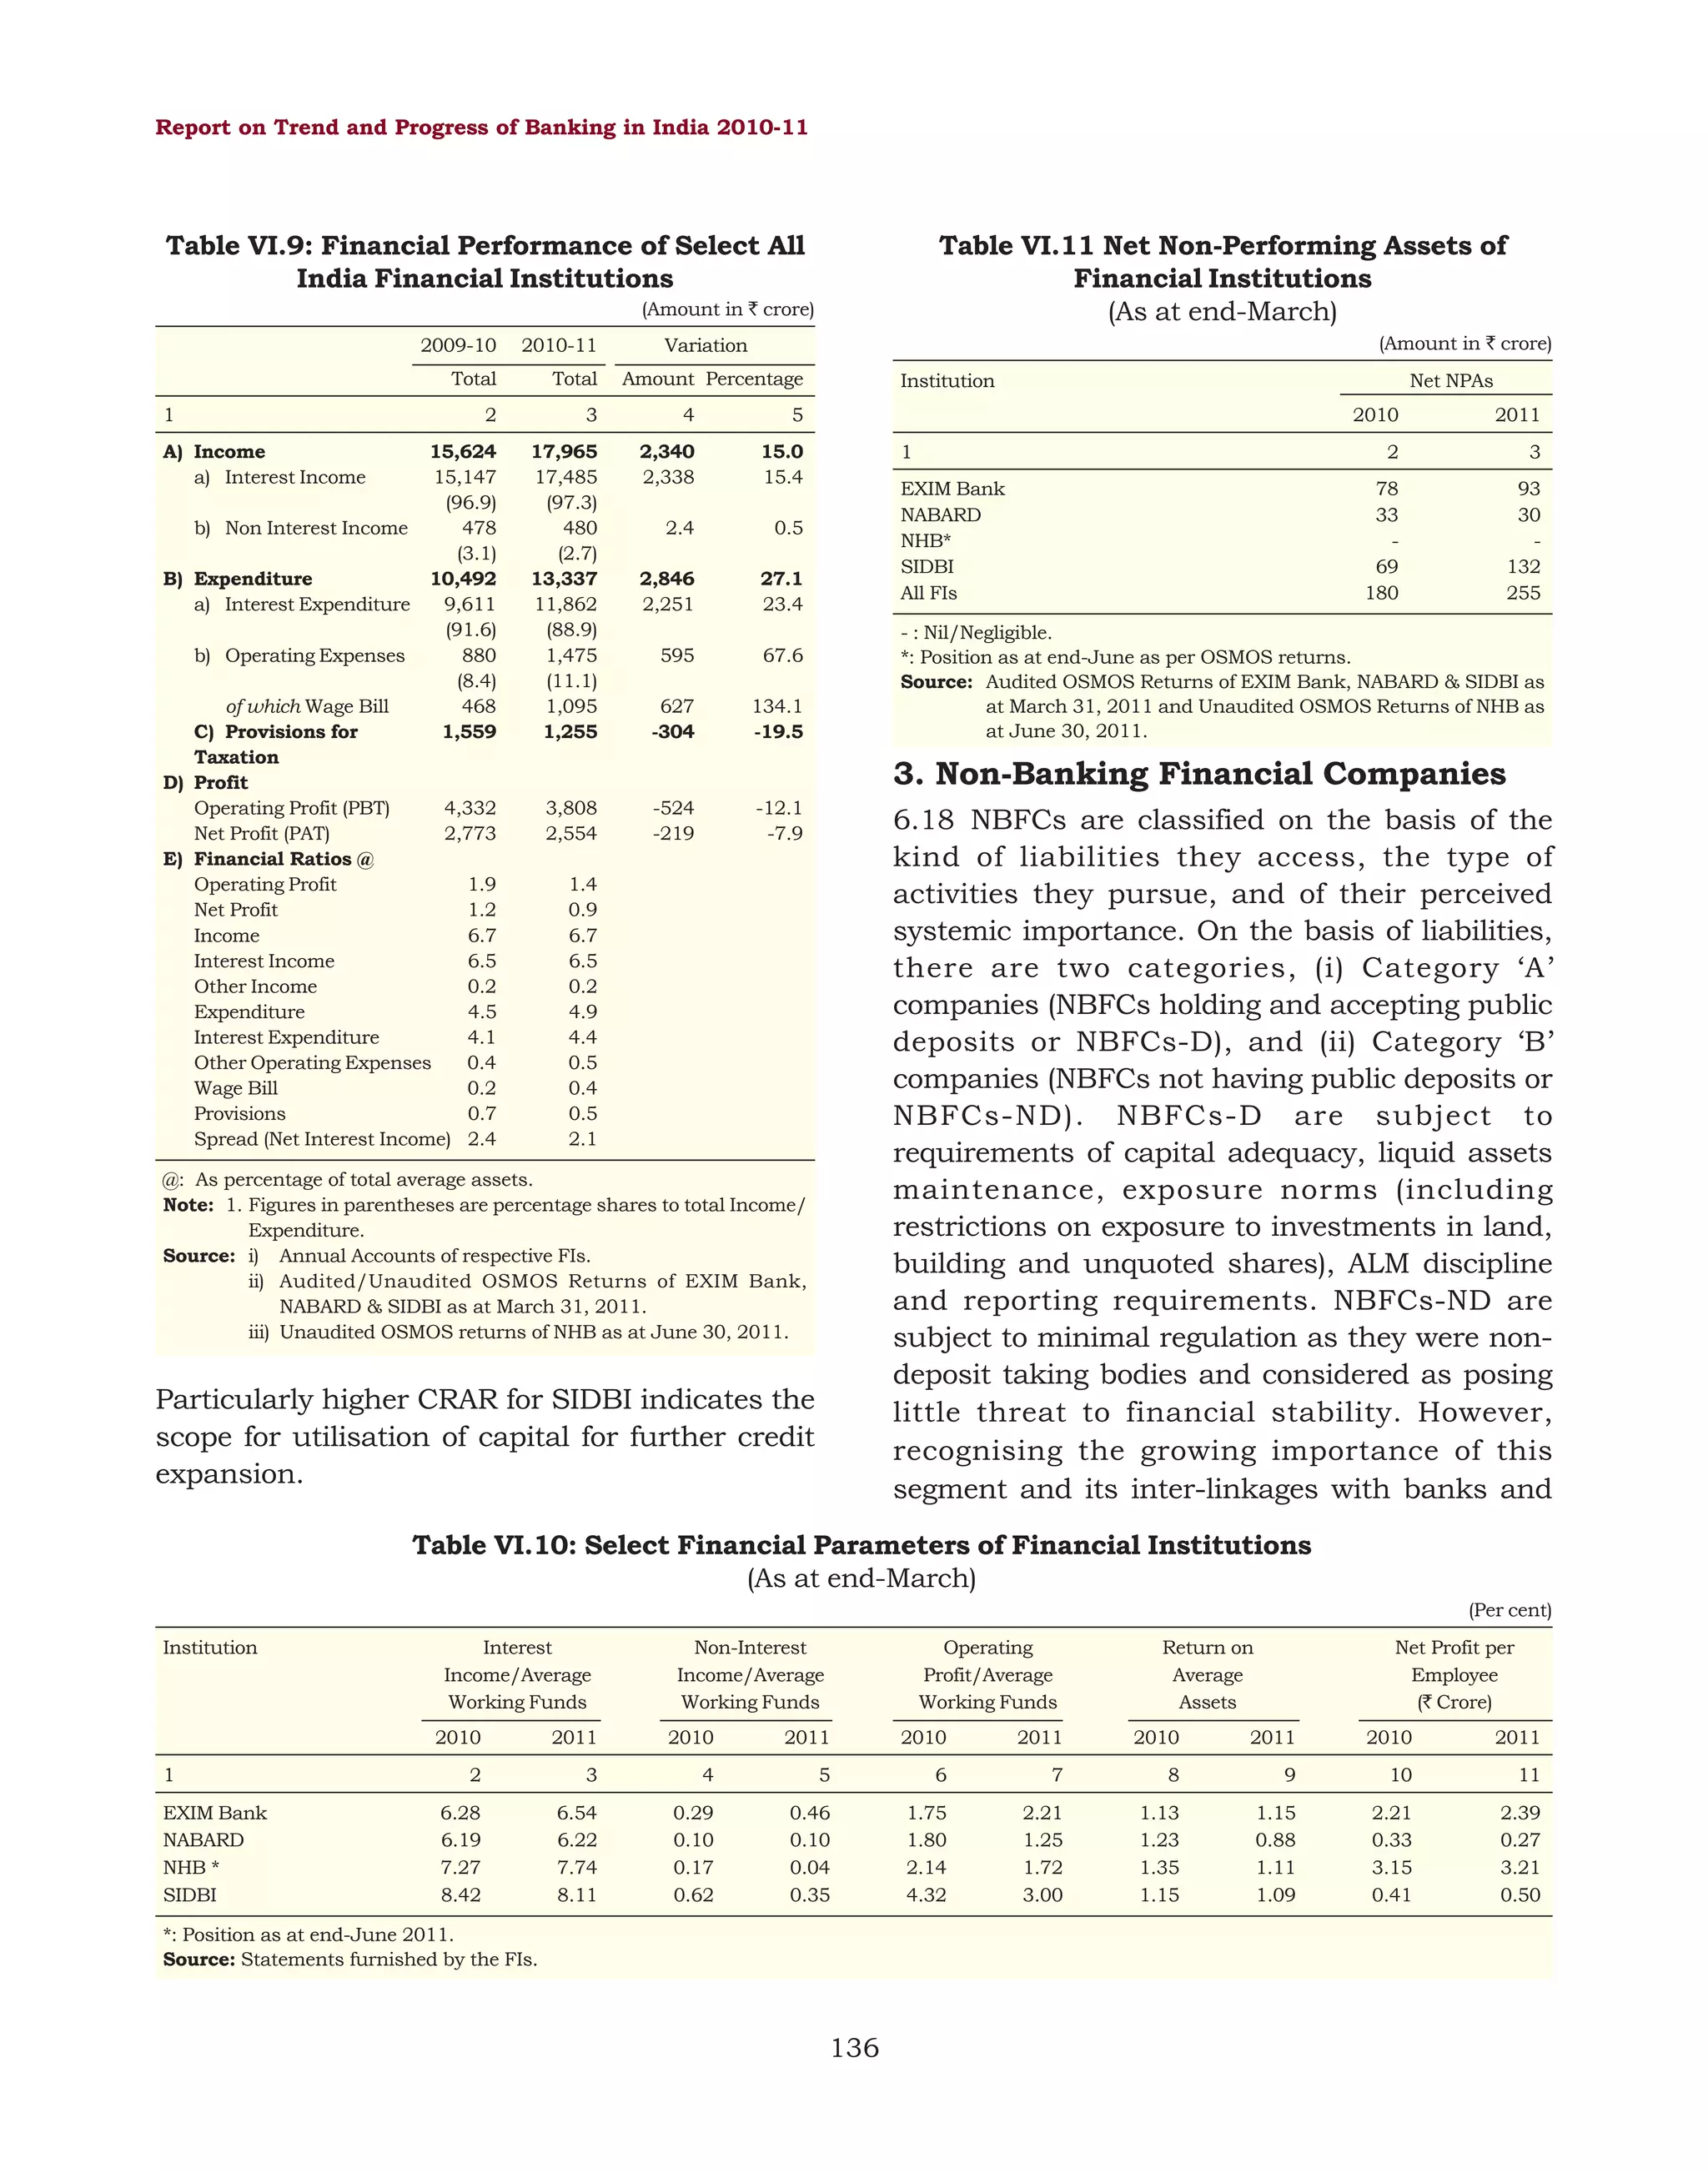
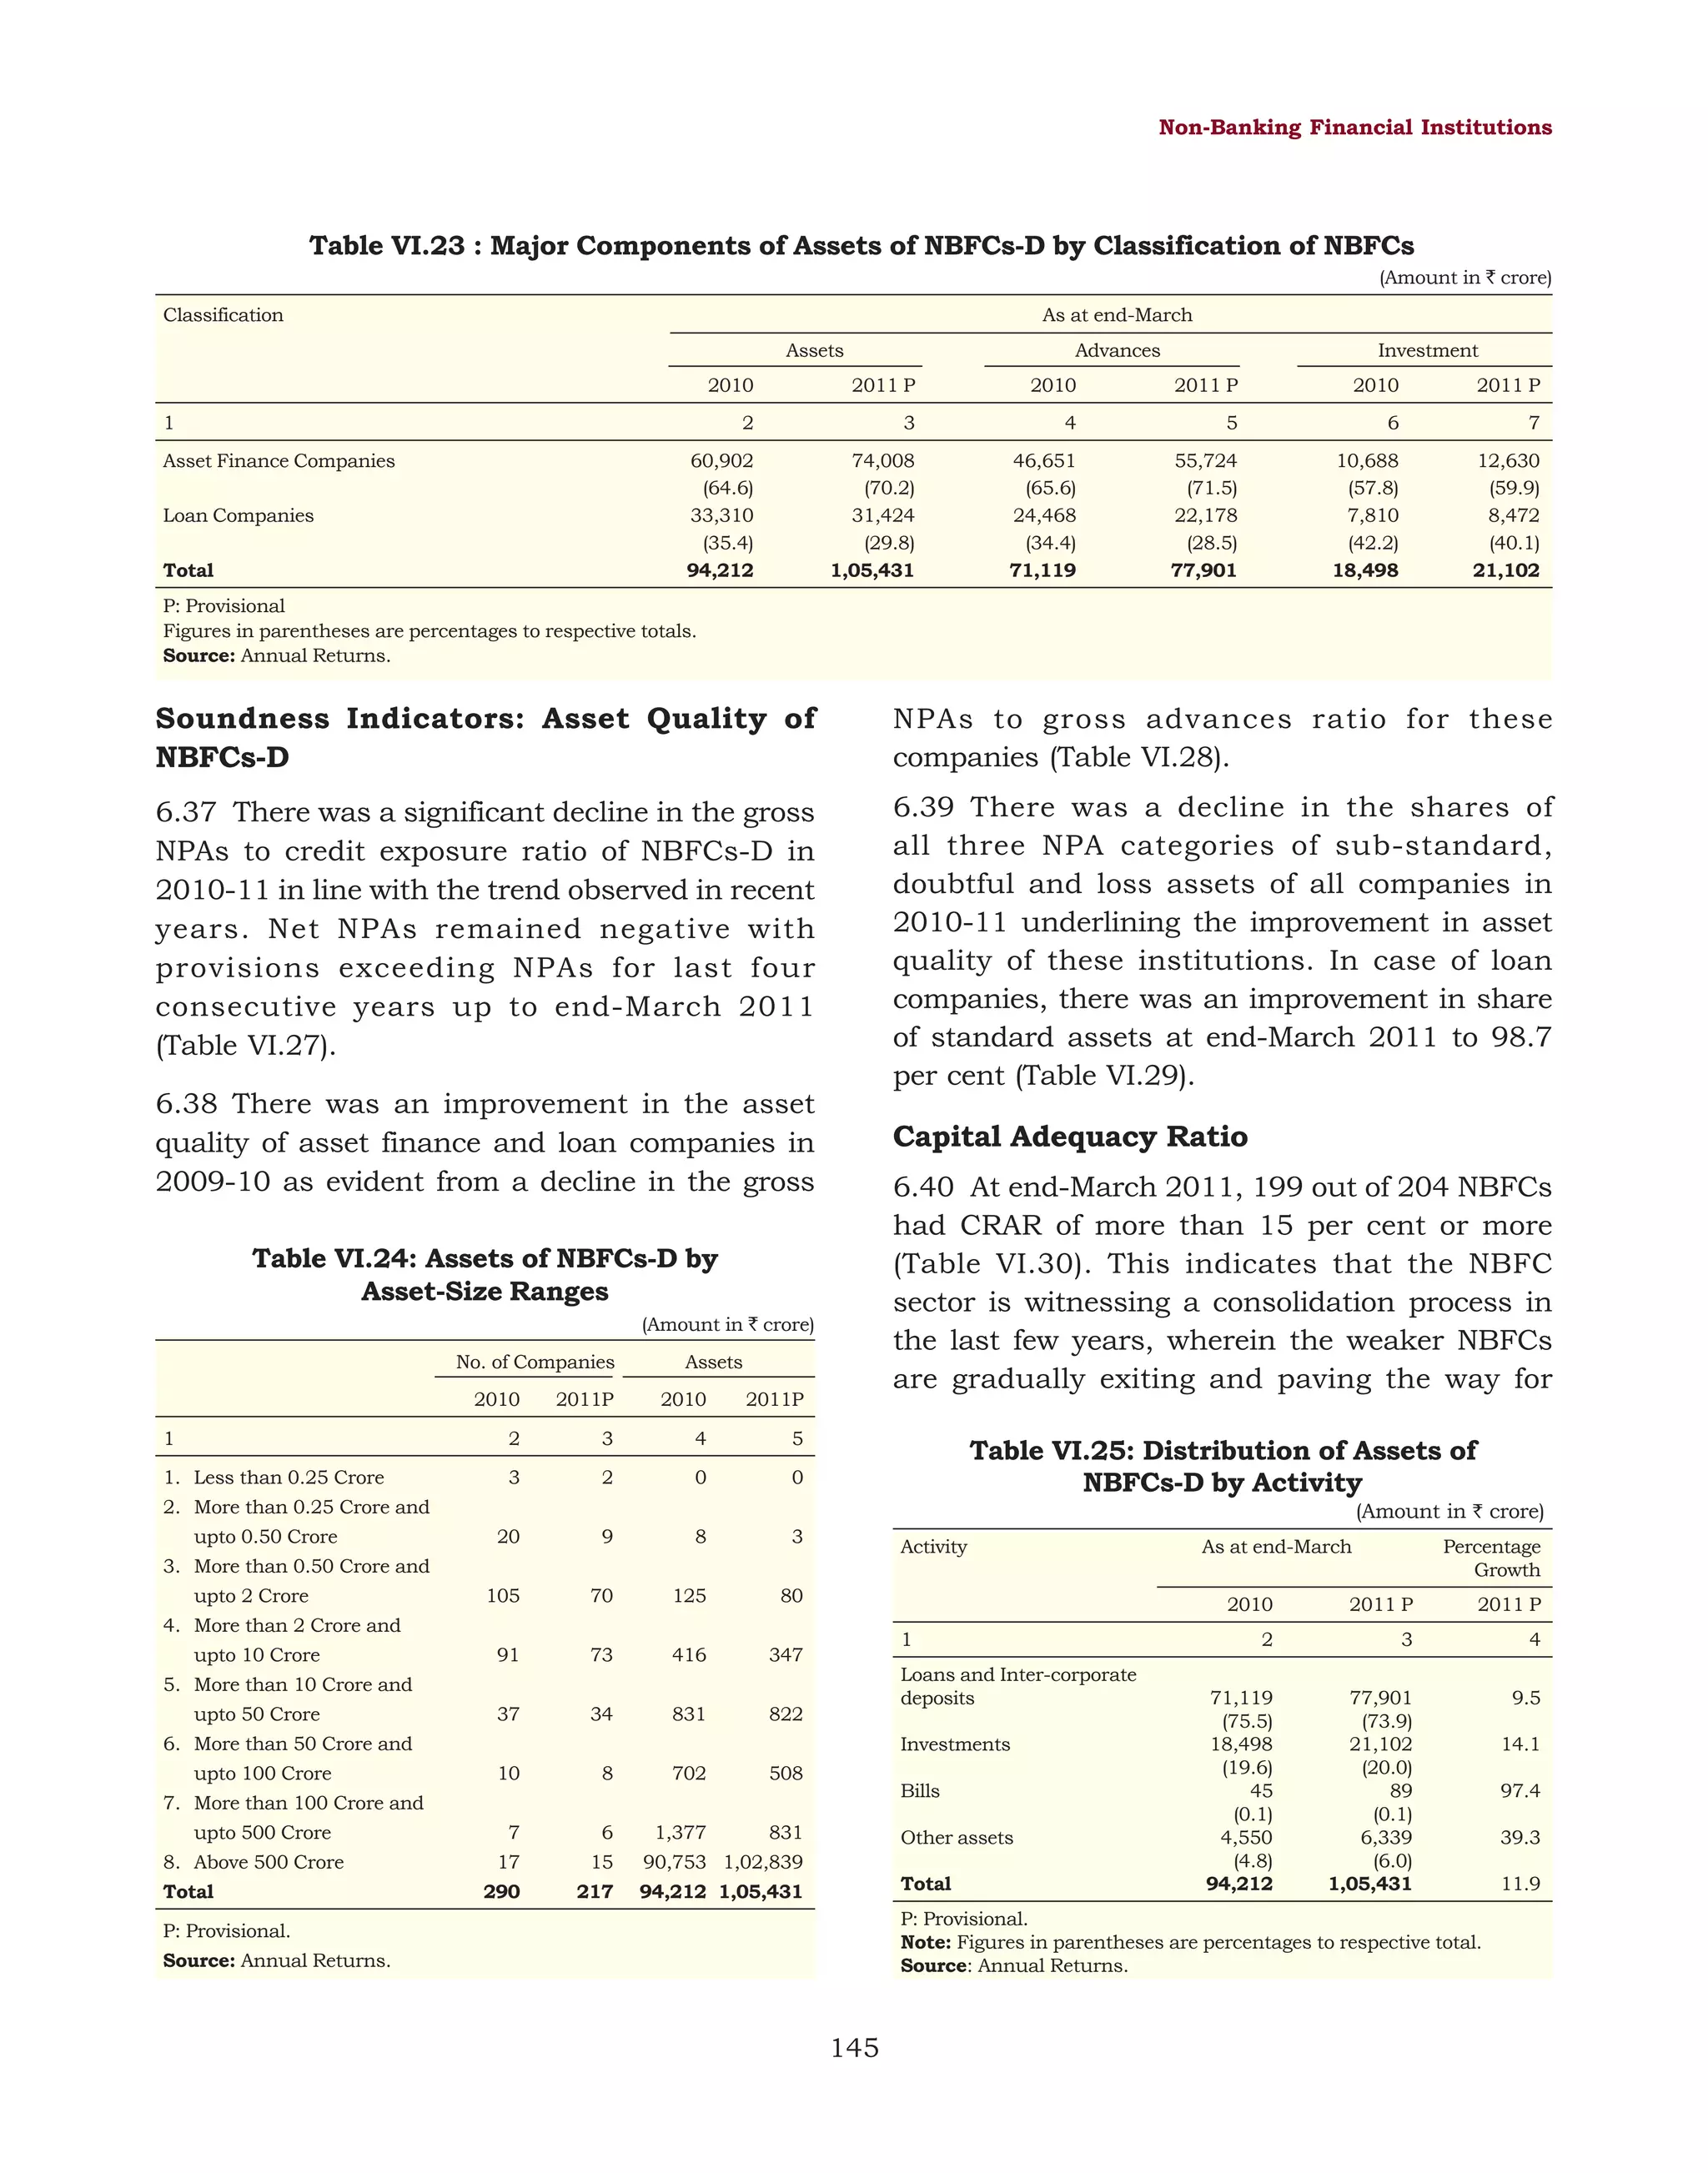
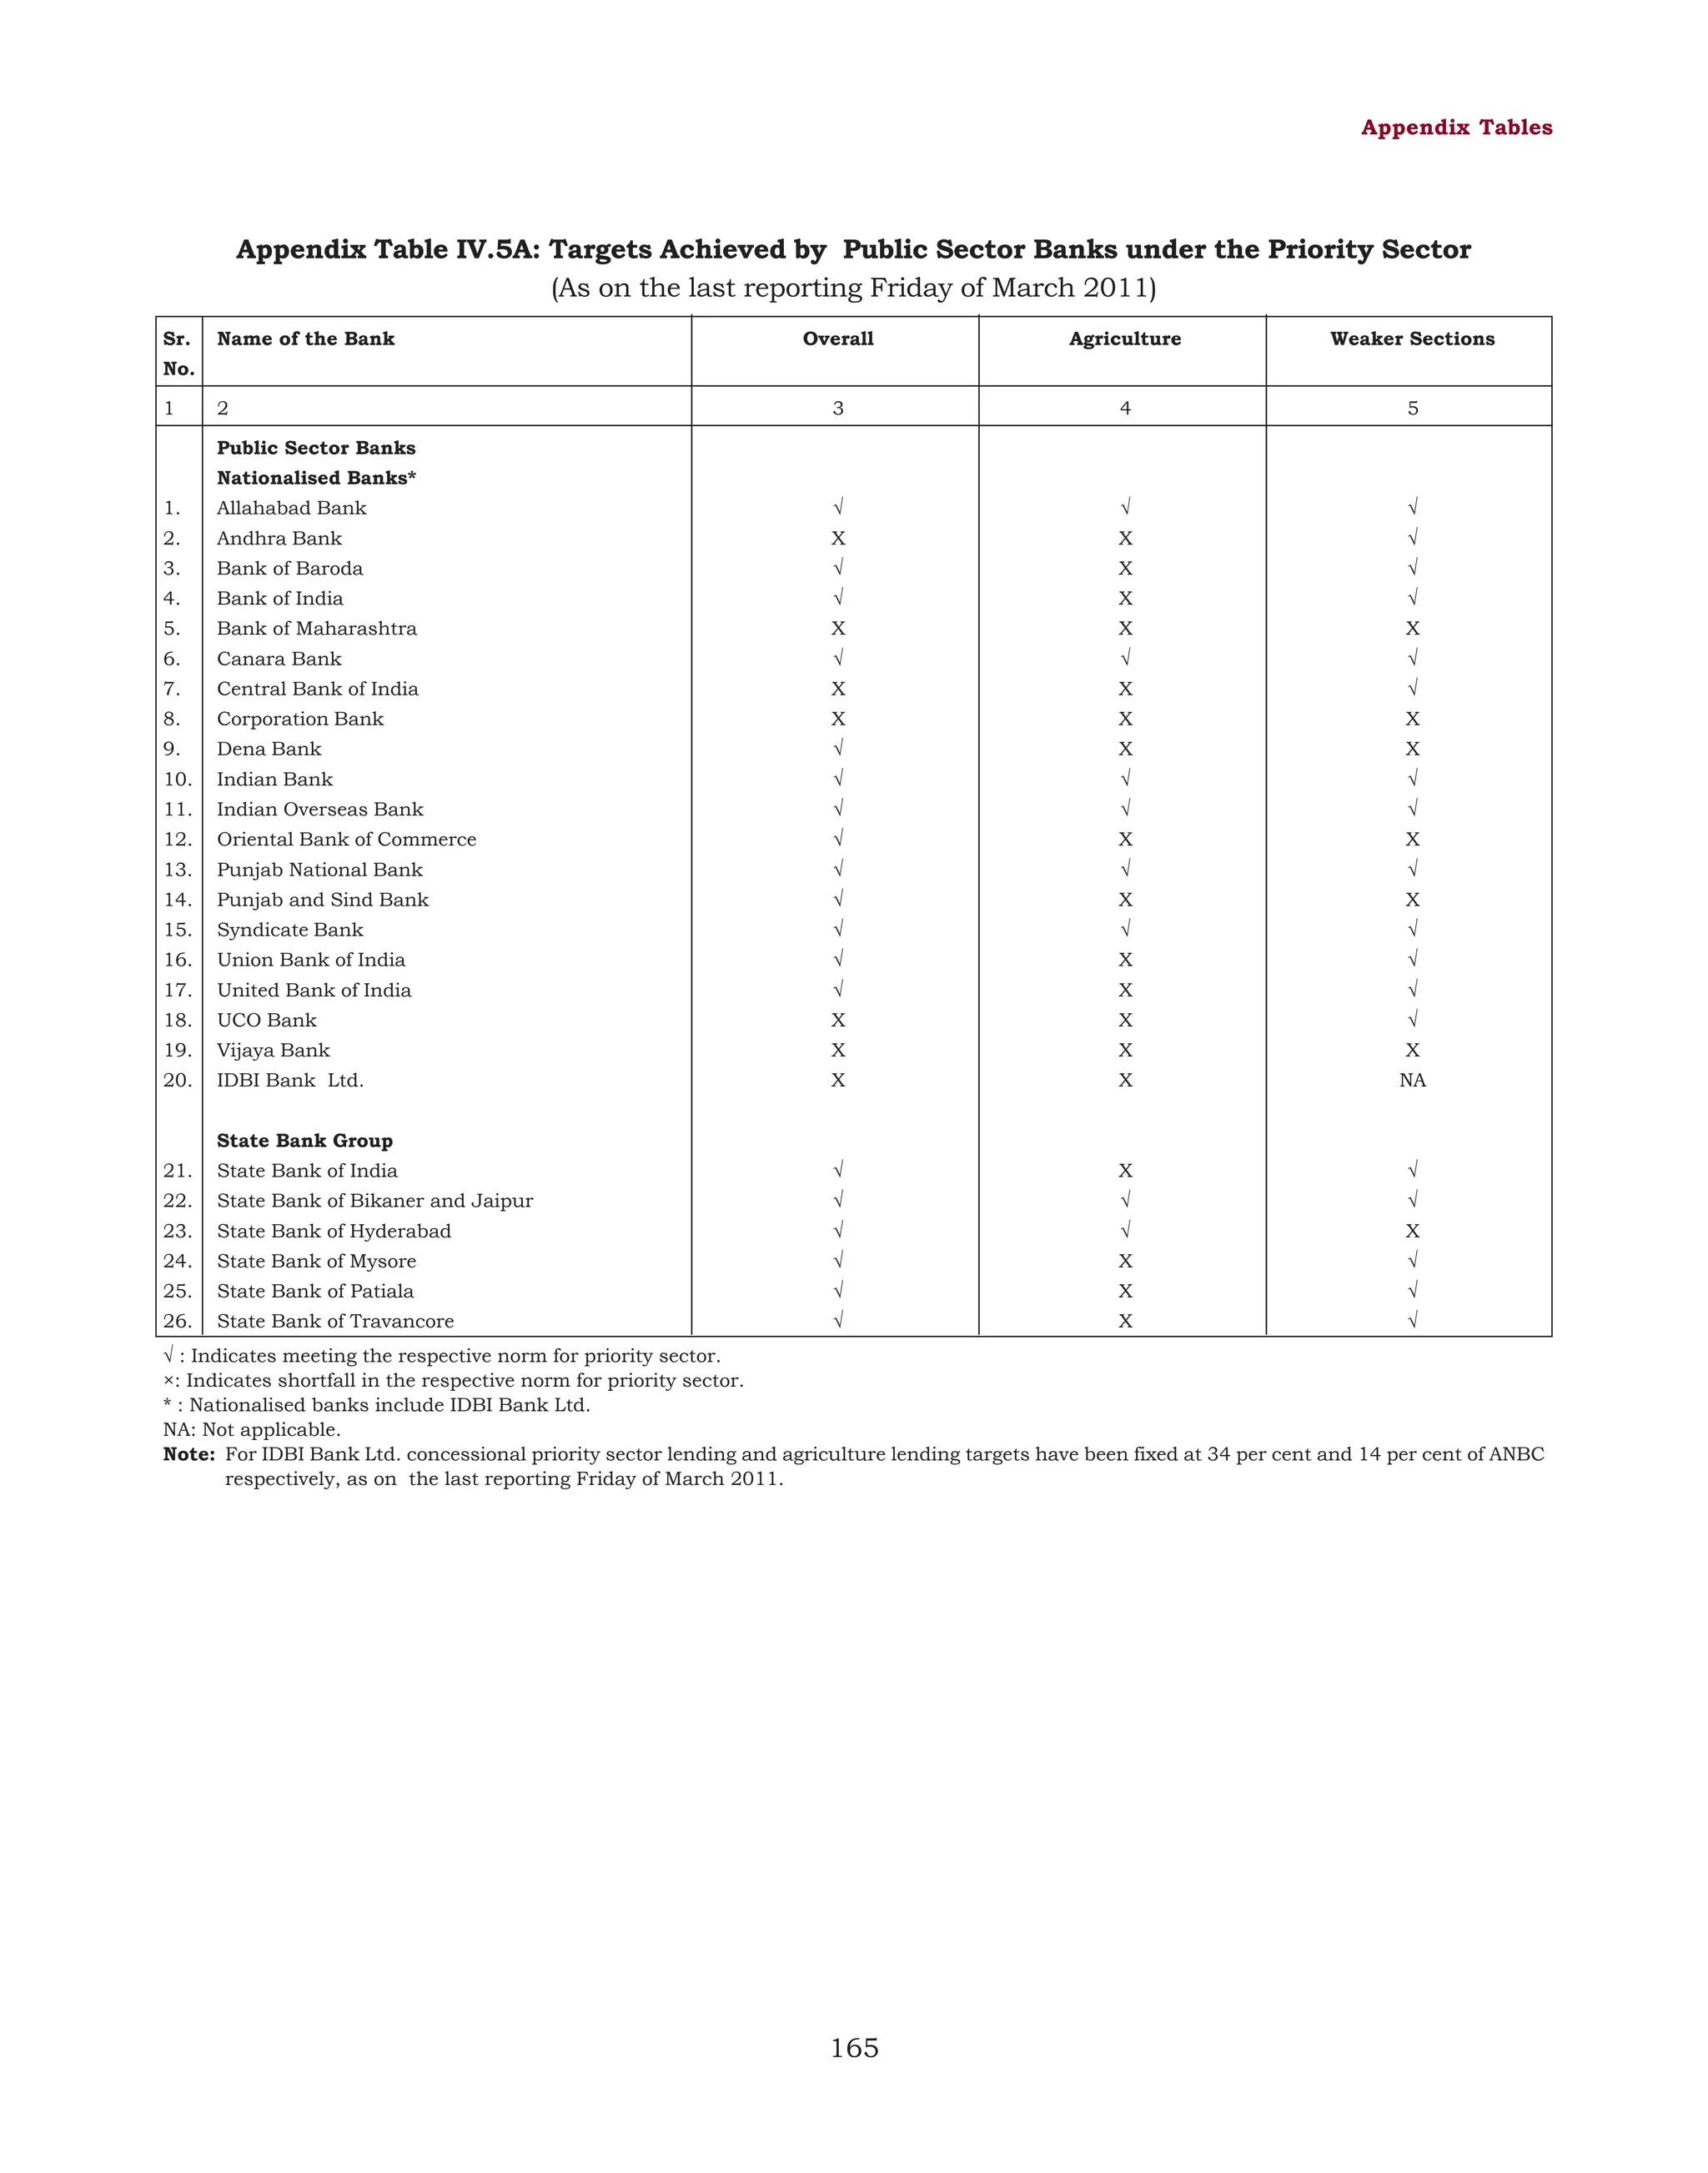
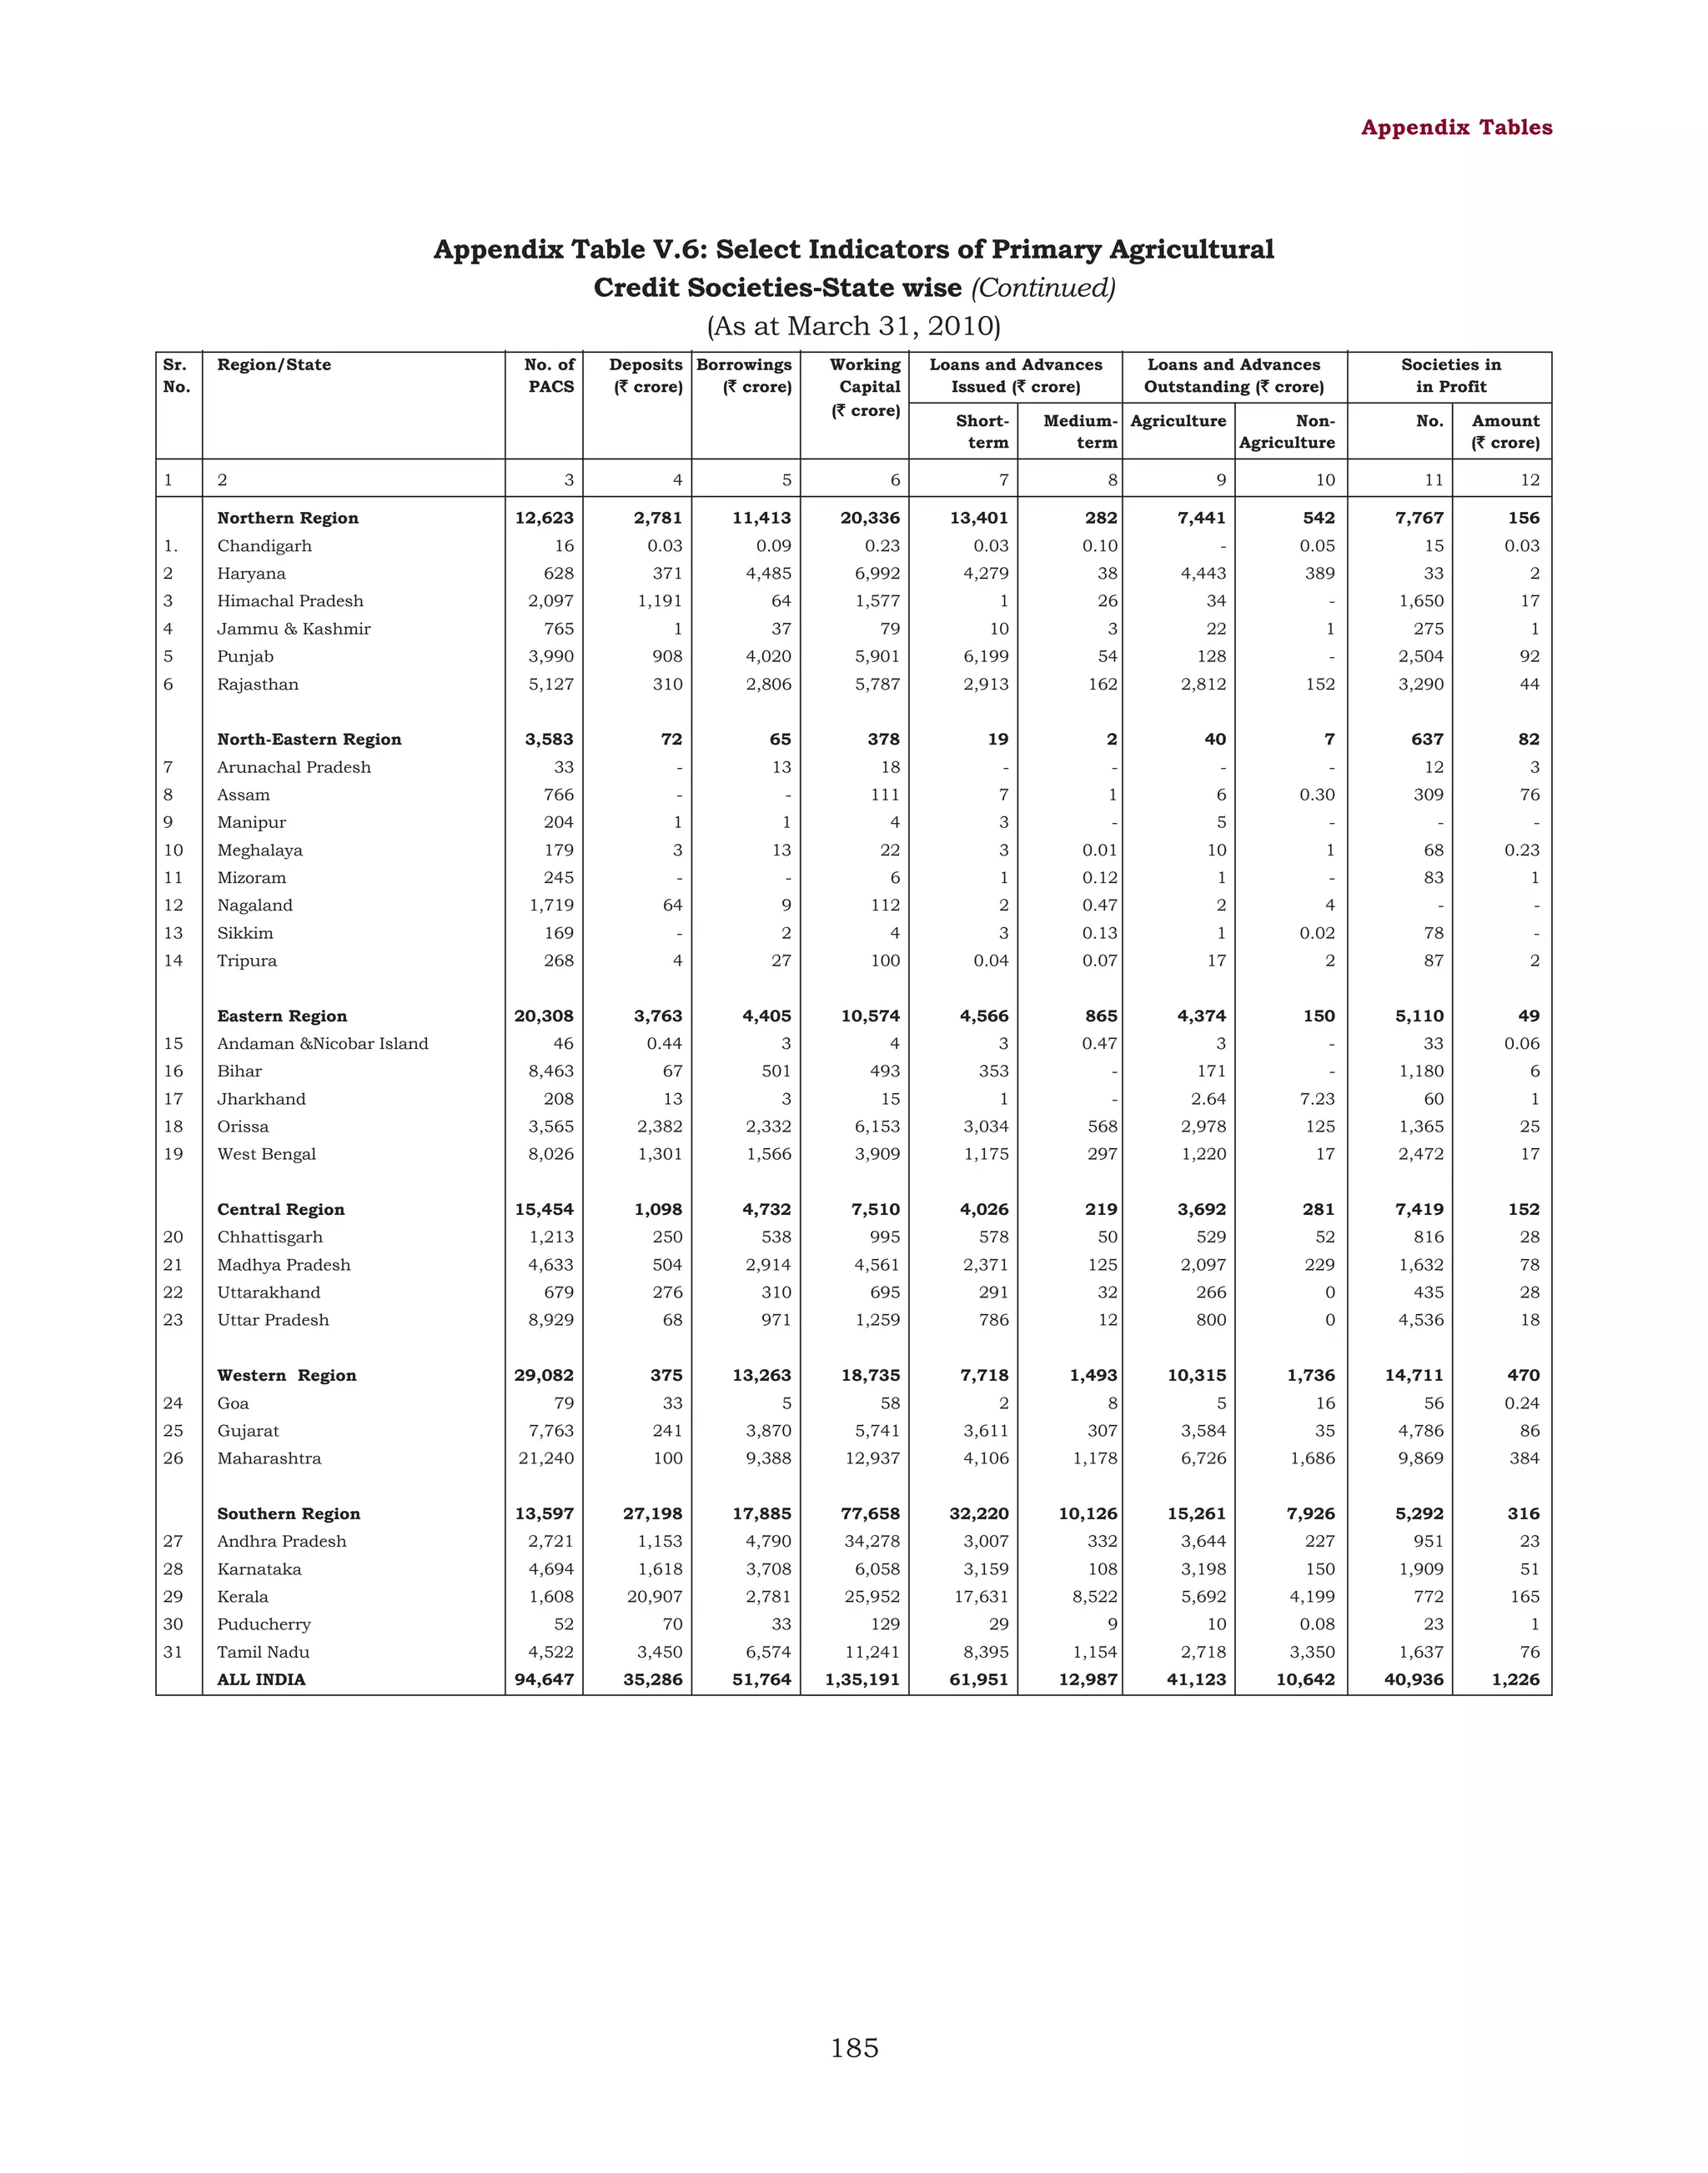
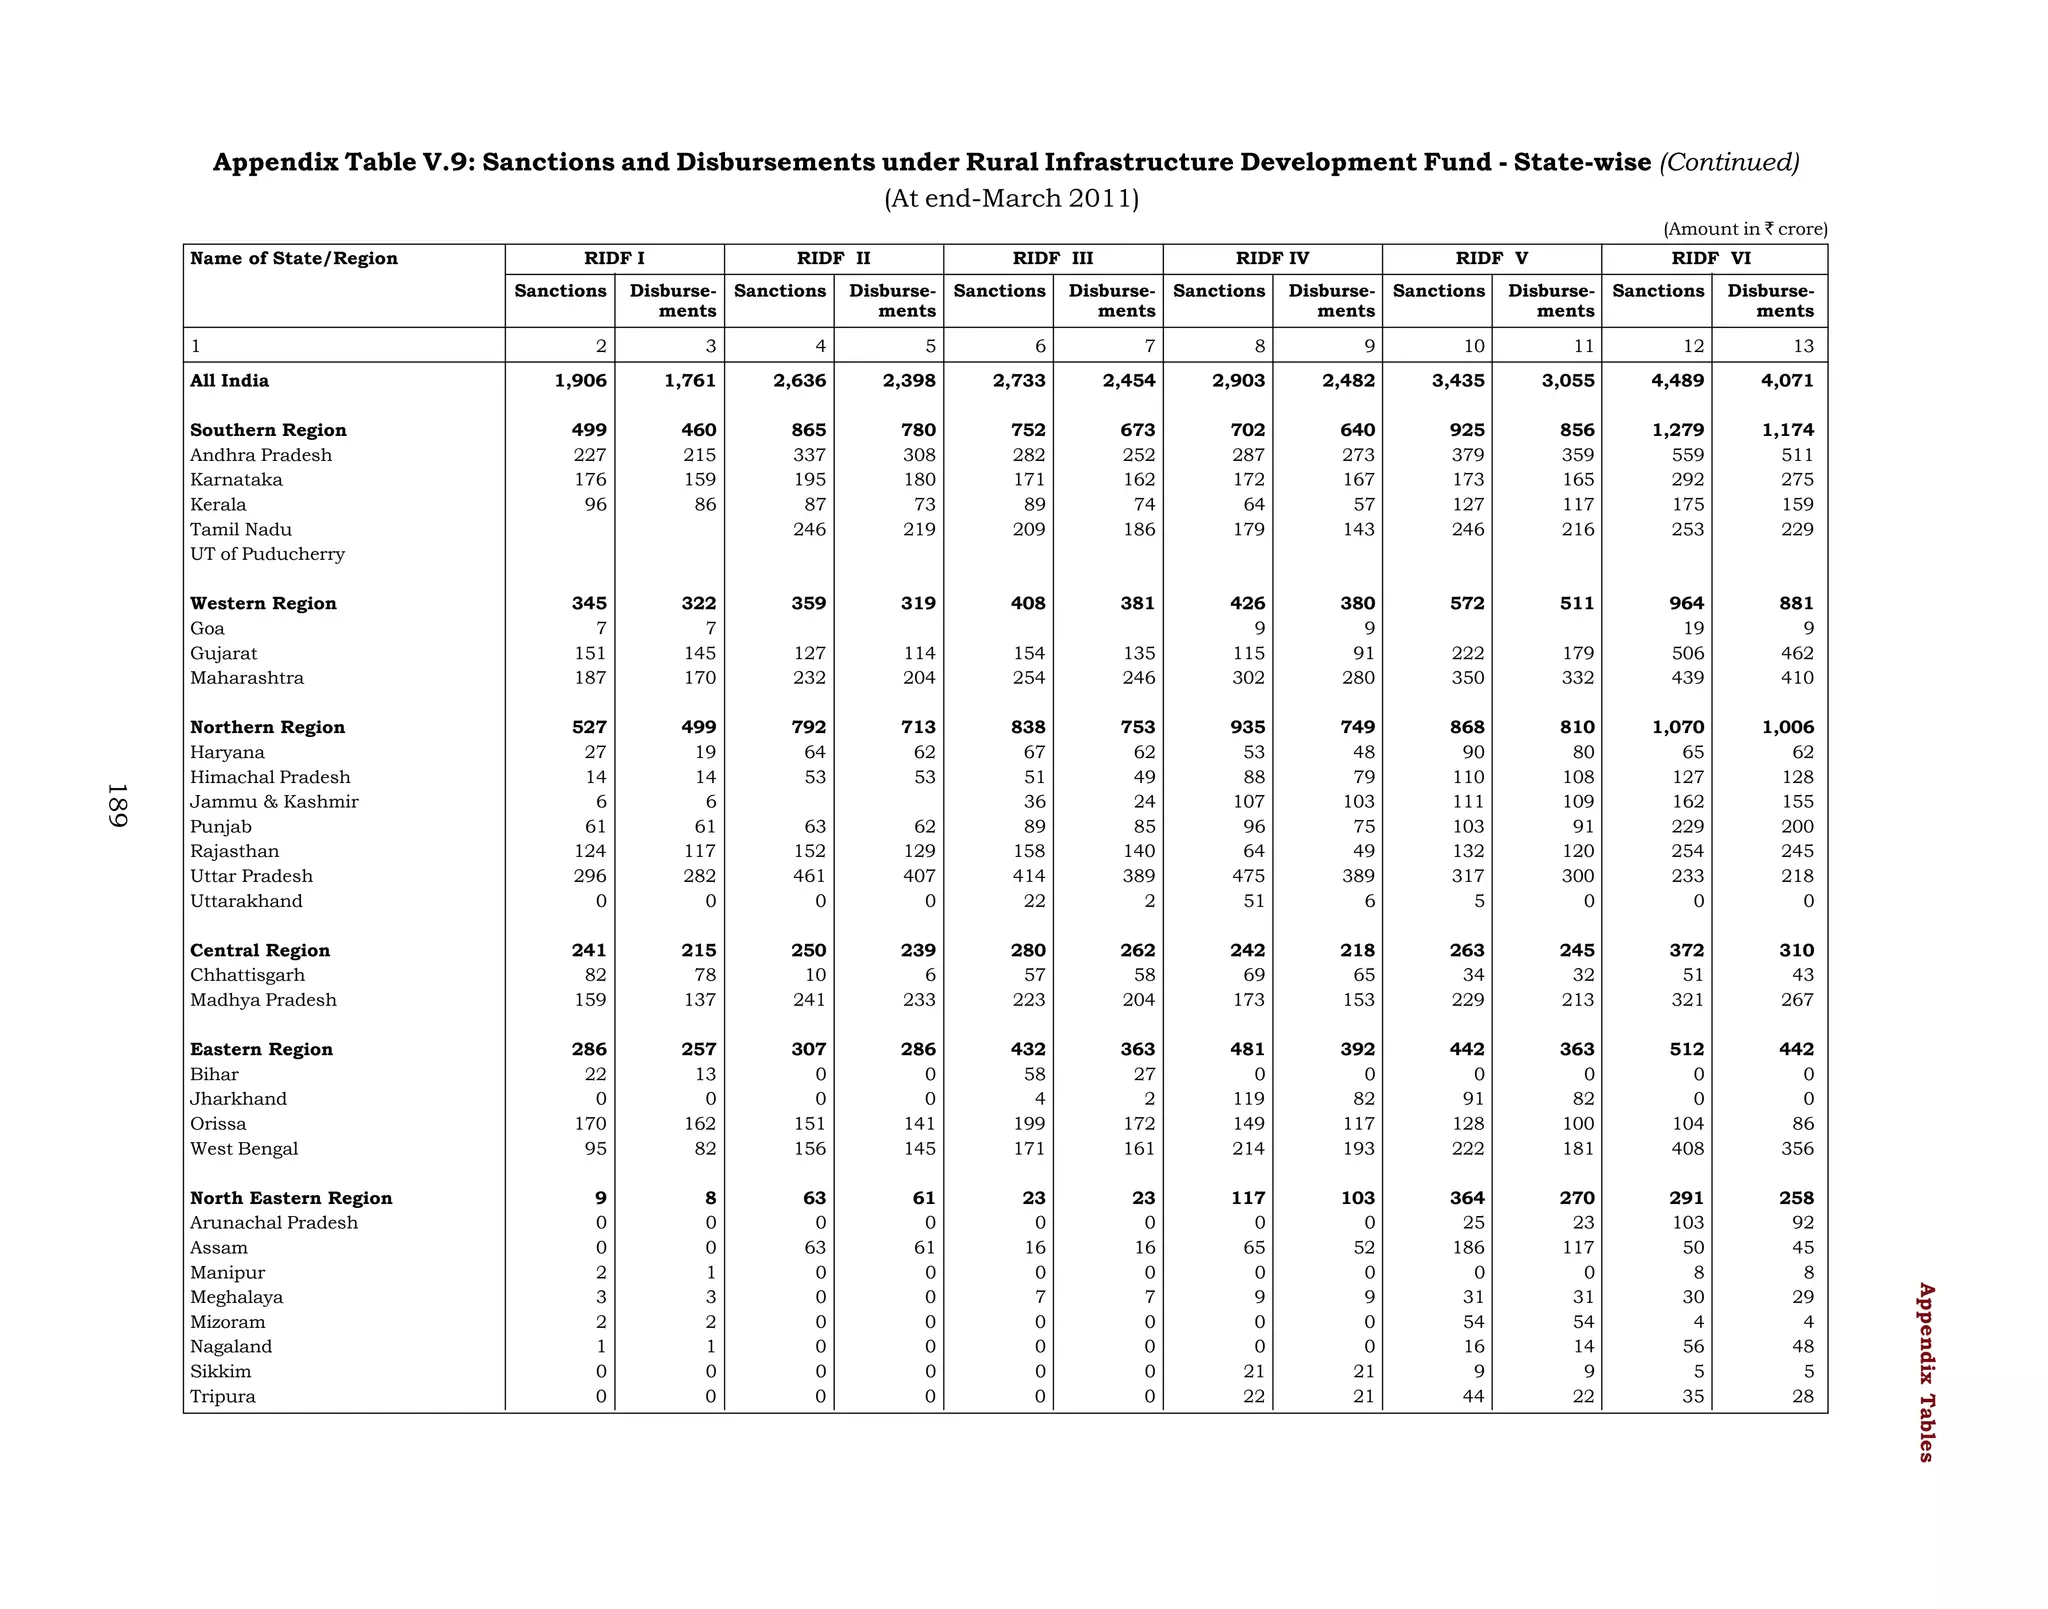
Table V.10: A Profile of Rural Cooperative Banks
(As at 31st March, 2010)
(Amount in `crore)
Item
Short-Term
Long-Term
StCBs
DCCBs
PACS
SCARDBs
PCARDBs
2
3
4
5
6
31
370
94,647
20
697
11,871
79,150
23,559
53,588
49,629
1,20,662
31,370
1,46,404
28,735
1,18,393
1,07,466
2,18,676
4,510
759
15,581
3,205
17,000
25,562
5,165
461
12,832
2,465
11,482
25,037
29
462
322
1,659
40,936
1,132
10
127
276
123
2
209
253
575
47*
523
1,136
4757
41,679
2,347
-1,215
-
9
155
-27
1,190
416
538
-415
4154
4353
8.8
91.8
16,234
12.9
75.7
39,524 ++
41.3
-
5,642
33.2
41.0
4,841
42.0
41.5
1
A.
B.
C.
D.
No. of Cooperative Banks
Balance Sheet Indicators
i. Owned Funds (Capital + Reserves)
ii. Deposits
iii. Borrowings
iv. Loans and Advances Issued
v. Loans and Advances Outstanding
vi. Total Liabilities/Assets
Financial Performance
i. Institutions in Profit
a. No.
b. Amount of Profits
ii. Institutions in Loss
a. No.
b. Amount of Loss
iii. Overall Profit (+)/Loss (-)
iv. Accumulated Loss
Non-performing Assets
i. Amount
ii. As Percentage of Loans Outstanding
iii. Recovery of Loans to Demand (Per cent)
12,479
35,286
51,764
74,938
76,480
1,35,192 +
StCBs: State Cooperative Banks, DCCBs: District Central Cooperative Banks, PACS: Primary Agricultural Credit Societies, SCARDBs: State Cooperative
Agriculture and Rural Development Banks, PCARDBs: Primary Cooperative Agriculture and Rural Development Banks.
‘-‘ : Not available.
+: Working capital.
++: Total overdues.
*: Nayagarh DCCB in Orissa is in no profits no loss situation.
Note: 1 StCBs in the states of Bihar, Manipur, Kerala and West Bengal are repeated for the year 2009-10 from previous year due to lack of information.
2 Data are repeated for DCCBs operating in the States Bihar, West Bengal and Kerala.
3 Manipur SCARDB is defunct.
4 Data for 5 SCARDB are not available for 2010.
Source: NABARD and NAFSCOB.
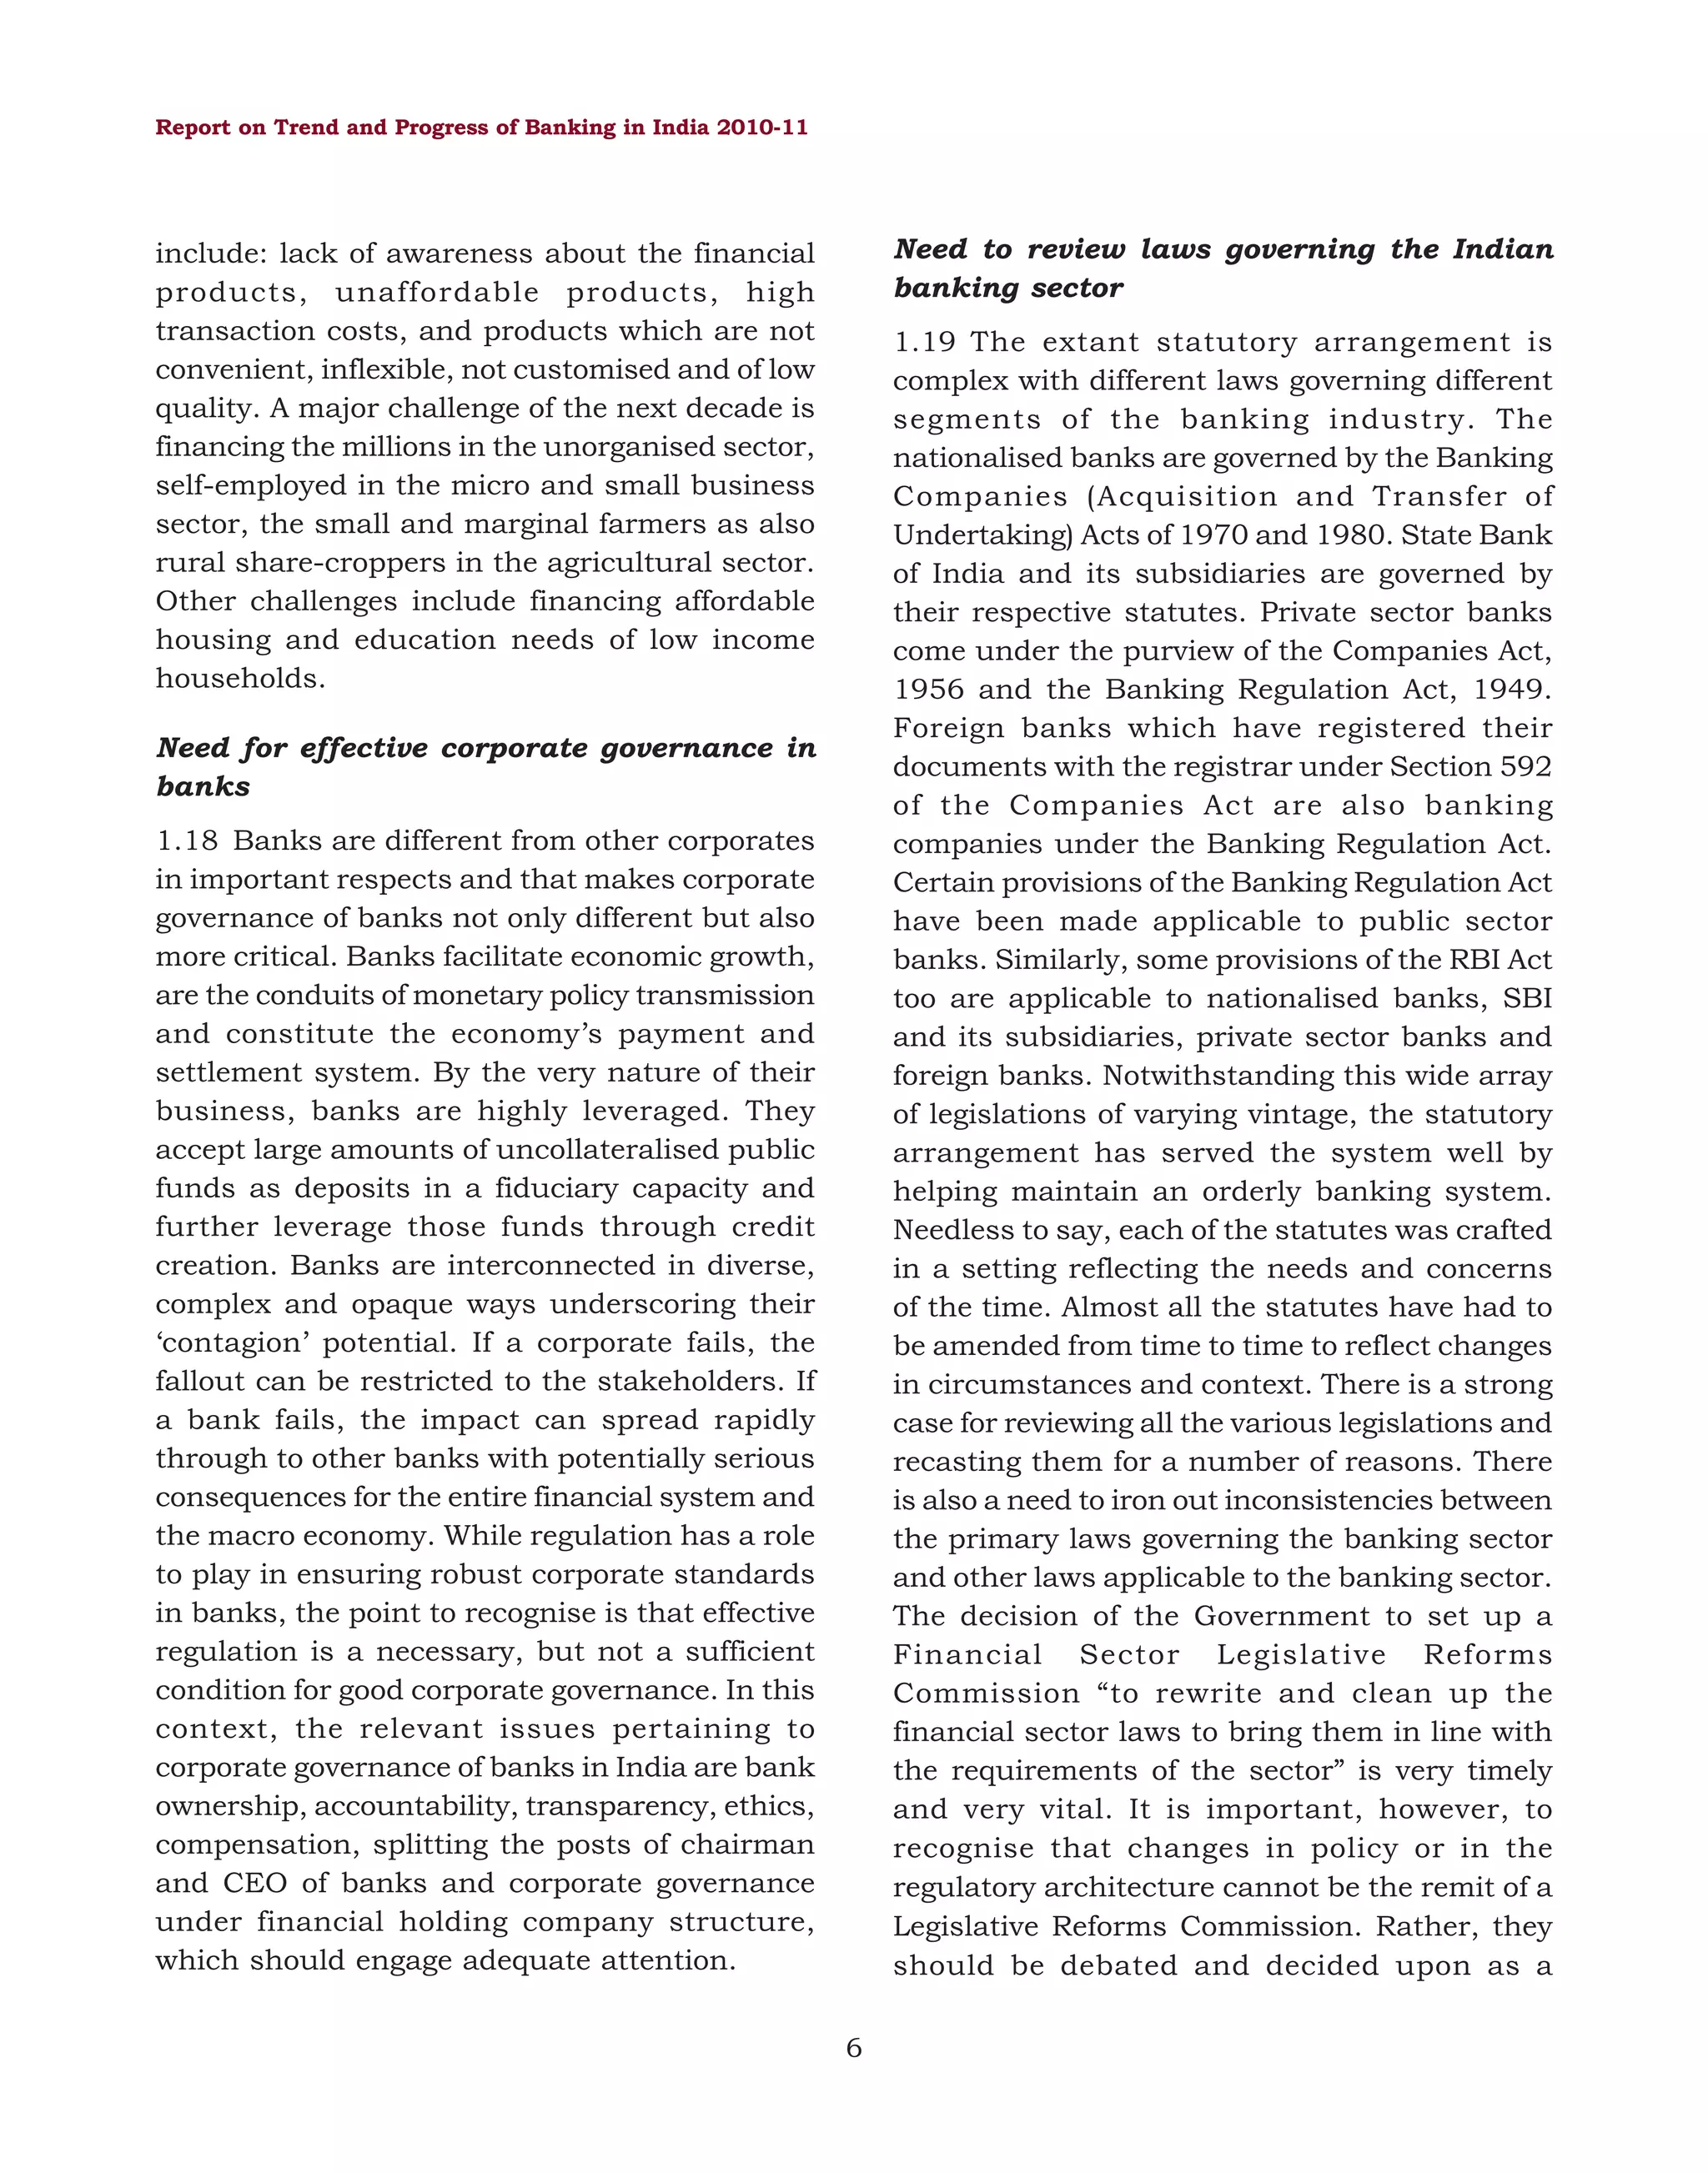
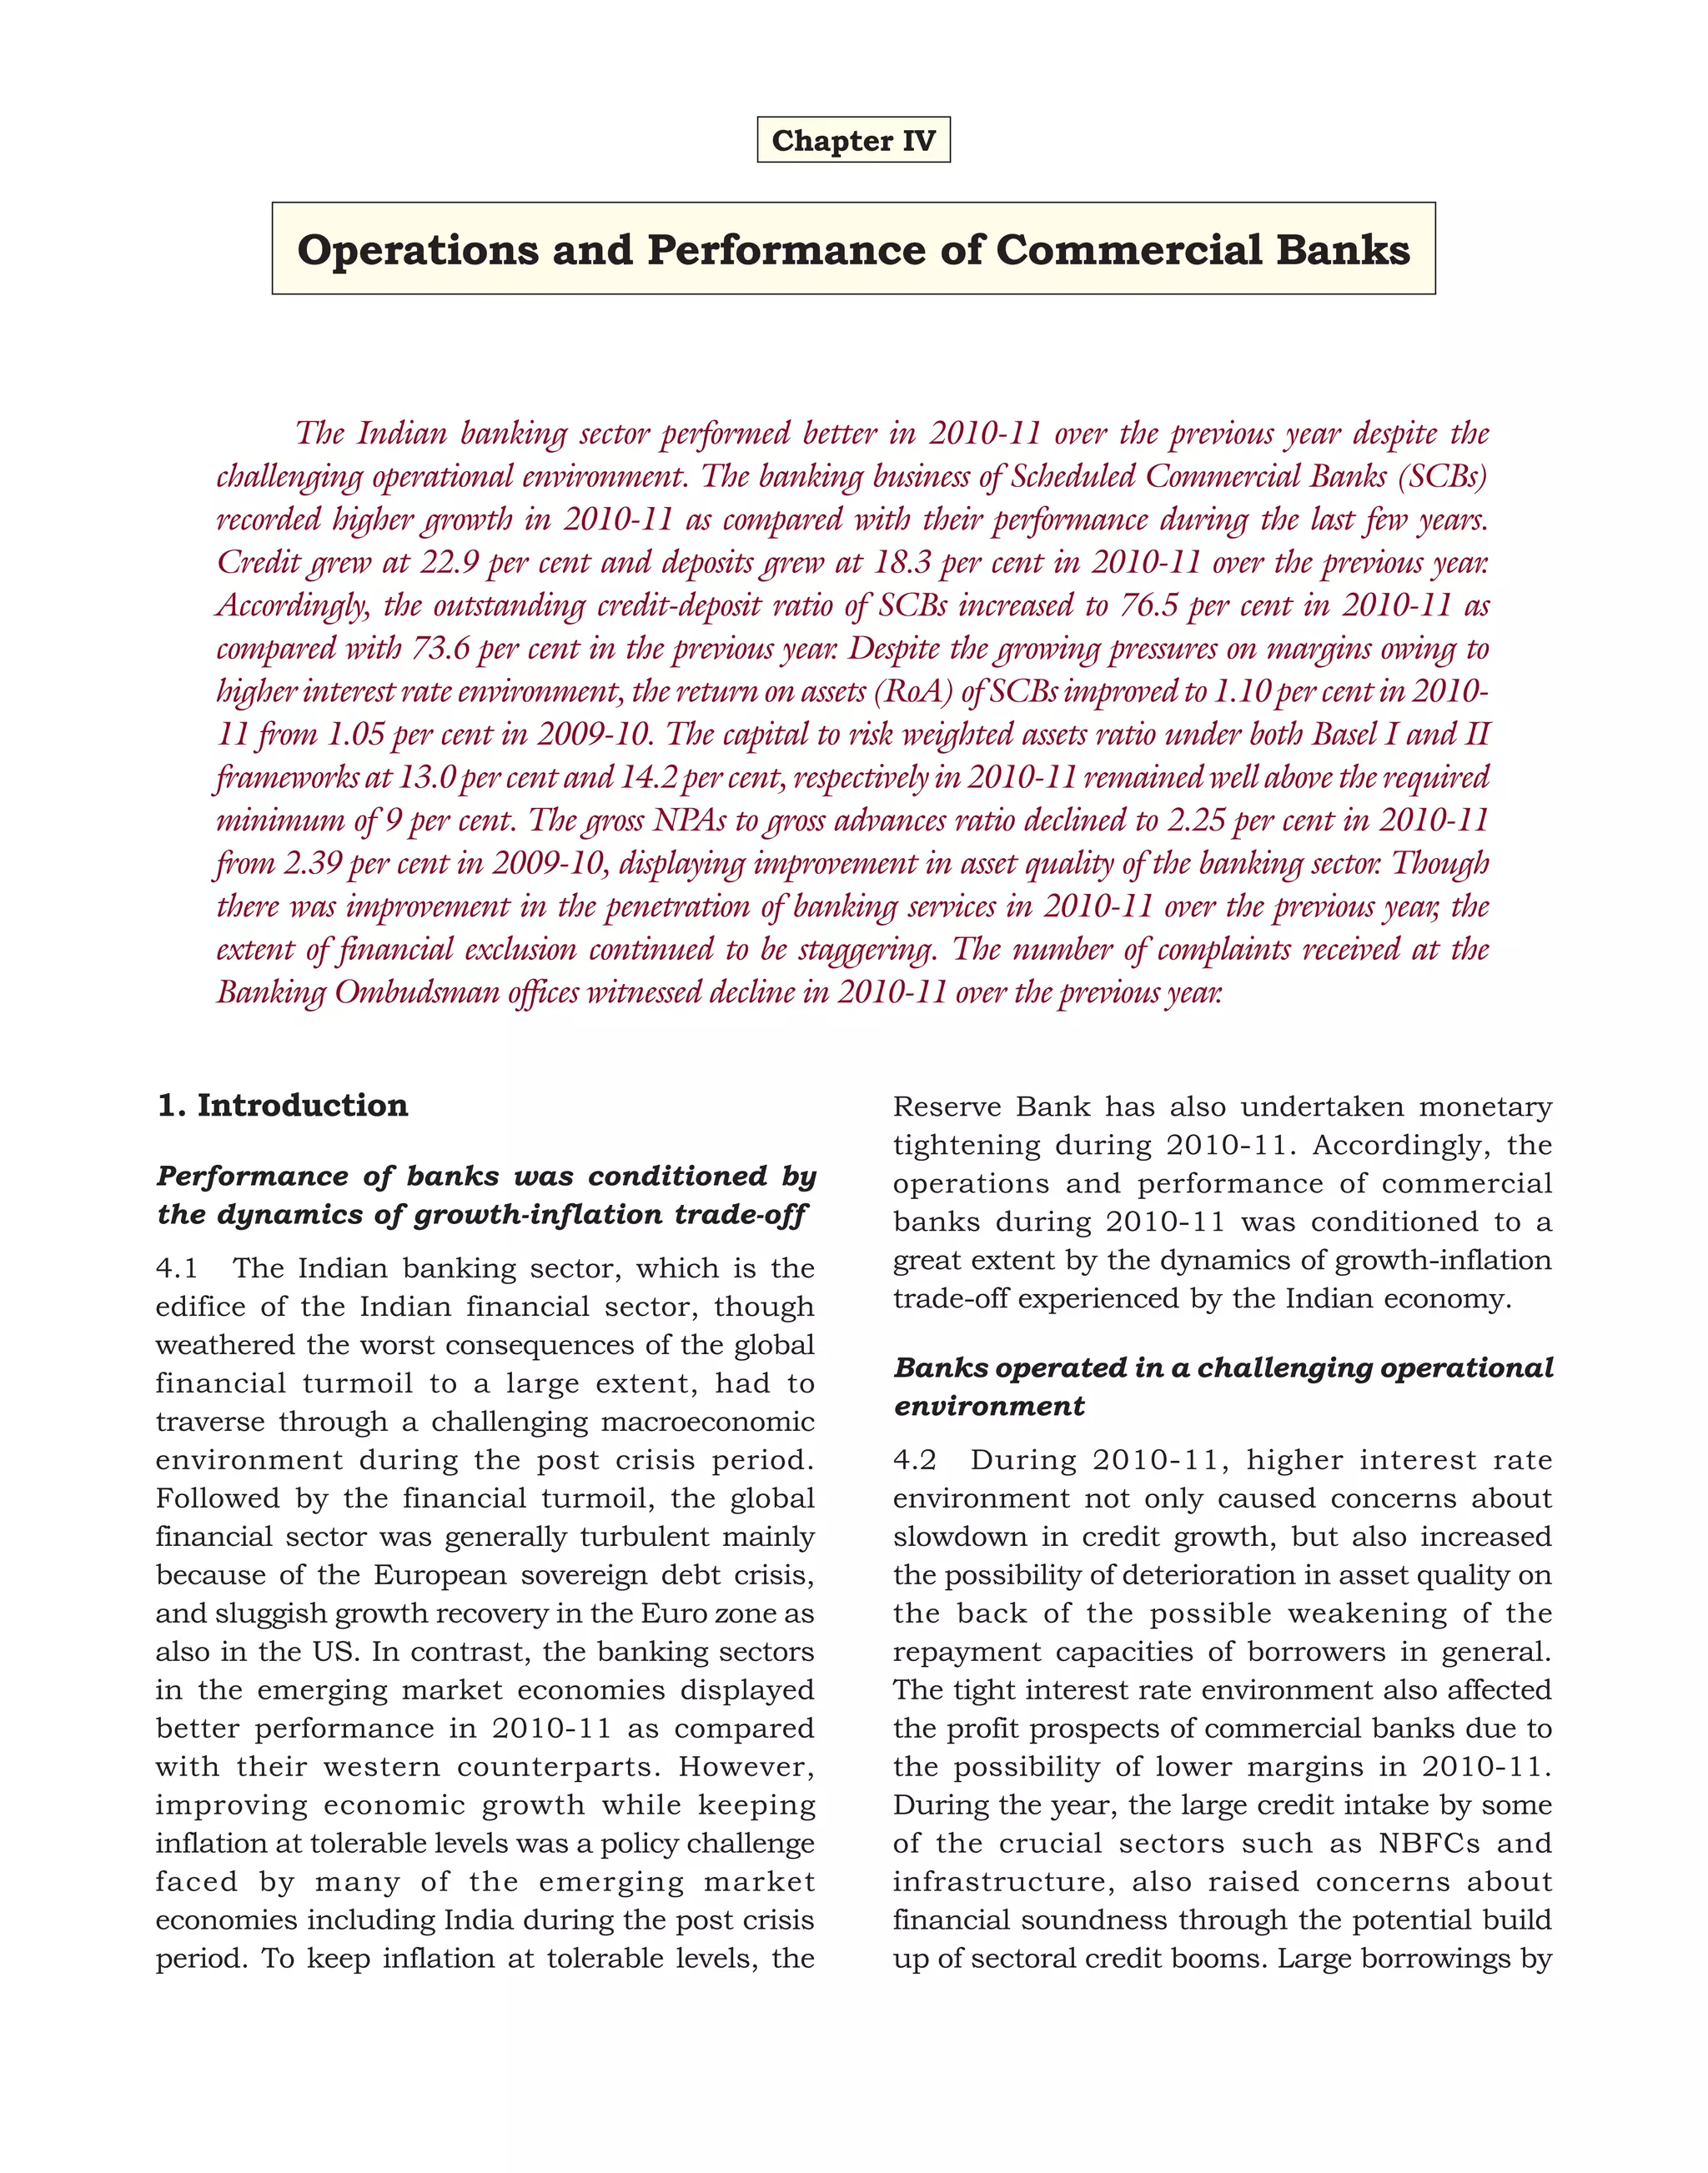
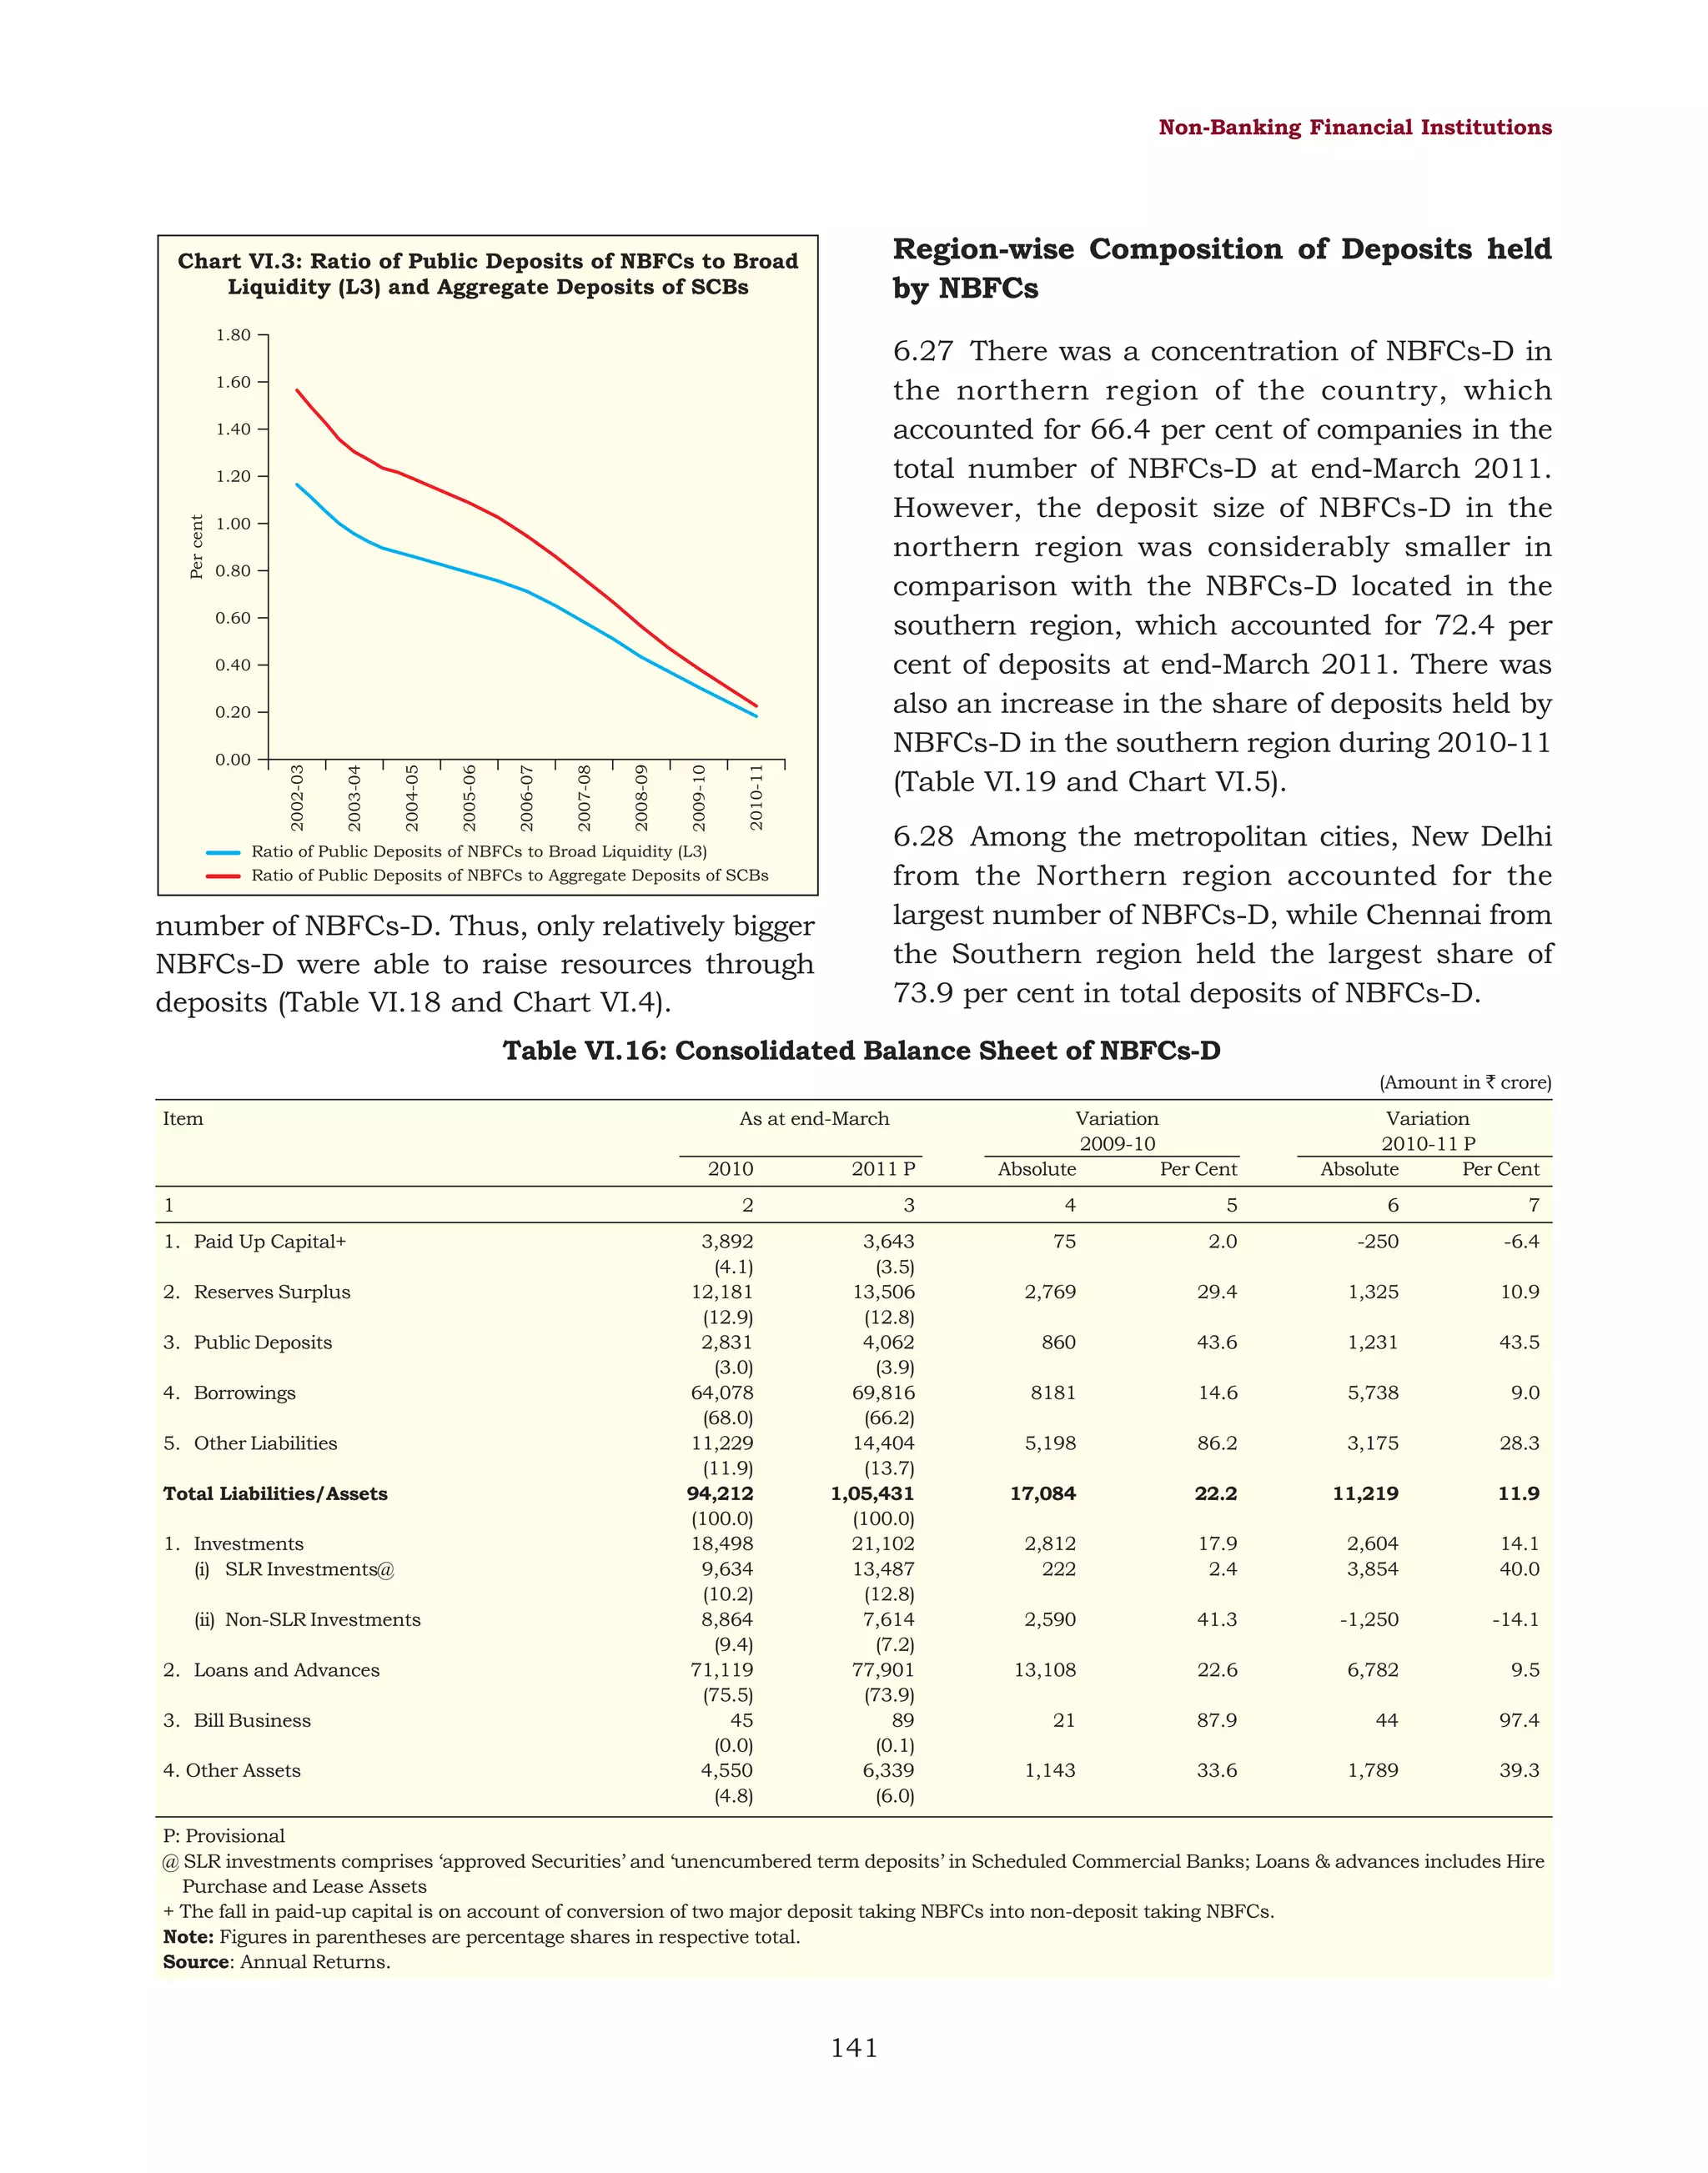
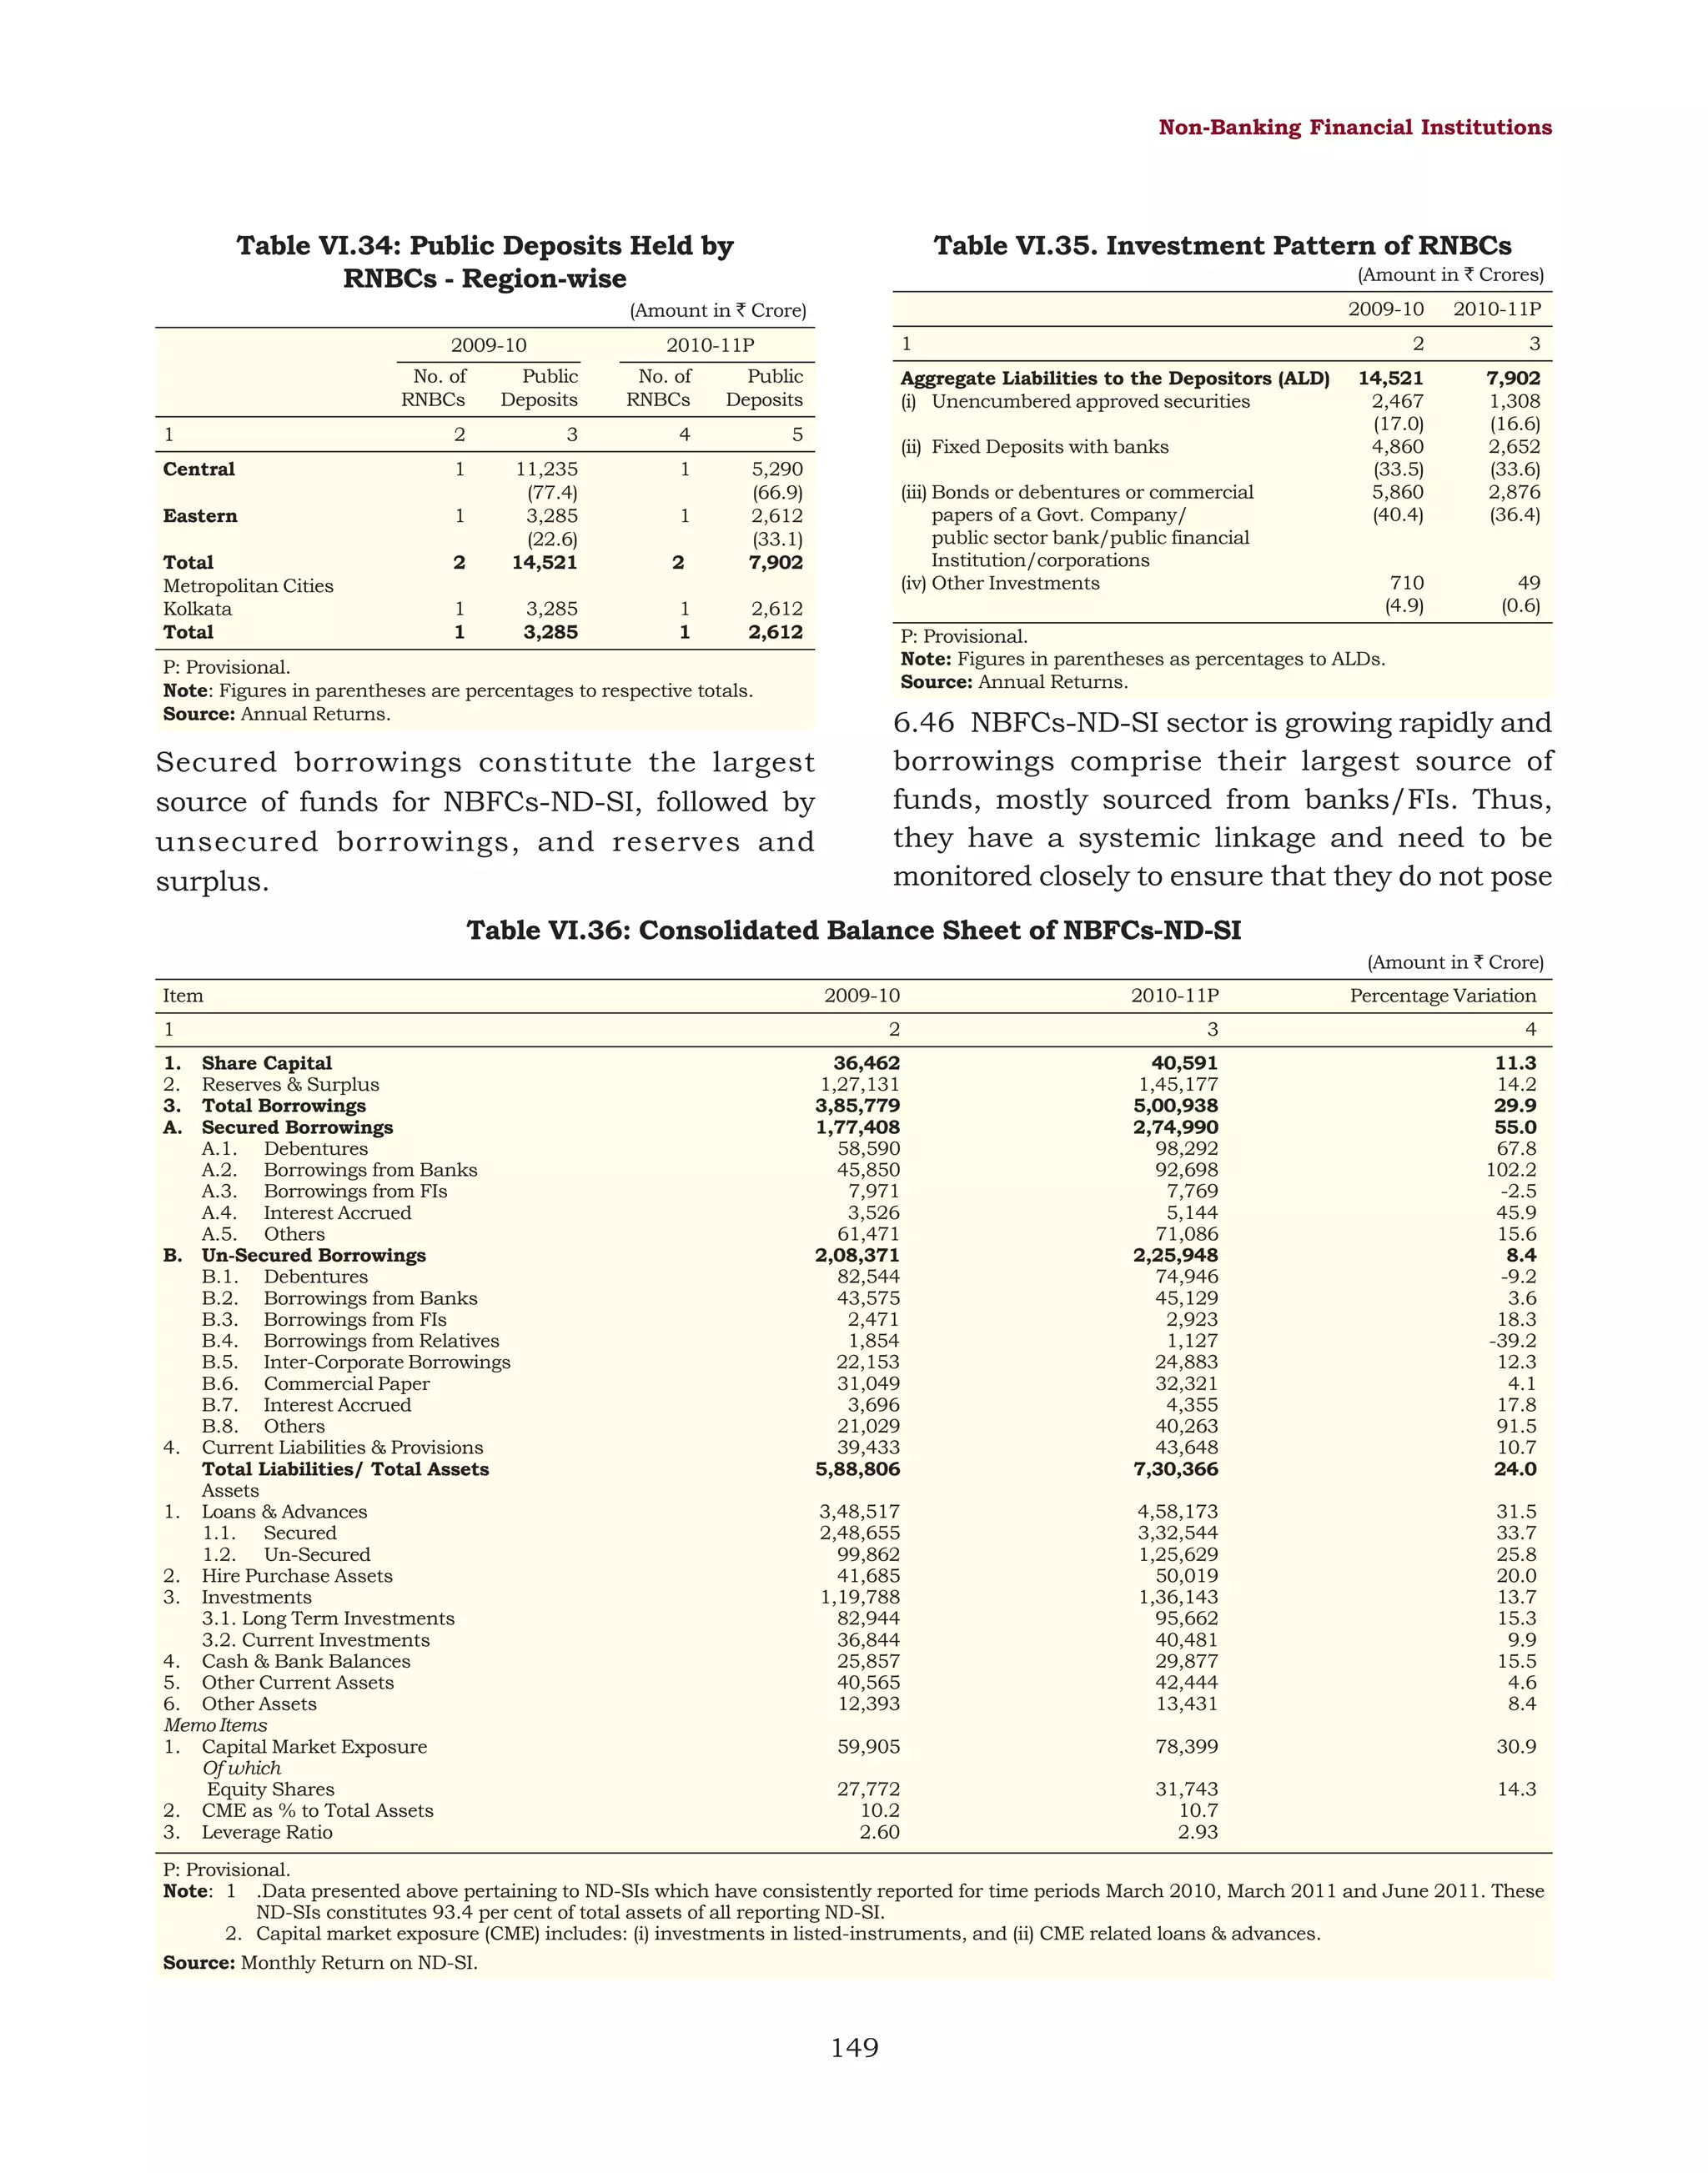
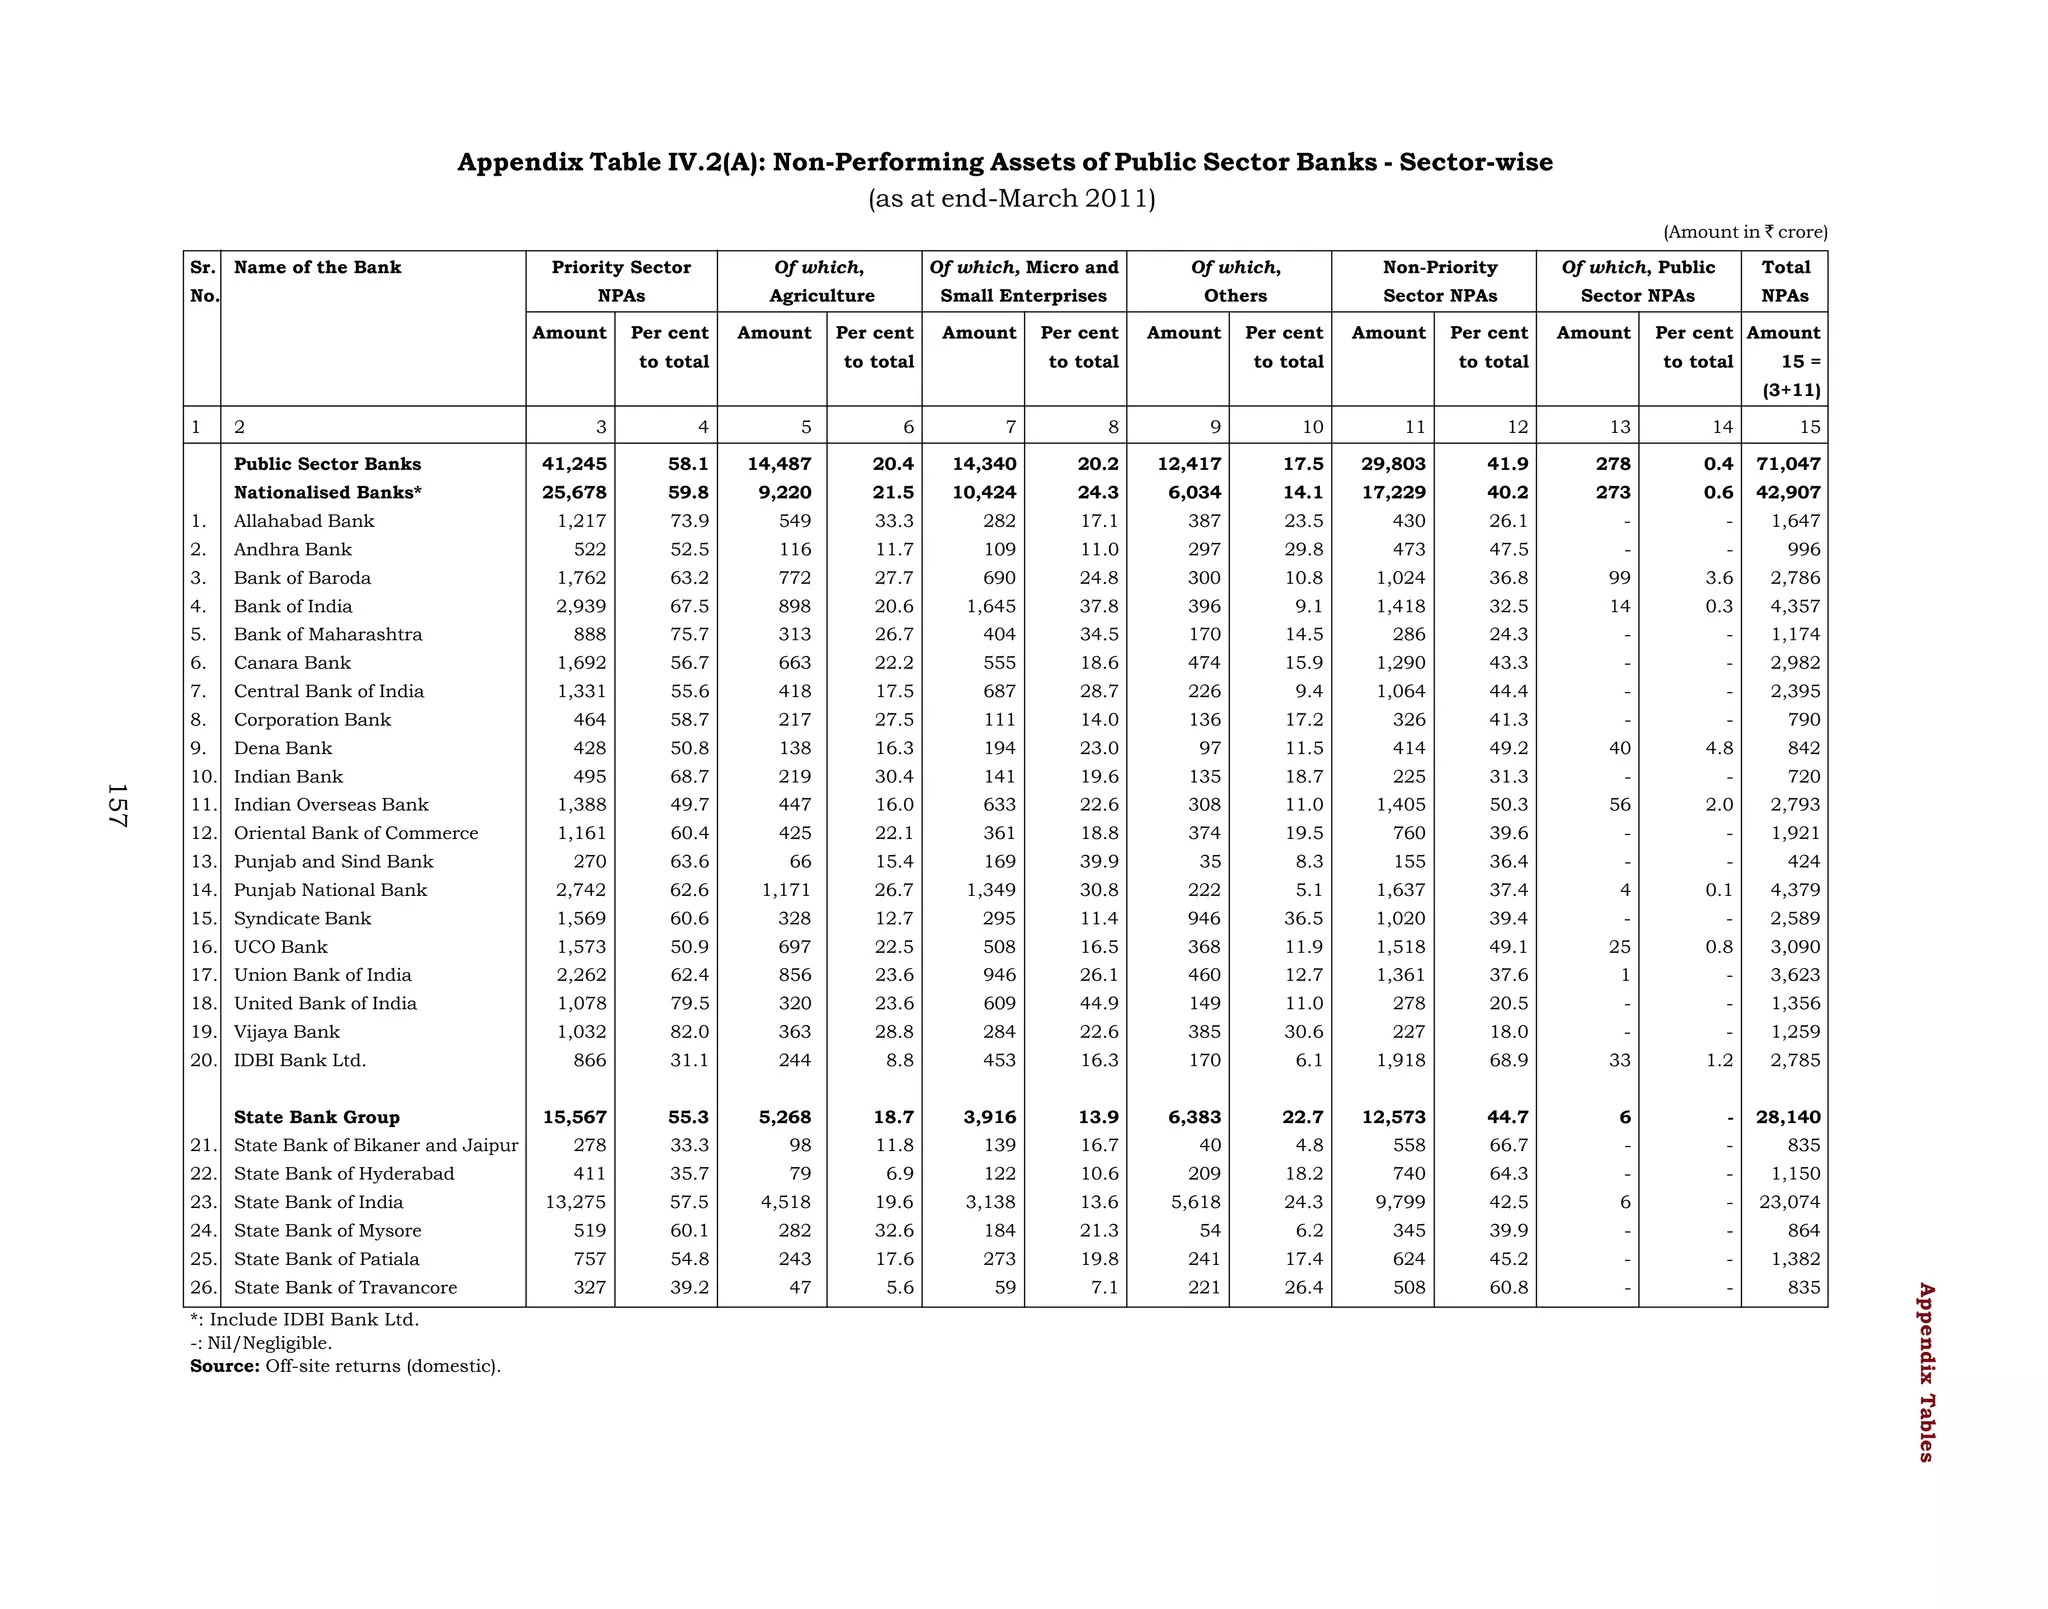
accounted for the almost 45 per cent of total
assets. During 2009-10, investments increased
at a higher rate than loans and advances.
Also, the percentage share of investments
in total assets increased with a decline in
the share of loans and advances as at endMarch 2010 as compared to the previous year
(Table V.12).
was lower than the growth observed during
2008-09. The growth in StCB’s balance sheet
was mainly due to increase in borrowings and
other liabilities on the liabilities side, and cash
and bank balances, and other assets on the
assets side. On the liabilities side, deposits
continued to account for the largest share of the
resources of StCBs, while investment
Table V.11: Elected Boards under Supersession
(Position as on March 31, 2010)
(Amount in `crore)
Item
StCBs
1
(i) Total number of institutions
(ii) Number of institutions where Boards were under Supersession
Percentage of reporting Boards under supersession [(ii) as per cent of (i)]
DCCBs
SCARDBs
PCARDBs
Total
2
3
4
5
6
31
9
29.0
370
86
23.2
20
9
45.0
697
265
38.0
1,118
369
33.0
Note: 1. Data related to StCBs in Bihar, Sikkim, Pondicherry and West Bengal and DCCBs in Bihar, Jharkhand and West Bengal are repeated for 2009-10 due
to lack of information.
2. SCARDB in Tripura is defunct.
Source: NABARD.
117](https://image.slidesharecdn.com/0tpbi121111full-140101004243-phpapp02/75/0-tpbi121111-full-137-2048.jpg)
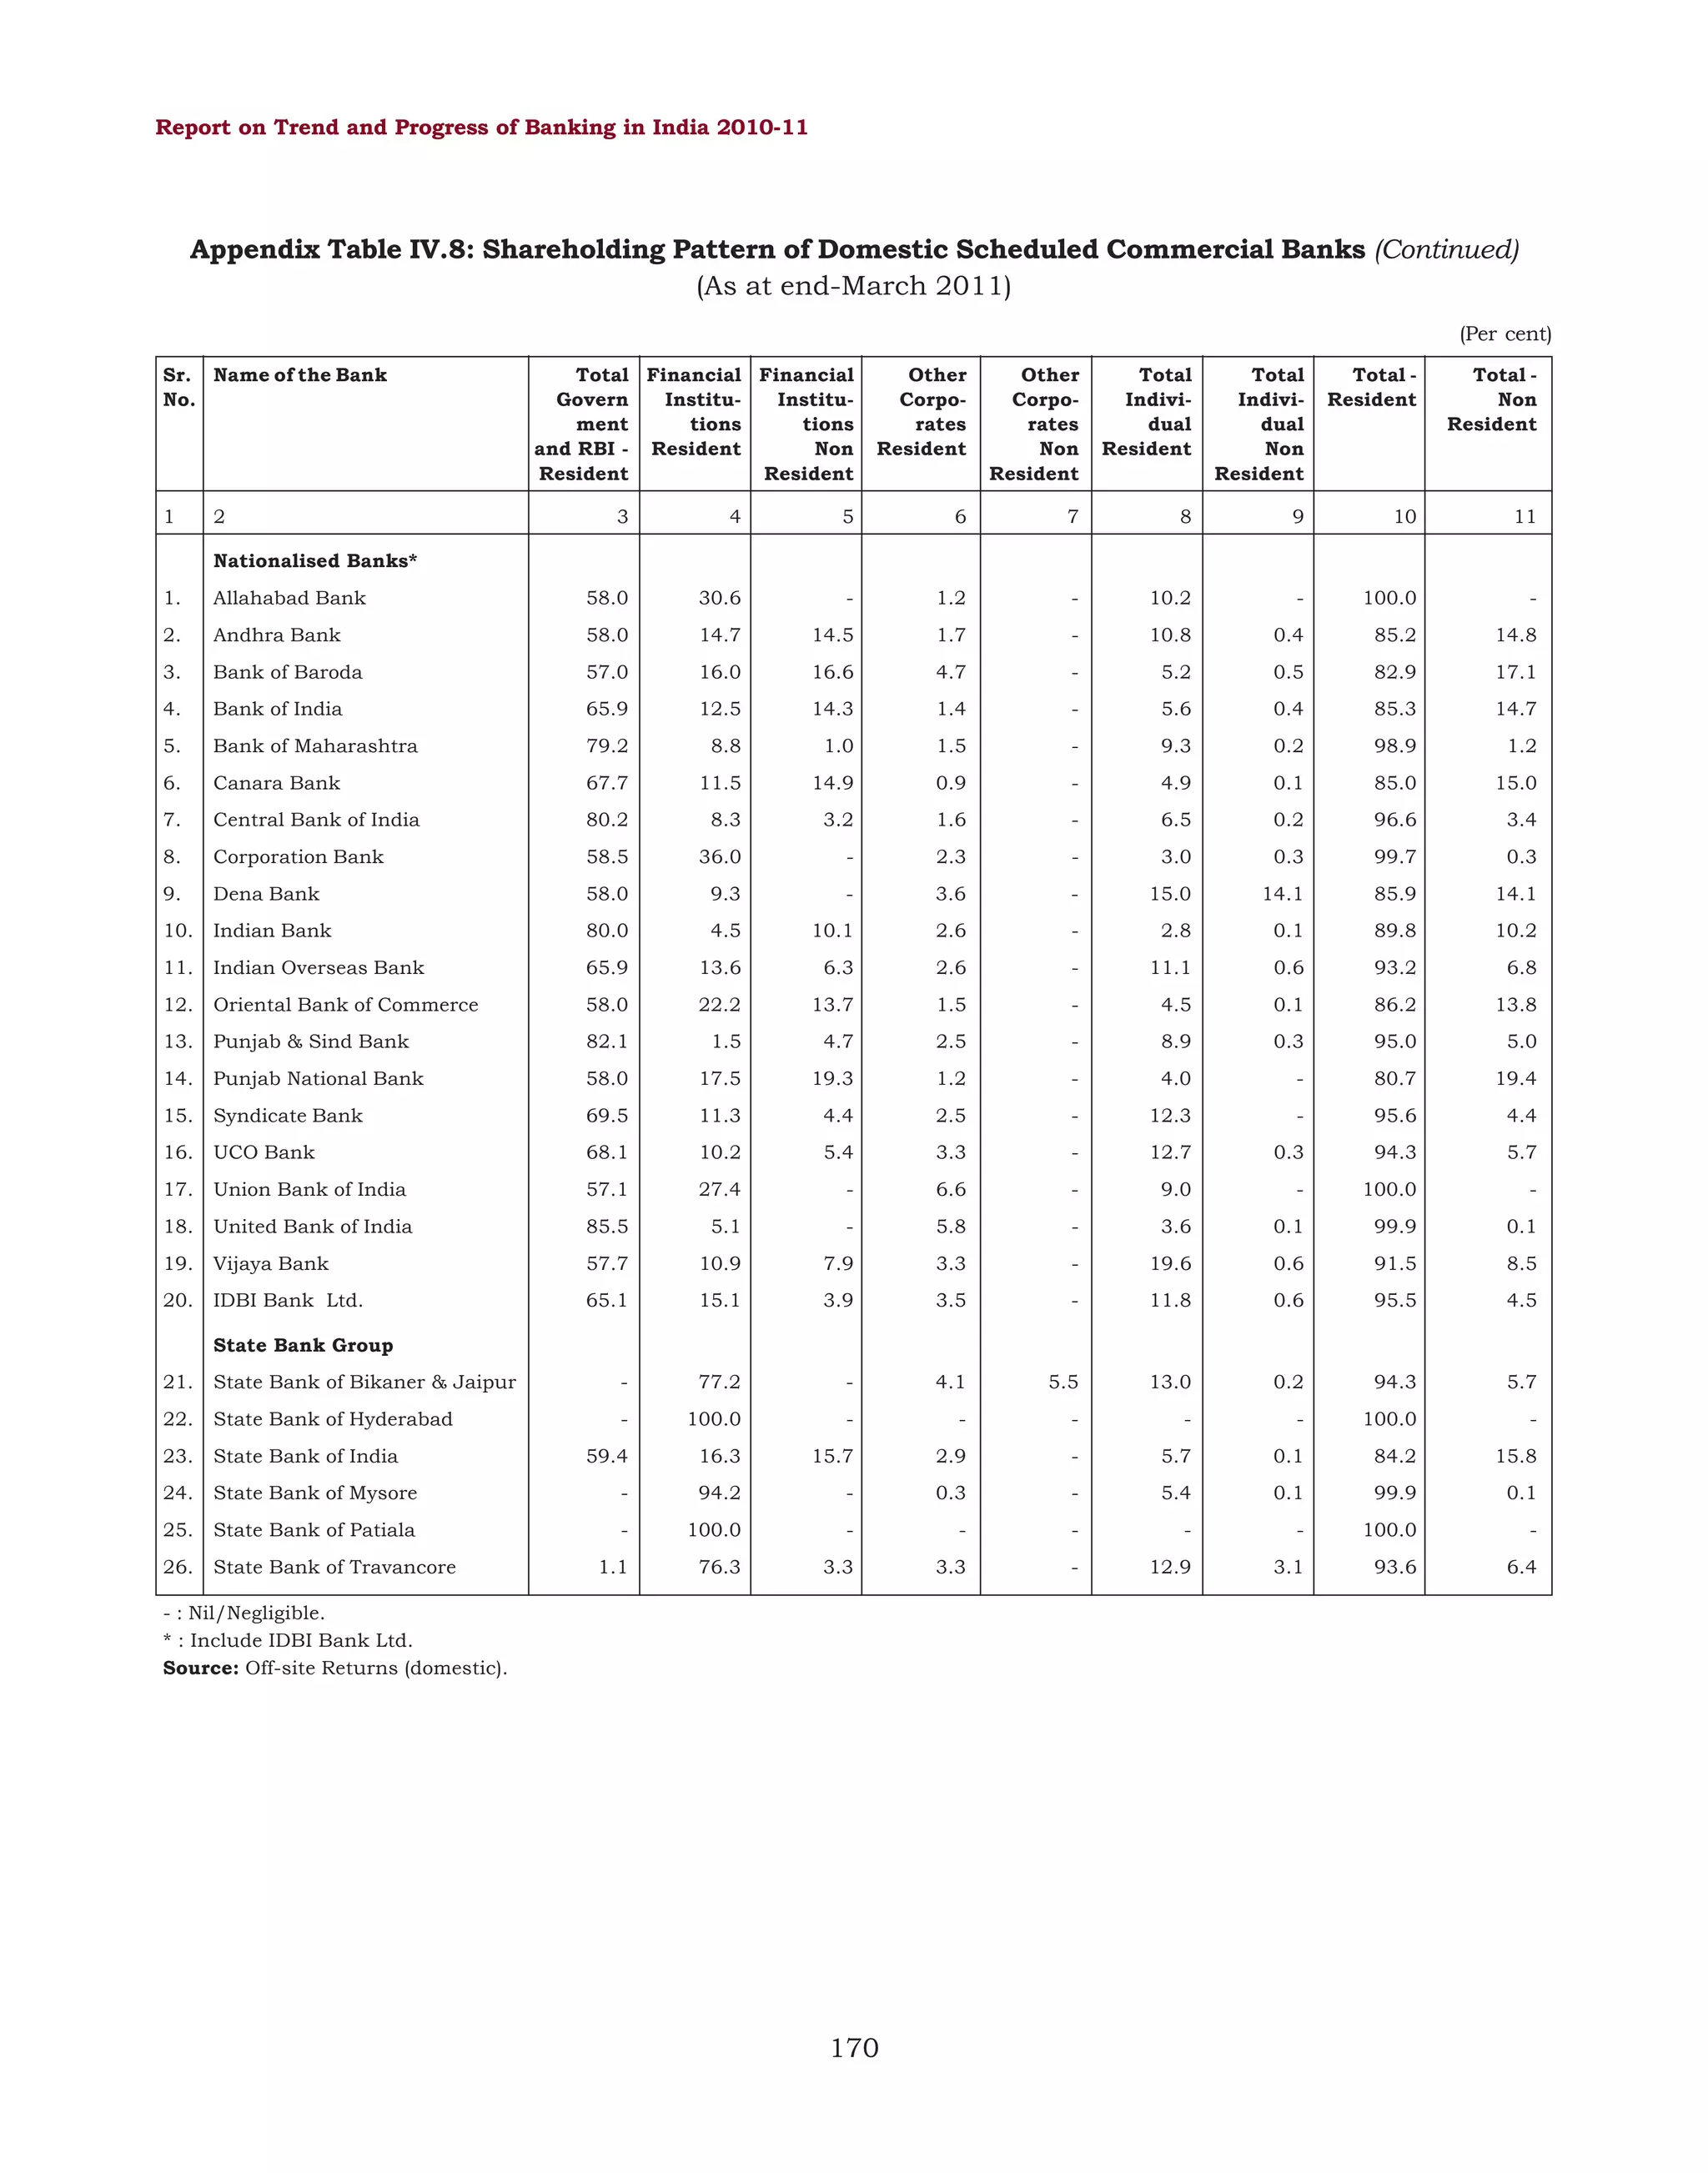
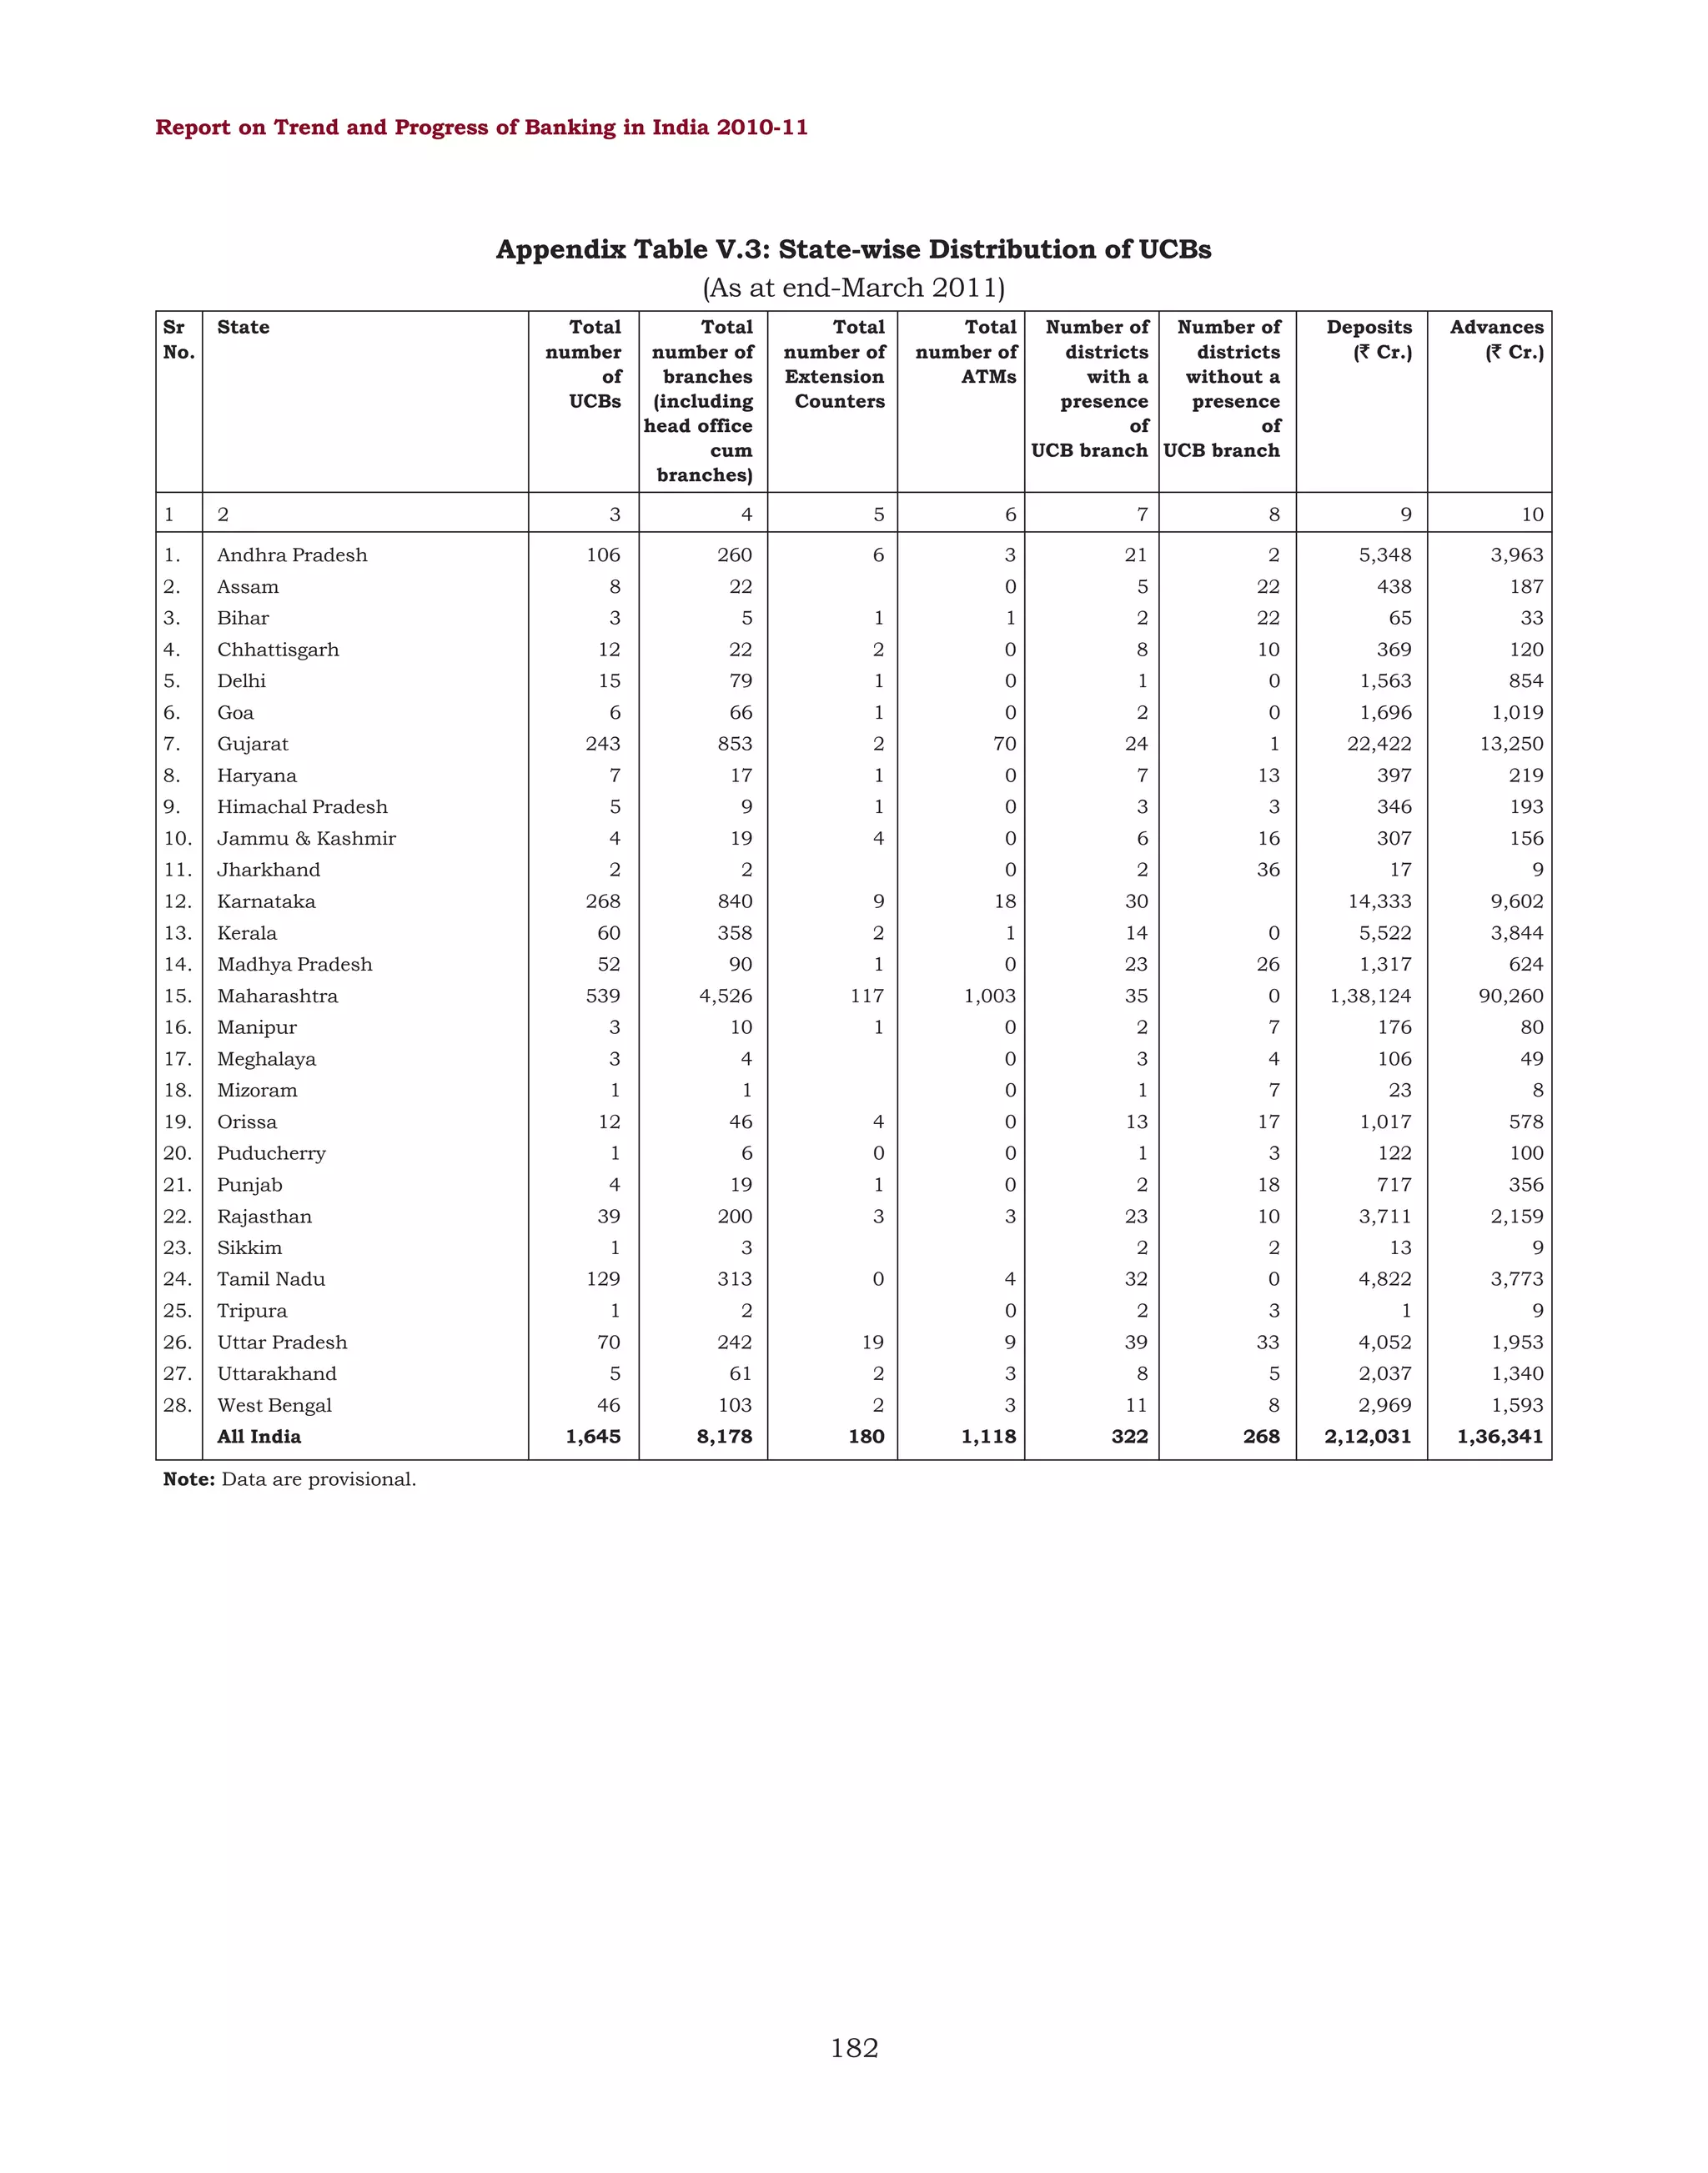
![Report on Trend and Progress of Banking in India 2010-11
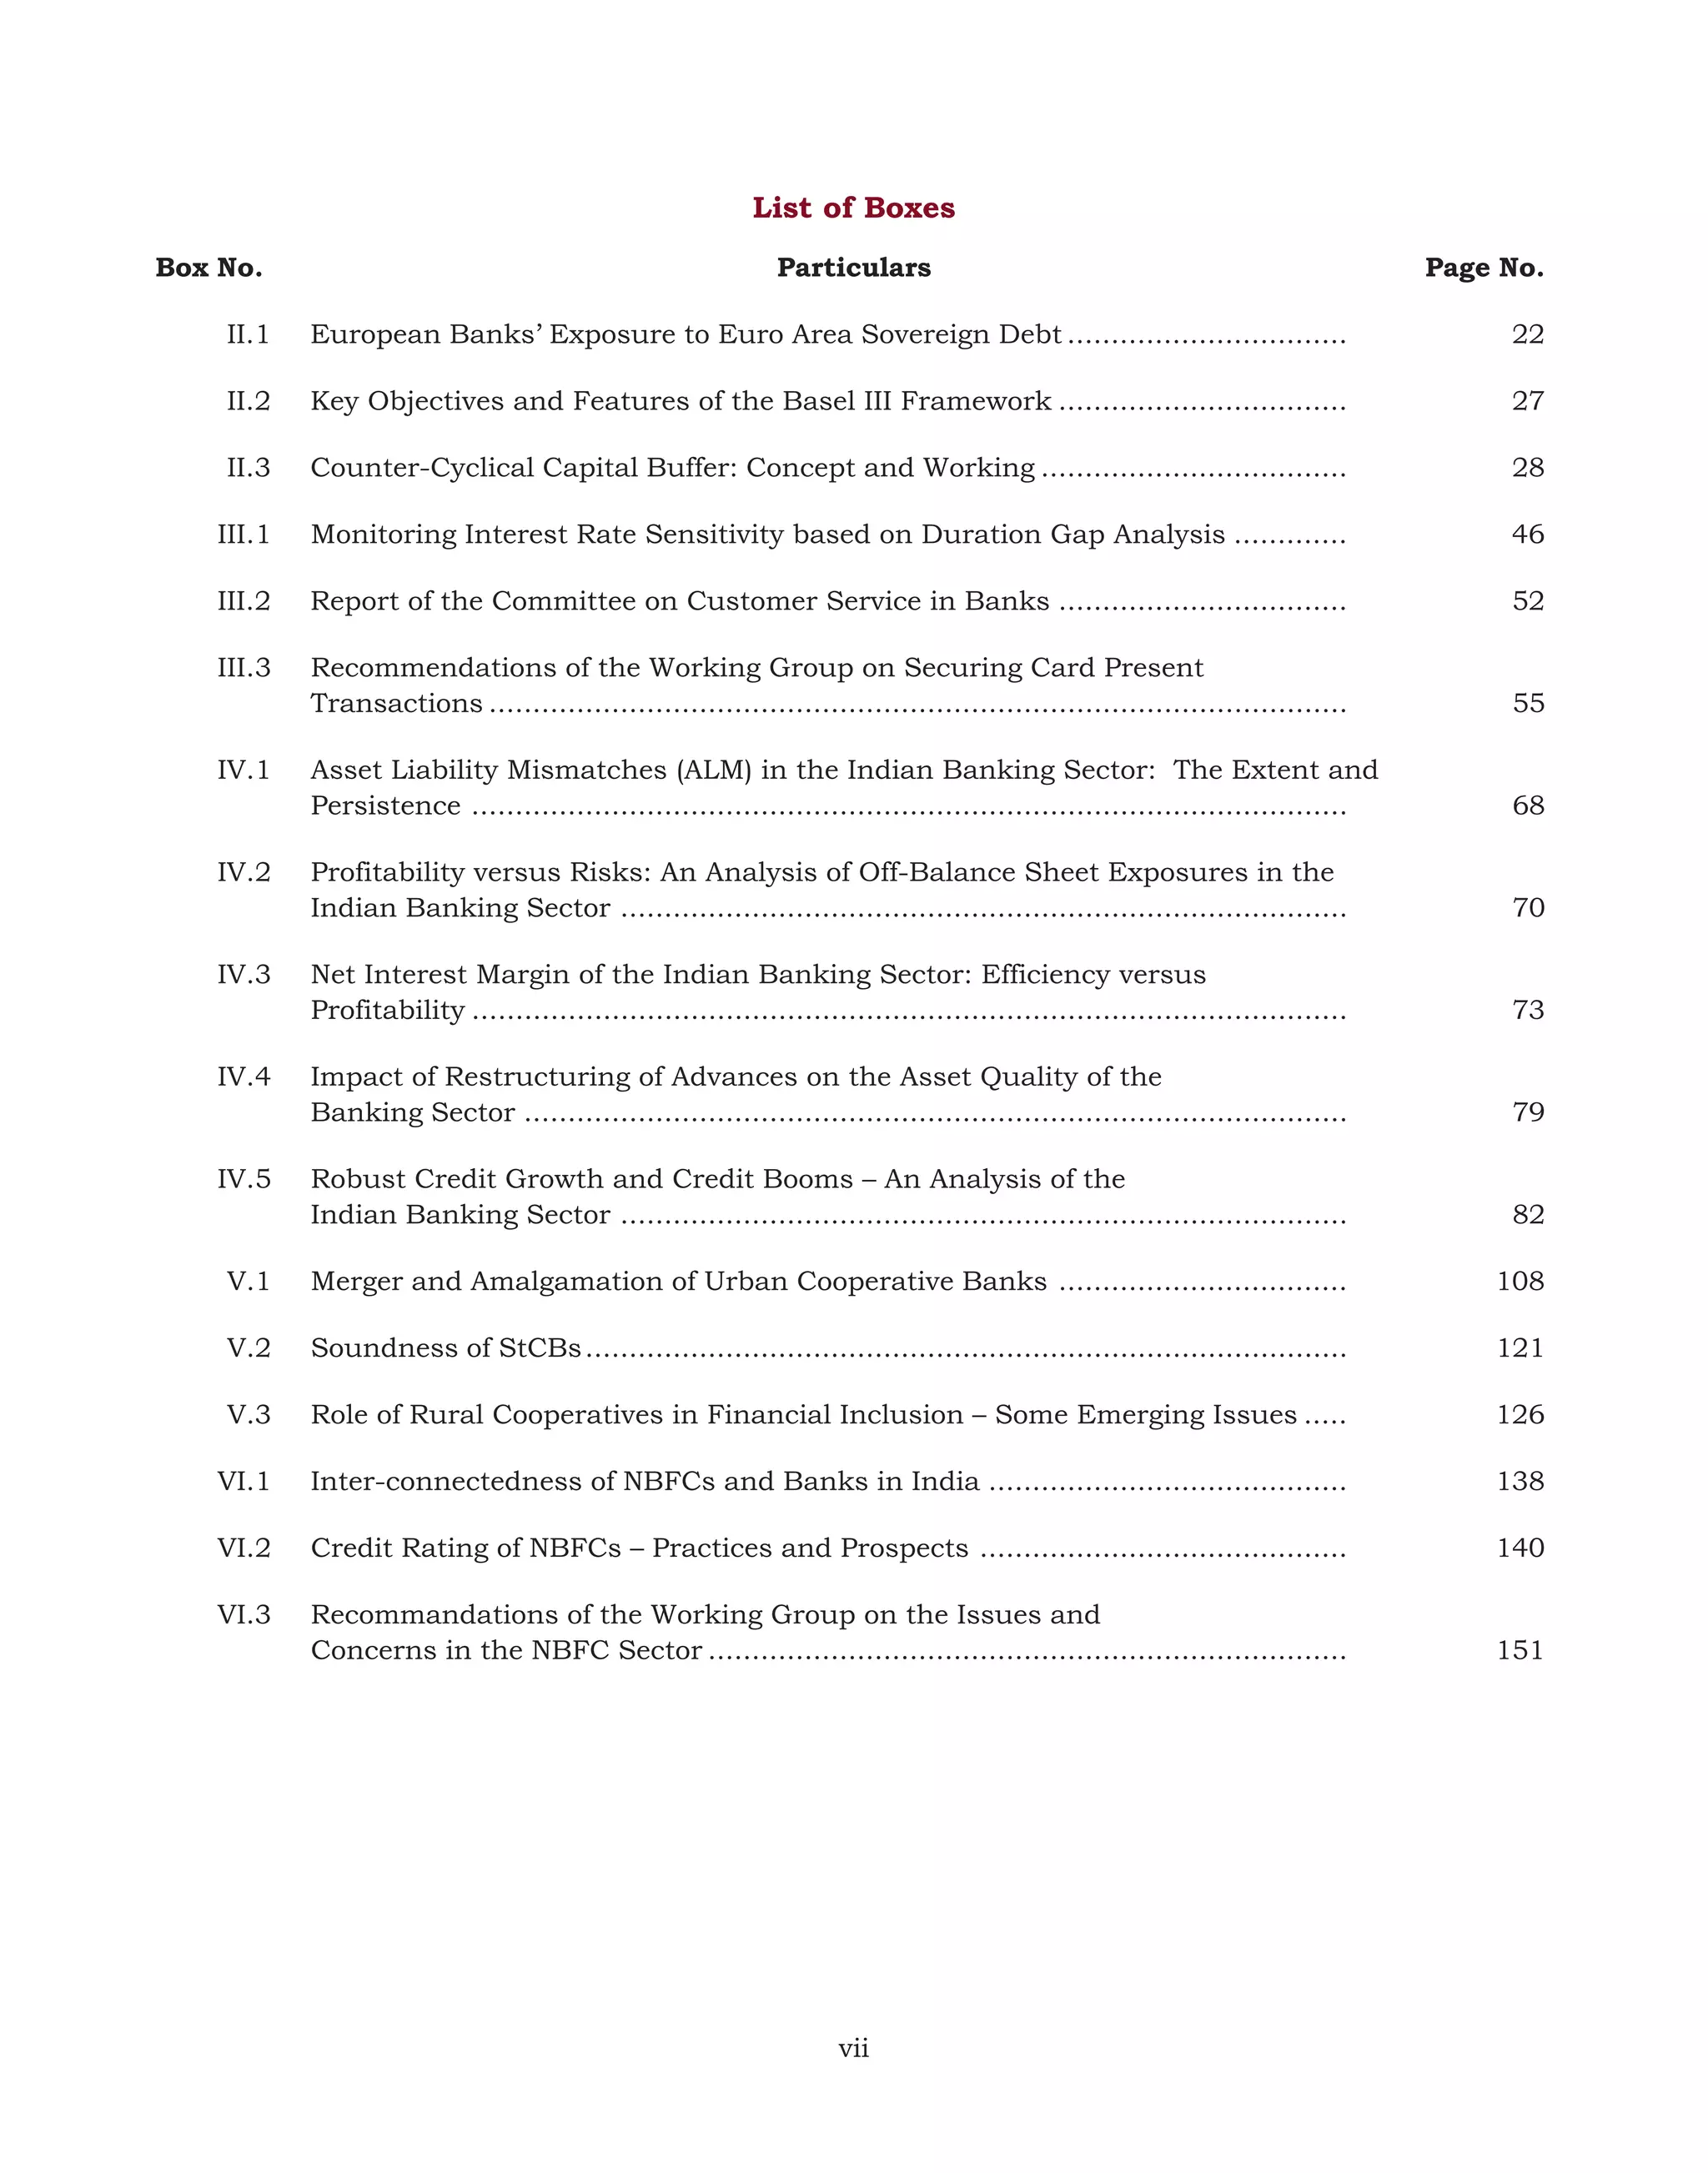
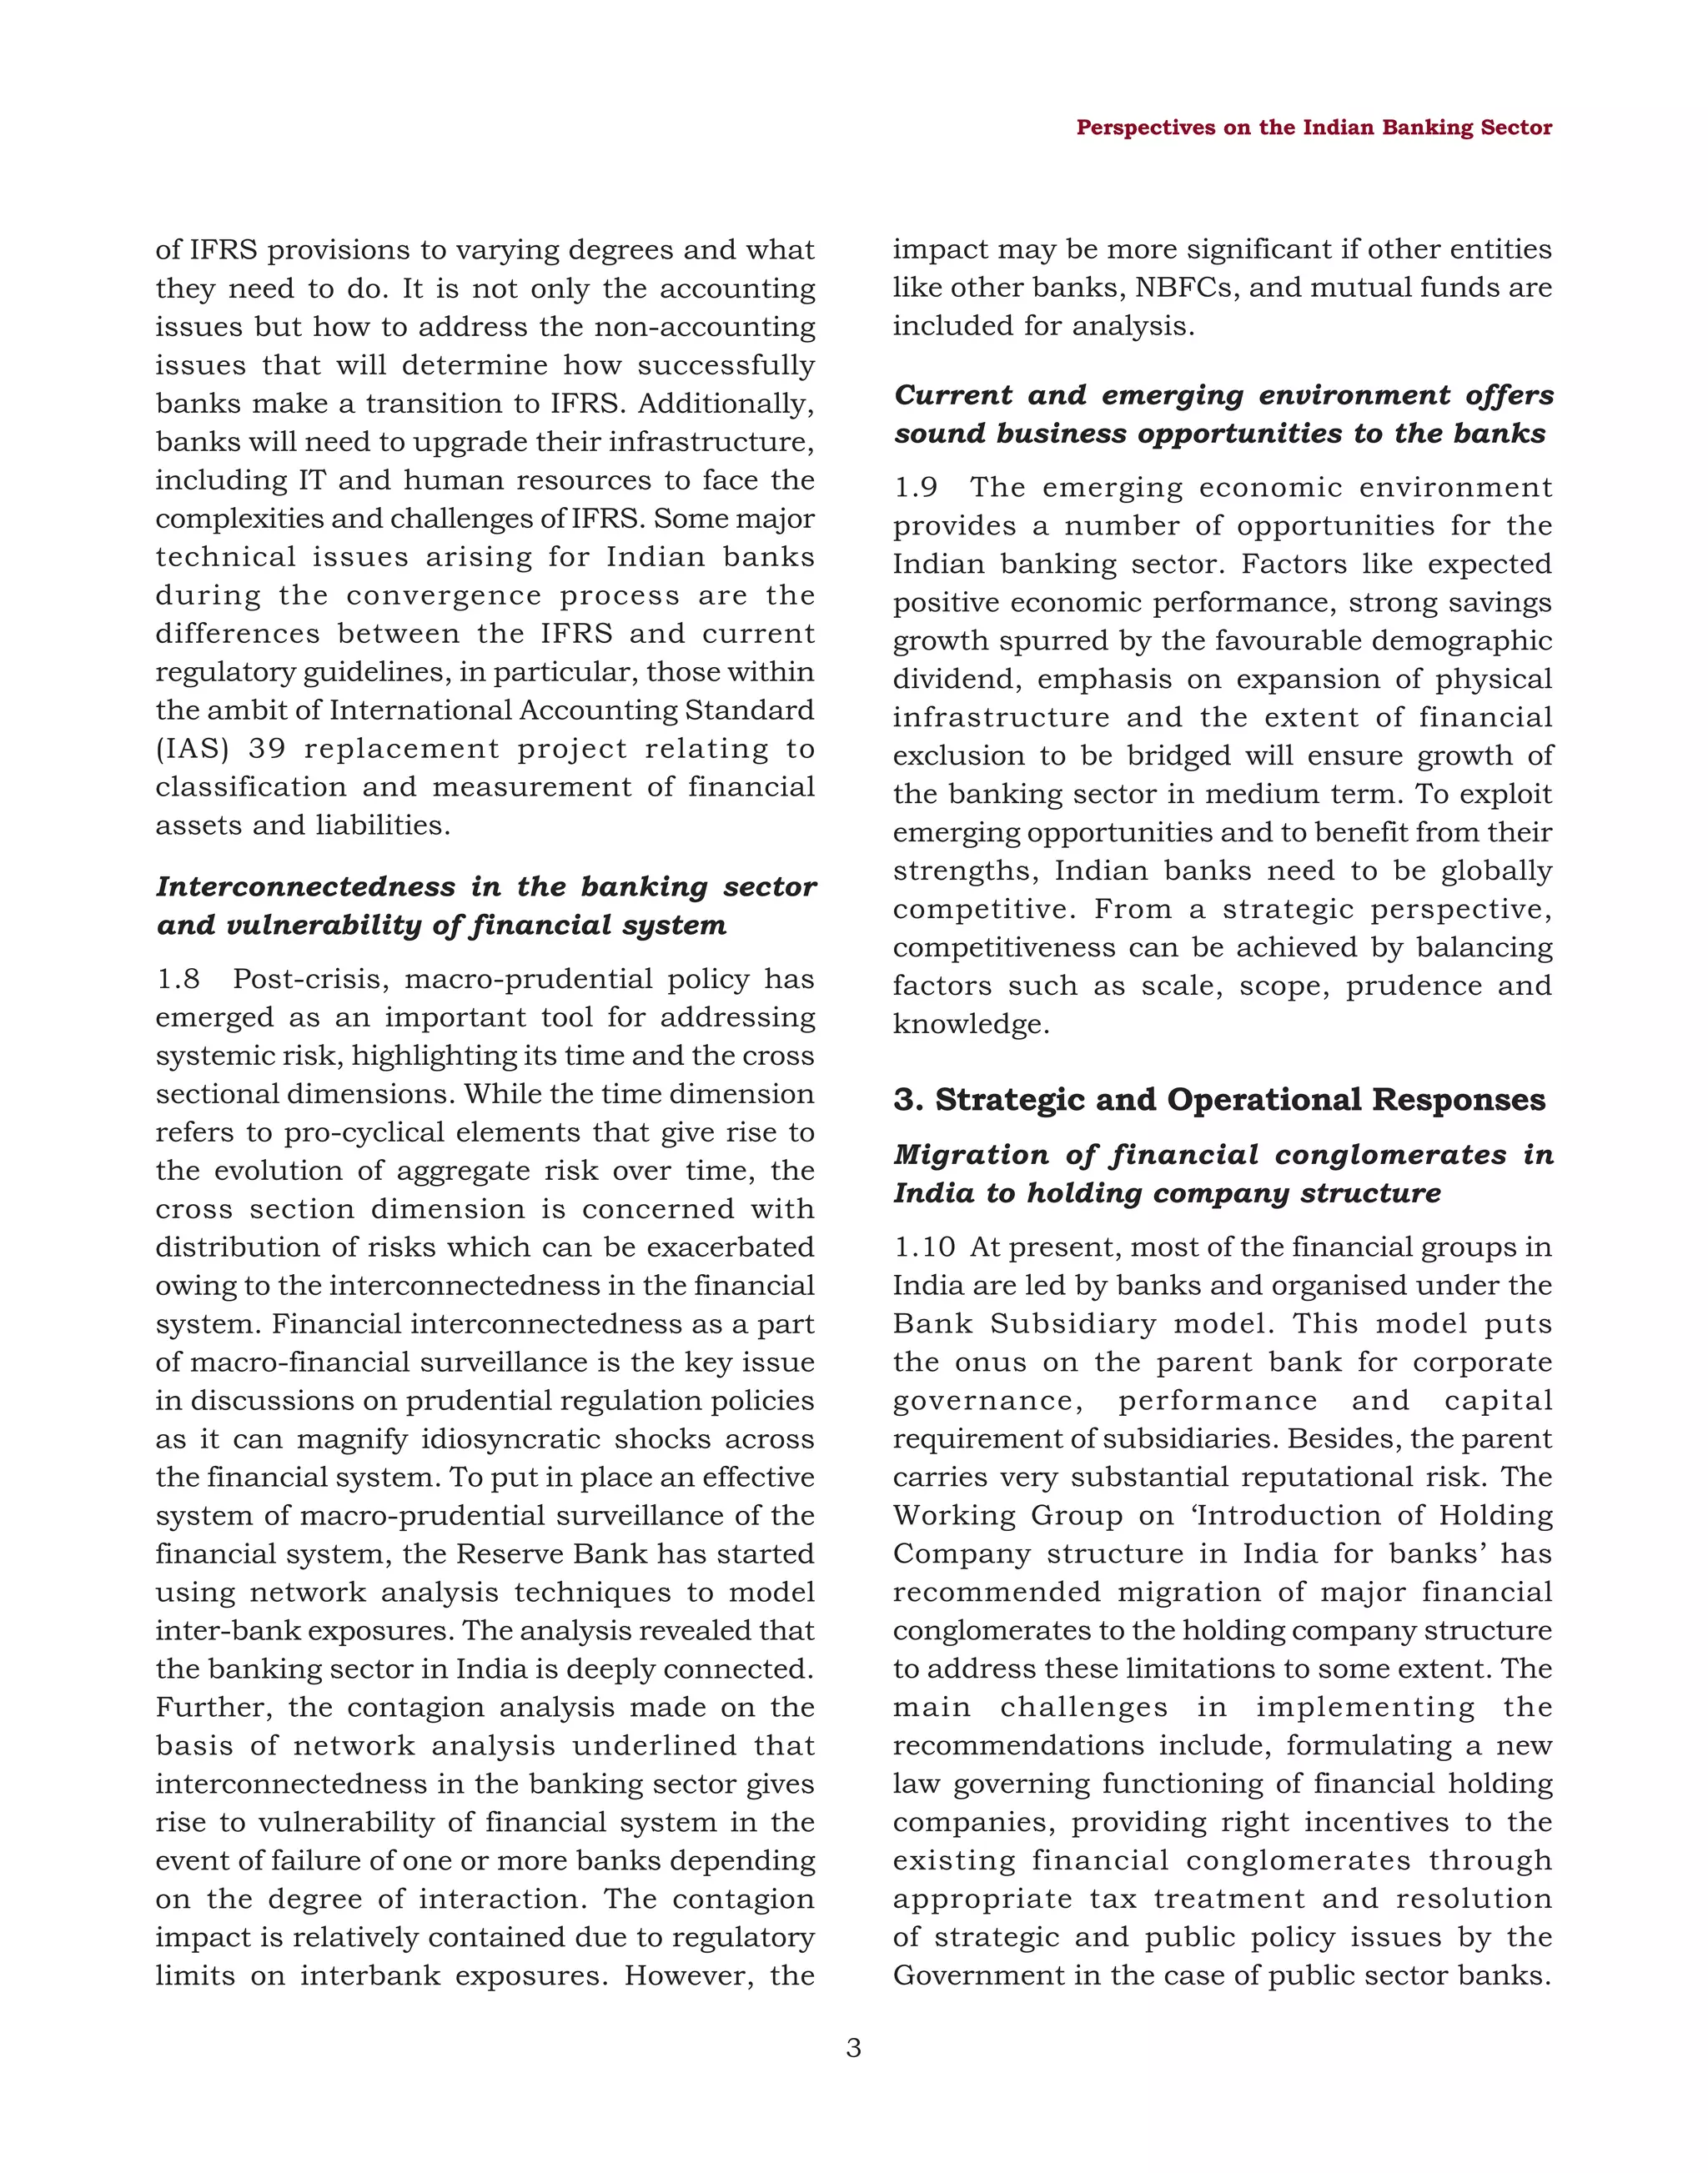
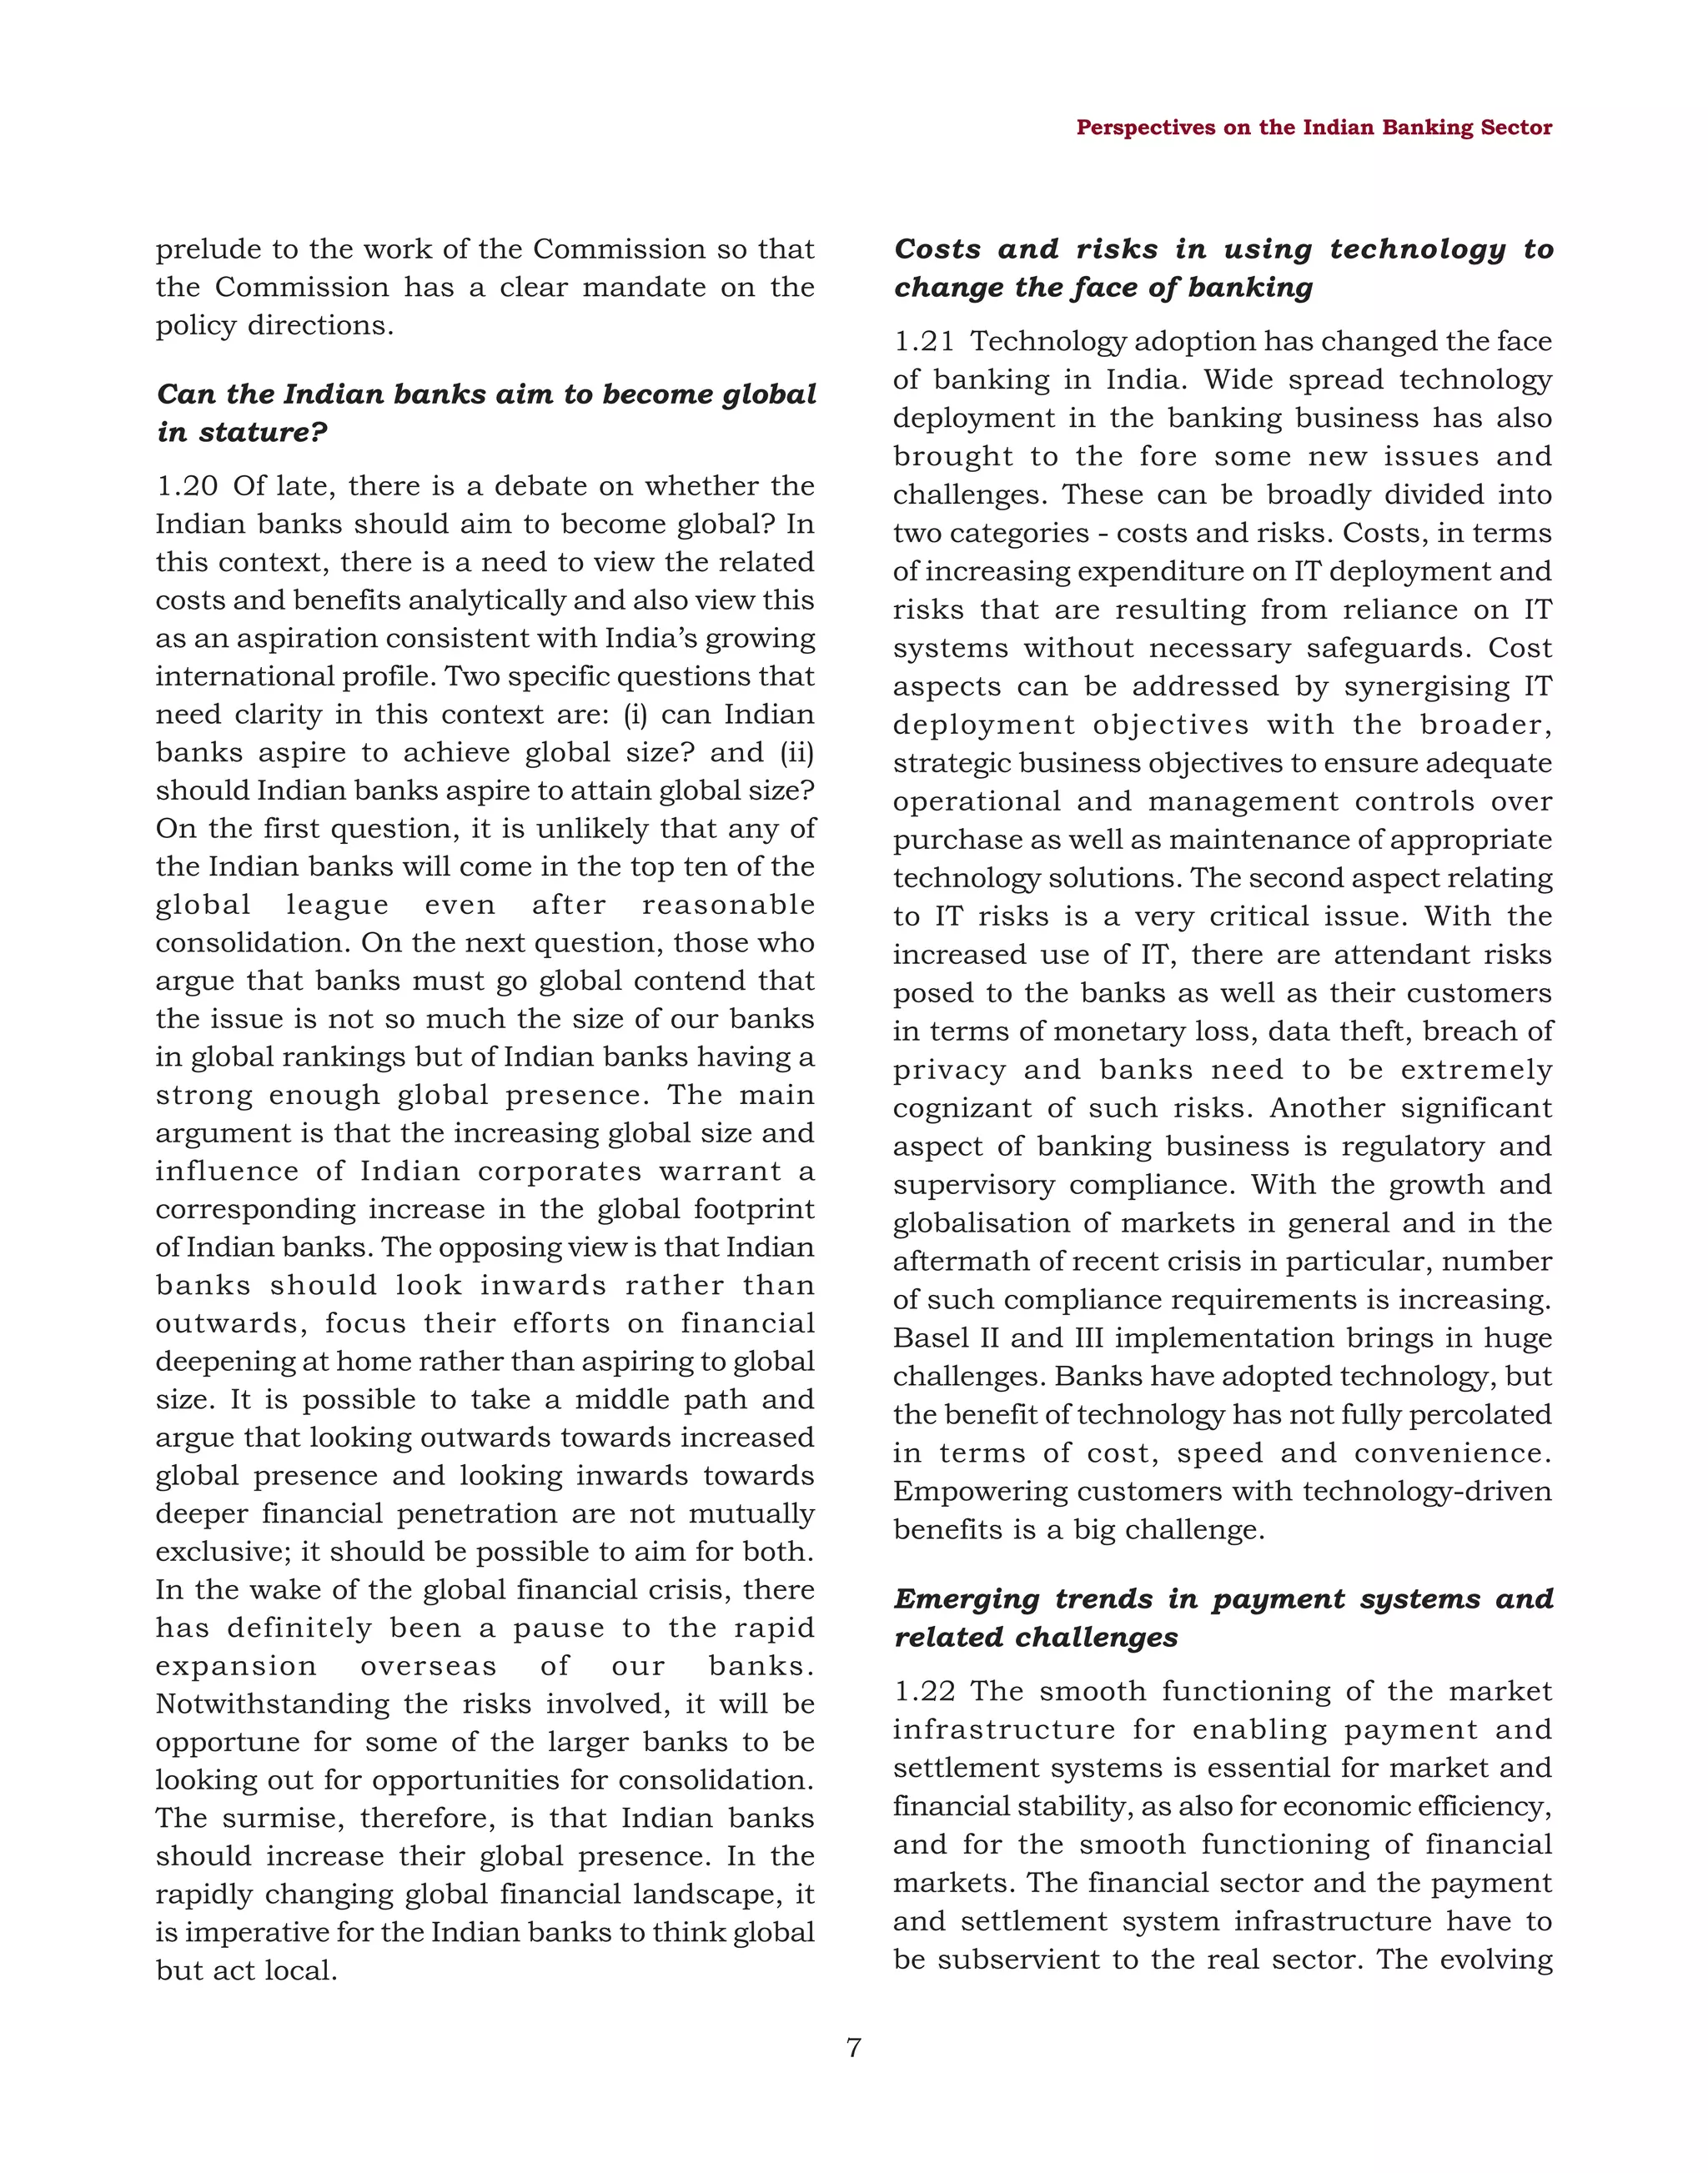
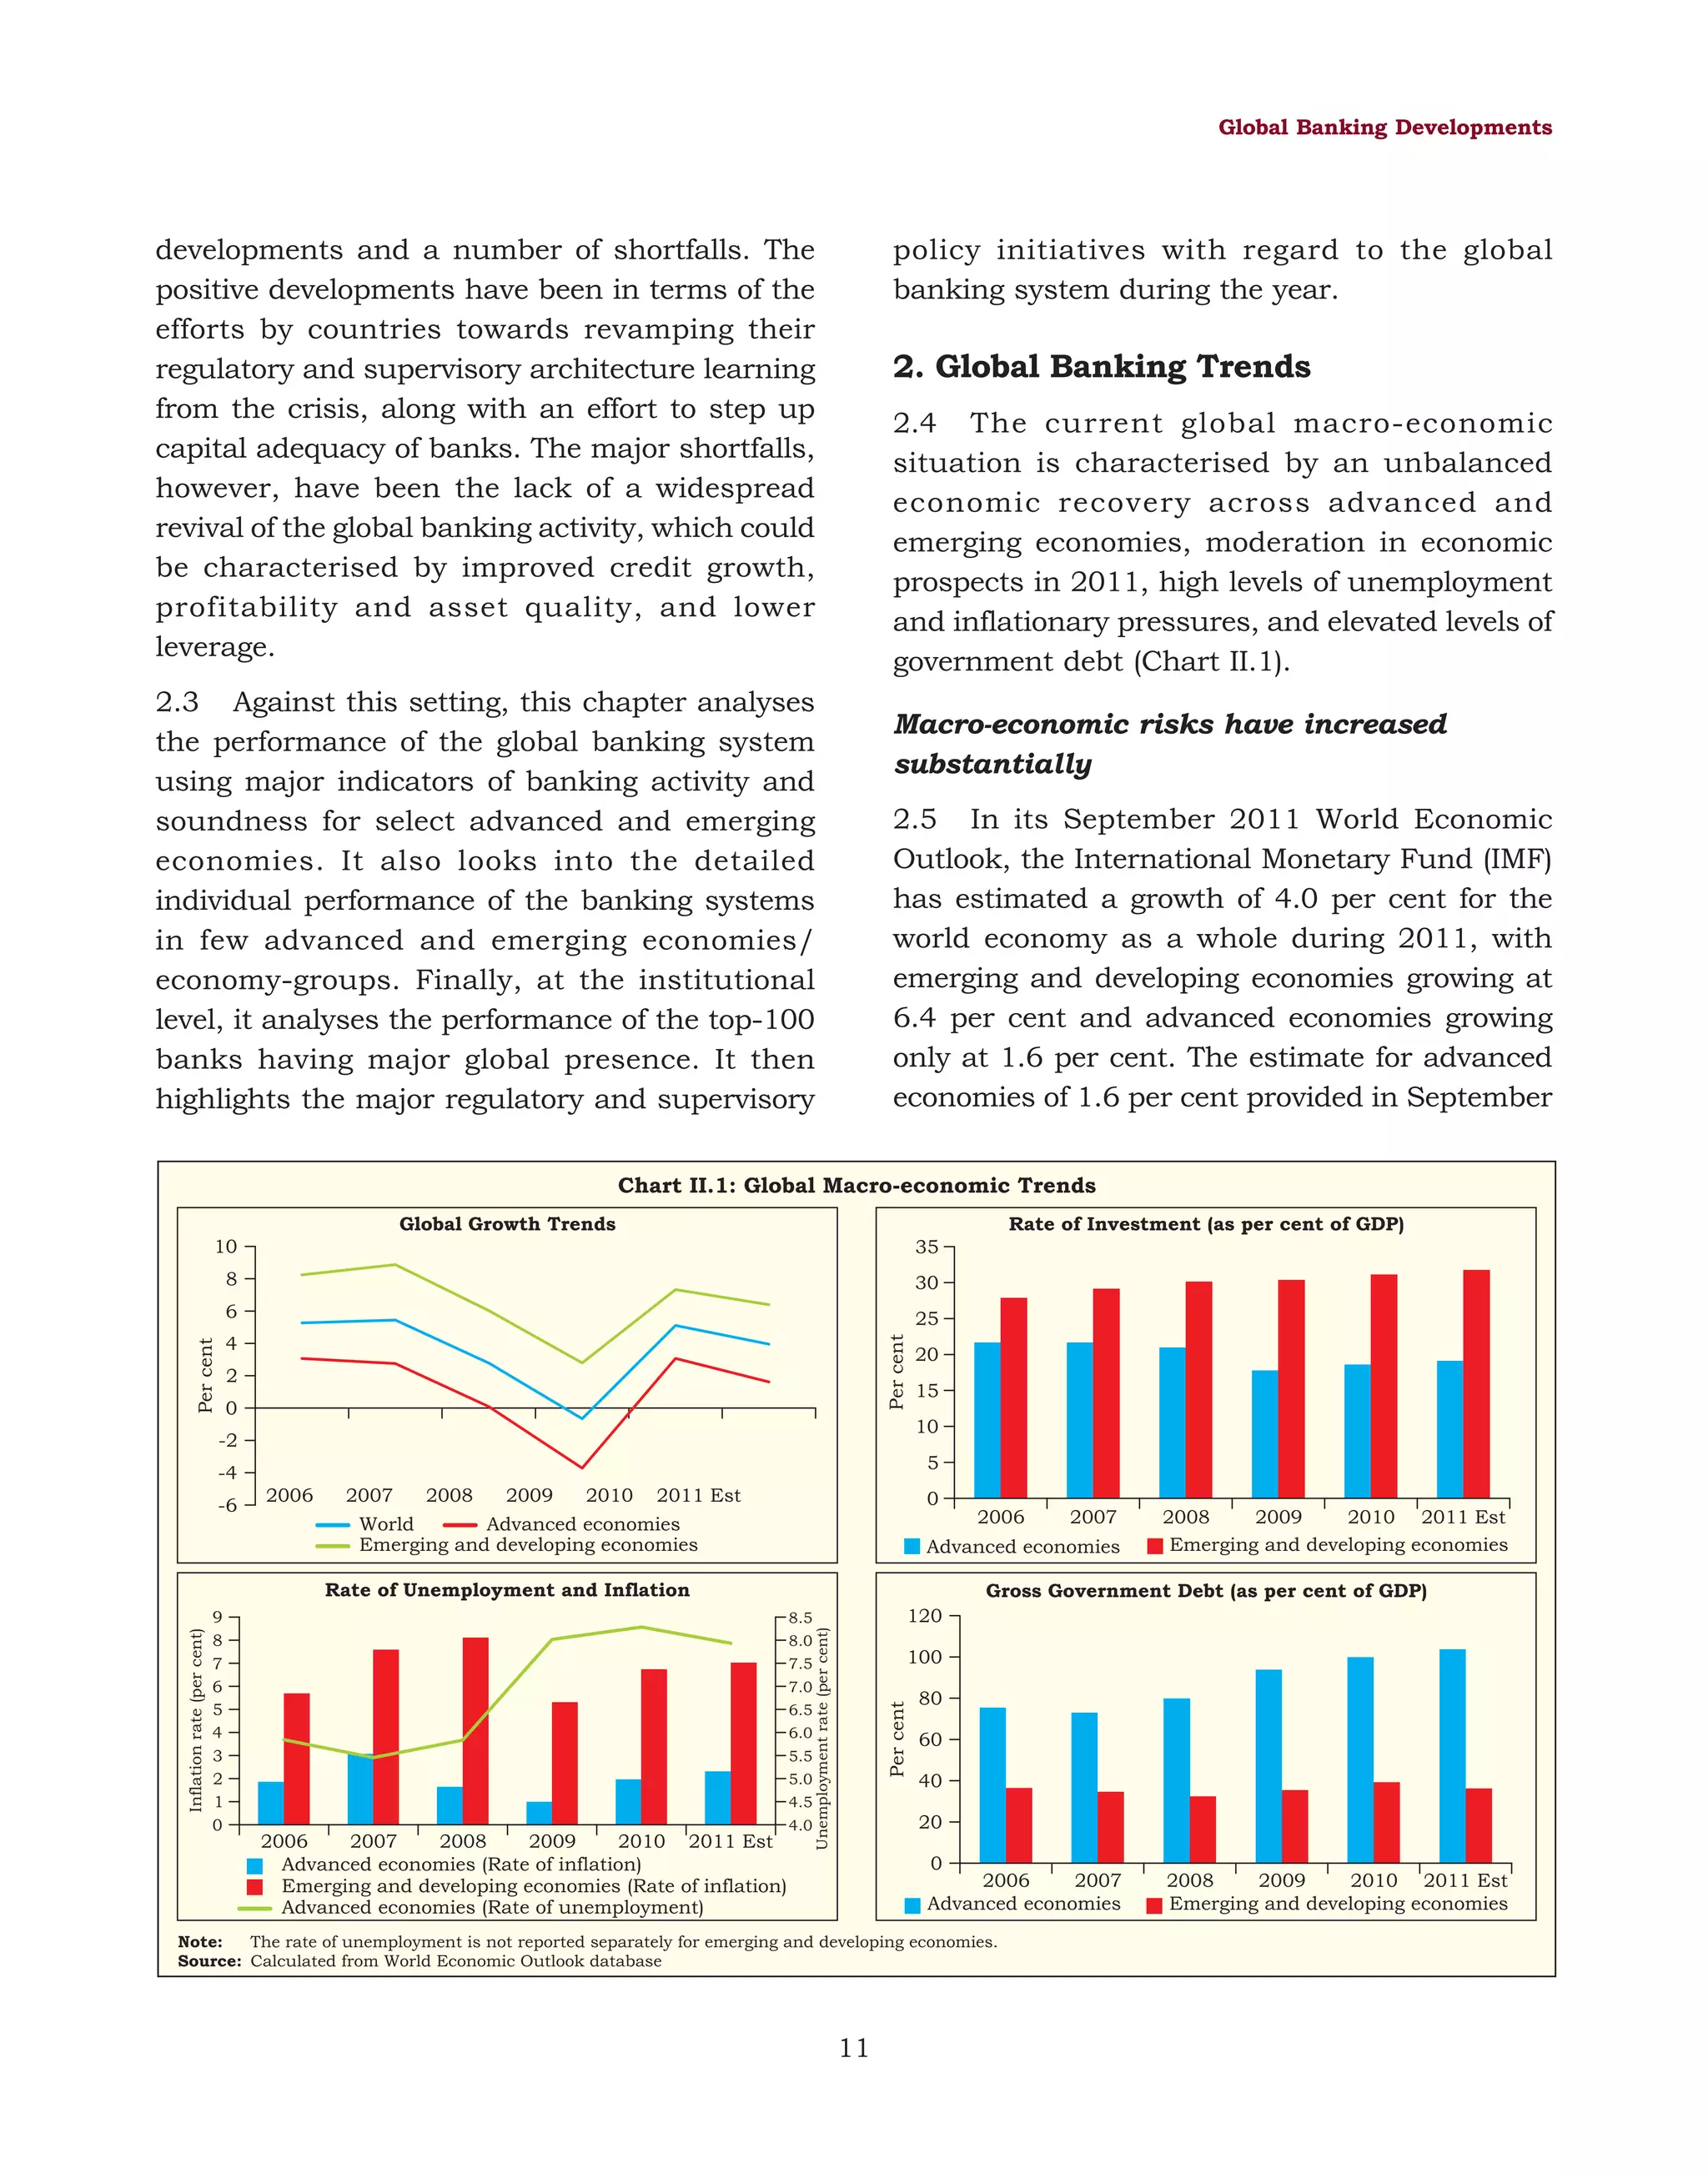
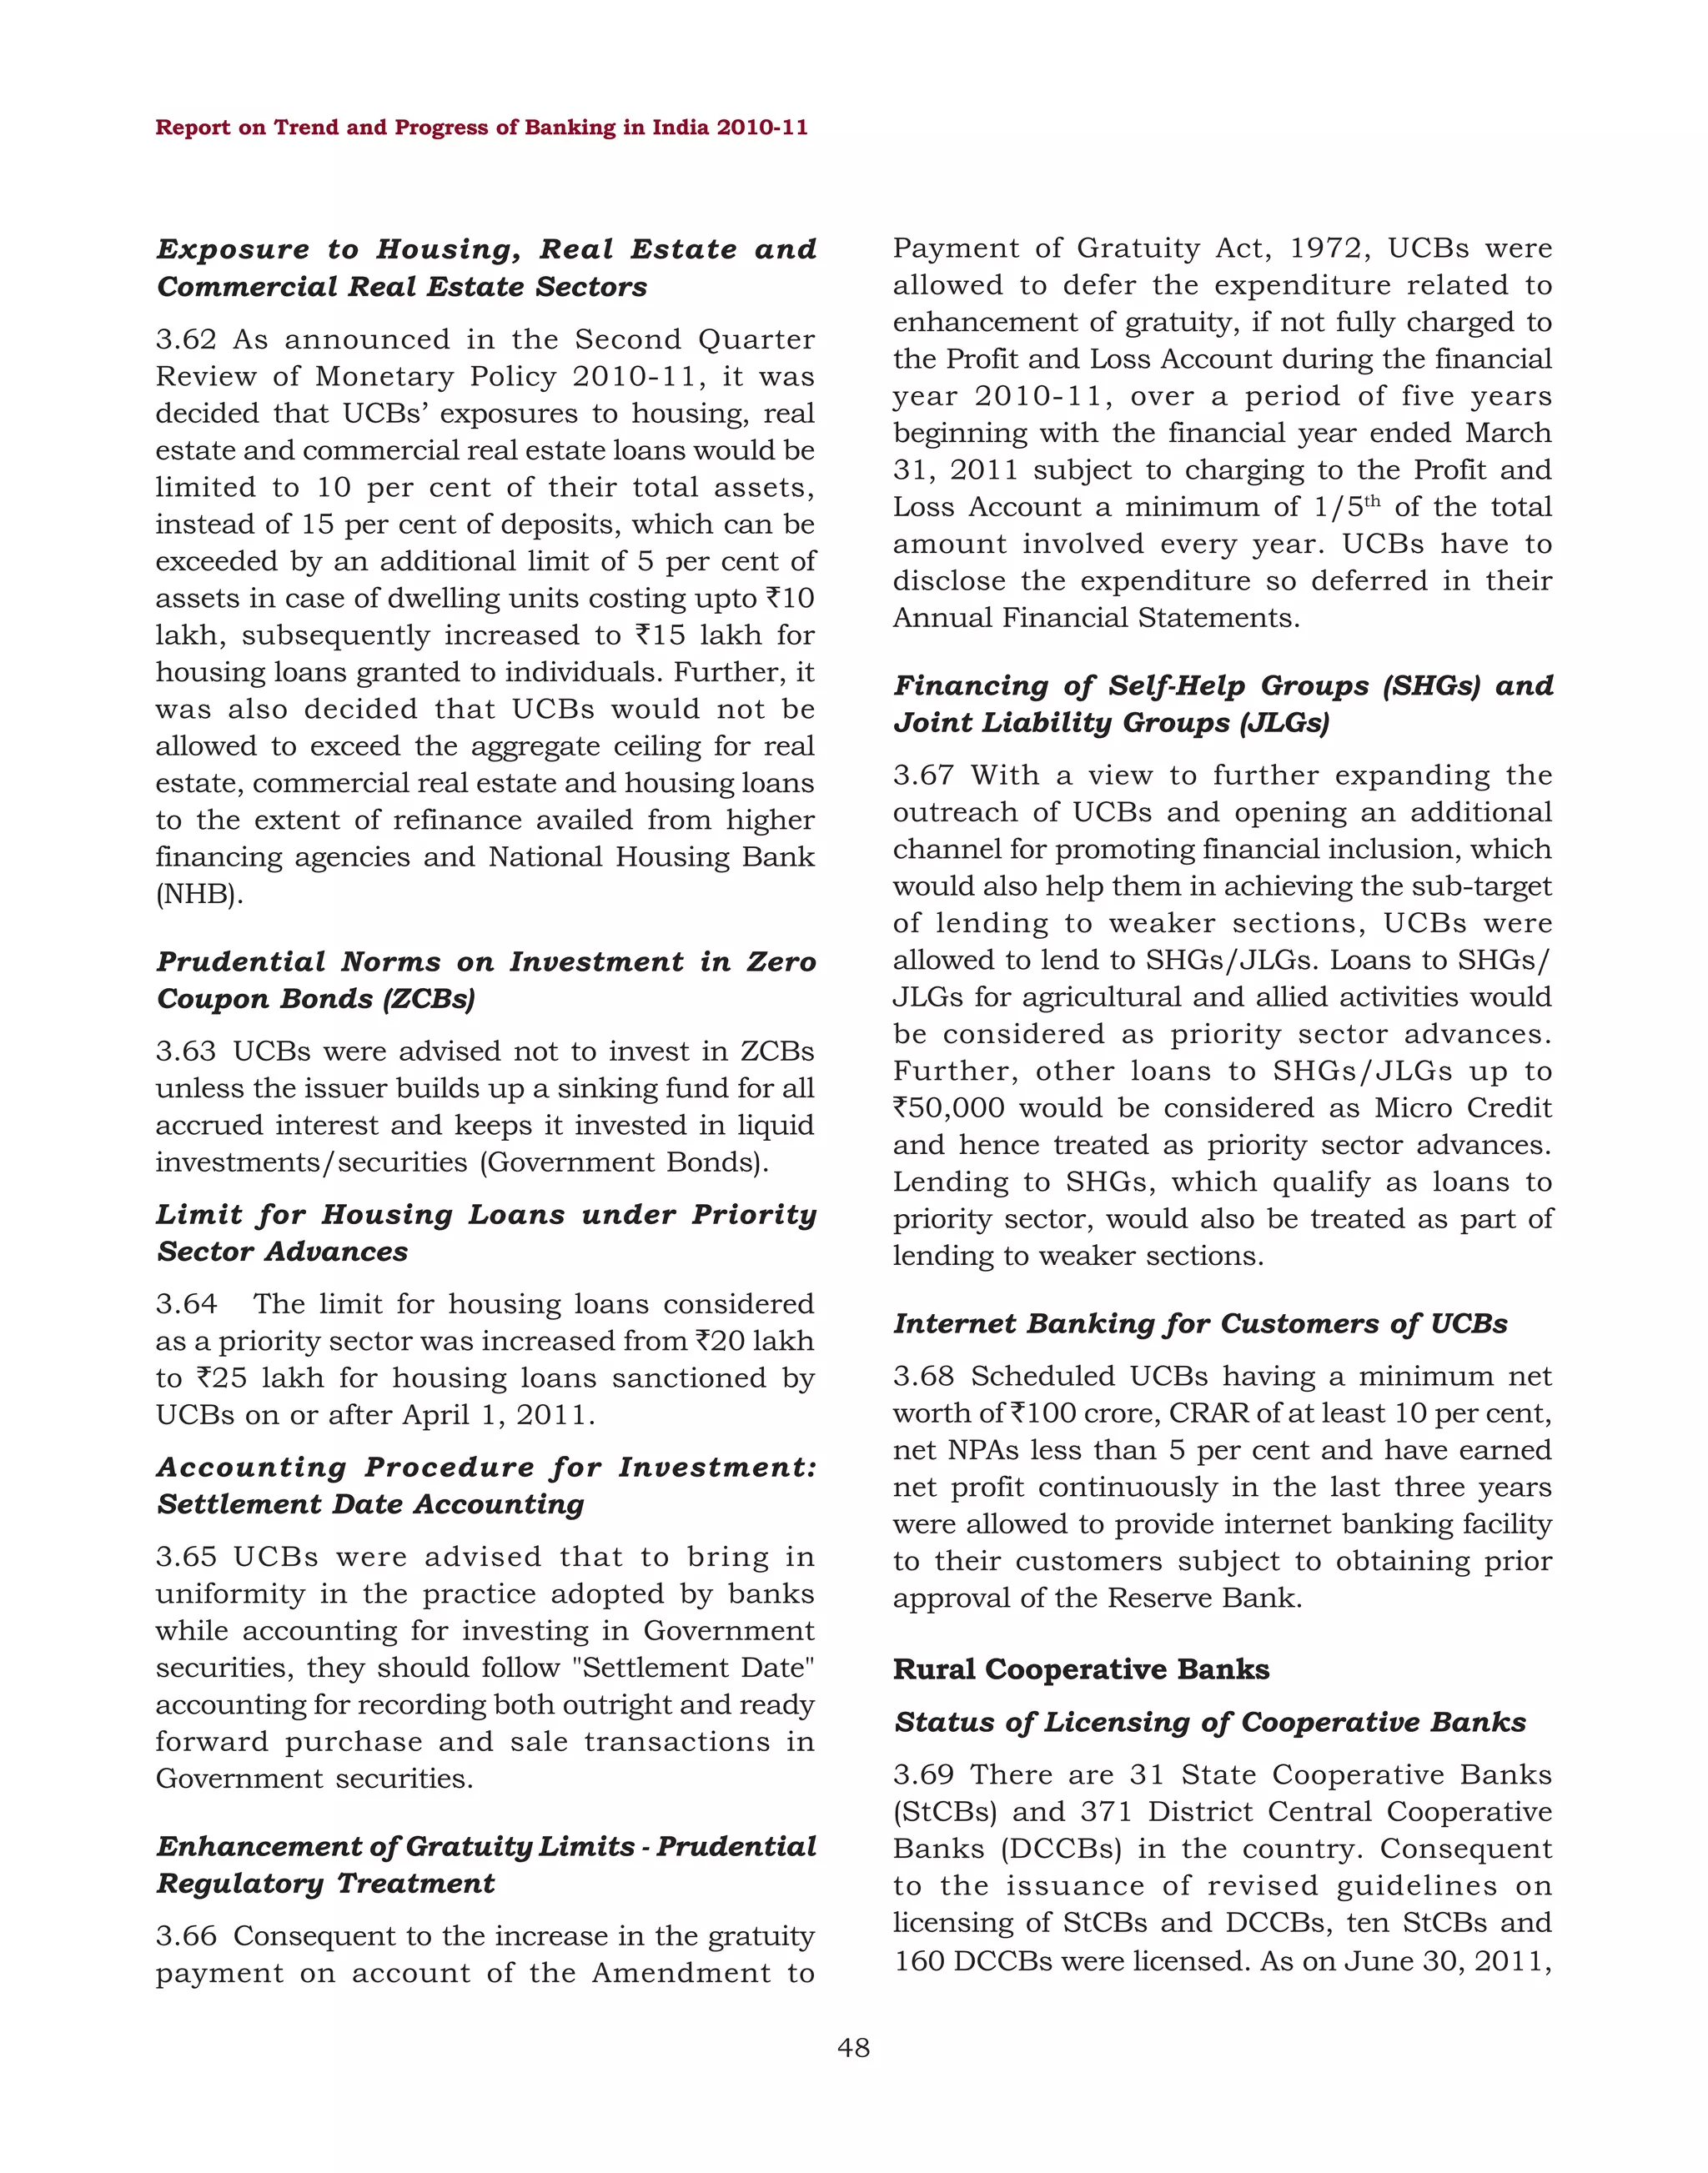
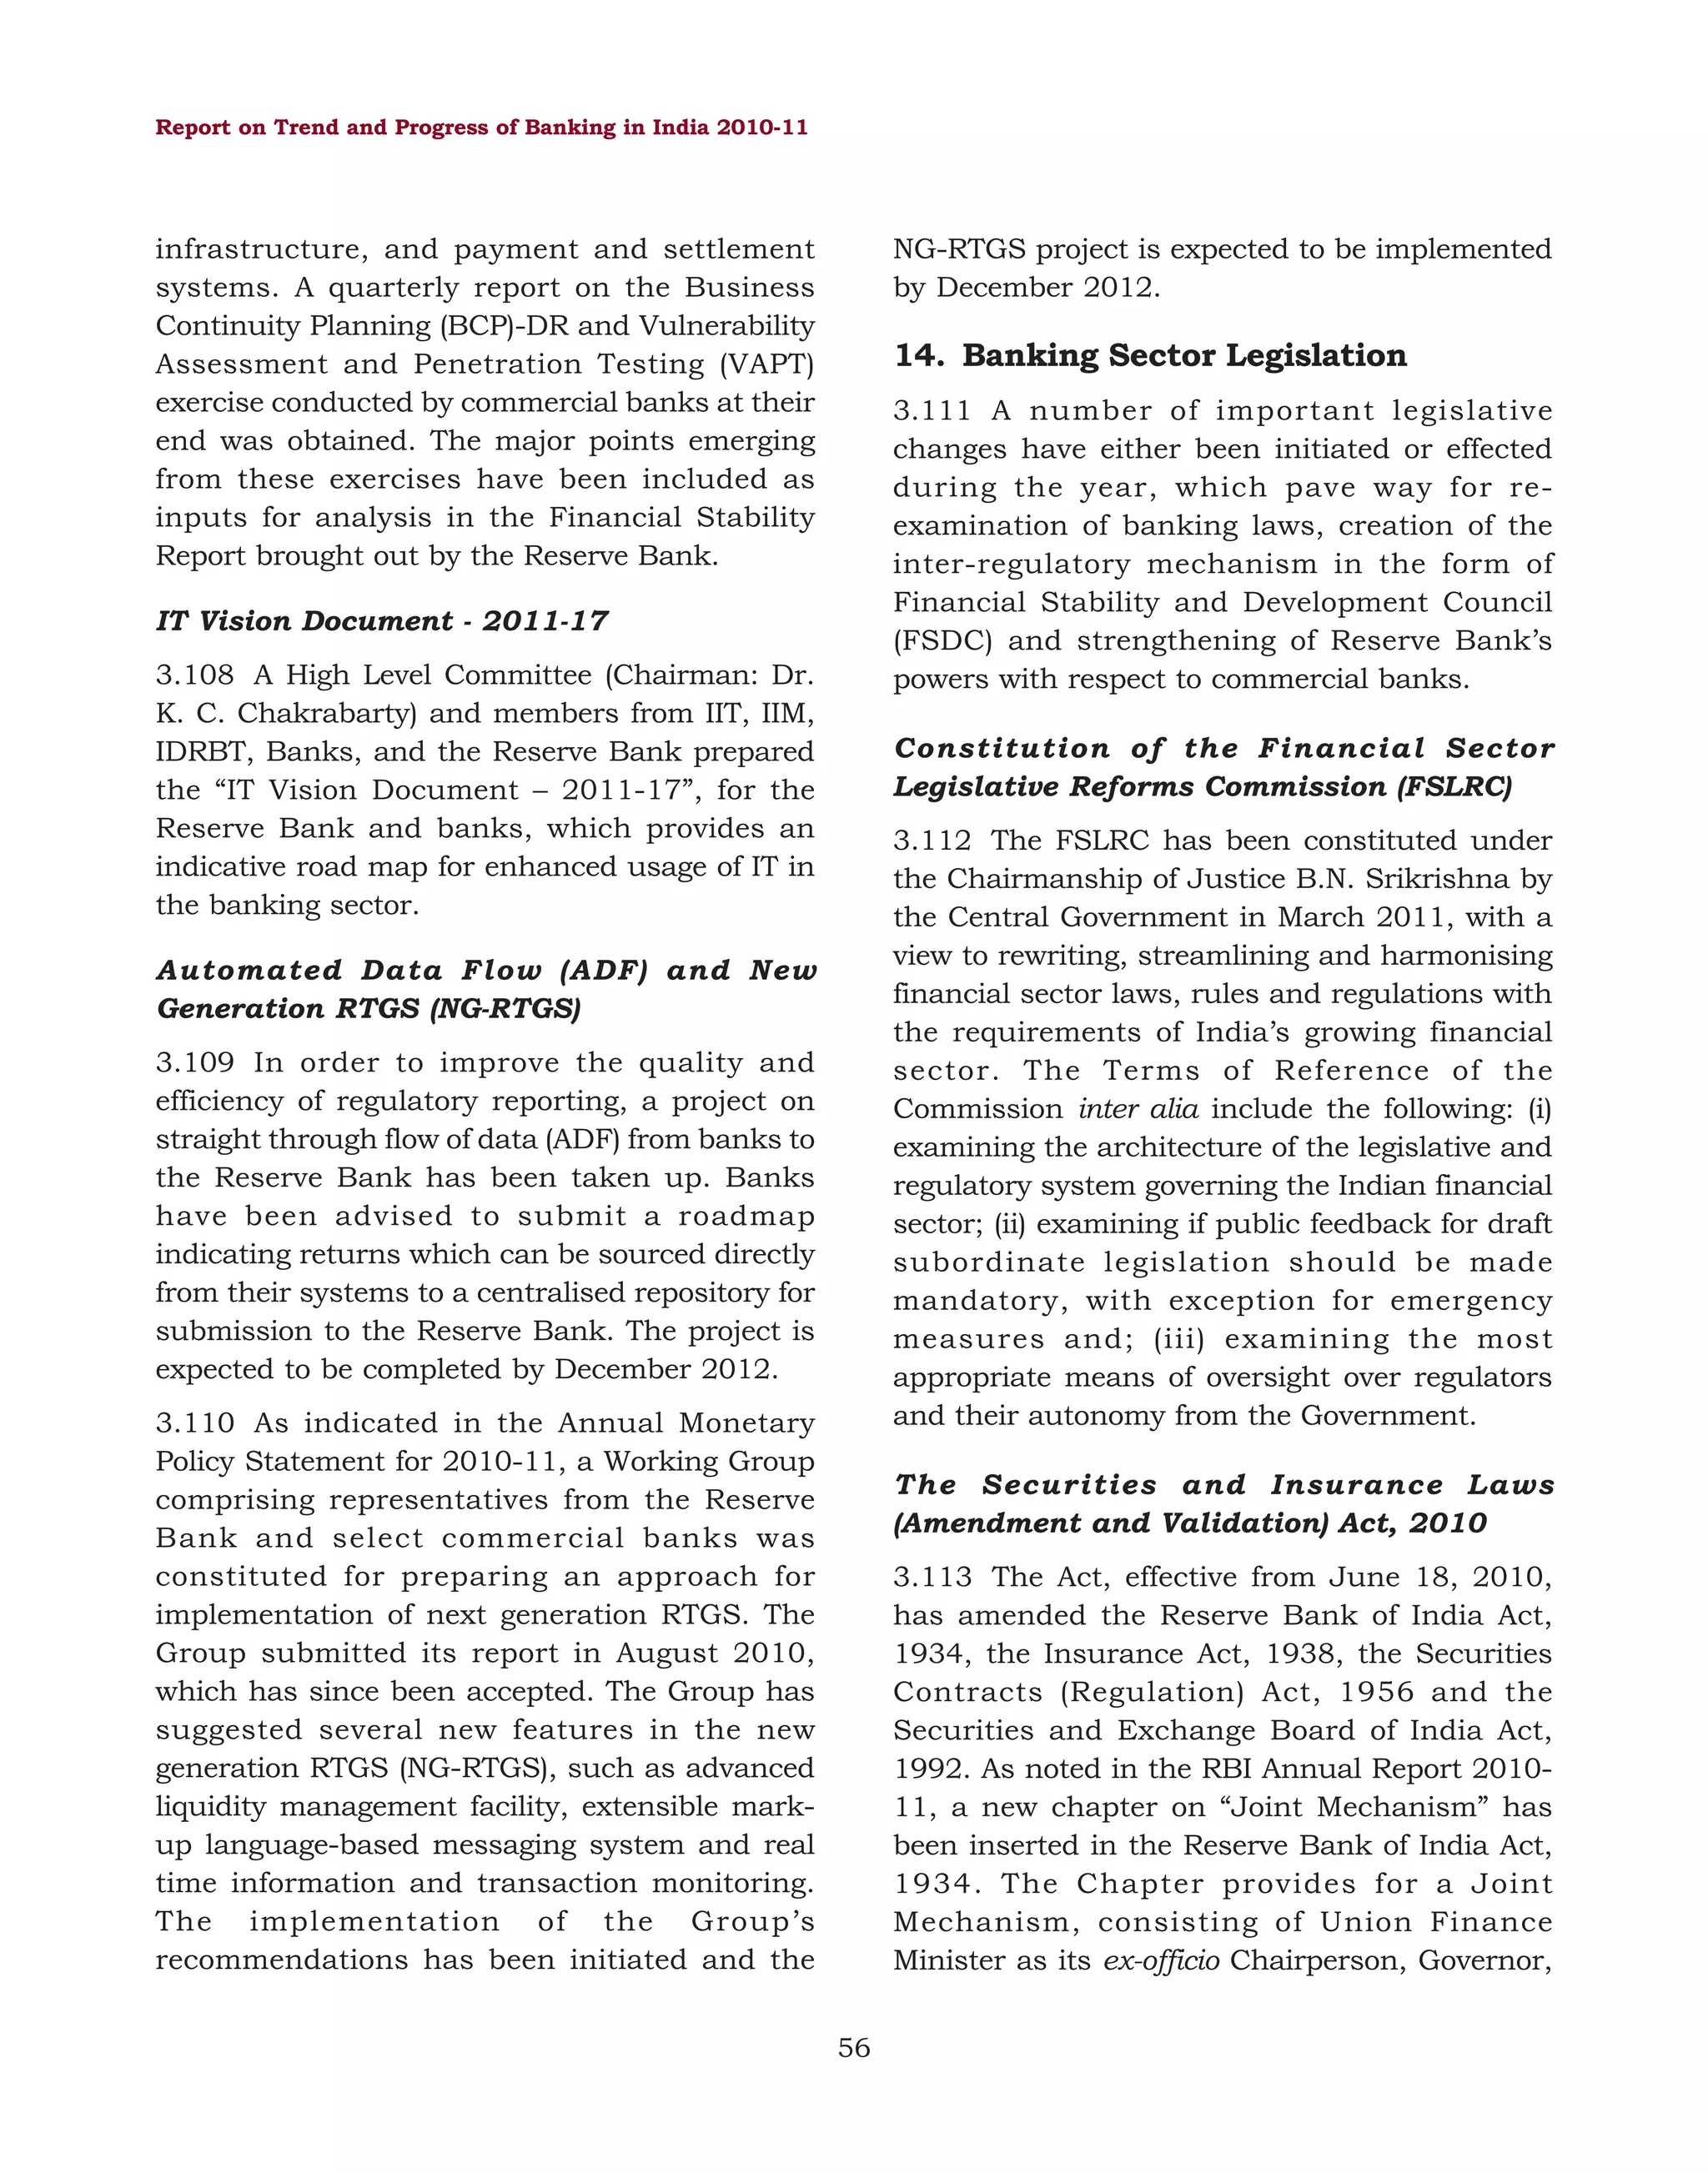
Box VI.2: Credit Rating of NBFCs – Practices and Prospects
as well, and being so it could be more volatile or difficult to
predict.
Non-Banking Finance Companies (NBFCs) being
heterogeneous in their operations, they are broadly grouped
under four heads (i) asset finance companies, (ii) loan
companies, (iii) investment companies, and (iv) infrastructure
finance companies for regulatory compliance by the Reserve
Bank. Credit rating for deposit taking NBFCs was
recommended by ‘Working Group on Financial Companies
(Chairman: A. C. Shah) in 1992. However, it was in January
1998 that the new regulatory framework for NBFCs by the
Reserve Bank made it mandatory for NBFCs to get rated in
order to protect the interest of the retail depositors.
All ratings are kept under continuous monitoring throughout
the period of validity.
Regulatory Requirements for Credit Rating of NBFCs
Effective January 31, 1998 the Reserve Bank made credit
rating mandatory to all deposit taking NBFCs with NoF of ` 25
lakh and above. Presently, NBFCs-D with NoF of ` 2 crore and
above have to necessarily get rated by one of the approved
CRAs at least once a year. It is also mandated that they
cannot raise public deposits without the ‘minimum
investment grade’ and the copy of the rating should be
submitted to the Reserve Bank. Moreover, any upgradation or
downgrading of the rating also need to be informed to the
regulator immediately.
The credit ratings assigned are a symbolic representation of
current opinion on the relative credit risk associated with the
instruments rated by credit rating agency(CRA). This opinion
is arrived at after a detailed evaluation of the issuer’s
business and financial risks and on using such evaluation to
project the level and stability of the future financial
performance in various likely scenarios of the rated
companies. Thus, conclusion derived from the analysis of the
particular company based on the detailed information CRA
received from within the company as well as from outside
sources by the rating agency is reflected in a credit rating.
Agency
Minimum grade
The Credit Rating Information Services of
India Ltd (CRISIL)
FA- (FA minus)
ICRA Ltd
MA- (MA minus)
Credit Analysis and Research Ltd (CARE)
Rating Methodology
In rating an NBFC, the credit rating agency evaluates the
company’s business and financial risks, and uses this
evaluation to project the level and stability of its future
financial performance in various likely scenarios. The broad
parameters for assessing the risks of NBFCs are based on
Business Risk: (i) Operating Environment, (ii) Ownership
Structure, (iii) Franchise and Size, (iv) Competitive position,
(v) Management, Systems and Strategy, and (vi) Governance
structure; Financial Risk: (i) Asset Quality, (ii) Liquidity, (iii)
Profitability, and (iv) Capital Adequacy.
CARE BBB (FD)
FITCH Ratings India Pvt. Ltd
[tA- (ind) (FD)]
Prospects for Credit Ratings of NBFCs
The quantum of deposit raised by an NBFC is linked to the
ratings. NBFCs have been incentivized to get rated by credit
rating agencies through linking of their CRAR to the ratings.
Accordingly, as of now a rated NBFC is required to maintain
only 12 per cent of CRAR while unrated NBFCs need to
maintain 15 per cent. Incidentally, the non-deposit taking
NBFCs, though the rating is not mandatory by the regulator,
get their instruments rated by the CRAs.
In the wake of the sub-prime financial crisis, there is a
growing concern among the regulators about the potential
gap between expectation and realization, i.e., between
reliance on credit ratings and the reliability of such ratings.
The concern emanates mainly from the fact that inaccurate
credit ratings could disturb the market allocation incentives,
cost structures and competition. With growing competition
among credit rating agencies commercial aspirations appear
to be too high. The most oft repeated complaint against CRAs
are that they lack accountability as credit rating agencies do
not have a legal duty of accuracy and are often protected from
liability in case of inaccurate ratings. This requires the
attention of regulators and the government.
However, the relative importance of each of these parameters
can vary across companies, depending on its potential to
change the overall risk profile of the company concerned.
Moreover, as many of these parameters are qualitative, the
rating companies try to reduce the subjectivity by capturing
and assessing information on defined sub-parameters and by
comparison across various companies. One of the common
practices among CRAs being that a careful evaluation of the
risk management policies of the NBFC is done as it provides
important guidance for assessing the impact of stress events
on the liquidity, profitability, and capitalisation of the
company concerned.
The CRA evaluates the quality of an NBFC’s capital, apart
from the level of capital. An NBFC’s ability to meet regulatory
capital adequacy requirement is also evaluated. A very high
return on equity may not necessarily translate into a high
credit rating, given that the underlying risk could be very high
References:
RBI (1992): Report of the Working Group on Financial
Companies (Chairman: Shri A. C. Shah), Reserve Bank of
India, Mumbai.
140](https://image.slidesharecdn.com/0tpbi121111full-140101004243-phpapp02/75/0-tpbi121111-full-160-2048.jpg)

This document is the Reserve Bank of India's annual report on trends and progress in banking in India for the year ending June 30, 2011. Some key points: - It provides an overview of developments in the Indian banking sector as well as global banking trends. - It discusses the policy environment in India, including monetary policy, credit delivery, financial inclusion, and prudential regulatory policies. - It analyzes the operations and performance of commercial banks in India, including their balance sheets, financial results, asset quality, lending patterns, and technological developments. - It also covers cooperative banking and non-banking financial institutions. - The report is submitted to the Central Government of India as required


![[Polity] inter linking of rivers in india benefits, problems, china dispute...](https://cdn.slidesharecdn.com/ss_thumbnails/polityinterlinkingofriversinindiabenefitsproblemschinadisputeetc-131223083935-phpapp02-thumbnail.jpg?width=640&height=640&fit=bounds)


![[Old ncert] ancient india geographical background of ancient indian history ...](https://cdn.slidesharecdn.com/ss_thumbnails/oldncertancientindiageographicalbackgroundofancientindianhistoryandcivilizationmrunal-131223083926-phpapp02-thumbnail.jpg?width=640&height=640&fit=bounds)


