CITY OF CEDAR FALLS, IOWA
Comprehensive Annual
Financial Report
For the Fiscal Year Ended
June 30,20 13
Prepared by:
Finance/Public Records Division
of
Department of Administrative Services
Jennifer Rodenbeck, CPA, CPFO
Finance Manage/City Clerk
City of Cedar Falls, Iowa
Gomprehensive Annual Financial Report
For the Fiscal Year Ended June 30,2013
Table of Contents
INTRODUCTORY SECTION
Letter of Transmittal. .
GFOA Certificate of Achievement .
Organizational Charts . . . .
Principal Officials.
FINANCIAL SECTION
I ndependent Auditor's Report
Management's Discussion and Analysis
Basic Financial Statements:
Government-wide Financíal Statements:
Statement of Net Position
Statement of Activities. . . .
Fund Financial Statements:
Balance Sheet- Governmental Funds . . . .
Statement of Revenues, Expenditures, and Changes ín Fund
Balances - Governmental Funds. . . . . . .
Reconciliation of the Statement of Revenues, Expenditures,
and Changes in Fund Balances of Governmental Funds to
the Statement of Activities
Statement of Net Position - Proprietary Funds.
Statement of Revenues, Expenses, and Changes in Fund Net
Assets - Proprietary Funds.
Statement of Cash Flows - Proprietary Funds.
Notes to Financial Statements. . . .
Required Supplementary lnformation :
Budgetary Comparison Schedule - Function Budget
Notes to Required Supplementary lnformation
Schedule of Funding Progress
Other Supplem entary I nformation :
Combining Fund Statements and Schedules:
Combining Balance Sheet - Nonmajor Governmental Funds .
Combining Statement of Revenues, Expenditures, and
Changes in Fund Balances - Nonmajor Governmental
Funds
Paqe
1
11
12
14
15
18
31
33
81
83
86
35
37
39
40
42
44
46
87
91
Combining Statement of Net Position - lnternal Service Funds.
Combining Statement of Revenues, Expenses, and Changes
in Fund Net Position - lnternal Service Funds
Combining Statement of Cash Flows - lnternal Service Funds.
Capital Assets Used in the Operation of Governmental Funds:
Comparative Schedules by Source.
Schedule by Function and Activity
Schedule of Changes by Function and Activity.
STATISTICAL SECTION
Financial Trends:
Net Position by Component
Changes in Net Position.
Fund Balances, Governmental Funds
Changes in Fund Balances, Governmental Funds
Revenue Capacity:
Assessed and Taxable Value of Property. . . .
Property Tax Rates - Direct and Overlapping Governments. . .
Principal Property Taxpayers
Property Tax Levies and Collections.
Debt Capacity:
Ratios of Outstanding Debt by Type.
Ratios of General Bonded Debt Outstanding
Direct and Overlapping Debt.
Legal Debt Margin lnformation. . .
Revenue Bond Coverage - Sewer Authority.
Sales History and Total Sewer Charges.
Water Meters by Rate Class.
Largest Sewer Customers
Demographics on Economic lnformation:
Demographic and Economic Statistics
Principal Employers . . . .
Full-Time Equivalent City Government Employees by
Function/Department
Operating I nformation :
Operat.
Mattingly "AI & Prompt Design: Named Entity Recognition"
CITY OF CEDAR FALLS, IOWAComprehensive AnnualFinancial R.docx
1. CITY OF CEDAR FALLS, IOWA
Comprehensive Annual
Financial Report
For the Fiscal Year Ended
June 30,20 13
Prepared by:
Finance/Public Records Division
of
Department of Administrative Services
Jennifer Rodenbeck, CPA, CPFO
Finance Manage/City Clerk
City of Cedar Falls, Iowa
Gomprehensive Annual Financial Report
For the Fiscal Year Ended June 30,2013
Table of Contents
INTRODUCTORY SECTION
Letter of Transmittal. .
GFOA Certificate of Achievement .
Organizational Charts . . . .
2. Principal Officials.
FINANCIAL SECTION
I ndependent Auditor's Report
Management's Discussion and Analysis
Basic Financial Statements:
Government-wide Financíal Statements:
Statement of Net Position
Statement of Activities. . . .
Fund Financial Statements:
Balance Sheet- Governmental Funds . . . .
Statement of Revenues, Expenditures, and Changes ín Fund
Balances - Governmental Funds. . . . . . .
Reconciliation of the Statement of Revenues, Expenditures,
and Changes in Fund Balances of Governmental Funds to
the Statement of Activities
Statement of Net Position - Proprietary Funds.
Statement of Revenues, Expenses, and Changes in Fund Net
Assets - Proprietary Funds.
Statement of Cash Flows - Proprietary Funds.
Notes to Financial Statements. . . .
Required Supplementary lnformation :
Budgetary Comparison Schedule - Function Budget
Notes to Required Supplementary lnformation
Schedule of Funding Progress
Other Supplem entary I nformation :
Combining Fund Statements and Schedules:
3. Combining Balance Sheet - Nonmajor Governmental Funds .
Combining Statement of Revenues, Expenditures, and
Changes in Fund Balances - Nonmajor Governmental
Funds
Paqe
1
11
12
14
15
18
31
33
81
83
86
35
37
39
4. 40
42
44
46
87
91
Combining Statement of Net Position - lnternal Service Funds.
Combining Statement of Revenues, Expenses, and Changes
in Fund Net Position - lnternal Service Funds
Combining Statement of Cash Flows - lnternal Service Funds.
Capital Assets Used in the Operation of Governmental Funds:
Comparative Schedules by Source.
Schedule by Function and Activity
Schedule of Changes by Function and Activity.
STATISTICAL SECTION
Financial Trends:
Net Position by Component
Changes in Net Position.
Fund Balances, Governmental Funds
Changes in Fund Balances, Governmental Funds
Revenue Capacity:
Assessed and Taxable Value of Property. . . .
Property Tax Rates - Direct and Overlapping Governments. . .
5. Principal Property Taxpayers
Property Tax Levies and Collections.
Debt Capacity:
Ratios of Outstanding Debt by Type.
Ratios of General Bonded Debt Outstanding
Direct and Overlapping Debt.
Legal Debt Margin lnformation. . .
Revenue Bond Coverage - Sewer Authority.
Sales History and Total Sewer Charges.
Water Meters by Rate Class.
Largest Sewer Customers
Demographics on Economic lnformation:
Demographic and Economic Statistics
Principal Employers . . . .
Full-Time Equivalent City Government Employees by
Function/Department
Operating I nformation :
Operating lndicators by Function. . . .
Capital Asset Statistics by Function . . . .
95
97
99
101
102
104
7. 139
141
143
DEPARTMENT OF ADMINISTRATIVE SERVICES
CITY OF CEDAR FALLS, IOWA
220 CLAY STREET
CEDAR FALLS, IOIVA 50613
PHONE: 319-273-8600
FAX: 319-268-5126
www.cedarfalls,comw
October 1,2013
To Mayor Crews, Members of the City Council and citizens of
the City of Cedar Falls:
I am pleased to submit to you the comprehensíve Annual
Financial Report (CAFR) of the city of cedar Falls, lowa,for the
year ended June 30, 2013. This is the eleventh CAFR completed
in compliance with the Governmental
Accountíng standards Board Statement No. 34 (GASB 34).
Responsibility for both the accuracy of the data andthe
completeness and fairness of the presentation, including all
disclosures, rests with the city. To the best of ourknowledge and
belief, the enclosed data is accurate in all material respects and
is reported in a manner designedto present fairly the financíal
position and results of operations of the city. All disclosures
necessary to enable thereader to gain an understanding of the
city's financial activities have been included.
GAAP require that management provide a narrative
8. introduction, overview, and analysis to accompany the
basicfinancial statements in the form of Management's
Discussion and Analysis (MD&A). This letter of transmittal
isdesigned to complement MD&A and should be read in
conjunction with it. The city of cedar Falls, MD&A can befound
immediately following the report of the independent auditors.
The city is required to undergo an annual single audit in
conformity with the provisions of the u.s. office ofManagement
and Budget (oMB) circular A-133, "Audits of states, Local
Governments, and Nonprofitorganizations'" lnformation to
comply with oMB circular A-133, "Audits of states, Local
Governments, andNonprofit organizations," and "Government
Auditing standards" is included in another report under a
separate
cover.
The city of cedar Falls provides many municipal services
including fire and police protection, streets, garbage
collection, parks, recreation, cultural arts, planning, zonihg,
g"n"r"i a¿m¡n¡stråtion, and sewer and storm waterservices' For
financial reportíng purposes, all funds, agencies, boards,
commissions, trusts and authoritiesinvolved in the provision of
these services are included íf the city is financially accountable.
Financial
accountability is determined by several different factors,
including fiscal dàpendence, ability to impose will upon
theentity's governlng body, provision of specific financial
burdens or benefits and separate legal entity status. Aftercareful
evaluation of these factors, the city has included in this
financíal report the cedar Falls Electric utílity, Gasutility, water
utility, and communícations utility, as well as all funds of the
cíty. The utilities are each reported asdiscretely presented
component units.
1
9. "OUR CITZENS ARE OUR BUSINESS"
GOVERNMENTAL STRUCTURE
The City has operated under the mayor-council form of
government since incorporation. Policy-making and
legislative authority are vested in the governing council, which
consists of seven members. The City Council is
responsible, among other things, for passing ordinances,
adopting the budget, setting goals, and approving mayor-
appointed committees. The full-time mayor is responsible for
carrying out the policies and ordinances of the City
Council, for overseeing the day{o-day operations of the City,
and for appointing department directors. The mayor
and Council are elected on a nonpartisan basis. The Council
consists of two council members elected at large and
one council member elected from each of the five wards as
established by ordinance, elected for terms of four
years. The mayor is elected at large and to a two-year term.
ECONOM¡C CONDITION AND OUTLOOK
The City, incorporated in 1854, is located in the northeastern
part of the state, has a land area of 28.9 square miles
and a population of 39,260. The City is empowered to levy a
property tax on both real and personal property
located within its boundaries, and has the power by state statute
to extend its corporate limits by annexation, which
is seldom done, but will be done when deemed appropriate by
the City Council.
The economic condition and outlook of Cedar Falls continues to
be strong. The Cedar Falls economy was insulated
10. from many of the impacts created by the recent recession due to
the growth and stability of the University of
Northern lowa and a diverse service business sector.
The Greater Cedar Valley Alliance was formed in the metro area
to organize the human resources and generate
needed development capital to attract new business and industry
to the area and to encourage expansion of
businesses already in the area. As a result, many new businesses
have located offices and plants in the metro
area. Target Corporation constructed a distribution center with
an assessed value of approximately $¿S million in
FY02 and in FY08 completed a second refrigeration center. The
Cedar Falls lndustrial and Technology Park
continues to show tremendous expansion.
The increase in new businesses and expansion of established
firms has had a positive effect on employment and
the City's tax base. Historically, Cedar Falls' unemployment rate
has closely followed the State trends, which are
significantly lower than the nation's unemployment rate (See
Attachment A). This is due to the strong service
employment base supported by the state university located in
Cedar Falls. Since the devaluation of property in
l9B6-1988, Cedar Falls has had steady growth in property
values. Assessed values increased in FY14 by $gZ
million, and taxable values increased by $229 million (See
Attachment B) due to the increase in assessed
valuations and the residential rollback.
The City of Cedar Falls maintains a comparatively low tax rate.
Cedar Falls has the fifth lowest tax rate per capita
of the twenty largest cities in the state of lowa (See Attachment
C). Thís low rate can be attributed to the efforts of
the City to streamline operations over the past twenty years.
This has been accomplished by maintaining the
11. approximate same number of employees, even when demand for
service has increased. Cedar Falls had one of
the lowest number of full{ime employees per 1,000 residents in
FY12. (See Attachment D).
Over the past ten years Cedar Falls' residential housíng sales
prices have significantly increased. ln 2002, the
average sales price reported was $153,312. ln2012, the average
sales pricewas $206,773, which is a thirty-five
(35) percent increase in the past ten years (See Attachment E).
These statistics indicate that Cedar Falls' local
economy is sound and there is a strong market for Cedar Falls
homes.
2-
Housing values have surged from the recession and devaluation
of the mid-1980's to values that once again place
the homeowners living in Cedar Falls in an advantageous
market position. This market growth is a credit to
businesses, the school system, utilities, and quality of City
services in Cedar Falls. Each entity has worked
together to strengthen the local economy, create jobs, and
improve Cedar Falls' quality of life.
MAJOR INITIATIVES
Disinfection Project: ln August 2009, the Public Works
department presented to council information on an
Ultraviolet Light (UV) Alternatives Evaluation Workshop. This
is a process to treat bacteria at the Water
Reclamation Facility. The Environmental Protection Agency
(EPA) has directed a new standard of treatment. The
advantage of UV over other disinfectants is it can inactivate
12. hard to control organisms, such as E.coli, without
chemical additions to the final product and without producing a
harmful disinfection by-product. Using UV is a
better and safer way to disinfect and there are no residuals.
ln FY11, the Public Works department solicited bids for the
construction of the Water Reclamation Facility UV
Disinfection and Biosolids Handling Facilities lmprovements
Project (Disinfection Project). Construction of the
project began in FY12 and a majority of the construction has
occurred during FY13. Completion is expected in
FY14. The total project cost will be approximately 921.8
million.
This project will have a significant impact on the City's sewer
fund. The City Council did approve a So/o increase on
sewer rates each year for five years beginning in FY12. The
council also decided not to finance the project in a
traditional way of selling sewer bonds. lnstead the City has
opted to self-finance the project. Cash reserves from
the City's Capital lmprovements Fund and Hospital Fund
havefinanced the project. Through June 30,2013, these
funds have foaned the sewer fund $15.9 million. Self-financing
has allowed these funds to earn interest at a rate
greater than earnings on traditional investments and the sewer
fund benefits by paying interest costs lower than
bond rates.
Bluff Street Lift Station: ln 1962, the Bluff Street Lift Station
was constructed below the 1Oo-year flood elevation.
During the Flood of 2008, the entire basement (pump room)
filled with water and the control room had five feet of
standing water in it. Due to its location, the station was not
accessible for several days and out of service for about
two weeks because of the significant damage to the mechanical
equipment in the station as well as to the backup
13. generator. Because of the dry well/wet well configuration of the
station, conventional flood protection was not
practical, therefore the City applied for a Community
Development Grant (CDBG) Disaster Recovery Grant to
construct the new station at a higher elevation and that is not
subject to flooding and is completely accessible in a
high water event.
ln FY10, design on the new lift station started and the Public
Works Department solicited bids for the New Bluff
Street Lift Station project. Construction began in FY12 and
continued in FY13. Completion will occur in FY14. The
total project cost will be approximately $Z.g million. The
CDBG grant will fund $3.g million of the cost. The
remaining cost will be financed with sewer bonds and self-
financing options. Sewer rates increases described
above also were needed to help finance this project as well.
3
ACCOUNTING SYSTEMS AND BUDGETARY CONTROL
ln developing and evaluating the City's accounting control
system, consideration is given to the adequacy of
internal accounting controls. Accounting control comprises the
plan of organization and the procedures and
records that are concerned with the safeguarding of assets and
the reliability of financial records and consequen¡y
are designed to provide reasonable assurance that:
¡ Transactions are executed in accordance with management's
general or specific authorizations.
' Transactions are recorded as necessary(1)to permit preparation
of financial statements in conformitywith
14. generally accepted accounting principles or any other criteria,
such as finance-related legal and contractual
compliance requirements applicable to such statements, and (2)
to maintain accountability for assets.
. Access to assets is permitted only in accordance to
management's authorization.
' The recorded accountability for assets is compared with the
existing assets at reasonable intervals and
appropriate action is taken with respect to any differences.
The definition of accounting control comprehends reasonable,
but not absolute, assurance that the objectives
expressed in it will be accomplished by the system. The concept
of reasonable assurance recognizes that the cost
of internal controls should not exceed the benefits. The benefit
consists of reductions in the risk of failing to
achieve the objectives implicit in the definition of accounting
control.
All internal controf evaluations occur within the above
framework. We believe that the City's internal accounting
controls adequately safeguard assets and provide reasonable
assurance of proper recording of financial
transactions.
ln accordance with the State of lowa, the City has formally
established budgetary accounting control for its
operating funds. Budgetary control is maintained at the function
level (Public Safety, Public Works, Health and
Social Services, Culture and Recreation, Community and
Economic Development, General Government, Debt
Service, Capital Projects, and Business-Type activities). The
City has adhered to these budgetary laws.
15. INDEPENDENT AUDIT
Eide Bailly, LLP, a firm of independent public accountants has
audíted the financial records, books of account and
transactions of the City for the fiscal year ended June 30, 2013,
and their opinion is included in the Financial
Section of this report. The financial statements are the
responsibility of the City. The responsibility of the
independent public accountants is to express an opinion on the
City's fínancial statements based on their audit. An
audit is conducted in accordance with U.S. generally accepted
auditing standards. Those standards require that
the audit be planned and performed in a manner to obtain a
reasonable assurance as to whether the financial
statements are free of material misstatement.
AWARDS
The Government Finance Officers Association of the United
States and Canada (GFOA) awarded a Certificate of
Achievement for Excellence in Financial Reporting to the City
of Cedar Falls for its comprehensive annual financial
report (CAFR) for the year ended June 30, 2012. The Certificate
of Achievement is a prestigious national award
recognizing conformance with the highest standards for
preparation of state and local government financial reports.
4
ln order to be awarded a Certificate of Achievement, a
government unit must publish an easily readable and
efficiently organized comprehensive annual financial report,
whose contents conform to program standards. The
16. CAFR must satisfy both accounting principles generally
accepted in the United States of America and applicable
legal requirements.
A Certificate of Achievement is valid for a period of one year
only. The City of Cedar Falls has received a
Certificate of Achievement for the last twenty-three consecutive
years (fiscal years ended 1990-2012). We believe
our current report continues to conform to the Certificate of
Achievement program requirements, and we are
submitting it to GFOA.
ACKNOWLEDGMENTS
The preparation of this report could not be accomplished
without the efficient and dedicated service of the entire
staff of the Finance/Public Records Division, particularly Lisa
Roeding, Deputy Finance Manager and Cathy
Niebergall, Financial Technician. Each member of the division
has my sincere appreciation for the contributions
made in the preparation of this report. I would also like to thank
the members of the City Council for their continued
interest and support in planning and conducting the financial
operations of the City in a responsible and prudent
manner.
Sincerely,
enbeck, CPA, CPFO
nce Manager/City Clerk
5
Unempl
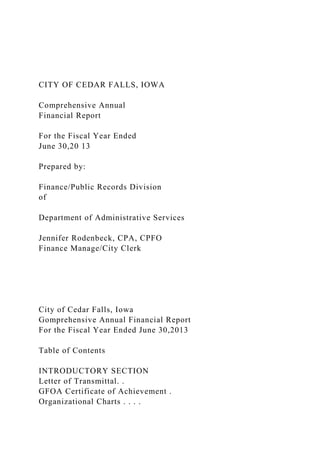
17. ATTACHMENT A
Unemployment Rates
Cedar Falls, Waterloo, lowa & U.S.
Unemployment Rates
Gedar Falls, Waterloo, lowa & U.S.
9.00
8.00
7.00
c)
o)
o
c
c)o
L
o
fL
6.00
5.00
4.00
3.00
2.00
July Aug Sep Oct Nov Dec Jan Feb Mar Apr May June
tCedarFalls +Waterloo +lowa +U.S.
20. 7.7
7.8
7.9
7.7
7.6
7.5
7.6
7.6
Average 3.5 6.2 5.0 7.8
Cedar Falls has consistently
remained below Waterloo and
the nation's unemployment
rates.
Historically Cedar Falls'
unemployment rate has closely
followed the State trends.
Cedar Falls is insulated from
many of the economic problems
in the Metro area due to a strong
service employment base
supported by UNI.
6
ATTACHMENT B
taxvaluel4
Taxable Valuations FY04-FY 14
City of Cedar Falls
3,000,000,000
22. FYlO
FY11
FY12
FY13
FY14
817,996,990
903,439,479
920,739,030
985,250,969
1 ,018,530,694
1,098,295,277
1 ,150,079,051
1 ,1 85,969,161
1,254,921,347
1,393,51 1,204
1,622,962,335
1,427,127,146
1,673,902,007
1,737 ,456,552
1,931 ,759,494
2,013,912,356
2,252,421,925
2,336,646,915
2,402,107,961
2,459,320,459
2,618,319,943
2,650,433,900
The last ten years have provided a
steady growth trend ín assessed
valuations. ln addition, FY08 was the first
year that assessed values exceeded
23. $2 billion and taxable values exceeded
$1 billion.
For FY14, assessed values increased
by $32,t 14,057. However, taxable
values increased by $229,35 1 ,191
due to the change in the residential
rollback factor to 52.82% for Fy14 and the
release of the TIF increment.
7
Citytaxr
900.00
800.00
700.00
600.00
500.00
400.00
300.00
200.00
Property Tax Per Capita (FY13)
20 Largest lowa Cities
ATTACHMENT C
24. Property Tax Per Gapita (FY13)
20 Largest Gities
WDM IC CR BE CB DA WA CL UR AN DI4 FD MC MA SC
CF AM MA DU BU
C¡ty
2010 Abbre-
Population viation
FYI3
Tax Per
Person
West Des Moines
lowa City
Cedar Rapids
Bettendorf
Council Bluffs
Davenport
Waterloo
Clinton
Urbandale
keny
Des Moines
Fort Dodge
Mason City
Marion
Sioux City
Cedar Falls
Ames
Marshalltown
Dubuque
27. For over two decades Cedar Falls' local
government has operated at one of the lowest per
capita property tax rates among the 20 largest
cities in lowa.
At a cost of $435.53 per person, the City is sub-
stantially below the average rate of $549.89. This
rate can be attributed to the City's concerted efforts
to streamline operations over the past 20 years.
lf the City of Cedar Falls operated at the state
average property tax per capita, an additional 4.S
million dollars would be devoted to operations.
This would be an increase of 26% of taxes levied
in FY13.
lncluded in Cedar Falls' population are university
students who live in campus housing and do not
pay property taxes. Thís results in an even greater
property tax burden on the citizens.
I
ATTACHMENT D
Full-Time Employees Per 1,000 Residents
Comparison of 20 Largest Cities
12
10
I
28. 6
4
oe 9ù o
"so
as
"$
Eo gù 9h .$Þ oQ (a & ow $*.$o$ o( È¡Þùe
City
FY12
Employees
2010
Population
Employees
Per 1,000
Cedar Rapids
Dubuque
lowa City
Mason City
Des Moines
Ames
Sioux City
Burlington
Davenport
Waterloo
Council Bluffs
Fort Dodge
Bettendorf
Clinton
31. 4.56
Average 7.30
Among the top twenty largest cities in the State of lowa, the
City of Cedar Falls
continues to have one of the lowest number of employees per
capita. The
pressures of new construction growth, road development, and
societal values
have placed greater demands on existing staff. ln the near
future, the City
Council wíll need to prioritize services or focus on key services
to address thé
over extension of City staff.
Cedar Falls city government
continued to have one of the
lowest number of employees
per 1,000 capita comparing
the top 20 largest cities.
Cedar Falls has 1.82
employees per 1,000 capita
less than the state average,
which is equivalent to 71
fewer fu ll{ime employees.
Employment reductions have
been implemented over the
last 10 years, which has
streamlined Cedar Falls'
employment.
9
32. Resalel2
ATTACHMENT E
The average sale price of residential properties in
Cedar Falls has grown by 35% between 2OO2- 2012
from $153,31 2 to $206,773.
However, in2O11 the average sale price declined slighfly
Average Residential Sales Price (Annual)
Cedar Falls, lowa
220,000
210,000
200,000
190,000
180,000
170,000
160,000
150,000
140,000
130,000
120,000
34. 197,576
206,773
Average 186,g3g
- 10 -
Government Finance Officers Association
Certificate of
Achievement
for Excellence
in Financial
Reporting
Presented to
City of Cedar FaIIs
fowa
For its Comprehensive Annual
Financial Report
for the Fiscal Year Ended
June 30,2012
ØrtrÊtu-
Executive Director/CEO
-11 -
35. City of Cedar Falls, lowa
Organizational Chart
Operations and
Maintenance
Water
Reclamation
Public
Works
lnvestigat¡ons
School Reserve
Officer & Crossing
Guard Program
Police
Department
Patrol
Code Enforcement
lnspections
Suppression
Prevent¡on
Fire
Department
City Council
36. Mayor
Citizens of
Cedar Falls
Cultural Services
Library*
Parks
Recreation
Visitor & Tourism
Services
Community Ctr&
Senior Services
Human & Leisure
Services
Community
Services
Engineering
& Storm Water
lnspect¡on
Services
Planning and
Zoning
Developmental
37. Services
Legal Services
Finance/Public
Records & Parking
lnformation
Systems
Cable W
Administrative
Services
I
A
I)
t
city division org.doc
January 29,2013
Financial Services
*The Library is governed by the Library Board of Trustees'
which are appointed by the Mayor & City Council. The Library
is shown under the Human & Leisure Services Department
since that department is the Board's liaison.
City of Cedar Falls, lowa
Boards and Commissions
38. I
J
(¡)
I
Board of Electrical
Examiners
Comm Ctr & Senior
Services Board
Park & Recreation
Commission
Historic Preservation
Commission
Board of
Appeals
Civil Service
Commission
Library Board
of Trustees
Visitors & Tourism
Board
City
Council
Jon Crews
Mayor
39. Board of
Adjustment
Cedar Falls Health
Trust Board
Human Rights
Commission
Utilities Board
of Trustees
Art & Culture
Board
Board of Plumbing
Examiners
Housing
Commission
Planning & Zoning
Commission
Finance Division
January 25,2011City boards & commissions.doc
CITY OF CEDAR FALLS, ¡OWA
PRINCIPAL OFFICIALS
June 30,2013
Title
Mayor
40. Council Member- 1't Ward
Council Member - 2nd Ward
Council Member - 3'd Ward
Council Member - 4th Ward
Council Member- Sth Ward
Council Member - At Large
Council Member - At Large
Administrative Services Director
Developmental Services Director
Human & Leisure Services Director
Fire Chief
Police Chief
Public Works Director
City Attorney
Finance Manager/City Clerk
lnformation Systems Manager
Cable TV Manager
City Engineer
City Planner
Community Services Manager
lnspection Services Manager
Acting Cultural Services Manager
Recreation Division Manager
Visitors & Tourism Manager
Cedar Falls Public Library Director
Operations and Maintenance Manager
Water Reclamation Manager
Cedar Falls Utilities General Manager
Name
Jon Crews
Tom Hagarty
Susan deBuhr
John Runchey
Mare Madsen Schmidt
Frank Darrah
41. Nick Taíber
Dave Wieland
Richard L. McAlister
Ron Gaines
Mark Ripplinger
John Schilling
Jeff Olson
Bruce Sorensen
Steve Moore
Jennifer Rodenbeck
Laurene Saathoff
Denny Bowman
Randy Lorenzen
Marty Ryan
Robert Seymour
Craig Witry
Emily Drennen
Bruce Verink
Kimberly Manning
Sheryl McGovern
Brian Heath
Lyle Krueger
Jim Krieg
-14-
dar Falls
Visitor 8. Tourism Center
.¿>
EideBailly.
42. CPAs & BUSINESS ADVISORS
Independent Auditor's Report
To the Honorable Mayor and
Members of the City Council
City of Cedar Falls, Iowa
Report on the Financial Statements
We have audited the accompanying financial statements of the
governmental activities, the business-type
activities, the aggregate discretely presented component units,
each major fund, and the aggregate
remainingfundinformationoftheCityofCedarFalls,Iowaasofandfor
theyearended Jine30,2013,
and the related notes to the financial statements, which
collectively comprise the City's basic financial
statements as listed in the table of contents.
Management's Responsibility for the Financial Statements
Management is responsible for the preparation and fair
presentation of these financial statements in
accordance with accounting principles generally accepted in the
United States of America;this includes
the design, implementation, and maintenance of internal control
relevant to the preparation and fair
presentation of financial statements that are free from material
misstatement, whether due to fraud or
e1Tor.
Auditor's Responsibility
Our responsibility is to express opinions on these financial
statements based on our audit. We did not
audit the financial statements of the Cedar Falls Utilities, which
represent the entire assets, net position,
43. and revenues of the aggregate discretely presented component
units. Those financial statements were
audited by other auditors whose report thereon has been
furnished to us, and our opinion, insofar as it
relates to the amounts included for the Cedar Falls Utilities, is
based on the report of the other auditors.
We conducted our audit in accordance with auditing standards
generally accepted in the United States of
America and the standards applicable to financial audits
contained in Government Auditing Standards,
issued by the Comptroller General of the United States. Those
standards require that we plan and perform
the audit to obtain reasonable assurance about whether the
financial statements are free from mateiial
misstatement.
An audit involves performing procedures to obtain audit
evidence about the amounts and disclosures in
the financial statements. The procedures selected depend on the
…