DC Development Report: 2014/2015 Edition

The DC Development Report is a summary of the major development and construction projects in the District of Columbia. The Washington, DC Economic Partnership (WDCEP) began tracking development activity in 2001 with the hope of creating a comprehensive database that would answer a number of questions in regards to the construction activity in the city. The Report summarizes our entire database of projects, highlights major projects and what lies ahead for development in the District of Columbia. This update of the DC Development Report is an overview of development activity and of the expansion occurring in DC. As a resource book, it is a compilation of nearly 14 years of data collection and research that provides an overview of an ever-changing development and construction cycle. The WDCEP performs an annual “development census” in the month of September and receives contributions from more than 100 developers, architects, contractors and economic development organizations. This outreach results in updates to more than 350 projects. While our database of projects is constantly being updated, for the purposes of this publication all data reflects project status, design and information as of September 2014. In 2014 the WDCEP partnered with CBRE to provide an economic overview of DC and in-depth analysis of the office, retail and residential markets. Although every attempt was made to ensure the quality of the information contained in this document, the WDCEP and CBRE makes no warranty or guarantee as to its accuracy, completeness or usefulness for any given purpose.

Recommended
More Related Content
What's hot
What's hot (20)
Viewers also liked
Viewers also liked (20)
Similar to DC Development Report: 2014/2015 Edition
Similar to DC Development Report: 2014/2015 Edition (20)
More from Washington, DC Economic Partnership
More from Washington, DC Economic Partnership (20)
Recently uploaded
Recently uploaded (20)
DC Development Report: 2014/2015 Edition
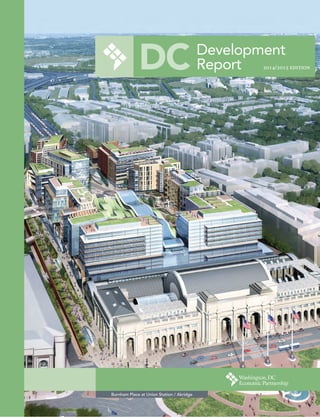
- 1. Burnham Place at Union Station / Akridge Development Report 2014/2015 edition
- 2. The Washington, DC Economic Partnership would like to acknowledge our corporate sponsors whose continued financial support has made the DC Development Report: 2014/2015 Edition possible. PUBLIC SECTOR PARTNERS PRIVATE SECTOR PARTNERS BOARD MEMBERS Jeff Miller / Co-Chair Deputy Mayor Office of Deputy Mayor for Planning & Economic Development Richard Lake/Co-Chair Roadside Development Olivia Shay-Byrne/Vice Chair Reed Smith, LLP Doug Loescher/ DMPED Representative Office of Deputy Mayor for Planning & Economic Development Jennifer Eugene/Secretary Washington Gas Joseph L. Askew, Jr., Esq. Verizon Steven C. Boyle EDENS Jean-Luc Brami Gelberg Signs Kenneth Brewer H St. Community Development Corporation Sean Cahill Property Group Partners Donna M. Cooper Pepco Daniel Duke Bohler Engineering Angela Franco Greater Washington Hispanic Chamber of Commerce Brett Greene American Management Corporation Michael J. Haddad Capital One Bank Tonya Hill Comcast Business Carl Hairston M&T Bank Stan Jackson Anacostia Economic Development Corporation Norman Jemal Douglas Development Corporation Greg Leisch Delta Associates Chester McPherson DC Department of Insurance, Securities, & Banking Rafael Muniz The JBG Companies Lisa Mallory DC Building Industry Association Thomas Nida United Bank Chris Niehaus Microsoft Scott Nordheimer Urban Atlantic/A&R Development Corporation Greg O’Dell Events DC Marc Ratner Streetsense Eric E. Richardson DC Office of Cable Television Rabbiah “Robbie” Sabbakhan DC Department of Consumer & Regulatory Affairs Tara Scanlon Holland & Knight Michael Stevens Capitol Riverfront BID Robert Summers DC Department of Small & Local Business Development Mitchell Weintraub Cordia Partners, LLC
- 3. Burnham Place at Union Station / Akridge ImagecourtesyofAkridge a publication of the in partnership with Development Report 2014/2015 edition
- 4. © 2014 Washington, DC Economic Partnershipiv ABOUT THE DC DEVELOPMENT REPORT The DC Development Report is a summary of the major development and construction projects in the District of Columbia. The Washington, DC Economic Partnership (WDCEP) began tracking development activity in 2001 with the hope of creating a comprehensive database that would answer a number of questions in regards to the construction activity in the city. The Report summarizes our entire database of projects, highlights major projects and what lies ahead for development in the District of Columbia. This update of the DC Development Report is an overview of development activity and of the expansion occurring in DC. As a resource book, it is a compilation of nearly 14 years of data collection and research that provides an overview of an ever-changing development and construction cycle. The WDCEP performs an annual “development census” in the month of September and receives contributions from more than 100 developers, architects, contractors and economic development organizations. This outreach results in updates to more than 350 projects. While our database of projects is constantly being updated, for the purposes of this publication all data reflects project status, design and information as of September 2014. In 2014 the WDCEP partnered with CBRE to provide an economic overview of DC and in-depth analysis of the office, retail and residential markets. Although every attempt was made to ensure the quality of the information contained in this document, the WDCEP and CBRE makes no warranty or guarantee as to its accuracy, completeness or usefulness for any given purpose. For more information please see our Methodology section. © Washington, DC Economic Partnership, 2014
- 5. 1. DEVELOPMENT OVERVIEW 6 Economic Overview 12 Summary of Projects 14 Most Active Developers, Architects & Contractors 2. DEVELOPMENT BY SECTOR 19 Office 31 Retail 45 Residential 59 Hospitality 69 Education 3. APPENDIX 82 Methodology 85 Acknowledgements TABLE OF CONTENTS
- 6. The JBG Companies and JBGR Retail proudly support the Washington, DC Economic Partnership JBG.COM JBGR.COM
- 7. cbre.com/dc TRENDS EVOLVE. EXPERTS LEAD. CBRE knows Washington, D.C. As the industry’s leading provider of commercial leasing services, investment sales and property management, we have the insight and perspective to anticipate what’s next and what it means for the Washington Metropolitan community we serve.
- 9. DC Development Report • 2014/2015 Edition 5 DEVELOPMENT OVERVIEW Economic Overview / Summary of Projects / Most Active
- 10. © 2014 Washington, DC Economic Partnership6 ECONOMIC OVERVIEW 1. U.S. Census ECONOMIC OVERVIEW OF THE DISTRICT OF COLUMBIA While the District of Columbia (“DC”) has a total population of 646,449, its population increases to more than one million each day due to the influx of employees coming predominantly from Northern Virginia and Suburban Maryland.1 In fact, the DC metropolitan area maintains the second highest share of public transit commuters in the country, second only to New York City. DC saw total employment rise 11.7% between September 2004 and September 2014 with the addition of 79,400 jobs. Though the unemployment rate remains elevated at 7.8% as of September 2014, this is a significant decline from the 10.5% rate recorded in September 2011. The table below presents the historical change and growth in employment levels for major industry groups in DC for the past five and ten years. September 2004-2014 September 2009-2014 Change (000s) Change (%) Change (000s) Change (%) Mining, Logging, and Construction 2.1 17.1% 3.2 28.6% Manufacturing -1.7 -68.0% -0.4 -33.3% Wholesale Trade 0.3 6.5% 0.4 8.9% Retail Trade 3.9 22.3% 3.8 21.6% Transportation and Utilities -1.3 -23.6% -0.2 -4.5% Information -6.8 -28.3% -1.4 -7.5% Financial Activities -1.6 -5.2% 2.0 7.4% Professional and Business Services 12.7 8.8% 12.4 8.5% Education and Health Services 36.0 39.1% 24.7 23.9% Leisure and Hospitality 18.9 36.6% 11.9 20.3% Other Services 9.8 16.5% 5.0 7.8% Federal Government 8.7 4.5% -0.7 -0.3% Source: U.S. Bureau of Labor Statistics Office Employment Office-using employment in DC continues struggling to regain its footing as a result of the substantial cuts in federal government employment. Between September 2013 and September 2014, office-using employment experienced a net loss of 700 jobs. Although the Professional and Business Services sector, typically regarded as DC’s engine of employment growth, observed a year-over-year increase of 2,800 jobs, this was offset by the loss of 3,600 federal government jobs. Meanwhile, the Financial Activities, Information, and Other Services sectors added a combined 200 jobs. September 2013 September 2014 Change (000s) Change (%) Information 17.1 17.2 0.1 0.6% Financial Activities 28.8 28.9 0.1 0.3% Professional and Business Services 155.0 157.8 2.8 1.8% Other Services 69.2 69.1 -0.1 -0.1% Federal Government 204.5 200.9 -3.6 -1.8% TOTAL OFFICE EMPLOYMENT 474.6 473.9 -0.7 -0.1% Source: U.S. Bureau of Labor Statistics
- 11. DC Development Report • 2014/2015 Edition 7 Economic Overview POPULATION GROWTH Young Professionals Young professional aged 25 to 44 years continue to constitute a growing share of the population in DC. According to the U.S. Census Bureau, between 2004 and 2013, the share of the population within that age group grew by 3.6 percentage points, and now represents 36.5% of the overall population. Birth Rate The birth rate in DC has been on a downward trajectory over the past five years, but has remained elevated relative to the U.S. In the past ten years, DC saw the highest birth rate level in 2008, when there were 15.4 births per 1,000 population. The latest available data show this number has declined to 14.9 births per 1,000 in 2012. Birth Rate (# of Births per 1,000) U.S. Birth Rate Total Population (Ths.) Age 25 to 44 Age 25 to 44, (%) 2004 14.3 14.0 567.8 186.6 32.9 2005 14.5 14.0 567.1 185.7 32.7 2006 14.7 14.2 570.7 188.0 32.9 2007 15.1 14.3 574.4 190.2 33.1 2008 15.4 13.9 580.2 193.0 33.3 2009 15.1 13.5 592.2 199.1 33.6 2010 15.2 13.0 605.1 208.0 34.4 2011 15.0 12.7 619.6 218.5 35.3 2012 14.9 12.6 633.4 227.7 36.0 2013 n/a n/a 646.5 235.8 36.5 Sources: U.S. Census Bureau, Moody’s Analytics EMPLOYMENT TRENDS Public vs. Private Sector DC’s public and private sectors have seen divergent employment trends during the past several years. When the U.S. economy was rocked by the financial crisis, the private sector saw declining job growth. Since the recession, however, the private sector has made great strides to reach pre-recession levels of employment, growing 13.5% between September 2009 and September 2014. Meanwhile, public sector employment experienced large job gains in the aftermath of the recession due to the federal government’s stimulus plan. Since 2009, however, public sector employment has dropped about 0.1% per annum, or 0.5% over the span of five years. Legal Services Employment in the Legal Services sector in DC reached its peak in July 2008 with almost 38,000 employees, though it quickly plummeted thereafter with the onset of the Great Recession. Since 2012, employment has leveled and hovered around the 30,000 employee mark. A subsector of the Professional and Business Services sector, Legal Services has observed dwindling employment with a 14.7% drop over the ten-year period from September 2004 to September 2014. Most of this employment decline is concentrated in the latter five years during which the average annual rate of decline measured 2.4%. Law firms are among the top tenants in DC’s 125 million-sq.-ft. office market, occupying approximately one-third of the entire market.
- 12. © 2014 Washington, DC Economic Partnership8 ECONOMIC OVERVIEW Educational Services The Educational Services sector has observed a significant boost in employment over the past ten- and five-year periods. Between September 2004 and September 2014, employment rose 54.7% with the addition of almost 22,000 jobs. Most of this employment growth has been concentrated in the past five years, during which 17,700 people were added to the sector’s payroll. Although not an occupier of office space, the Education sector is expected to continue expanding with the boom in “eds and meds,” particularly in DC and the surrounding metropolitan area. Health Care and Social Assistance The Health Care and Social Assistance sector has experienced strong employment growth of 2.4% per annum between September 2009 and September 2014. However, the addition of 14,000 jobs between September 2004 and September 2014 has not led to a direct increase in demand in the office market as the sector is not regarded as office-using. September 2004-2014 September 2009-2014 Change (000s) Change (%) AAGR (%) Change (000s) Change (%) AAGR (%) Total Private 72.3 16.2% 1.6% 61.4 13.5% 2.7% Total Public 7.1 3.1% 0.3% -1.2 -0.5% -0.1% Legal Services -5.0 -14.7% -1.5% -3.9 -11.9% -2.4% Educational Services 22.0 54.7% 5.5% 17.7 39.8% 8.0% Health Care and Social Assistance 14.0 27.0% 2.7% 7.0 11.9% 2.4% Source: U.S. Bureau of Labor Statistics (AAGR=average annual growth rate) INVESTMENT SALES Foreign Purchasers Foreign office real estate investment in DC has seen a steady increase over the past two years. The following chart represents foreign capital investment in DC over the past five years. Over 50% of foreign investment purchases were concentrated in the last two of five years. The capital has stemmed from a diverse group of investors encompassing Asia, the Middle East, and Europe. Israel has consistently been a leader with regard to the total number of properties purchased. The year-to-date numbers through Q3 2014 further emphasize the continued interest in DC’s office market. Year-to-date, eight properties totaling over $1.6 billion worth of foreign capital and 3.0 million sq. ft. of space have been purchased. As Europe continues to show signs of weakness and instability plagues areas of the Middle East and Asia, these figures are expected to remain stable as foreign investors search for stronger and safer yield.
- 13. DC Development Report • 2014/2015 Edition 9 Economic Overview ORIGIN OF CAPITAL (January 2009–September 2014) Country Total Properties Purchased Total Volume ($M) Germany 9 $1,159.20 Japan 5 $813.60 Canada 9 $739.70 Norway 3 $719.20 South Korea 2 $596.00 UK 4 $586.00 Kuwait 2 $516.00 Israel 6 $305.00 Italy 1 $93.50 Other 3 $111.10 Total 44 $5,639.40 Source: Real Capital Analytics Foreign Sellers Over the past two years, foreign capital has been among the least active when it comes to disposition of office assets in DC. Year-to-date there has only been one disposition in DC from a foreign seller. In 2013, there was a handful, a majority of which came from Wereldhave N.V.’s sale of 1401 New York Avenue and 701 8th Street, NW.
- 14. © 2014 Washington, DC Economic Partnership10 ECONOMIC OVERVIEW NOTABLE OFFICE SALES COMPS (4Q 2013–3Q 2014) Property Address Sale Price ($M) Price Per SF Buyer (True) Company Seller (True) Company Transaction Date 1401 New York Ave NW $950.0 $450 Heitman LLC, Minshall Stewart Properties, NPS Loan Star Funds 4Q 2013 555 12th St NW $505.0 $640 MetLife, Inc. Manulife Financial Corporation 1Q 2014 700 13th St NW $220.1 $851 Kuwait Investment Authority Beacon Capital Partners 1Q 2014 1333 H St NW $127.2 $473 MRP Realty, Inc. Miller Global Properties 3Q 2014 801 17th St NW $148.8 $948 Morgan Stanley Real Estate Advisor, Inc. Property Group Partners 1Q 2014 1110 Vermont Ave NW $162.5 $530 European Property Investment Corporation Tishman Speyer 1Q 2014 2550 M St NW $156.0 $753 Mirae Asset Global Investments Tishman Speyer 1Q 2014 55 M St SE $141.5 $529 Hines Global REIT, Inc. Monument Realty LLC 4Q 2013 2001 Pennsylvania Ave NW $107.8 $699 Carr Properties Property Group Partners 3Q 2014 1775 Eye St NW $104.5 $564 Washington Real Estate Investment Trust Lincoln Property Company 2Q 2014 Source: CoStar; Real Capital Analytics NOTABLE APARTMENT SALES COMPS (4Q 2013–3Q 2014) Property Address Sale Price ($M) Price Per Unit Buyer (True) Company Seller (True) Company Transaction Date 2700 Woodley Pl NW $195.0 $919,811 TIAA-CREF The JBG Companies 2Q 2014 3828 Georgia Ave NW $75.0 $344,037 Principal Global Investors LLC Duball, LLC 3Q 2014 443 New York Ave NW $73.0 $337,963 Washington Real Estate Investment Trust Greenfield Partners LLC 1Q 2014 2900 Connecticut Ave NW $39.0 $295,455 Commonwealth Cooperative Calomiris Associates 2Q 2014 325 P St SW $34.9 $156,285 Somerset Development Company LLC HDF&B Realty Advisors, LLC 4Q 2013 301 G St SW $34.0 $117,647 Urban Investment Partners, LP Capitol Park Associates 4Q 2013 1921 Kalorama Rd NW $19.8 $324,590 Goldman, Sachs & Co. Urban Investment Partners, LP 2Q 2014 1616 16th St NW $16.0 $280,702 Van Metre Companies Carmel Partners 2Q 2014 1706 G St NW $8.0 $333,333 Goldman, Sachs & Co. Urban Investment Partners, LP 4Q 2013 4000-4016 47th St NW $7.6 $269,643 47th Street LLC Urban Investment Partners, LP 4Q 2013 Source: CoStar; Real Capital Analytics
- 15. 702 H Street NW, Suite 400 Washington, DC 20001 202.638.6300 www.douglasdevelopment.com Enhancing communities and creating dynatic places since 1985 CONTACT US: Douglas Development Corporation is one of the most dominant and successful real estate developers in the Washington area controlling nearly 9 million square feet. The Company and its principals have earned a national reputation as a leader in redevelopment of historical properties. Douglas Development’s most notable, visible and well known projects are in the East End of Washington, and have served as the catalyst for the redevelopment of the entire area. With a current portfolio of nearly 9 million leasable square feet and over 8 million square feet of developable real estate in the pipeline, Douglas Development is well established as one of the most dominant and successful real estate developers in the Washington area.
- 16. © 2014 Washington, DC Economic Partnership12 DEVELOPMENT OVERVIEW 1. all projects DC DEVELOPMENT GROUNDBREAKINGS (September 2014, sq. ft. in millions) 1 20142013201220112010200920082007200620052004200320022001 11.1 13.4 9.4 10.3 12.7 13.1 10.4 7.5 4.3 10.7 10.4 9.6 10.6 10.3 YTD Projects Sq. Ft. Estimated Cost ($B) Completed 1,084 143,308,246 $43.4 2001 79 10,863,811 $2.2 2002 85 9,189,374 $2.2 2003 96 11,436,328 $3.1 2004 97 11,591,945 $2.8 2005 87 10,153,302 $2.4 2006 102 12,933,180 $3.7 2007 73 11,621,355 $3.6 2008 82 12,178,351 $4.1 2009 86 12,248,868 $4.4 2010 52 7,977,660 $2.5 2011 57 5,944,403 $2.3 2012 66 7,512,581 $2.4 2013 79 11,667,858 $4.8 2014 YTD 43 7,989,230 $2.9 Under Construction 149 23,095,189 $9.2 2014 delivery 31 2,518,958 $1.2 2015 delivery 82 10,292,102 $3.6 2016 delivery 30 6,236,275 $2.3 2017+ delivery 6 4,047,854 $2.1 Pipeline 339 131,692,249 $38.2 Near Term 102 17,432,652 $4.9 Medium Term 104 16,902,091 $4.8 Long Term 133 97,357,506 $28.5 SUMMARY OF PROJECTS (September 2014) Summary of Projects average square feet of groundbreakings per year from 2010 – 2013 MILLION 10.2
- 17. DC Development Report • 2014/2015 Edition 13 143.3 MILLION Square Feet Completed 23.1 MILLION Square Feet Under Construction 17.4 MILLION Square Feet Near Term 16.9 MILLION Square Feet Medium Term 97.4 MILLION Square Feet Long Term Summary of Projects PROJECTS COMPLETED (2001–3Q 2014) # OF PROJECTS SQ. FT. UNITS ROOMS ¢ Office 236 51,159,364 ¢ Retail 286 6,288,615 ¢ Residential 501 53,330,182 52,792 ¢ Hospitality 166 16,858,596 12,804 ¢ Education 159 13,107,526 Total Estimated Value of Projects: $43.4 billion PROJECTS UNDER CONSTRUCTION # OF PROJECTS SQ. FT. UNITS ROOMS ¢ Office 17 3,227,871 ¢ Retail 62 1,786,853 ¢ Residential 87 10,985,135 11,937 ¢ Hospitality 22 2,924,757 2,320 ¢ Education 21 3,515,317 Total Estimated Value of Projects: $9.2 billion PROJECTS NEAR TERM1 # OF PROJECTS SQ. FT. UNITS ROOMS ¢ Office 24 8,241,631 ¢ Retail 53 1,062,165 ¢ Residential 63 7,532,460 8,826 ¢ Hospitality 21 1,063,449 1,207 ¢ Education 7 492,047 Total Estimated Value of Projects: $4.9 billion PROJECTS MEDIUM TERM1 # OF PROJECTS SQ. FT. UNITS ROOMS ¢ Office 22 5,419,613 ¢ Retail 50 946,108 ¢ Residential 69 8,276,012 8,790 ¢ Hospitality 23 2,006,455 1,514 ¢ Education 6 84,000 Total Estimated Value of Projects: $4.8 billion PROJECTS LONG TERM1 # OF PROJECTS SQ. FT. UNITS ROOMS ¢ Office 58 34,540,568 ¢ Retail 78 3,541,754 ¢ Residential 70 35,293,065 35,258 ¢ Hospitality 29 2,303,896 2,129 ¢ Education 20 4,061,975 Total Estimated Value of Projects: $28.5 billion 1. For further explanation of these terms please see the Appendix
- 18. © 2014 Washington, DC Economic Partnership14 DEVELOPMENT OVERVIEW The figures below list the developers, architects and contractors that have been the most active in contributing to DC’s development activity since January 2010. 1. projects completed since 2010, under construction or in the pipeline (excludes government agencies and colleges/universities) Forest City Washington Douglas Development Corporation JAIR LYNCH Development Partners WC Smith The JBG Companies 10 7 7 24 7 8 23 13 4 3 20 3 4 11 18 6 2 6 8 14 MOST ACTIVE DEVELOPERS SINCE 2010 (# of projects)1 MOST ACTIVE ARCHITECTS SINCE 2010 (# of projects)1 MOST ACTIVE GENERAL CONTRACTORS SINCE 2010 (# of projects)1 Torti Gallas & Partners WDG Hickok Cole Architects Eric Colbert & Associates PC Bonstra Haresign Architects Shalom Baranes Associates 15 5 23 43 12 6 9 27 8 4 12 24 17 3 3111 7 7 2410 6 8 228 WCS Construction LLC Grunley Construction Forrester Construction Company Hamel Builders Clark Construction Group LLC 26 12 4 42 17 9 29 19 4 1 24 15 5 3 23 7 7 22 3 8 ¢ Completed ¢ Under Construction ¢ Pipeline Most Active Developers / Architects / Contractors
- 21. DC Development Report • 2014/2015 Edition 17 DEVELOPMENT BY SECTOR Office / Retail / Residential / Hospitality / Education
- 22. 3050 K Street, NW • Suite 125 • Washington, DC 20007 • main 202.719.9000 • MRPRealty.com Developing Great Places Developing Great Partnerships Developing Great Ideas
- 23. DC Development Report • 2014/2015 Edition 19 Development by Sector OFFICE
- 24. © 2014 Washington, DC Economic Partnership As office-using employment growth in DC lags behind the national average, DC’s office market continues to experience subdued velocity. Leasing activity for deals over 10,000 sq. ft. totaled approximately 2.1 million sq. ft. in Q3 2014. Although eight out of the top 10 largest deals were renewals–including some contractions–no new growth was observed in DC. As of Q3 2014, CBRE tracked the overall vacancy rate for the city at 11.3%, an increase of 90 basis points over the past year. The 12-month trailing total net absorption was negative 824,000 sq. ft., emphasizing the current lackluster environment in the DC office market. Though nearly 50% of the decrease in occupied space is due to one large tenant relocating from DC to Virginia (Intelsat), the number reflects the manner in which today’s tenants are using office space. In an attempt to reduce costs, firms–especially law firms–look to real estate costs to bump up their bottom line. Space efficiency trends such as free-address workstations and telecommuting are allowing for a more flexible work environment and reducing the need for office space. Over the past year, seven out of the top 10 largest law firm leases involved a contraction in space, decreasing the occupancy by an average of 22%. As the DC office market continues to grapple with uncertainty, landlords are looking to stabilize their assets by renewing tenants of all sizes before their lease expiration dates. Over the past 12 months, renewals accounted for 43% of lease transactions over 10,000 sq. ft. This number jumps to 63% when analyzing deals 50,000 sq. ft. or larger. New construction in DC remains limited, as the current under construction square footage is well below DC’s five-year annual average of 1.9 million sq. ft. There are currently 1.6 million sq. ft. of private sector space currently under construction, with a preleasing rate of 38%, mostly to legal firms.1 Venable LLP recently agreed to occupy 245,000 sq. ft. at 600 Massachusetts Avenue, NW, which broke ground in the third quarter of 2014. 660 North Capitol Street, NW, a 200,000-sq.-ft., trophy According to a CoreNet Global Real Estate survey in 2012, the national average of sq. ft. occupied per person dropped from 225 sq. ft. in 2010 to 175 sq. ft. in 2012 and is expected to reach 151 sq. ft. by 2017. Office Development in the District of Columbiaoffice DC OFFICE MARKET SNAPSHOT (3Q 2014)1 INVENTORY 125.4 Million Square Feet TOTAL VACANCY RATE 11.3% NET ABSORPTION –823,741 Square Feet (4Q 13–3Q 14) OVERALL AVG. ASKING RENTAL RATE $53.17 per square foot (full service) 1. CBRE Research
- 25. DC Development Report • 2014/2015 Edition 21 DC OFFICE LEASES: TOP 30 DEALS SIGNED (1Q 2014 – 3Q 2014)1 Office Development project in NoMa, also broke ground in the third quarter, though on a speculative basis. The project is the third building to break ground in DC on a speculative basis over the past 18 months, suggesting developers’ growing sense of confidence that leasing activity will strengthen in the coming years. Investment sales held steady across DC in 2014. During the first nine months of 2013, sales volume totaled $2.85 billion, compared to $2.86 billion during the same time period this year. The largest sale year to date was 555 12th Street, NW, which sold for $505 million, or approximately $640 per sq. ft.2 Over the past 20 years, the price per sq. ft. for Class A and B buildings over 50,000 sq. ft. has grown 7.6%, as institutional investors continue to seek a historically stable real estate market. While employment plays an important role in swaying office space demand, firms are focused on reducing overhead costs by employing greater efficiency in space use. As companies continue consolidation and densification, the expected increase in employment—particularly in the office-using sector—over the next two years will not lead to a well-defined expansion in their corporate footprint. Approximately 1.3 million sq. ft. of private sector office space is scheduled to deliver by 2015, and while demand is expected to strengthen, overall vacancy rates will remain elevated at above 11%. The trophy segment of the market, however, will continue to outperform other product types, as the development pipeline remains limited and a high demand for trophy space continues. Trends in Square Footage per Employee An emerging trend in the global office market, space efficiency has been substantially present in DC. A major driver of this trend is firms’ emphasis on maximizing their bottom line by cutting overhead costs. Firms, particularly in the legal services sector within DC, are focusing on reducing their overall space requirement as well as the average sq. ft. per employee. Meanwhile, advancements in technology have enabled for a paper-less environment due to laptops, mobile devices, and wireless internet. This has led to greater flexibility in the workplace due to the reduced need for permanent offices or dedicated office space. Open floor plans have reduced the amount of space needed by large offices while simultaneously creating a more collaborative environment; this is considered a win-win in today’s increasingly dynamic workplace. The trend is especially evident among the federal government and law firms, two of DC’s largest demand drivers. According to a CoreNet Global Real Estate survey in 2012, the national average of sq. ft. occupied per person dropped from 225 sq. ft. in 2010 to 175 sq. ft. in 2012 and is expected to reach 151 sq. ft. by 2017. Considering the benefits, it is no surprise this trend has gained notoriety and prominence. As firms have turned to more collaborative space use, their real estate strategy has become more efficient while proving beneficial to their bottom line. ¾ BY DEAL TYPE (YTD 2014) 26% 3% 70% New/Relet Renewal + Expansion Renewal BY INDUSTRY (Total Sq. Ft.) 6.1% 42% Government Creative Industries 38.7% Legal 4.7% 4.0% 1.7% 1.5% 1.3% Non-profits/ Business Associations Business Services Other Technology Telecommunications 1. CBRE Research 2. 800 17th Street was sold to TIAA-CREF and Norges Bank Investment Management for $1,075 per sq. ft. ($392 million) in 4Q 2014 (Washington, Business Journal, 10/31/14)
- 26. © 2014 Washington, DC Economic Partnership22 OFFICE DEVELOPMENT TENANT LOCATION SUBMARKET SQ. FT. DATE TYPE Federal Energy Regulatory Commission (GSA) 888 First St., NE NoMa 503,997 3Q 2014 Renewal Hogan Lovells 555 13th St., NW East End 384,650 2Q 2014 Renewal Department of Justice (GSA) 600 E St., NW East End 298,179 3Q 2014 Renewal Morgan, Lewis & Bockius LLP 1111 Pennsylvania Ave., NW East End 268,866 3Q 2014 Renewal The Washington Post 1301 K St., NW East End 249,898 2Q 2014 New Venable LLP 600 Massachusetts Ave., NW East End 245,000 3Q 2014 New Latham & Watkins 555 11th St., NW East End 238,300 1Q 2014 Renewal National Park Service (GSA) 1201 Eye St., NW East End 220,000 2Q 2014 Renewal The Department of Veterans Affairs (GSA) 1800 G St. NW CBD 163,917 2Q 2014 Renewal White & Case LLP 701 13th St., NW East End 147,999 2Q 2014 Renewal National Labor Relations Board (GSA) 1015 Half St., NE Capitol Riverfront 145,000 1Q 2014 New O’Melveny & Myers LLP 1625 Eye St., NW CBD 100,087 3Q 2014 Renewal Millennium Challenge Corp. 1099 14th St., NW East End 96,894 1Q 2014 New Reed Smith LLP 1301 K St., NW East End 79,692 2Q 2014 Renewal PhRMA 950 F St., NW East End 73,452 3Q 2014 Renewal European External Action Service (EU) 2175 K St., NW CBD 71,055 3Q 2014 Renewal USAO (GSA) 501 3rd St., NW Capitol Hill 70,000 2Q 2014 Renewal World Resources Institute 10 G St., NE NoMa 65,609 3Q 2014 Renewal Norton Rose Fulbright 799 9th St., NW East End 65,000 1Q 2014 New Boies Schiller & Flexner 5301 Wisconsin Ave., NW Uptown 63,241 2Q 2014 Renewal/Expansion DC Courts 616 H St., NW East End 63,000 1Q 2014 Renewal Palantir Technology 1025 Thomas Jefferson St., NW Georgetown 61,000 3Q 2014 New FCC (GSA) 1250 Maryland Ave., SW Southwest 56,500 1Q 2014 Renewal Mercer Inc 1050 Connecticut Ave., NW CBD 56,460 1Q 2014 New IBM 800 K St., NW East End 56,269 1Q 2014 Renewal SSA (GSA) 500 E St., SW Southwest 55,745 1Q 2014 Renewal U.S. Department of the Treasury (GSA) 1722 EYE St., NW CBD 54,771 2Q 2014 New Verizon 1300 Eye St., NW East End 54,035 3Q 2014 Renewal National Cable & Telecommunications Association 25 Massachusetts Ave., NW Capitol Hill 52,944 1Q 2014 Renewal Accenture 370 L’Enfant Promenade, SW Southwest 52,878 3Q 2014 Renewal Source: CBRE Research DC OFFICE LEASES: TOP 30 DEALS SIGNED (1Q 2014 - 3Q 2014)
- 27. DC Development Report • 2014/2015 Edition 23 Development Overview OFFICE PROJECTS (September 2014, office sq. ft. in millions) average office sq. ft. delivered per year (2001–2013) MILLION 3.86 OFFICE DEVELOPMENT (September 2014) PROJECTS OFFICE SQ. FT. Completed 236 51,159,364 2001 27 6,331,725 2002 23 3,013,280 2003 19 2,769,592 2004 12 3,201,153 2005 17 3,622,716 2006 25 5,903,380 2007 16 4,276,463 2008 20 3,236,473 2009 23 6,033,060 2010 10 3,408,455 2011 10 2,442,869 2012 8 1,531,946 2013 20 4,469,239 2014 YTD 6 919,013 Under Construction 17 3,227,871 2014 delivery 1 80,549 2015 delivery 9 1,345,312 2016 delivery 4 938,592 2017+ delivery 3 863,418 Pipeline 104 48,201,812 Near Term 24 8,241,631 Medium Term 22 5,419,613 Long Term 58 34,540,568 TOTAL 357 102,589,047 COMPLETEDGROUNDBREAKINGS GovernmentPrivate GovernmentPrivate Government (projected)Private (projected) 2012 2011 2010 2009 2008 2007 2006 2005 2004 2003 2002 2001 2000 2013 2013 2012 2011 2010 2009 2008 2007 2006 2005 2004 2003 2002 2001 20141 20151 20161 2.4 2.1 4.5 0.7 0.9 1.5 1.3 1.2 2.4 2.7 0.7 3.4 5.6 0.4 6.0 2.0 1.2 3.2 3.7 0.6 4.3 4.4 1.5 5.9 3.6 3.6 2.0 1.2 3.2 2.8 2.8 3.0 3.0 4.1 2.3 6.3 1.3 0.1 1.3 0.7 0.3 0.9 0.5 0.4 1.00.1 3.3 3.8 3.3 4.1 2.2 0.6 2.9 4.9 5.3 2.8 1.4 4.2 3.8 0.4 4.1 3.0 0.5 3.5 0.9 1.1 2.0 0.7 2.9 3.6 1.2 0.4 1.6 1.3 0.2 1.6 1.1 0.2 1.2 1.3 0.5 1.82014 YTD 3.1 3.1 4.7 4.7 0.5 0.8 0.4 1. projections based on targeted delivery dates of projects under construction as of September 2014
- 28. Alexandria NATIONAL AIRPORT M M M 1 395 M 66 GEORGEW ASHIN G TO N M E M O RIALPKW Y VIRGINIA VIRGINIA NATIONAL MALL U.S. CAPITOL ROCK CREEK PARK NEW YORK AVERHODE ISLAND AVE GEORGIAAVE E. CAPITOL ST. H ST. CONNECTICUTAVE FORT DUPONT PARK MARTINLUTHERKINGJR.AVE. NATIONALS PARK UNION STATION U ST. 14THST. DEVELOPMENT MAP OFFICE 1 2 3 56 47 8 9 10 11 12 13 14 15 16 1718 19 20 21 22 23 24 25 2627 28 29 30 Completed Under Construction Pipeline
- 29. DC Development Report • 2014/2015 Edition 25 Development Pipeline 1. may include non-office components & pipeline values may include additional phases ($ in millions) 2. delivery date may reflect phase I delivery or final phase delivery for pipeline projects PROJECT WARD LOCATION DEVELOPER(S) OFFICE SF EST. VALUE ($M) 1 DELIVERY2 TOP OFFICE PROJECTS COMPLETED (4Q 2013–3Q 2014) 1 CityCenterDC 2 9th, 10th, 11th, H, & I Sts., NW Hines/The First Investor 515,000 $700 4Q 13 2 GSA Headquarters (Ph I) 2 1800 F St., NW GSA 387,824 $161 4Q 13 3 3 Constitution Square 6 175 N St., NE StonebridgeCarras LLC/ Walton Street Capital 344,000 $140 4Q 13 4 Sentinel Square (Ph II) 6 1050 1st St., NE Trammell Crow Company 265,480 $110 4Q 13 5 440 1st Street 6 440 1st St., NW First Potomac Realty Trust 134,000 $40 4Q 13 6 1700 New York Avenue 2 1700 New York Ave., NW Carr Development 124,000 $80 4Q 13 7 Association of American Medical Colleges 6 655 K St., NW Hines/JM Zell 273,200 $115 2Q 14 8 Sidney Yates Building Renovation 6 14th St. & Independence Ave., SW GSA 180,000 $24 2Q 14 9 U.S. Department of Commerce - Herbert Hoover Building (Ph III) 2 14th & Constitution Ave., NW GSA 246,813 $58 3Q 14 10 1200 17th Street 2 1200 17th St., NW Akridge/Mitsui Fudosan America 162,000 $120 3Q 14 TOP OFFICE PROJECTS UNDER CONSTRUCTION 11 National Square 6 500 D St., SW Trammell Crow Company 342,000 $140 3Q 15 12 601 Massachusetts Avenue 6 601 Massachusetts Ave., NW Boston Properties 460,500 $150 4Q 15 13 2001 M Street 2 2001 M St., NW Brookfield Properties 285,000 4Q 15 14 Department of the Interior (Ph VI) 2 1849 C St., NW GSA 250,000 $60 1Q 16 15 Republic Square (Ph II) 6 660 North Capitol St., NW Republic Properties Corporation 185,000 $65 1Q 16 16 900 16th Street 2 900 16th St., NW The JBG Companies 122,000 1Q 16 17 600 Massachusetts Avenue 2 600 Massachusetts Ave., NW Gould Property Company/ Oxford Properties Group 381,592 $206 3Q 16 18 Lafayette Building 2 811 Vermont Ave., NW GSA 466,818 $112 1Q 17 19 The Wharf (Ph I) 6 Southwest Waterfront Hoffman-Madison Waterfront 230,000 $806 4Q 17 20 Harry S.Truman Building Modernization 2 2201 C St., NW GSA 166,600 $97 2Q 18 TOP OFFICE PROJECTS PIPELINE (Near Term) 21 U.S. Department of Commerce - Herbert Hoover Building (Ph IV) 2 14th & Constitution Ave., NW GSA 1,648,821 $63 2016 22 4000 Connecticut Avenue 3 4000 Connecticut Ave., NW The 601 W Companies 620,000 $45 2016 23 1800 K Street 2 1800 K St., NW Deutsche Asset & Wealth Management 185,000 $40 2016 24 Hine Junior High School 6 700 Pennsylvania Ave., SE Stanton Development Corp./EastBanc/ Dantes Partners/Jarvis Co. 160,000 $190 2016 25 1000 F Street 2 1000 F St., NW Douglas Development Corporation 94,000 $32 2016 26 Capitol Crossing (North Block) 2 I-395 at 3rd St. & Massachusetts Ave., NW Property Group Partners/Center Place Holdings LLC 936,000 2017 27 Consumer Financial Protection Bureau HQ Modernization 2 1700 G St., NW GSA 503,000 $139 2017 28 Storey Park 6 1005 1st St., NE Perseus Realty/First Potomac Realty Trust 350,000 2017 29 Center Building (DHS HQ) 8 St. Elizabeths West Campus GSA 270,000 $139 2017 30 2100 K Street 2 2100 K St., NW Blake Real Estate 150,000 2018
- 30. © 2014 Washington, DC Economic Partnership26 OFFICE DEVELOPMENT Development Highlights 1200 17th Street WARD 2 LOCATION: 1200 17th Street, NW DEVELOPER(S): Akridge/Mitsui Fudosan America ARCHITECT(S): ZGF Architects LLP CONTRACTOR(S): Balfour Beatty Construction LEED: Platinum EST. COST: $120 million STATUS: Completed TARGETED DELIVERY: 3Q 2014 SPECS: The 169,000 sq. ft. trophy office building was built on the site of the former headquarters building for the National Restaurant Association. The building offers floor-to-ceiling glass, column-free interiors and up to 6,000 sq. ft. of retail/restaurant space. Pillsbury Winthrop Shaw Pittman is the anchor office tenant. 900 16th Street WARD 2 LOCATION: 900 16th Street, NW DEVELOPER(S): The JBG Companies ARCHITECT(S): Cooper Carry Inc CONTRACTOR(S): James G Davis Construction Corporation LEED: Gold STATUS: Under Construction TARGETED DELIVERY: 1Q 2016 SPECS: The former Brutalist-style Third Church of Christ, Scientist building was demolished and will be replaced by a 140,000 sq. ft. office building with 5,100 sq. ft. of retail space and a new 11,722 sq. ft. church. 1000 F Street WARD 2 LOCATION: 1000 F Street, NW DEVELOPER(S): Douglas Development Corporation ARCHITECT(S): Shalom Baranes Associates CONTRACTOR(S): James G Davis Construction Corporation LEED: Gold EST. COST: $32 million STATUS: Near Term TARGETED DELIVERY: 3Q 2016 SPECS: 1000 F Street will be an 11-story, 100,000 sq. ft. office building with 7,000 sq. ft. of ground floor retail, anchored by American Eagle. An existing two-story historic structure on the site will be incorporated into the development. 2235 Shannon Place WARD 8 LOCATION: 2235 Shannon Place, SE DEVELOPER(S): Curtis Development/Four Points LLC ARCHITECT(S): PGN Architects PLLC CONTRACTOR(S): Forrester Construction Company EST. COST: $25 million STATUS: Under Construction TARGETED DELIVERY: 4Q 2014 SPECS: The existing four-story building will undergo a gut-rehabilitation, receive a new glass façade and a new penthouse. The 82,000 sq. ft. office building will be home to the DC Taxicab Commission, DC Lottery and DDOT’s Business Opportunity & Workforce Development Center. The building was a former evidence warehouse. ImagecourtesyofCoStar ImagecourtesyofAkridgeImagecourtesyofCoStar
- 31. DC Development Report • 2014/2015 Edition 27 Development Highlights The Lumber Shed WARD 6 LOCATION: 301 Water Street, SE DEVELOPER(S): Forest City Washington ARCHITECT(S): Gensler CONTRACTOR(S): Monarc Construction EST. COST: $13 million STATUS: Completed TARGETED DELIVERY: 3Q 2013 SPECS: The Lumber Shed project is an adaptive reuse of a former Navy Yard industrial building used for storing and drying lumber. The two-level 29,500 sq. ft. building was transformed into restaurant space on the first floor (Osteria Morini, Agua 301, Ice Cream Jubilee) and office space on the second floor (Forest City Washington). Association of American Medical Colleges (AAMC) WARD 6 LOCATION: 655 K Street, NW DEVELOPER(S): Hines/JM Zell ARCHITECT(S): Shalom Baranes Associates CONTRACTOR(S): Clark Construction Group LLC LEED: Gold EST. COST: $115 million STATUS: Completed TARGETED DELIVERY: 2Q 2014 SPECS: The AAMC’s new 290,000 sq. ft. headquarters includes 14,300 sq. ft. of retail space. The four existing buildings on the site were renovated and incorporated into the final design. Storey Park WARD 6 LOCATION: 1005 1st Street, NE DEVELOPER(S): Perseus Realty/First Potomac Realty Trust ARCHITECT(S): HKS PC LEED: Gold STATUS: Near Term TARGETED DELIVERY: 2017 SPECS: A 683,000 sq. ft. mixed-use development will be built on the former Greyhound Station site in NoMa. Plans call for 350,000 sq. ft. of office space, 65,000 sq. ft. of retail space and 300 residential units. Construction could start in 2015. National Square WARD 6 LOCATION: 500 D Street, SW DEVELOPER(S): Trammell Crow Company ARCHITECT(S): Gensler CONTRACTOR(S): Clark Construction Group LLC LEED: Silver EST. COST: $140 million STATUS: Under Construction TARGETED DELIVERY: 3Q 2015 SPECS: National Square will be a new 12-story, 342,000 sq. ft. highly secure office building located at the corner of 6th & D Streets, SW across the street from the L’Enfant Metrorail Station. The existing 134,000 sq. ft. Class-B office building on the site was demolished. ImagecourtesyoftheTrammellCrowCompany ImagecourtesyofFirstPotomacRealtyTrust
- 32. © 2014 Washington, DC Economic Partnership28 OFFICE DEVELOPMENT Development Highlights 601 Massachusetts Avenue WARD 6 LOCATION: 601 Massachusetts Avenue, NW DEVELOPER(S): Boston Properties ARCHITECT(S): Duda Paine Architects CONTRACTOR(S): Clark Construction Group LLC LEED: Gold EST. COST: $150 million STATUS: Under Construction TARGETED DELIVERY: 4Q 2015 SPECS: This eleven-story office building will offer 460,500 sq. ft. of office space (anchored by Arnold & Porter) and 18,300 sq. ft. of retail/restaurant space. The main lobby includes a nine-story atrium, scaling down to a two-story space prior to reaching the West Tower and East Tower elevator lobbies. GSA Headquarters (Phase I) WARD 2 LOCATION: 1800 F Street, NW DEVELOPER(S): GSA ARCHITECT(S): Shalom Baranes Associates CONTRACTOR(S): Whiting-Turner Contracting Company/ Walsh Construction LEED: Gold EST. COST: $161 million STATUS: Completed TARGETED DELIVERY: 4Q 2013 SPECS: Phase I involved the complete renovation of 388,326 sq. ft. (gross) of existing office space and the addition of 102,000 sq. ft. (gross) as new courtyard infill office space. GSA workers started moving back into the building in 2Q 2013. Burnham Place at Union Station WARD 6 LOCATION: Union Station Air Rights DEVELOPER(S): Akridge ARCHITECT(S): Shalom Baranes Associates EST. COST: $1.3 billion STATUS: Long Term TARGETED DELIVERY: 2022 (Ph I) Burnham Place is a three million square foot development that will create a new neighborhood above the rail yards north of Union Station. Plans call for 1.5 million sq. ft. of office space, 100,000 sq. ft. of retail space, 400 hotel rooms and 1,300 residential units. 1728 14th Street WARD 2 LOCATION: 1728 14th Street, NW DEVELOPER(S): Perseus Realty ARCHITECT(S): Bonstra | Haresign Architects CONTRACTOR(S): Turner Construction Company EST. COST: $10 million STATUS: Completed TARGETED DELIVERY: 3Q 2014 SPECS: 1728 14th Street is a new four-story, 28,500 sq. ft. office building with 14,500 sq. ft. of ground floor and second floor retail space anchored by West Elm. Bonstra Haresign Architects will occupy the third-floor office space. ImagecourtesyofAkridgeImagecourtesyofBostonProperties
- 33. DC Development Report • 2014/2015 Edition 29 Development Highlights 600 Massachusetts Avenue WARD 2 LOCATION: 600 Massachusetts Avenue, NW DEVELOPER(S): Gould Property Company/Oxford Properties Group ARCHITECT(S): CORE CONTRACTOR(S): Clark Construction Group LLC LEED: Platinum EST. COST: $206 million STATUS: Under Construction TARGETED DELIVERY: 3Q 2016 SPECS: 600 Massachusetts Avenue will be a 10-story, 401,000 sq. ft. class-A office building with 19,418 sq. ft. of retail space. Venable will be the anchor office tenant. The project involves renovating and moving two row houses on the site. 900 G Street WARD 2 LOCATION: 900 G Street, NW DEVELOPER(S): MRP Realty/ASB Real Estate ARCHITECT(S): Gensler CONTRACTOR(S): James G Davis Construction Corporation LEED: Gold EST. COST: $65 million STATUS: Under Construction TARGETED DELIVERY: 1Q 2015 SPECS: The former YWCA building was demolished and will be replaced by nine-story, 110,000 sq. ft. office building with 6,500 sq. ft. of retail space. Capitol Crossing WARD 2 LOCATION: I-395 at 3rd St. & Massachusetts Avenue, NW DEVELOPER(S): Property Group Partners/Center Place Holdings LLC ARCHITECT(S): Kevin Roche John Dinkeloo & Associates LLC/SOM/ Kohn Pedersen Fox & Associates CONTRACTOR(S): Balfour Beatty Construction LEED: Platinum EST. COST: $1.3 billion STATUS: Under Construction (Platform) TARGETED DELIVERY: 2017 (Ph I) SPECS: Capitol Crossing will be a 2.2 million sq. ft. mixed-use development built above I-395. Upon full built-out the project will offer 1.9 million sq. ft. of office space, 63,000 sq. ft. of retail space, 150 residential units and a new Jewish Historical Society Synagogue. Utility work began in 1Q 2014 with the delivery of the office buildings (954,000 sq. ft.) in the North Block expected in 2017. Square 5914 WARD 8 LOCATION: 1290 Alabama Avenue, SE DEVELOPER(S): City Partners LLC/Sanford Capital ARCHITECT(S): Maurice Walters LEED: Gold EST. COST: $95 million STATUS: Medium term TARGETED DELIVERY: 2017 SPECS: The project is adjacent to the Congress Heights Metrorail Station and will be developed into a 236,000 sq. ft. office building with 8,600 sq. ft. retail space and a 206-unit apartment building with 6,500 sq. ft. of retail space. ImagecourtesyGouldPropertyCompany ImagecourtesyofCityPartnersLLC ImagecourtesyofPropertyGroupPartners
- 34. Tara Scanlon | Partner Practice Group Leader Mid-Atlantic Region Real Estate Washington, DC | 202.457.7150 Northern Virginia | 703.720.8600 Copyright © 2014 Holland & Knight LLP All Rights Reserved www.hklaw.com We don’t just know the law, we know the business. Holland & Knight’s Real Estate Practice — we are here to help you reach new heights.
- 35. DC Development Report • 2014/2015 Edition 31 Development by Sector RETAIL
- 36. © 2014 Washington, DC Economic Partnership Retail sales in the District of Columbia account for approximately 79% of the $13 billion in total consumer expenditures, creating a retail opportunity gap of an estimated $2.8 billion.3 This strong retail demand is related in-part to DC’s high volume of tourists. A record-breaking 19.0 million tourists traveled to DC in 2013. These millions of tourists spent a total of $6.69 billion during their visits, which comprised 8.9% and 5.9% increases in domestic and international tourist spending, respectively.4 DestinationDC expects total visitor volume to grow by 2 to 3% each year through 2017.4 Local purchasing capacity also influences retail demand in DC. The city’s estimated median household income is projected to rise 15.0% over the next five years to $77,143 in 2019. In comparison, the U.S. is projected to see a 4.0% increase from the current year median household income of $51,352. The statistics detailed above show DC’s potential for growth in retail demand.5 The DC retail market has experienced several significant shifts, one of which is the expansion of the restaurant scene. A host of restaurants have opened in recent years in areas such as the 14th Street and H Street corridors, and have played an instrumental role in transforming DC’s retail sector. This trend has continued in 2014, as indicated in the graph on the following page by the projected 4.5% jump in sales for food services and drinking places.6 The city’s estimated median household income is projected to rise 15.0% over the next five years to $77,143 in 2019. Retail Development in the District of Columbiaretail DC RETAIL MARKET SNAPSHOT (3Q 2014) NEW GROCERY STORES7 6 under construction TAXABLE RETAIL & RESTAURANT SALES1 (2013) $11.5 billion (13.8% increase since 2010) RETAIL SF UNDER CONSTRUCTION 1.8 million square feet POPULATION GROWTH2 +6.8% 2010–2013 1. Office of the Chief Financial Officer (FY 2015 Proposed Budget & Financial Plan) 2. U.S. Census 3. Nielson 4. Destination DC (2013) 5. Nielson 6. Moody’s Analytics 7. Harris Teeter (1212 4th St., SE), Giant (3336 Wisconsin Ave., NW) and MOM’s (1501 New York Ave., NE) opened in 4Q 2014
- 37. DC Development Report • 2014/2015 Edition 33 Retail Development DC RETAIL SALES GROWTH (Q2 2014 over Q2 2013, trailing four quarters) The openings of DBGB, Del Frisco’s Double Eagle Steakhouse and Le Diplomate illustrate this restaurant-centric trend. Rose’s Luxury, which recently opened in DC, was ranked as the number one restaurant in the U.S. in 2014.8 These high-end openings coincided with numerous quick-serve openings. DC claimed the third best growth market for quick service restaurants in a 2014 study that examined quick-serve restaurant traffic growth forecasts for 2013 to 2018.9 The restaurant industry’s growth indicates the ever-evolving character of DC’s retail landscape. While sales increased for food services and drinking places, the increase was even more dramatic for other sectors, including: clothing & clothing accessories, food & beverage, general merchandise, furniture, and health & personal care stores. Over the past year, retail sales for general merchandise have increased an estimated 27.3%, by roughly the same percentage that non-store retailer sales have declined. Thus, DC retail sales have experienced an overall increase from 2013 to 2014, but performance has varied considerably according to segment.10 Finally, the opening of CityCenterDC, a 1.6 million-sq.-ft., mixed-use development (with 185,000 sq. ft. of retail space), was a capstone event for DC’s growing urban retail market. In planning and design since 2003, CityCenterDC has provided a high- end retail anchor in the downtown with retailers such as Allen Edmonds, Hugo Boss, Burberry, Longchamp and Arc’teryx. ¾ -25% -20 -15 -10 -5 0 5 10 15 20 25 30% Food services and drinking places Total Retail Sales Clothing & clothing accessories stores Food & beverage stores Furniture & home furnishing stores Health & personal care stores Electronics & applicance stores General merchandise stores Sporting goods; hobby; book; & music stores Gasoline stations Nonstore retailers -25.5% -4.4% 1.8% 4.5% 5.4% 6.0% 9.5% 12.7% 14.7% 18.6% 27.3% Source: Moody’s Analytics AVERAGE RETAIL RENTAL RATES PER SUBMARKET SUBMARKET PER SQ. FT. RANGE Capitol Hill High $30s - $65 Capitol Riverfront $35 - $50 CBD $45 - $125 East End $45 - $125 Georgetown $55 - $200 H St. NE $35 - $55 NoMa $35 - $50 Northeast $30 – High $40s Southwest Low $30 - $55 Uptown $35 - $70 West End $40 - $55 Source: CBRE Research 8. Bon Appetit (8/19/14) 9. The NPD Group/QSR 10. Moody’s Analytics
- 38. © 2014 Washington, DC Economic Partnership34 RETAIL DEVELOPMENT Development Highlights It’s the view to one of DC’s most iconic neighborhoods—the birthplace of Duke Ellington and the local jazz scene—which also happens to be a modern cultural gem. It’s the view to life at City Market at O. Start your day with a grande at Starbucks. Grocery shop at the reimagined O Street Market, now home to Giant. Dine at Convivial, opening this spring. Take your pooch and head out of your luxe apartment for a stroll that ends up in your very own dog park. Take a swim in the rooftop infinity pool. Then settle in with a nightcap by the outdoor firepit. You’re in your element. And on top of the world. O, the view from the top. © Maxwell Mackenzie800 P STREET, NW WASHINGTON, DC 20001 • CITYMARKETATO.COM the new element of style. TOP RETAIL LEASES (YTD 2014) COMPANY NAME ADDRESS BUILDING/PROJECT NAME SQ. FT. 1 NEIGHBORHOOD Lowe’s2 33rd Street & South Dakota Avenue, NE Shops at Dakota Crossing 136,000 Fort Lincoln/Dakota Crossing Walmart 58th & East Capitol Streets, NE Capitol Gateway Marketplace 135,000 East Capitol Street/Capitol Gateway Whole Foods 600 H Street, NE Apollo 39,000 H Street, NE Marshall’s 5333 Wisconsin Avenue, NW Friendship Center 29,000 Chevy Chase/Friendship Heights Saks Fifth Avenue3 5300 Wisconsin Avenue, NW Mazza Gallerie 22,055 Chevy Chase/Friendship Heights Walgreens 1155 F Street, NW 19,500 Downtown DC Planet Fitness 1401 New York Avenue, NE Hecht Warehouse District 19,000 New York Ave/Bladensburg Road Old Navy 5335 Wisconsin Avenue, NW Chevy Chase Pavilion 18,000 Uptown MOM’s Organic Market 1401 New York Avenue, NE Hecht Warehouse District 16,000 New York Avenue/Bladensburg Road GAP 1155 F Street, NW 14,000 Downtown DC Petco 1401 New York Avenue, NE Hecht Warehouse District 12,000 Northeast Theodore’s3 2233 Wisconsin Avenue, NW 11,000 Glover Park CVS Caremark 1275 Pennsylvania Avenue, NW 10,000 Downtown DC One to One Fitness, Inc. 1750 K Street, NW 9,000 Golden Triangle Momofuku 850 10th Street, NW CityCenterDC 9,000 Downtown DC Paul Stuart 875 10th Street, NW CityCenterDC 8,000 Downtown DC Texas de Brazil 455 Massachusetts Avenue, NW 8,000 Mt.Vernon Triangle Passion Food Hospitality, LLC 700 6th Street, NW 8,000 Downtown DC Hugo Boss 800 10th Street, NW CityCenterDC 6,500 Downtown DC Mindful Restaurant Group 1401 New York Avenue, NE Hecht Warehouse District 6,000 New York Avenue/Bladensburg Road Ferragamo 1001 H Street, NW CityCenterDC 4,000 Downtown DC 1. rounded to nearest thousand 2. purchased a pad site for $3.58 million (Washington Business Journal, 8/21/14) 3. renewal
- 39. DC Development Report • 2014/2015 Edition 35 Development Overview 1. projections based on targeted delivery dates of projects under construction as of September 2014 RETAIL PROJECTS (September 2014, retail sq. ft.) In 2014 DC will open its 28th new grocery store since 2000. 28 RETAIL DEVELOPMENT (September 2014) PROJECTS RETAIL SQ. FT. Completed 286 6,288,615 2001 18 226,178 2002 22 311,800 2003 19 347,229 2004 22 369,208 2005 26 711,923 2006 24 294,862 2007 22 378,658 2008 22 867,131 2009 27 265,943 2010 10 330,700 2011 11 312,345 2012 16 314,324 2013 28 1,067,236 2014 YTD 19 491,078 Under Construction 62 1,786,853 2014 delivery 13 192,337 2015 delivery 31 841,157 2016 delivery 14 229,359 2017+ delivery 4 524,000 Pipeline 181 5,550,027 Near Term 53 1,062,165 Medium Term 50 946,108 Long Term 78 3,541,754 TOTAL 529 13,625,495 COMPLETED 2014 YTD 2013 2012 2011 2010 2009 2008 2007 2006 2005 2004 2003 2002 2001 2000 GROUNDBREAKINGS 226,178 311,800 347,229 369,208 711,923 294,862 378,658 867,131 265,943 330,700 312,345 314,324 111,800 555,610 323,849 570,488 293,481 439,866 911,203 262,547 239,150 265,276 301,840 654,230 1,035,426 694,485 Projected 1,050,839 1,067,236 491,078 192,337 841,157 229,359 20141 2013 2012 2011 2010 2009 2008 2007 2006 2005 2004 2003 2002 2001 20151 20161 683,415
- 40. Alexandria NATIONAL AIRPORT M M M 1 395 M 66 GEORGEW ASHIN G TO N M E M O RIALPKW Y VIRGINIA VIRGINIA NATIONAL MALL U.S. CAPITOL ROCK CREEK PARK NEW YORK AVERHODE ISLAND AVE GEORGIAAVE E. CAPITOL ST. H ST. CONNECTICUTAVE FORT DUPONT PARK MARTINLUTHERKINGJR.AVE. NATIONALS PARK UNION STATION U ST. 14THST. DEVELOPMENT MAP RETAIL 1 2 3 4 5 6 7 8 9 10 11 12 13 14 15 16 17 18 19 20 21 22 23 24 25 26 27 28 29 30 Completed Under Construction Pipeline
- 41. DC Development Report • 2014/2015 Edition 37 Development Pipeline 1. may include non-retail components & pipeline values may include additional phases ($ in millions) 2. delivery date may reflect phase I delivery or final phase delivery for pipeline projects PROJECT WARD LOCATION DEVELOPER(S) RETAIL SF EST. VALUE ($M)1 DELIVERY2 TOP RETAIL PROJECTS COMPLETED (4Q 2013–3Q 2014) 1 The Shops at Georgetown Park 2 3222 M St., NW AG Georgetown Park Holdings/Vornado/CES 330,000 $32 4Q 13 2 CityCenterDC 2 9th, 10th, 11th, H, & I Sts., NW Hines/The First Investor 185,000 $700 4Q 13 3 Walmart on Georgia Avenue 4 5929 Georgia Ave., NW Foulger-Pratt 106,000 4Q 13 4 77 H 6 1st & H Sts., NW The JBG Companies/Bennett Group 86,000 $90 4Q 13 5 CityMarket at O (Ph I - Giant) 6 1400 7th St., NW Roadside Development 75,000 $35 4Q 13 6 L’Enfant Plaza Redevelopment (Ph II) 6 950 L’Enfant Plaza, SW The JBG Companies 93,000 $17 2Q 14 7 Twelve12 6 1212 4th St., SE Forest City Washington 88,000 $100 2Q 14 8 Monroe Street Market 5 700 - 800 blocks of Monroe St., NE Abdo Development/Bozzuto Group/Catholic University 56,915 $150 2Q 14 9 The Louis at 14th 2 1420 U St., NW The JBG Companies/Georgetown Strategic Capital 44,000 $100 2Q 14 10 The Swift 4 3830 Georgia Ave., NW Duball LLC/Safeway 62,000 $65 3Q 14 TOP RETAIL PROJECTS UNDER CONSTRUCTION 11 Cathedral Commons 3 3336 & 3400-3430 Wisconsin Ave., NW Giant Food/Bozzuto Group/Southside Investment Partners 125,000 $130 4Q 14 12 Hecht Warehouse District 5 1401 New York Ave., NE Douglas Development Corporation 200,800 4Q 14/2015 13 2251 Wisconsin Avenue 3 2251-2255 Wisconsin Ave., NW Altus Realty Partners/Chesapeake Realty Partners 28,277 $32 1Q 15 14 Fort Totten Square 4 South Dakota Ave. & Riggs Rd., NE The JBG Companies/Lowe Enterprises 130,000 $120 2Q 15 15 The Shops at Dakota Crossing (Ph II) 5 New York Ave. & South Dakota Ave., NE Fort Lincoln New Town Corporation/Trammell Crow Company/CSG Urban Partners 266,000 $40 3Q 15 16 800 New Jersey Avenue 6 New Jersey Ave. & H St., SE WC Smith 35,000 $135 3Q 16 17 Apollo 6 610 H St., NE Insight Property Group LLC 75,000 $190 4Q 16 18 ART Place at Fort Totten (Ph I) 5 5180 South Dakota Ave., NE Cafritz Foundation 104,000 $117 2Q 17 19 The Wharf (Ph I) 6 Southwest Waterfront Hoffman-Madison Waterfront 190,000 $806 4Q 17 20 Skyland Town Center (Ph I) 7 Alabama Ave. & Naylor Rd., SE Rappaport/WC Smith/Marshall Heights CDO 220,000 $150 2017/18 TOP RETAIL PROJECTS PIPELINE (Near Term) 21 Capitol Gateway Marketplace 7 58th & East Capitol Sts., NE A&R Development/DCHA/Henson Dev. Co. 167,450 $120 2016 22 Georgia Eastern 4 7828 Georgia Ave., NW Douglas Development Corporation 60,000 2016/17 23 Hine Junior High School 6 700 Pennsylvania Ave., SE Stanton Development Corp./EastBanc/Dantes Partners/ Jarvis Co. 40,000 $190 2016/17 24 The Line DC 1 1780 Columbia Rd., NW Friedman Capital Advisors/Foxhall Partners/Sydell Group 20,903 $100 2016/17 25 The Riverfront 6 100 Potomac Ave., SE FRP Development Corp./MRP Realty 18,650 $100 2016/17 26 Storey Park 6 1005 1st St., NE Perseus Realty/First Potomac Realty Trust 65,000 2017 27 Prospect Place 2 3220 Prospect St., NW McCaffery Interests 27,600 2017 28 Gateway Market 5 340 Florida Ave., NE LCOR Inc./EDENS 27,410 $55 2017 29 CityCenterDC (Conrad Hotel) 2 10th & New York Ave., NW Hines 70,000 2018 30 Uline Arena 6 1140 3rd St., NE Douglas Development Corporation 50,000 $120
- 42. © 2014 Washington, DC Economic Partnership38 RETAIL DEVELOPMENT Development Highlights CityCenterDC WARD 2 LOCATION: 9th, 10th, 11th, H, & I Streets, NW DEVELOPER(S): Hines/The First Investor ARCHITECT(S): Foster & Partners/Shalom Baranes Associates/Lee and Associates Inc CONTRACTOR(S): Clark Construction Group LLC/Smoot Construction LEED: Gold EST. COST: $700 million STATUS: Completed TARGETED DELIVERY: 4Q 13–2Q 14 SPECS:The redevelopment of the southern portion (Parcel A) of the former convention center site includes 515,000 sq. ft. of office space, 185,000 sq. ft. of retail space and 674 apartments and condominiums. The Parks at Walter Reed WARD 4 LOCATION: 6800 Georgia Avenue, NW DEVELOPER(S): Hines/Urban Atlantic/Triden Development Group/ DMPED EST. COST: $1 billion STATUS: Long Term SPECS: 66.57 acres of the 110.1-acre campus will be redeveloped into approximately 3.1 million sq. ft. of mixed-use development. The proposed development includes 2,097 residential units, up to 250,000 sq. ft. of retail space, 770,000 sq. ft. of office/medical/education space and 20 acres of open space. Hecht Warehouse District WARD 5 LOCATION: 1401 New York Avenue, NE DEVELOPER(S): Douglas Development Corporation ARCHITECT(S): Shalom Baranes Associates/Antunovich Associates CONTRACTOR(S): Clark Construction Group LLC/McCullough Construction LLC STATUS: Under Construction TARGETED DELIVERY: 4Q 14–2015 SPECS: The redevelopment plan calls for 330 apartments and 200,800 sq. ft. of retail space on the 9.8-acre site. The historic Hecht’s Warehouse will be converted into apartments and retail. An adjacent building will include one floor of retail below a parking garage. MOM’s Organic Market opened a 16,000 sq. ft. store in November 2014. The Louis at 14th WARD 2 LOCATION: 1420 U Street, NW DEVELOPER(S): The JBG Companies/Georgetown Strategic Capital LLC ARCHITECT(S): Eric Colbert & Associates PC CONTRACTOR(S): Balfour Beatty Construction LEED: Silver EST. COST: $100 million STATUS: Completed TARGETED DELIVERY: 2Q 2014 SPECS: The Louis at 14 is a nine-story, mixed-use building with 268 apartments and 44,000 sq. ft. of retail space (anchored by a Trader Joe’s grocery store). JBG sold the project to TIAA-CREF in June 2014. ImagecourtesyofUrbanAtlantic ImagecourtesyofDouglasDevelopment
- 43. DC Development Report • 2014/2015 Edition 39 Development Highlights 1270 4th Street WARD 5 LOCATION: 1270 4th Street, NE DEVELOPER(S): EDENS/Level 2 Development ARCHITECT(S): Shalom Baranes Associates STATUS: Near Term TARGETED DELIVERY: 2017 SPECS: This proposed 11-story, 408,000 sq. ft., 420 to 520-unit residential building will offer up to 40,000 sq. ft. of retail space. The project is part of the eight million sq. ft. Union Market District proposed redevelopment vision. Skyland Town Center (Phase I) WARD 7 LOCATION: Alabama Avenue & Naylor Road, SE DEVELOPER(S): Rappaport/WC Smith/Marshall Heights CDO ARCHITECT(S): Torti Gallas & Partners CONTRACTOR(S): WCS Construction LLC/L. F. Jennings Inc. LEED: Silver EST. COST: $150 million STATUS: Under Construction TARGETED DELIVERY: 2017-2018 SPECS: The planned redevelopment of the 18.5-acre Skyland Shopping Center will occur in phases and result in up to 323,000 sq. ft. of retail space, 485 residential units and nearly 1,700 parking spaces. Phase I is scheduled to include 220,000 sq. ft. of retail space (120,000 sq. ft. Walmart) and 250-270 apartments. Capitol Gateway Marketplace WARD 7 LOCATION: 58th & East Capitol Streets, NE DEVELOPER(S): A&R Development/DC Housing Authority/ Henson Development Company ARCHITECT(S): Bignell Watkins Hasser Architects/ Massa Montalto Architects/ CONTRACTOR(S): WCS Construction LLC EST. COST: $120 million STATUS: Near Term TARGETED DELIVERY: 2016 SPECS: The 12-acre site will be redeveloped into approximately 167,000 sq. ft. of retail space, anchored by a 135,000 sq. ft. Walmart, and 304 apartments. 800 New Jersey Avenue WARD 6 LOCATION: New Jersey Avenue & H Street, SE DEVELOPER(S): WC Smith ARCHITECT(S): SK & I Architectural Design Group LLC CONTRACTOR(S): WCS Construction LLC LEED: Silver EST. COST: $135 million STATUS: Under Construction TARGETED DELIVERY: 3Q 2016 SPECS: 800 New Jersey Avenue will consist of 336 loft-style apartments with 10- foot ceilings and a 35,000 sq. ft. Whole Foods with two levels of grocery parking above the store. It is the second phase of the 1.4 million sq. ft. mixed-use Square 737 development. ImagecourtesyofRappaport ImagecourtesyofEDENS ImagecourtesyofSK&IArchitecturalDesignGroup ImagecourtesyofWalmart
- 44. © 2014 Washington, DC Economic Partnership40 RETAIL DEVELOPMENT Development Highlights The Wharf (Phase I) WARD 6 LOCATION: Southwest Waterfront DEVELOPER(S): Hoffman-Madison Waterfront ARCHITECT(S): Perkins Eastman/BBG-BBGM/ Cunningham|Quill Architects PLLC CONTRACTOR(S): Gilford Corporation/Clark Construction Group LLC LEED: Gold EST. COST: $806 million STATUS: Under Construction TARGETED DELIVERY: 4Q 2017 SPECS: The 1.86 million sq. ft. Phase I redevelopment of the Southwest Waterfront will include 230,000 sq. ft. of office space, 190,000 sq. ft. of retail space, 872 residential units, 683 hotel rooms, 140,000 sq. ft. of cultural and entertainment space and 1,475 underground parking spaces. 77 H WARD 6 LOCATION: 1st & H Streets, NW DEVELOPER(S): The JBG Companies/Bennett Group ARCHITECT(S): MV+A Architects/Preston Partnership LLC CONTRACTOR(S): Clark Builders Group LEED: Silver EST. COST: $90 million STATUS: Completed TARGETED DELIVERY: 4Q 2013 SPECS: A former parking lot was redeveloped into 86,000 sq. ft. of retail space, anchored by a 76,000 sq. ft. Walmart (with 40,000 sq. ft. for groceries), 303 apartments and 9,800 sq. ft. of additional retail/restaurant space. JBG sold the project to Clarion Partners in early 2014. Fort Totten Square WARD 4 LOCATION: South Dakota Avenue & Riggs Road, NE DEVELOPER(S): The JBG Companies/Lowe Enterprises ARCHITECT(S): Hickok Cole Architects CONTRACTOR(S): Clark Builders Group LEED: Certified EST. COST: $120 million STATUS: Under Construction TARGETED DELIVERY: 2Q 2015 SPECS: The first phase of the Ft. Totten Square development will deliver 345 apartments, 130,000 sq. ft. of retail space (anchored by a 120,000 sq. ft. urban- format LEED certified Walmart) and 750 parking spaces. Uline Arena WARD 6 LOCATION: 1140 3rd Street, NE DEVELOPER(S): Douglas Development Corporation ARCHITECT(S): GTM Architects CONTRACTOR(S): James G Davis Construction Corporation EST. COST: $120 million STATUS: Near Term SPECS: The Uline Arena project will include the adaptive reuse of the existing 110,000 sq. ft. masonry arena building and adjacent Ice House. The redevelopment plan calls for 150,000 sq. ft. of office space and 50,000 sq. ft. of retail space. ImagecourtesyofDouglasDevelopmentCorporation ImagecourtesyofTheJBGCompaniesImagecourtesyofHoffman-MadisonWaterfront
- 45. DC Development Report • 2014/2015 Edition 41 Development Highlights Cathedral Commons WARD 3 LOCATION: 3336 & 3400 - 3430 Wisconsin Avenue, NW DEVELOPER(S): Giant Food/Bozzuto Group/Southside Investment Partners ARCHITECT(S): JCA Architects CONTRACTOR(S): Bozzuto Construction LEED: Silver EST. COST: $130 million STATUS: Under Construction TARGETED DELIVERY: 4Q 2014 SPECS: The former Giant on the site was demolished in 2012 and a new 56,000 sq. ft. store will be built along with an additional 69,000 sq. ft. of retail space and 145 residential units on two separate parcels. The Giant grocery store opened in November 2014. Monroe Street Market WARD 5 LOCATION: 700 - 800 blocks of Monroe Street, NE DEVELOPER(S): Abdo Development/Bozzuto Group/Catholic University ARCHITECT(S): Torti Gallas & Partners/KTGY CONTRACTOR(S): Bozzuto Construction LEED: Certified EST. COST: $150 million STATUS: Completed TARGETED DELIVERY: 2Q 2014 SPECS: This mixed-use project delivered 57,000 sq. ft. of retail space and 562 apartments in Blocks A1, B and C. Project anchors include The Arts Walk (27 artist studios), Busboys & Poets, Brookland Pint and &pizza. Some portions of the project started to deliver in 4Q 2013. Twelve12 WARD 6 LOCATION: 1212 4th Street, SE DEVELOPER(S): Forest City Washington ARCHITECT(S): Shalom Baranes Associates CONTRACTOR(S): Walsh Construction LEED: Silver EST. COST: $100 million STATUS: Completed TARGETED DELIVERY: 2Q 2014 SPECS: Twelve12 features a 218-unit apartment building above 88,000 sq. ft. of retail space, including a 50,000 sq. ft. Harris Teeter (November 2014 opening) and a 28,000 sq. ft. VIDA Fitness. Walmart on Georgia Avenue WARD 4 LOCATION: 5929 Georgia Avenue, NW DEVELOPER(S): Foulger-Pratt ARCHITECT(S): Massa Montalto Architects CONTRACTOR(S): Foulger-Pratt STATUS: Completed TARGETED DELIVERY: 4Q 2013 SPECS: The former 3.56-acre Curtis Chevrolet dealership was redeveloped into a 106,000 sq. ft. Walmart with approximately 40,000 sq. ft. dedicated to groceries, 348 parking space and 37 bicycle spaces. VisualizationbyInterfaceMultimedia ImagecourtesyofFoulger-Pratt
- 46. © 2014 Washington, DC Economic Partnership42 RETAIL DEVELOPMENT Development Highlights Apollo WARD 6 LOCATION: 610 H Street, NE DEVELOPER(S): Insight Property Group LLC ARCHITECT(S): SK & I Architectural Design Group LLC CONTRACTOR(S): John Moriarty & Associates of Virginia LLC LEED: Silver EST. COST: $190 million STATUS: Under Construction TARGETED DELIVERY: 4Q 2016 SPECS: The Apollo will be a 431-unit apartment building with 75,000 sq. ft. of retail space, anchored by a 39,000 sq. ft. Whole Foods. There will also be 442 underground parking spaces and about 165 bicycle parking spaces. The Swift WARD 4 LOCATION: 3830 Georgia Avenue, NW DEVELOPER(S): Duball LLC/Safeway ARCHITECT(S): Torti Gallas & Partners CONTRACTOR(S): Bozzuto Construction LEED: Silver EST. COST: $65 million STATUS: Completed TARGETED DELIVERY: 3Q 2014 SPECS: The former site of a 21,000 sq. ft. Safeway was redeveloped into a new 60,000 sq. ft. Safeway grocery store (June 2014 opening) and 218 apartments. A two-level underground parking garage was also built on the site. Duball LLC sold the project to Principal Real Estate Investors for $75 million in July 2014. ART Place at Fort Totten (Phase I) WARD 5 LOCATION: 5180 South Dakota Avenue, NE DEVELOPER(S): Cafritz Foundation ARCHITECT(S): EE&K Architects/MV+A Architects/ Shalom Baranes Associates CONTRACTOR(S): Foulger-Pratt LEED: Silver EST. COST: $117 million STATUS: Under Construction TARGETED DELIVERY: 2Q 2017 SPECS: Phase I will deliver 104,000 sq. ft. of retail space (on two levels) and 520 apartments (121 – 141 affordable units) in three buildings. Brentwood Park WARD 5 LOCATION: Rhode Island Avenue, NE & 4th Street & Edgewood Street, NE DEVELOPER(S): Mid-City Financial Corporation LEED: Silver STATUS: Long Term SPECS: The 20-acre site that currently encompasses the Brentwood Village Shopping Center and the 535-unit Brookland Manor (Section 8 Housing) will be redeveloped into a mixed-use neighborhood with 200,000 sq. ft. of retail space and 2,200 residential units (20% affordable). ImagecourtesyofInsightPropertyGroupLLCImagecourtesyofFoulger-Pratt
- 47. Plan Early Sell Faster with Natural Gas. Natural Gas. Efficient by Nature. Including natural gas in our project was a very smart decision. If you don’t incorporate natural gas as a primary energy source into your plans, you’re missing a big opportunity. Savvy builders know that their clients prefer natural gas because of the comfort, cost savings, reliability and environmental benefits it affords. It’s easier than ever to include natural gas. • Attractive design alternatives are available through the use of the industry’s latest meters. They’re smaller, allowing for their placement in aesthetically pleasing locations. • Innovative piping options such as 2 psi delivery systems, and flexible copper and corrugated stainless steel piping help to reduce first costs. • Distributed Meter Rooms (DMR) provide the flexibility for individual unit meters to be installed in vertically stacked central gas meter rooms on each floor in a high rise multifamily building. Call Washington Gas for a free consultation. The Engineered Sales Team at Washington Gas is the resource you can count on for all multifamily development natural gas applications. Our representatives include a variety of professionals with the technical skills to understand your requirements and walk you through each stage of the process. To learn more about incorporating natural gas into your next project, email our Engineered Sales Team at EngineeredSales@washgas.com or visit PlanEarlySellFaster.com.
- 48. ENERGY CREATES OPPORTUNITIES We're proud to support the Washington, D.C. Economic Partnership. Pepco DC Econ Part Ad:Layout 1 9/12/13 9:40 AM Page 1 COMING 2017 At the intersection of First and L streets, NE, Storey Park will be at the center of NoMa in every way.
- 49. DC Development Report • 2014/2015 Edition 45 Development by Sector RESIDENTIAL
- 50. © 2014 Washington, DC Economic Partnership The District of Columbia has recorded strong prospects for expansion in the residential real estate market due to its population, employment, and income growth. DC continues to see robust population growth, while the share of young professionals has grown at an even faster pace. Between 2012 and 2013, DC’s population increased 2.1% to 646,500, while the 25 to 44 year old cohort expanded by 3.5% to 235,800. During the same time period, the labor market in DC observed overall growth, albeit at a slower pace. DC added 10,400 jobs in 2013, an increase of 1.4%. Meanwhile, the unemployment rate continued along a downward trajectory, dropping 90 basis points over the year to 8.3% in 2013. The median home sales price in DC rose 3.0% over the year from $461,000 in August 2013 to $475,000 in August 2014. Meanwhile, according to a report by CoreLogic, DC observed a 7.1% increase in foreclosure activity between September 2013 and September 2014. During the same month, DC recorded the 9th highest share of homes in foreclosures among U.S. states, at 2.3% of inventory. DC continues to see robust population growth, while the share of young professionals has grown at an even faster pace. Residential Development in the District of Columbiaresidential DC RESIDENTIAL MARKET SNAPSHOT TOTAL HOUSEHOLDS1 283,172 CONDOS UNDER CONSTRUCTION 1,425 UNITS UNDER CONSTRUCTION 11,937 MARKET RATE APARTMENT NET ABSORPTION2 (4Q13–3Q14) 2,731 1. District of Columbia Economic & Revenue Trends (October 2014) 2. District of Columbia Economic & Revenue Trends/Delta Associates (October 2014)
- 51. DC Development Report • 2014/2015 Edition 47 Residential Development Looking ahead, the population, employment, and income of the region are forecast to grow. DC is projected to see its population increase by 10.2% between 2014 and 2019, while median household income is projected to rise by 15.0% to $77,143 during the same time frame.3 According to Moody’s Analytics, total metropolitan employment as well as office- using employment is expected to gain traction between 2015 and 2017. DC Apartment Size The average size of a one-bedroom apartment in DC has been on a downward trajectory over the past decade. While the previous unit average was approximately 850 sq. ft. through the early 2000s, this figure has dropped to around 725 to 750 sq. ft., excluding the new phenomenon of micro-units. Renters have become more interested in assessing the total monthly rent, rather than the quoted rent per sq. ft. Moreover, the size of apartments is a function of both the proximity to the Metrorail as well as the overall monthly rent. DC Supply and Absorption There are approximately 12,000 units set to deliver in the next 36 months in DC, compared to about 10,000 units during the same time last year.4 Though most new product is concentrated in new markets—including Capitol Riverfront, H Street, Mt. Vernon Triangle and NoMa—the developed markets continue to see new projects coming online. Given the recent surge in DC’s population, absorption has remained stable. DC Average Rents per Neighborhood According to Axiometrics, the Downtown-Logan Circle neighborhood had the highest asking and net effective rents during Q3 2014 at $2,498 and $2,474, respectively. Meanwhile, the Howard University-Mt. Pleasant-Brightwood neighborhood had the highest occupancy rate at 97.2%, followed closely behind by Capitol Hill-SW with 97.1% occupancy. Brookland-Ft. Totten, located in northeast DC, observed the lowest asking and effective rents, while Anacostia-NE DC recorded the lowest occupancy rate of 93.0%. ¾ APARTMENT RENTAL RATES (Q3 2014) NEIGHBORHOOD ASKING RENT EFFECTIVE RENT OCCUPANCY RATE Anacostia-NE DC $1,755 $1,738 93.0% Brookland- Ft.Totten $1,675 $1,655 96.3% Capitol Hill-SW $1,954 $1,951 97.1% Downtown-Logan Circle $2,498 $2,474 95.7% Dupont- Adams Morgan $2,004 $1,999 96.8% Howard University- Mt. Pleasant-Brightwood $1,815 $1,767 97.2% NW DC- Georgetown $1,948 $1,940 94.3% Woodley Park- Cleveland Park- Van Ness $2,190 $2,176 96.0% Source: Axiometrics DC POPULATION GROWTH RATE (year-over-year) 0.00 1% 2% 3% 4% 5% 2008 2009 2010 2011 2012 2013 1.4% 3.2% 4.5% 5.0% 4.2% 3.5% 1.0% 2.1% 2.2% 2.4% 2.2% 2.1% Age 25–44 DC Population 3. Nielson 4. Washington, DC Economic Partnership
- 52. © 2014 Washington, DC Economic Partnership48 H Street, NE RESIDENTIAL SPOTLIGHT M M M M M M Capitol South Eastern Market Potomac Ave St W Navy Yard Union Station Noma/Gallaudet U 395 295 i a R i Lincoln Park Stanton Square Union Station Plaza FLORIDA AVE 1STST 1STST SACHUSETTS AVE NORTHCAPITOLST YORK AVE N ST 1STST 2NDST CONSTITUTION AVE INDEPENDENCE AVE SOUTHCAPITOLST MASSACHUSETTS AVE M ST NEWJERSEYAVE NORTH CAROLINA AVE SOUTH CAROLINA AVE EAST CAPITOL ST E ST LO UISIAN A AVE W ASHIN G TO N AVE 14THST L ST 15THST K ST KENTUCKYAVE 16THST C ST C ST D ST D ST E ST G ST C ST I STI ST T K ST L ST HALFST 8THST 1STST DELAWAREAVE N ST TINGEY ST 1STST H ST MARYLAND AVE K ST HOLBROOKST TRINIDADAVE MORSE ST NEAL ST F ST E ST I ST 2NDST 3RDST 4THST 2NDST 2NDPL 4THST 5THST 6THST 9THST 8THST 7THST 10THST 11THST 12THST 13THST G ST L ST TENNESSEEAVE 14THST 6THST 5THST 4 MONTELLO AVE Burnham Place Station House Apollo 625 H Woolworth Atlas Arts Center The Maryland H STREET, NE Development Summary The H Street, NE corridor is about one mile in length from the Hopscotch Bridge to the intersection of H Street, Maryland Avenue, Bladensburg Road and Benning Road. It is anchored to the west by Union Station, a multimodal transportation hub, which attracts 32 million visitors and passengers each year. In addition the corridor will be serviced by the H Street/Benning Road streetcar. The vision for the development that is occurring today can be traced back to the 2004 H Street NE Strategic Development Plan. The plan recommended the corridor be developed around specific nodes, with an arts and entertainment district on the east end (anchored by the Atlas Performing Arts Center–2005 opening), residential on the western end and a heavy concentration of retail in the middle (Whole Foods set to open in 2016/2017). As of September 2014 829 new residential units had been built since 2007 within two blocks of H Street, with another 1,238 units (90% apartments) under construction and anticipated to delivery by late 2016 or early 2017. Average asking rents for new rental product is expected to be more than $3 per sq. ft. Projects Total SF Hotel Rooms Office SF Residential Units Retail SF COMPLETED (SINCE 2007) 4 1,046,500 - - 829 42,700 UNDER CONSTRUCTION 6 1,335,300 - - 1,238 111,700 PIPELINE 7 647,175 - - 623 84,600 TOTALS 17 3,028,975 - - 2,690 239,000 PIPELINE (BURNHAM PLACE AT UNION STATION) 1 2,915,000 400 1,500,000 1,300 100,000 GRAND TOTAL 18 5,943,975 400 1,500,000 3,990 339,000 2007 2008 2009 2010 2011 2012 2013 2014* 2015* 2016* 432 44 0 0 0 138 215 16 484 738 Rental Condo H STREET RESIDENTIAL Unit deliveries by year *projections based on projects under construction (as of September 2014) map not to scale
- 53. DC Development Report • 2014/2015 Edition 49 Development Overview RESIDENTIAL DEVELOPMENT (September 2014, units) RESIDENTIAL DEVELOPMENT (September 2014) PROJECTS SQ. FT. UNITS2 APTS H.O.3 CONDOS Completed 501 53,330,182 52,792 36,810 15,982 12,725 2001 29 2,837,032 2,670 1,750 920 409 2002 32 3,750,300 3,511 2,920 591 173 2003 47 3,936,855 4,089 3,454 635 546 2004 47 4,630,970 4,665 2,828 1,837 1,640 2005 45 4,170,870 3,956 1,828 2,128 2,061 2006 46 4,340,551 3,983 1,399 2,584 2,335 2007 50 5,825,803 5,133 2,547 2,586 2,083 2008 41 4,229,734 4,282 2,564 1,718 1,649 2009 35 3,589,130 3,633 2,721 912 718 2010 21 2,186,187 1,909 1,385 524 146 2011 22 1,899,277 1,943 1,574 369 269 2012 30 3,983,523 3,910 3,428 482 173 2013 35 3,746,803 4,480 3,913 567 463 2014 YTD 21 4,203,147 4,628 4,499 129 60 Under Construction 87 10,985,135 11,937 10,072 1,865 1,425 2014 delivery 22 2,011,987 2,280 2,161 119 119 2015 delivery 48 4,781,021 5,313 3,830 1,483 1,085 2016 delivery 14 2,726,127 2,702 2,660 42 2017+ delivery 3 1,466,000 1,642 1,421 221 221 Pipeline 202 51,101,537 52,874 21,671 5,532 4,566 Near Term 63 7,532,460 8,826 6,406 1,190 1,076 Medium Term 69 8,276,012 8,790 5,791 1,038 671 Long Term 70 35,293,065 35,258 9,474 3,304 2,819 TOTAL 790 115,416,854 117,603 68,553 23,379 18,716 COMPLETED 2016* 2015* 2014* 2013 2012 2011 2010 2009 2008 2007 2006 2005 2004 2003 2002 2001 2014 YTD 2013 2012 2011 2010 2009 2008 2007 2006 2005 2004 2003 2002 2001 2000 GROUNDBREAKINGS H.O.RentalHORental 1,750 920 2,920 591 3,454 635 2,828 1,837 1,828 2,128 1,399 2,584 2,547 2,586 2,564 1,718 2,721 912 1,385 524 1,574 369 3,428 482 4,499 129 2,161 119 3,830 1,483 2,660 42 H.O. (projected)Rental (projected) 2,670 2,702 5,313 6,908 3,910 1,943 1,909 3,633 4,282 5,133 3,983 3,956 4,665 4,089 3,511 3,913 567 4,480 2,272 286 2,558 4,099 911 5,010 4,384 748 5,132 5,672 556 6,228 5,004 499 5,503 3,524 446 3,970 753 173 926 1,460 240 1,700 2,817 758 3,575 2,598 1,767 4,365 2,817 3,020 5,837 1,004 2,531 3,535 2,390 1,624 4,014 4,138 1,914 6,052 3,538 1,148 4,686 1. projections based on targeted delivery dates of projects under construction as of September 2014 2. apartments & homeownership may not total to residential units due to lack of information for pipeline projects 3. includes condo, single-family, co-op and other for-sale units
- 54. Alexandria NATIONAL AIRPORT M M M 1 395 M 66 GEORGEW ASHIN G TO N M E M O RIALPKW Y VIRGINIA VIRGINIA NATIONAL MALL U.S. CAPITOL ROCK CREEK PARK NEW YORK AVERHODE ISLAND AVE GEORGIAAVE E. CAPITOL ST. H ST. CONNECTICUTAVE FORT DUPONT PARK MARTINLUTHERKINGJR.AVE. NATIONALS PARK UNION STATION U ST. 14THST. DEVELOPMENT MAP RESIDENTIAL 1 2 3 4 5 6 7 8 9 10 11 12 13 14 15 16 17 18 19 20 21 22 23 24 25 26 27 28 29 30 Completed Under Construction Pipeline
- 55. DC Development Report • 2014/2015 Edition 51 Development Pipeline 1) APT = rental; HO = home ownership/condos 2) may include non-residential components ($ in millions); 3) delivery date may reflect phase I delivery or final phase delivery PROJECT WARD LOCATION DEVELOPER(S) UNITS TYPE1 EST. VALUE ($M)2 DELIVERY TOP RESIDENTIAL PROJECTS COMPLETED (4Q 2013–3Q 2014) 1 CityCenterDC 2 9th, 10th, 11th, H, & I Sts., NW Hines/The First Investor 674 Apt/HO $700 4Q 13 2 Camden NoMa 6 60 L St., NE Camden Property Trust 321 Apt $100 4Q 13 3 77 H 6 1st & H Sts., NW The JBG Companies/Bennett Group 303 Apt $90 4Q 13 4 Monroe Street Market 5 700 - 800 blocks of Monroe St., NE Abdo Development/Bozzuto Group/Catholic University 562 Apt $150 2Q 14 5 CityMarket at O Street (Ph I) 6 1400 7th St., NW Roadside Development/Dantes Partners 497 Apt $265 2Q 14 6 The Louis at 14th 2 1420 U St., NW The JBG Companies/Georgetown Strategic Capital LLC 268 Apt $100 2Q 14 7 Elevation at Washington Gateway 5 100 Florida Ave., NE MRP Realty 400 Apt $130 3Q 14 8 Park 7 7 Minnesota Ave. & Benning Rd., NE Donatelli Development/Blue Skye Development LLC 376 Apt $60 3Q 14 9 2 M Street 6 North Capitol & M Sts., NE WC Smith/Warrenton Development Group 314 Apt $95 3Q 14 10 Jefferson at Market Square 6 1550 7th St., NW The Jefferson Apartment Group 281 Apt $80 3Q 14 TOP RESIDENTIAL PROJECTS UNDER CONSTRUCTION 11 Fairway Park Apartments 5 21st, 22nd St. and Maryland Ave., NE WC Smith/Enterprise Community Partners 406 Apt $54 4Q 14 12 415 L Street 6 415 L St., NW Steuart Investment Company/Paradigm Development 393 Apt $100 4Q 14 13 Station House 6 701 2nd St., NE Fisher Brothers 375 Apt $100 1Q 15 14 Park Chelsea 6 880 New Jersey Ave., SE WC Smith 429 Apt $150 2Q 15 15 Atlantic Plumbing (Parcel A & B) 1 2030 & 2112 8th St., NW The JBG Companies/Walton Street Capital 372 Apt/HO $124 2Q 15 16 Fort Totten Square 4 South Dakota Ave. & Riggs Rd., NE The JBG Companies/Lowe Enterprises 345 Apt $120 2Q 15 17 Camden NoMa (Ph II) 6 60 L St., NE Camden Property Trust 406 Apt $130 1Q 16 18 Apollo 6 610 H St., NE Insight Property Group LLC 431 Apt $190 4Q 16 19 ART Place at Fort Totten (Ph I) 5 5180 South Dakota Ave., NE Cafritz Foundation 520 Apt $117 2Q 17 20 The Wharf (Ph I) 6 Southwest Waterfront Hoffman-Madison Waterfront 872 Apt/HO $806 4Q 17 TOP RESIDENTIAL PROJECT PIPELINE (Near Term) 21 1001 4th Street 6 4th & K Sts., SW Waterfront Associates/Forest City Washington/ Vornado/CES 365 Apt 2016 22 Ballpark Square 6 1st & N Sts., SE Grosvenor USA/McCaffery Interests 325 Apt $150 2016 23 The Riverfront 6 100 Potomac Ave., SE FRP Development Corporation/MRP Realty 321 Apt $100 2016 24 Capitol Gateway Marketplace 7 58th & East Capitol Sts., NE A&R Development/DCHA/Henson Development Co. 304 Apt $120 2016 25 Georgia Eastern 4 7828 Georgia Ave., NW Douglas Development Corporation 220 Apt 2016 26 Arcadia at Brookland Station 5 901 Monroe St., NE The Menkiti Group/Horning Brothers 213 Apt $50 2016 27 West End Square 37 2 24th & L Sts., NW EastBanc/Dantes Partners/Warrenton Dev. Group 164 Apt/HO $150 2016 28 Hine Junior High School 6 700 Pennsylvania Ave., SE Stanton Development Corp./EastBanc/Dantes Partners/Jarvis Co. 156 HO $190 2016 29 Rhode Island Avenue Gateway 5 2313 - 2321 4th St., NE H Street CDC/E&G Group 116 Apt $37 2016 30 Gateway Market 5 340 Florida Ave., NE LCOR Incorporated/EDENS 188 Apt $55 2017
- 56. © 2014 Washington, DC Economic Partnership52 RESIDENTIAL DEVELOPMENT Development Highlights The Harper WARD 1 LOCATION: 1919 14th Street, NW DEVELOPER(S): Level 2 Development/Keener & Squire Properties ARCHITECT(S): Eric Colbert & Associates PC CONTRACTOR(S): Grunley Construction STATUS: Completed TARGETED DELIVERY: 1Q 2014 SPECS: The Harper is a seven-story, 144-unit apartment building with 6,000 sq. ft. of ground floor retail. Units feature studios and one-bedrooms and range in size from 350 - 600 sq. ft. 1011 M Street WARD 2 LOCATION: 1011 M Street, NW DEVELOPER(S): Community Three Development ARCHITECT(S): Torti Gallas & Partners EST. COST: $30 million STATUS: Near Term TARGETED DELIVERY: 1Q 2016 SPECS: An existing parking lot on the northeast corner of 11th & M Streets will be transformed into a six-story building with 71 condominium units (550 – 1,400 sq. ft.) and 4,100 sq. ft. of retail space. A sheeting & shoring permit was issued in October 2014. Atlantic Plumbing (Parcel A & B) WARD 1 LOCATION: 2030 & 2112 8th Street, NW DEVELOPER(S): The JBG Companies/Walton Street Capital ARCHITECT(S): Morris Adjmi Architects/Eric Colbert & Associates PC CONTRACTOR(S): HITT Contracting EST. COST: $124 million STATUS: Under Construction TARGETED DELIVERY: 2Q 2015 SPECS: Parcels A & B of the former Atlantic Plumbing site will be redeveloped into two mixed-use buildings totaling 310 apartments, 62 condos and 23,700 sq. ft. of retail space. The retail will be anchored by a six-screen Landmark Theater and seven art studios. Park 7 WARD 7 LOCATION: Minnesota Avenue & Benning Road, NE DEVELOPER(S): Donatelli Development/Blue Skye Development LLC ARCHITECT(S): Eric Colbert & Associates PC CONTRACTOR(S): Blue Skye Construction LLC/ McCullough Construction LLC EST. COST: $60 million STATUS: Completed TARGETED DELIVERY: 3Q 2014 SPECS: The five-acre site (previously vacant), located adjacent to the Minnesota Avenue Metrorail Station, was redeveloped into 376 apartments and 22,000 sq. ft. of retail space. ImagecourtesyofCommunityThreeDevelopment ImagecourtesyofTheJBGCompanies
- 57. DC Development Report • 2014/2015 Edition 53 Development Highlights Park Van Ness WARD 3 LOCATION: 4455 Connecticut Avenue, NW DEVELOPER(S): BF Saul ARCHITECT(S): Torti Gallas & Partners EST. COST: $75 million STATUS: Under Construction TARGETED DELIVERY: 1Q 2016 SPECS: Park Van Ness will replace a seven-story office and retail building with an 11-story residential building with 271 apartments, 10,000 sq. ft. of retail space and 224 underground parking spaces. Ontario 17 WARD 1 LOCATION: 2550 17th Street, NW DEVELOPER(S): Peterson Companies ARCHITECT(S): Eisen Group CONTRACTOR(S): Ellisdale Construction & Development EST. COST: $30 million STATUS: Under Construction TARGETED DELIVERY: 2Q 2015 SPECS: The former site of the Ontario Theater at the corner of 17th & Columbia Road is being redeveloped into 80 condominium units and 9,000 sq. ft. of retail space. Trinity Plaza WARD 8 LOCATION: Atlantic & South Capitol Streets, SW DEVELOPER(S): Far SW-SE CDC/MissionFirst HDC ARCHITECT(S): Grimm + Parker & Associates CONTRACTOR(S): Hamel Builders LEED: Silver EST. COST: $17 million STATUS: Under Construction TARGETED DELIVERY: 1Q 2015 SPECS: Trinity Plaza will be a new development consisting of 49 affordable rental units and 6,000 sq. ft. of retail space. Lyric WARD 6 LOCATION: 440 K Street, NW DEVELOPER(S): The Wilkes Company/Quadrangle Development ARCHITECT(S): Davis, Carter, Scott Ltd CONTRACTOR(S): HITT Contracting Inc EST. COST: $65 million STATUS: Completed TARGETED DELIVERY: 1Q 2014 SPECS: 440 K Street delivered 234 market rate apartments and 9,500 sq. ft. of retail space in early 2014. Baked & Wired will open a 4,231 sq. ft. cafe/bakery in 2015. ImagecourtesyofBFSaul ImagecourtesyofthePetersonCompanies ImagecourtesyofMissionFirstHDC
- 58. © 2014 Washington, DC Economic Partnership54 RESIDENTIAL DEVELOPMENT Development Highlights Sky House I & II WARD 6 LOCATION: 1150 & 1151 4th Street, SW DEVELOPER(S): Urban Atlantic/The JBG Companies ARCHITECT(S): Wiencek + Associates Architects + Planners CONTRACTOR(S): Hamel Builders LEED: Gold EST. COST: $120 million STATUS: Completed/Under Construction TARGETED DELIVERY: 2Q 14 - 4Q 14 SPECS: Sky House I and II convereted two office buildings into apartment units. Each building consists of 264 apartments with Sky House I (1150 4th Street, SW) delivering in 2Q 2014 and Sky House II (1151 4th Street, SW) scheduled to open in 4Q 2014. The Colonel WARD 2 LOCATION: 1250 9th Street, NW DEVELOPER(S): CAS Riegler/Douglas Development Corporation/ City Interests ARCHITECT(S): PGN Architects PLLC CONTRACTOR(S): Donohoe Companies EST. COST: $24 million STATUS: Under Construction TARGETED DELIVERY: 4Q 2014 SPECS: The Colonel will be a 70-unit apartment building with 8,200 sq. ft. ground-floor retail space at the corner of 9th & N Streets, NW. The project incorporates an existing 1923 apartment building on the site. Takoma Central WARD 4 LOCATION: 235 - 255 Carroll Street, NW DEVELOPER(S): Level 2 Development/Federal Capital Partners ARCHITECT(S): SGA Companies CONTRACTOR(S): Hamel Builders LEED: Silver EST. COST: $38 million STATUS: Under Construction TARGETED DELIVERY: 4Q 2014 SPECS: Takoma Central will consist of 150 apartments and 9,500 sq. ft. of retail space. A 6,500 sq. ft. Busboys and Poets will anchor the retail space. 2321 4th Street WARD 5 LOCATION: 2321 4th Street, NE DEVELOPER(S): H Street CDC/E&G Group ARCHITECT(S): Bonstra|Haresign Architects CONTRACTOR(S): Harkins Builders Inc EST. COST: $37 million STATUS: Near Term TARGETED DELIVERY: 2Q 2016 SPECS: The vacant site near 4th and Rhode Island Avenue, NE will be developed into 116 affordable residential units and 5,100 sq. ft. of retail space. ImagecourtesyofHStreetCDC
- 59. DC Development Report • 2014/2015 Edition 55 Development Highlights Gallery at Capitol Riverfront WARD 6 LOCATION: 1111 New Jersey Avenue, SE DEVELOPER(S): Donohoe Companies ARCHITECT(S): WDG CONTRACTOR(S): Donohoe Construction LEED: Silver EST. COST: $50 million STATUS: Under Construction TARGETED DELIVERY: 3Q 2016 SPECS: The vacant site adjacent to the Navy Yard Metorail Station will be developed into a 13-story, 342-unit apartment building with about 11,000 sq. ft. of retail space. 1421 Euclid Street WARD 1 LOCATION: 1421 Euclid Street, NW DEVELOPER(S): Dantes Partners/The Menkiti Group ARCHITECT(S): Grimm + Parker & Associates CONTRACTOR(S): Hamel Builders/Capital Construction Enterprises EST. COST: $12 million STATUS: Completed TARGETED DELIVERY: 3Q 2014 SPECS: 1421 Euclid Street is a five-story, 28-unit affordable apartment community, located on the former Justice Park site. 82 Eye Street WARD 6 LOCATION: 82 I Street, NW DEVELOPER(S): Greystar Development/RCP Development Company ARCHITECT(S): R2L Architects PLLC CONTRACTOR(S): Moriarty STATUS: Near Term TARGETED DELIVERY: 4Q 2016 SPECS: Plans call for a 220 to 234-unit residential building with the potential for 4,000 to 8,000 sq. ft. of retail space. 1336 8th Street WARD 2 LOCATION: 8th & O Streets, NW DEVELOPER(S): Roadside Development/Dantes Partners ARCHITECT: Shalom Baranes Associates LEED: Gold STATUS: Medium Term TARGETED DELIVERY: 2017 SPECS: Plans call for 70 condominiums and 6,900 sq. ft. of retail space. The project was awarded to the development team in September 2014 by the DC government. ImagecourtesyofWDG ImagecourtesyofRoadsideDevelopment ImagecourtesyofR2LArchitectsPLLC
- 60. © 2014 Washington, DC Economic Partnership56 RESIDENTIAL DEVELOPMENT Development Highlights The Villages at Dakota Crossing (Phase III) WARD 5 LOCATION: Fort Lincoln Drive & Commodore Joshua Barney Drive, NE DEVELOPER(S): Fort Lincoln New Town Corporation CONTRACTOR(S): Ryan Homes EST. COST: $20 million STATUS: Under Construction TARGETED DELIVERY: 3Q 2015 SPECS: The Villages at Dakota Crossing consists of 322 townhome and townhome-style condominiums ranging from 1,680 - 3,024 sq. ft. in size. Phase III consists of 167 units and is part of the 362-acre Fort Lincoln New Town mixed-use urban renewal area. City Homes at the Hampshires & Towns of Hampshires WARD 4 LOCATION: 6000 New Hampshire Avenue, NW DEVELOPER(S): Four Points LLC/Comstock Homes ARCHITECT(S): Franck & Lohsen EST. COST: $45 million STATUS: Under Construction TARGETED DELIVERY: 2013 - 2015 SPECS: The 11-acre site surrounding the former Medstar Nursing Home is being developed into 38 single family dwellings (up to 2,700 sq. ft.) and 73 townhomes (1,800 – 1,900 sq. ft.). Residents started to move into the single-family homes in early 2013. Jefferson at Market Square WARD 6 LOCATION: 1550 7th Street, NW DEVELOPER(S): The Jefferson Apartment Group ARCHITECT(S): Lessard Design CONTRACTOR(S): SE Foster Construction Company EST. COST: $80 million STATUS: Completed TARGETED DELIVERY: 3Q 2014 SPECS: The former Kelsey Gardens site was redeveloped into an eight-story, 281 mixed-income apartment building with 13,400 sq. ft. of retail space. Elevation at Washington Gateway WARD 5 LOCATION: 100 Florida Avenue, NE DEVELOPER(S): MRP Realty ARCHITECT(S): SK & I Architectural Design Group LLC CONTRACTOR(S): James G Davis Construction Corporation EST. COST: $130 million STATUS: Completed TARGETED DELIVERY: 3Q 2014 SPECS: Phase I of the three-acre, 1.0 million sq. ft. Washington Gatway project delivered 400 apartments and 5,200 sq. ft. of retail space. Union Social will occupy the entire retail/restaurant space.
- 61. CONTACT US 1717 K STREET, SUITE 1010 | WASHINGTON, DC 20006 P: 202.778.3100 | WWW.DELTAASSOCIATES.COM | Gregory H. Leisch, CRE Chief Executive Greg.Leisch@DeltaAssociates.com David Weisel, CRE President David.Weisel@DeltaAssociates.com Alexander (Sandy) Paul, CRE Executive Vice President Alexander.Paul@DeltaAssociates.com DELTA ASSOCIATES Leading advisor and information provider to the commercial real estate industry Delta Associates is a firm of experienced professionals offering consulting, valuation, and data services to the commercial real estate industry for over 30 years. Services Include: • Market Studies • Repositioning Analyses • Asset Valuations • Feasibility Studies • Litigation Support • Market Data and Publications • Boardroom Presentations DC INNOVATIVE Land Development SOLUTIONS SERVING THE EAST COAST DC CERTIFIED BUSINESS ENTERPRISE BOHLERENGINEERING.COM SITE CIVIL AND CONSULTING ENGINEERING LAND SURVEYING URBAN PLANNING LANDSCAPE ARCHITECTURE PERMITTING SERVICES TRANSPORTATION SERVICES We believe imagination is the most powerful planning tool. Make your next meeting or event a true original, visit: EvEntsdc.com/plan let’s get creative Bring Your Imagination EDC_UMB_7_25x4_75_v2.indd 1 11/13/14 5:10 PM
- 62. ©2014 Capital One. All rights reserved. capitalone.com/investingforgood facebook.com/capitaloneinvestingforgood At Capital One Bank® , we believe that when you create strong businesses, there’s a ripple effect — one thriving enterprise can generate jobs, spur local economic growth and anchor a community. That’s why we’re investing our time, money and expertise to better the places we call home. We’re proud to support organizations like the Washington, DC Economic Partnership, that dedicate their time to helping people and their communities succeed.
- 63. DC Development Report • 2014/2015 Edition 59 Development by Sector HOSPITALITY
- 64. © 2014 Washington, DC Economic Partnership Since 2001, the average hotel occupancy rate for DC has fluctuated between 69% and 76% and remained consistently between 74% to 76% since 2008. Hospitality Development in the District of Columbiahospitality DC HOSPITALITY MARKET SNAPSHOT ANNUAL VISITORS 1 19.0 million HOTEL ROOMS 2 ~29,000 HOTEL OCCUPANCY RATE1 76% AVG. DAILY ROOM RATE1 $209 1. DestinationDC (2013 Visitor Statistics) 2. REVPAR 3. Opened a three-screen pop-up theater in 2014 at Union Market The opening of the 1,175-room Marriott Marquis in May 2014 was a watershed moment for the DC hotel and hospitality sector. The hotel by itself represents the largest number of net new rooms to deliver to the market in any given year since the WDCEP began tracking development projects in 2001. Since 2001, the average hotel occupancy rate for DC has fluctuated between 69% and 76%. Even with the addition of 848 net new hotel rooms to the market since the beginning of 2008, the DC occupancy rate has remained consistent ranging from 74% to 76%1 . Given DC’s market stability hotel developers appear to be undeterred by the opening of the Marriott Marquis as there are another 2,320 hotel rooms under construction and scheduled to deliver by 2017. These 10 projects will add 1,908 new rooms to the market. In addition, there are another four hotel projects that could break ground in the next six to 12 months, representing an additional 1,314 net new rooms. While hotel projects make up the majority of the hospitality development sector, there were several notable non-hotel groundbreakings in the past year. The construction of the 47,000 sq. ft. Barry Farm Recreation Center started in Q4 2013 (site demolition started in Q2 2013), the new Williams Arena at the Southeast Tennis and Learning Center broke ground in Q2 2014 (phase I delivered in Q4 2014) and the $800 million Museum of the Bible started the renovation of 300 D Street, SW in Q3 2014. ¾ THEATER SCREENS NEIGHBORHOOD TARGET OPENING Angelica Film Center3 8 Union Market 2016/2017 Landmark Theaters 6 14th & U Streets/ Shaw 2015 Landmark Theaters 10 NoMa 2016/2017 Showplace Icon 16 Capitol Riverfront TBD NOTABLE THEATERS Entering/Expanding in DC
- 65. DC Development Report • 2014/2015 Edition 61 Development Overview 1. projections based on targeted delivery dates of projects under construction as of September 2014 2. includes community, entertainment, museum and hotel projects net new rooms added to the market by 2017 1,908 HOSPITALITY DEVELOPMENT (September 2014) 2 PROJECTS SQ. FT. ROOMS NET NEW ROOMS Completed 166 16,858,596 12,804 4,831 2001 11 683,718 411 175 2002 17 931,600 1,416 409 2003 16 3,106,707 490 86 2004 13 1,776,381 500 400 2005 16 1,089,564 1,106 890 2006 14 1,009,386 754 238 2007 7 758,500 538 -10 2008 10 3,162,093 2,159 132 2009 12 820,746 1,035 207 2010 12 1,052,328 1,614 2011 9 241,255 204 204 2012 9 163,985 356 2013 11 498,070 426 305 2014 YTD 9 1,564,263 1,795 1,795 Under Construction 22 2,924,757 2,320 1,908 2014 delivery 1 48,000 2015 delivery 13 1,017,900 1,039 627 2016 delivery 6 783,357 598 598 2017 delivery 2 1,075,500 683 683 Pipeline 73 5,373,800 4,850 4,480 Near Term 21 1,063,449 1,207 1,207 Medium Term 23 2,006,455 1,514 1,514 Long Term 29 2,303,896 2,129 1,759 TOTAL 261 25,157,153 19,974 11,219 COMPLETED 20161 20151 20141 2013 2012 2011 2010 2009 2008 2007 2006 2005 2004 2003 2002 2001 2014 YTD 2013 2012 2011 2010 2009 2008 2007 2006 2005 2004 2003 2002 2001 2000 GROUNDBREAKINGS 411 1,416 490 500 1,106 754 538 2,159 1,035 1,614 204 356 426 1,795 237 925 1,007 895 515 550 2,053 962 1,991 544 1,324 659 594 608 Projected 1,039 598 1,712 HOTEL PROJECTS (September 2014, rooms)
- 66. Alexandria NATIONAL AIRPORT M M M 1 395 M 66 GEORGEW ASHIN G TO N M E M O RIALPKW Y VIRGINIA VIRGINIA NATIONAL MALL U.S. CAPITOL ROCK CREEK PARK NEW YORK AVERHODE ISLAND AVE GEORGIAAVE E. CAPITOL ST. H ST. CONNECTICUTAVE FORT DUPONT PARK MARTINLUTHERKINGJR.AVE. NATIONALS PARK UNION STATION U ST. 14THST. DEVELOPMENT MAP HOSPITALITY 1 2 3 4 5 6 78 9 10 11 12 13 14 15 16 17 18 19 20 21 22 23 24 25 2627 28 29 30 Completed Under Construction Pipeline