
Recommended
Recommended
More Related Content
What's hot
What's hot (20)
Viewers also liked
Viewers also liked (15)
Similar to Yu - budget-glance-2014-15
Similar to Yu - budget-glance-2014-15 (20)
Recently uploaded
Recently uploaded (20)
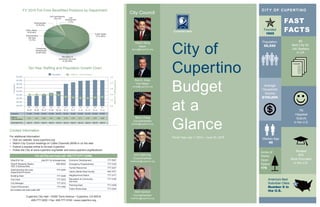
Yu - budget-glance-2014-15
- 1. Sheriff & Fire (dial 911 for emergencies) Sheriff Westside Station, 1601 S DeAnza Blvd. 868-6600 Administrative Services Department/Finance 777-3220 Building Dept. 777-3228 City Clerk 777-3223 City Manager 777-3212 Code Enforcement 777-3182 Economic Development 777-7607 Emergency Preparedness 777-3120 Human Resources 777-3227 Library (Santa Clara County) 446-1677 Neighborhood Watch 777-3177 Recreation & Community Services 777-3120 Planning Dept. 777-3308 Public Works Dept. 777-3354 City of Cupertino Budget at a Glance Fiscal Year July 1, 2014 – June 30, 2015 CIT Y OF CUPERTINO FAST FACTSFounded 1955 Population 60,550 #3 Best City for Job Seekers in CA Average Household Income $150,000 Median Age 40 America’s Best Suburban Cities: Number 6 in the U.S. U Ranked #15 Most Educated in the U.S. Acres of Parks/ Open Space 175 7th Happiest Suburb in the U.S. Contact Information For additional information: • Visit our website: www.cupertino.org • Watch City Council meetings on Cable Channels 26/99 or on the web • Submit a request online to Access Cupertino • Follow the City at www.cupertino.org/twitter and www.cupertino.org/facebook For all City services call: 408-777-CITY (2489) Cupertino City Hall • 10300 Torre Avenue • Cupertino, CA 95014 408-777-3220 • Fax: 408-777-3109 • www.cupertino.org Gilbert Wong Mayor gwong@cupertino.org Orrin Mahoney Councilmember omahoney@cupertino.org Mark Santoro Councilmember msantoro@cupertino.org Barry Chang Councilmember bchang@cupertino.org Rod G. Sinks Vice Mayor rsinks@cupertino.org City Council All numbers are area code 408 R E S U M E Ten-Year Staffing and Population Growth Chart 3.01 3.01 3.02 3.01 2.99 2.79 2.74 2.71 2.70 2.75 2.80 StaffPer1,000Residents Staff Per 1,000 Residents 62,000 60,000 58,000 56,000 54,000 52,000 50,000 48,000 46,000 Population Population Population Staff Per 1,000 Residents FY 04–05 51,695 3.01 FY 05–06 51,698 3.01 FY 06–07 52,552 3.02 FY 07–08 53,396 3.01 FY 08–09 54,278 2.99 FY 09–10 58,302 2.79 FY 10–11 59,295 2.74 FY 11–12 60,009 2.71 FY 12–13 60,189 2.70 FY 13–14 60,550 2.75 FY 14–15 60,550 2.80 0.00301 0.00301 0.00302 0.00301 0.0029 0.0027 0.0027 0.0027 0.0027 0.0027 0.0028 Total Staff (FTE) 155.75 155.75 158.75 160.75 162.75 162.75 162.75 162.75 162.75 166.75 169.75 4.5 4.0 3.5 3.0 2.5 2.0 Ten-Year Staffing and Population Growth Chart FY 2015 Full-Time Benefitted Positions by Department Public Works 77.12 (46%) Recreation & Community Services 31.28 (18%) Community Development 24.80 (15%) Administrative Services 12 (7%) Public Affairs 10.25 (6%) Administration 10.75 (6%) City Commissions 1.55 (1%) Law Enforcement 2 (1%)
- 2. Sales Taxes For every dollar you spend, you are taxed 8.75 cents. Agencies receive a portion in the following breakdown: Final Budget Appropriations for Fiscal Year 2014-2015 were adopted at $119,476,412, an increase of $30,402,140 or 34% from the prior year’s Final Budget. The primary reason for the major increase is due to the transfer out of excess fund balance from the General Fund to the Capital Reserve. The City allocates appropriations by department as follows: The Budget at a Glance provides an overview of revenues, expenditures, and fund balance from our Fiscal Year 2014-15 Final Adopted Budget. Cupertino’s budget is balanced not only for this fiscal year, but also for the next four years. Although fund balance will be used to complete several one-time special and capital projects this fiscal year, ongoing revenues continue to fully support ongoing operating costs. Last year marked the beginning of major changes in the City’s budget process. In Fiscal Year 2013-14 staff, at Council’s direction, created a budget that was more detailed and thorough. Throughout the 2013-14 fiscal year, staff continued to focus in on accountability and transparency through quarterly budget reporting that continued to build on the work that was completed in the Final Adopted Budget. Fiscal Year 2014-15 will mark another budget milestone for the City with the receipt of several large one-time dollars from the Apple Campus 2 Development Agreement. The Final Adopted Budget for FY 2014-15 reflects a total City budget of $119,476,412 with the General Fund at $77,582,079. The General Fund is balanced through the use of General Fund revenue of $56,112,500 and $21,994,389 in unassigned General Fund balance. The FY 2014-15 Final Adopted Budget is a balanced and fiscally responsible spending plan. This year continues to build on the added transparency and accountability that was included as part of the FY 2013-14 Final Adopted Budget. While we have met our goals to update many financial policies and schedules and have made the budget document easier to read, we continue to look for ways to improve our budget in the future. Respectfully submitted, David Brandt City Manager A Message from the City Manager: Public Works: $39,585,313 Street sweeping and maintenance, graffiti removal, traffic safety, solid waste and recycling, stormwater management, urban runoff pollution prevention, tree removal and replacement, engineering services Non Departmental: $37,041,124 This includes funding for the City’s debt service and transfers out to other funds primarily to fund capital project costs. Law Enforcement: $10,175,620 Police, animal and noise control, emergency response, vehicle code enforcement Recreation & Community Services: $11,506,514 Park development and supervision, leadership training, youth and senior programs, community and recreational events, emergency preparedness, community outreach Planning & Community Development: $8,576,307 Building inspection, permit review, safety code enforcement, safety training Administrative Services: $4,083,706 Human resources services, risk management, finance, business licensing, budget Administration: $3,613,850 City Administration, sustainability programs, economic development, records management, legal counsel Public Affairs: $4,203,524 City program development, governmental transparency (City website and channel), community outreach, information technology City Council & Commissions: $690,454 Establishment of public policies City ServicesREVENUES: Where does the City get its money? Total City revenues for Fiscal Year 2014-15 are expected to be $102,092,393 — an increase of $18,596,870 or 22% from the prior year’s revenues. Revenues by fund for the City are projected as follows: General Fund Pays for core services like public safety, parks and recreation, community development, and public works. Revenue for this fund comes primarily from property and sales tax, franchise fees, and charges for services. Special Revenue Fund Accounts for the proceeds of special revenue sources legally restricted to expenditures for specific purposes. Debt Service Fund Pays principal, interest and associated administrative costs incurred with the issuance of debt instruments. Capital Projects Fund Pays for the acquisition and construction of major capital facilities from General Fund revenues. Enterprise Fund Pays for specific services that are funded directly by fees charged for goods or services. Internal Service Fund Pays for goods or services provided amongst City departments or governments on a cost- reimbursement basis. EXPENDITURES How does the City spend its money? Your Taxes Property Taxes For every dollar collected in property taxes, agencies receive a portion per the following breakdown: Sales Tax Distribution Property Tax Distribution Expenditures by Department Revenues by Fund Internal Service $4,955,033 5% Enterprise $7,104,935 7% Capital Projects $15,184,787 15% Debt Service $3,171,838 3% Special Revenue $15,523,300 15% General Fund $56,112,500 55% County General Purpose 0.125¢ 1% Bay Area Air Quality Management $0.002 County Transportation 0.25¢ 3% City 1¢ 11% ERAF $0.086 9% Foothill DeAnza Community College $0.064 6% Fremont Union High $0.167 17% Midpeninsula Regional Open Space $0.015 1% Santa Clara Valley Water District $0.017 2% City of Cupertino $0.056 6% Santa Clara Valley Transportation Authority 1.125¢ 13% Administrative Services $4,083,706 3% Administration $3,613,850 3% Public Works — Capital Projects $9,177,000 8% Public Works $30,408,313 30% Public Affairs $4,203,524 4% Planning and Community Development $8,576,307 7% Recreation and Community Services $11,506,514 10% Non-Departmental $37,041,124 31% Law Enforcement $10,175,620 8% City Council and Commissions $690,454 1% State 6.25¢ 72% County $0.345 34% Cupertino Union Elementary $0.248 25% Services provided by each department are as follows (by descending order of costs):