2. 924 H.S. LEE AND N.B. SONGER
content knowledge and scientific thinking that students do not have the supports to
realize (Edelson 1998). How can we design inquiry learning that both emulates
inquiry in science disciplines and is accessible to students?
Design and development of authentic science activities involve the transforma-
tion of complex and ambiguous content, scientific thinking skills, and resources that
support scientific investigations. Because of the complexity of the transformation,
many researchers have prioritized a selected part of the transformation such as the
development of scientific thinking skills in the inquiry cycle (White and Frederiksen
1998), the selection of knowledge for study (Linn and Songer 1991), the
technological resources needed (Edelson et al. 1999) or the benefits ideally present
in authentic learning situations (Cognition and Technology Group at Vanderbilt
(CTGV) 1992). Despite the complexity, the transformation of content knowledge,
inquiry skills, and resources should occur in concert.
In this study, an authentic science task was created through the simultaneous
transformation of content, scientific thinking, and resources for 6th grade students.
The purpose of this study is to investigate what kinds of authentic situations are
beneficial towards students’ knowledge-rich inquiry. Results of this study indicate
that students’ performances on the development of knowledge and inquiry depend
upon the complexity of authentic situations. From the situated learning perspective,
this paper deals with the importance of using authentic situations to develop rich
understandings about scientific knowledge and how to design science tasks that
prepare students to participate in social practices valued by the science
community.
Related research
Situated learning provides a theoretical foundation for implementing scientific
inquiry in science classrooms. Lave and Wenger (1991: 53) define learning as:
becoming able to be involved in new activities, to perform new tasks and functions, to
master new understandings. Activities, tasks, functions, and understandings do not exist in
isolation; they are part of broader systems of relations in which they have meaning, these
systems of relations arise out of and are reproduced and developed within social
communities, which are in part systems of relations among persons.
What is important in situated learning is to understand interrelationships among
learners, activity and world that are defined in a community of practice. Lave and
Wenger (1991: 98) identify that ‘a community of practice is an intrinsic condition
for the existence of knowledge, not least because it provides the interpretive support
necessary for making sense of its heritage’. Since knowledge is defined in a specific
community of practice, knowledge taught in the school setting may not reveal its
profound meaning. Brown et al. (1989: 34) pointed out that:
Too often the practices of contemporary schooling deny students the chance to engage in the
relevant domain culture, because that culture is not in evidence. Although students are
shown the tools of many academic cultures in the course of a school career, the pervasive
cultures that they observe, in which they participate, and which some enter quite effectively
are the cultures of school life itself.
From the situated learning perspective, the following sections illustrate the
importance of inquiry learning in science education, the role of authentic activities
in inquiry learning, and the transformation of scientific inquiry for students.
3. MAKING AUTHENTIC SCIENCE ACCESSIBLE 925
Importance of inquiry learning in science education
Inquiry approaches stem from an idea that science teaching and learning should
reflect how scientific knowledge is constructed. Scientific knowledge should not be
considered as self-evident facts or mere empirical verifications because it is
continuously revised and reorganized through theoretical and empirical investiga-
tions (Kuhn 1970). To conduct scientific investigations, scientists are involved in a
wide range of activities: reviewing what is already known, planning, making
observations, hypothesizing, experimenting, collecting and analysing data, propos-
ing explanations, and communicating results, to name a few. However, describing
scientific inquiry neither as a series of four- or five-step processes nor as a general
thinking skill is an accurate portrait of scientific inquiry (Millar and Driver 1987).
There is no one way of carrying out scientific inquiry across scientific disciplines
because each science community accepts specific ways to carry out inquiry in its
own discipline (NRC 2000).
Since scientific knowledge and thinking are intertwined in science, curriculum
developers are sometimes faced with a difficult challenge; whether to prioritize
content or thinking skills (DeBoer 1991). Some educators think these two goals are
competing rather than complementary (Edelson 2001). Programmes that prioritize
content focus on teaching science as a body of organized knowledge. Programmes
that prioritize thinking skills focus on developing scientific modes of thought such
as the scientific method, critical thinking, reflective thinking, and problem
solving.
Both approaches have been criticized from science, teaching, and learning
perspectives. From the science perspective, neither content nor thinking skills
depict science as it happens. Schwab (1962: 31) criticizes content approaches by
arguing that students
are shown conclusions of enquiry as if they were certain or nearly certain facts.
Furthermore, students rarely see these conclusions as other than isolated, independent
‘facts’. Their coherence and organization – the defining marks of scientific knowledge – are
underemphasized or omitted.
Millar and Driver (1987) disagree with thinking skills approaches because too much
attention is given to the inductive or empirical nature of science. From the teaching
perspective, teachers have difficulty teaching students to transfer what they learn,
either knowledge or thinking skills, to other applicable situations (Bransford and
Schwartz 1999). From the learning perspective, both approaches often downplay
the importance of the knowledge-acquiring context so a critical examination of how
various context features influence knowledge or skill development becomes
unnecessary (Perkins and Salomon 1989, Greeno 1998).
Role of authentic activities in inquiry learning
The idea of fostering inquiry in science education is hardly new. Bybee (2000) and
others find the origin of the idea as early as Dewey (for example, Dewey 1938).
Schwab (1962: 66) advocates the use of scientific inquiry as a pedagogical strategy
to achieve inquiring science classrooms that offer ‘not only the clarification of
inculcation of a body of knowledge but the encouragement and guidance of a
process of discovery on the part of student’. The National Science Education
Standards (NRC 1996) make it clear that scientific inquiry should not be
4. 926 H.S. LEE AND N.B. SONGER
interpreted as only one way of doing science such as hands-on experimentation or
reading about science. Rather, scientific inquiry is defined as ‘diverse ways in which
scientists study the natural world and propose explanations based on the evidence
derived from their work’ (NRC 1996: 23). In addition,
inquiry is a step beyond ‘science as a process’ in which students learn skills, such as
observation, inference, and experimentation. The new vision includes the processes of
science and requires that students combine processes and scientific knowledge as they use
scientific reasoning and critical thinking to develop their understanding of science. (NRC
1996: 105)
It is apparent that distinctions should be made between the scientific inquiry
scientists pursue in their professions and the scientific inquiry students can pursue
in their classrooms. These differences include: (1) the inquirer’s knowledge,
experience, attitude, and scientific thinking; and (2) the inquiry context (Bransford
et al. 2000). In addition, students’ inquiry is more constrained in terms of time and
resources (Edelson et al. 1999). Unlike scientists’ inquiry, students’ inquiry requires
a lot of guidance. The concept of scaffolding is firmly based on Vygotsky’s ‘Zone of
Proximal Development’ that refers to the gap between the actual level the student
can develop without assistance and the potential level the student can reach with
assistance from more knowledgeable others (Vygotsky 1978). Scaffolding for multi-
step inquiry tasks need to address novice inquirers’ lack of subject matter
knowledge, sophisticated strategies, and self-monitoring skills (Bransford et al.
1989, Chi et al. 1989, Clement 1991, Lewis and Linn 1994). Scaffolding by more
knowledgeable others can be accomplished through many different means. Some
examples of scaffolding include reciprocal teaching (Palincsar and Brown 1984),
modelling (Krajcik et al. 2000), prompting (Davis and Linn 2000), self-assessment
(Barron et al. 1998), and reflective assessment (White and Frederiksen 2000).
Studies demonstrate that these various kinds of scaffolding mechanisms improve
students’ conceptual understanding (White and Frederiksen 1998), reading
comprehension (Palincsar and Brown 1984), and knowledge integration (Davis and
Linn 2000).
The situated cognition theories suggest that retention and application of
knowledge depend upon the context in which knowledge is acquired. In the case of
scientific inquiry, students need to be involved in the culture where scientific inquiry
is possible. Traditional practices in science classrooms such as lectures, demonstra-
tions, and cookbook lab experiments rarely support a culture of inquiry and often
instead promote the culture of schooling. Authentic tasks are believed to support the
culture of science in classrooms. Even though there is still no consensus on what
constitutes authentic science tasks and how to create them, authentic activities are
defined as ‘ordinary practices of the culture’ (Brown et al. 1989: 34) or what
students face in the real world (NRC 1996). The former definition promotes the
adoption of scientists’ practices by helping students learn attitudes, tools,
techniques, and social interactions held by scientists (Edelson et al. 1999). The
latter definition promotes the use of everyday problems in order to draw students’
enthusiasm and develop attitudes for lifelong learning (Linn and Muilenburg
1996).
There are several ways to add authenticity to science tasks. First, authenticity is
addressed by using real-world problems faced by scientists (Edelson et al. 1999).
For example, ‘The Scientists in Action Series’ developed by the Cognition and
Technology Group at Vanderbilt (CTGV) consist of several activities that utilize
5. MAKING AUTHENTIC SCIENCE ACCESSIBLE 927
real-world problems such as a chemical spill by an overturned tanker on the highway
and the rescue of bald eagles in the wild. After watching video episodes, students
answer questions similar to those professionals address (Goldman et al. 1996).
CTGV emphasizes video as ‘anchors’ to stimulate students’ enthusiasm and
generate multiple opportunities to study complex problems (CTGV 1992). Second,
authenticity is obtained through students’ solutions of problems from their own
lives. Problems are pursued in students’ own projects (Blumenfeld et al. 1991,
Krajcik et al. 1998) or are presented to students by the curriculum (Barron et al.
1998). Third, authenticity is obtained by linking students and scientists through
data sharing, critiquing and direct communication (Pea 1994). In the Kids as
Global Scientists project, students interact with professional-quality data and
imagery and analyse live events through direct communication with scientists
(Songer 1998). Fourth, authenticity is added when science tasks address what
scientists do to reach common understandings including argumentation (Bell and
Linn 2000), presentation, and communication (Scardamalia and Bereiter 1991).
Socially constructed understandings about scientific knowledge among students
can happen in communities formed inside the classroom (Brown et al. 1993) or
across classrooms (Scardamalia and Bereiter 1994, Bell and Linn 2000).
Transformation of scientific inquiry for students
To create authentic tasks for students, the deliberate transformation of content
knowledge, scientific thinking skills, and resources is necessary. Some key findings
from studies that investigated these transformations are as follows.
Transforming content knowledge. As scientists develop more powerful and parsimon-
ious theories that explain a wider range of phenomena, the body of scientific
knowledge essential to them shifts. Because the fundamental knowledge underlying
such theories becomes complex and extensive, more powerful and parsimonious
theories are often abstract and hard for students to learn. Linn and Songer (1991)
examined whether more abstract molecular-kinetic models are better for 8th grade
students to learn about heat and temperature concepts than heat transfer models.
Even though molecular-kinetic models explain thermodynamic phenomena more
precisely, heat transfer models that map directly to real-world problems are more
powerful models for students’ explanation of natural world situations (Linn and
Muilenburg 1996). Thus, it is important to note that students can benefit from
using models of phenomena that map to familiar contexts even though abstract
models are more widely accepted in the science community.
Transforming scientific thinking skills. Despite the disagreement with defining
scientific inquiry as a series of processes (Millar and Driver 1987), since the 1960s
several activity sequences have been proposed to simplify and generalize the
scientific inquiry process (Karplus 1977). In one good example, White (1993)
proposed a sequence of inquiry activities consisting of prediction, experimentation,
formalization, and generalization to facilitate students’ construction of a set of
conceptual models through scientific modelling. White and Frederiksen (1998) later
refined this sequence towards an inquiry cycle that consists of question, predict,
6. 928 H.S. LEE AND N.B. SONGER
experiment, model, and apply, in order to emphasize the modelling aspect of
scientific inquiry within computer-generated microworlds. To increase students’
awareness of the inquiry cycle, White added a reflective assessment component that
encourages students to reflect on their performance at the end of each cycle. This
inquiry cycle approach with reflection led to deeper conceptual understandings
about force and motion than had been achieved before (White and Frederiksen
1998).
Transforming resources. Authentic learning necessitates the use of tools and resources
to enable students to form questions, plan and perform investigations, and
communicate results. As part of scientific inquiry it is important to experience the
changing nature of science (Schwab 1962). Traditional textbook-based resources
rarely support this kind of inquiry because students tend to perceive what is written
in the textbooks as unchanging truths. Recently, telecommunication technologies
have been used increasingly to offer students rich and up-to-date resources needed
for open-ended investigations. These tools help students model (Spitulnik et al.
1998), visualize data (Edelson et al. 1999), collect and analyse data (Mokros and
Tinker 1987, Nachmias and Linn 1987), communicate ideas (Scardamalia and
Bereiter 1994), and evaluate relevant information (Bell and Linn 2000). Design
principles for these technological tools deal specifically with learning objectives
based on current learning shortcomings. However, most research concludes that
these resources are not used optimally due to students and teachers’ lack of
knowledge and experiences.
What is necessary?
Taking the position of situated learning leads to the adoption of somewhat
complicated authentic activities for students’ inquiry. The question becomes how to
transform scientists’ inquiry to students’ inquiry successfully and what kinds of
impact it will create for learning. Greeno (1997) discussed this complexity when he
raised the question of ‘which combinations and sequences of learning activities will
prepare students best for the kinds of participation in social practices that we value
most and contribute most productively to the development of students’ identities as
learners?’ (Greeno 1997: 9). Although the National Science Education Standards
encourage content-rich inquiry learning and thinking in authentic contexts, the
nature in which features of the authentic contexts should be transformed to support
inquiry thinking is still far from understood. Since authentic activities are by
definition unique to each science discipline, an investigation leading to greater
characterization of the role of authentic activities will need to begin in the
disciplinary context. Therefore, this study investigated what characteristics of
authentic situations contribute to the development of knowledge-rich inquiry.
Findings in this research will give valuable insights on how to foster knowledge-rich
inquiry for students through very complicated and challenging authentic science
problems.
Methods
In this section the Kids as Global Scientists curriculum, subjects, forecasting task,
and data collection and analysis are described in detail.
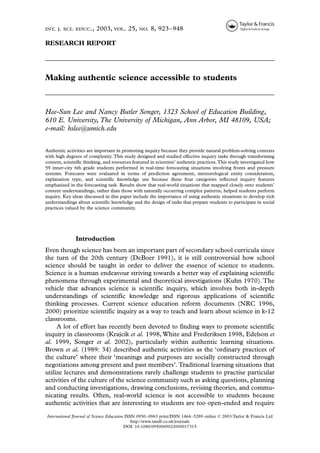
7. MAKING AUTHENTIC SCIENCE ACCESSIBLE 929
Figure 1. KGS CD-ROM.
Kids as Global Scientists curriculum
Kids as Global Scientists (KGS) is an 8-week, inquiry-based weather curriculum for
middle-school students (Songer 1996). Some parts of what meteorologists do are
transformed into inquiry tasks in the KGS curriculum, such as collecting local data,
comparing weather data from geographically different regions, interpreting real-
time weather maps and images, and making forecasts. KGS consists of inquiry tasks
that according to Songer et al. (2002):
᭹ foster deep fundamental knowledge and a strong conceptual framework.
᭹ build on and foster natural problem-solving abilities.
᭹ work directly with students’ own ideas, beliefs, and conceptions.
᭹ provide effective guidance and modelling for students’ own queries.
In incorporating inquiry in the KGS curriculum, five essential features of
classroom inquiry (NRC 2000: 25) were adopted. These five features are:
᭹ Learner engages in scientifically oriented questions.
᭹ Learner gives priority to evidence in responding to questions.
᭹ Learner formulates explanations from evidence.
᭹ Learner connects explanations to scientific knowledge.
᭹ Learner communicates and justifies explanations.
Each curricular activity engages students in scientifically oriented questions
initiated by the curriculum as well as students. In each activity students collect
evidence to explain their responses to scientific questions. Students have opportun-
ities to evaluate alternative explanations from students and meteorologists across
the USA. KGS provides two technological tools for students to utilize resources
8. 930 H.S. LEE AND N.B. SONGER
inside and outside the classroom: the World Wide Web message board for an
organized online communication and the KGS CD-ROM, as shown in figure 1, for
an access to real-time weather data and imagery used by professional scientists.
Since 1992, KGS has been offered throughout the USA. Teachers register their
classes on the project website (http://www.onesky.umich.edu) to receive curriculum
materials, access to online resources, and teacher support. During 8 weeks in
February and March each year, students collaboratively learn about weather with
students and scientists (Songer 1998). In KGS 2000, 13 065 individuals from 230
schools in 35 states participated. Unlike other similar technology-rich science
programmes that target a small number of well-supported, privileged schools, KGS
has been adopted in less idealistic settings. For instance, the KGS 2000 statistics
indicated 40 per cent of 230 schools were located in urban settings.
Forecasting task
The real-time forecasting task was a culminating activity in the KGS curriculum.
The task was posted on the online message board during the last 4 weeks of the
KGS curriculum and was open to all the KGS schools. This task satisfied two
authentic activity criteria described in the National Science Education Standards:
simulating the culture of what scientists do (Ahrens 1994) and providing problem-
solving activities that are accessible to students in their daily lives (Ault 1994). To
model and support the prediction-making task, a weather specialist provided a daily
content insight on the focus city on the message board during the forecasting
period. Designing the real-time forecasting task involved the transformation of
content knowledge, scientific thinking skills, and resources from meteorologists’
forecasting practices towards a useful authentic learning task for students.
Transforming content knowledge
The purpose of the forecasting task was to develop rich understandings about
weather systems in real-world weather situations. Throughout the forecasting
period, target cities were changed every three days, which allowed students to see
changes during the passage of weather systems including cold, warm, stationary and
occluded fronts and high and low pressure systems. Figure 2 shows an example of
forecasting questions posted on 22 March 2000, for Denver, Colorado, USA.
Instead of making their own forecasts on any meteorological entity, students were
guided to make predictions on minimum and maximum temperatures, cloud
condition, precipitation, and wind direction in a multiple choice format. These four
meteorological entities were chosen because they tend to change drastically during
the passage of weather systems. Students explained their predictions separately for
temperature, cloud, and wind in the open-ended format.
Making scientifically sound forecasts requires students to consider local weather
conditions as well as nearby weather systems. If weather systems are the dominant
influence on weather outcomes, the results are somewhat predictable. However, in
most cases weather systems interact with several other influences including
geography such as large bodies of water, high mountains, and deserts, resulting in
more inexact estimations of changes over time.
9. MAKING AUTHENTIC SCIENCE ACCESSIBLE 931
Hi KGSers, Today is the last day to forecast tomorrow’s weather in Denver, CO. After more
than 24 hours of light snow that just ended yesterday afternoon, do you think people in Denver
will enjoy warm and sunny weather? What kind of weather system is coming to Denver? Is it
fast enough to get there in time for your forecasting? Remember you make your own forecast
for the weather in Denver at 3:00 PM MST.
Question 1: We think tomorrow’s maximum temperature for this city will be
᭹ A lot lower than today: –10 F (–5 C) or more change
᭹ Moderately lower than today: –3 to –9 F (–2 to –4 C) change
᭹ Steady or slight change: –2 to 2 F (–1 to 1 C) change
᭹ Moderately higher than today: 3 to 9 F (2 to 4 C) change
᭹ A lot higher than today: 10 F (5 C) or more change
Question 2: We think tomorrow’s minimum temperature for this city will be
᭹ A lot lower than today: –10 F (–5 C) or more change
᭹ Moderately lower than today: –3 to –9 F (–2 to –4 C) change
᭹ Steady or slight change: –2 to 2 F (–1 to 1 C) change
᭹ Moderately higher than today: 3 to 9 F (2 to 4 C) change
᭹ A lot higher than today: 10 F (5 C) or more change
Reasons for our prediction on Question 1 & 2 are
Questions 3: We think the weather in this city tomorrow around 3:00 PM will be
᭹ Sunny (0–10 % cloud coverage)
᭹ partly cloudy (20–50 % cloud coverage)
᭹ mostly cloudy (50–90 % cloud coverage)
᭹ overcast without precipitation
᭹ overcast with rain
᭹ overcast with snow
Reasons for our prediction on Question 3 are
Question 4: We think that around 3:00 PM the wind will blow from
North Northeast East Southeast
South Southwest West Northwest No wind
Reasons for our prediction on Question 4 are
Figure 2. Forecasting questions for 22 March 2000.
Transforming scientific thinking
Table 1 lists how five essential features of classroom inquiry were transformed for
the meteorologists’ real-time forecasting task and which inquiry features were
assessed in this study. In transforming inquiry for forecasting, two inquiry features
were emphasized: the formulation of explanations from evidence and the
connection of explanations to scientific knowledge.
10. 932 H.S. LEE AND N.B. SONGER
Table 1. Inquiry in the KGS forecasting task and coding categories for this
study.
Essential features of classroom Forecasting task organization
inquiry* according to inquiry features Coding categories
Learner engages in What will tomorrow’s Not assessed: Question is
scientifically oriented weather be like in – – (city provided for learner.
questions. name)?
Learner is guided what to
forecast through a series of
sub-questions. (See table 2)
Learner gives priority to Learner uses the KGS CD- Not assessed: Students are
evidence in responding to ROM and other real-time guided to collect evidence.
questions. web resources to explore
weather situations around
the city. (See figure 1)
Learner formulates Learner explains how (Meteorological entity
explanations from evidence. temperature, cloud consideration) How many
condition, and wind meteorological evidences do
direction change with students consider?
evidence. (Explanation type) What
kind of reasoning students
provide from the evidence?
Learner connects Learner’s explanation (Scientific knowledge use)
explanations to scientific reflects the level of How consistent and
knowledge. understanding about his/her sophisticated are students’
knowledge of weather forecasts in conjunction with
systems. scientific knowledge?
Learner communicates and Learner compares his/her (Prediction agreement) How
justifies explanations. explanations with other well do students’ forecasts
students’ explanations and match what actually
weather experts’. happened?
Learner compares his/her
forecast results with actual
data.
* Taken from table 2–5 (NRC 2000: 25).
Transforming resources: KGS message board and CD-ROM
The web-based KGS message board system allowed participation by the weather
specialist and students from different locations. Each day a city was selected from
the weather specialist’s choices and announced on the KGS message board. The
forecasting cycle took 3 days to complete. On the first day students in small groups
logged onto the KGS message board to view the forecasting questions. They
explored various resources including the KGS CD-ROM and other weather-related
websites to answer the questions. Students’ predictions of temperature change,
cloud condition, and wind direction were posted and justified. At the end of the
second day data were collected and posted on the message board. The weather
specialist also posted explanations of the previous day’s weather situation. On the
11. MAKING AUTHENTIC SCIENCE ACCESSIBLE 933
third day students compared their predictions with the actual data and the
specialist’s explanation.
The KGS CD-ROM shown in figure 1 was used to enable students to explore
real-time weather data, maps, and images effectively. Weather maps and images the
user chooses are shown in the display area at the centre. If the user locates a city, the
current information on that city appears in the right data column. The user can view
the data in metric or American units. Five base map choices are infrared and visual
satellite images, humidity, temperature, and wind chill. A base map covers the entire
display area. Overlay map choices – overlaid on a base map – are pressure,
precipitation, winds, and fronts. As many overlay maps as the user chooses to apply
can be displayed. The user can also draw and erase with the editing tools on the
weather map.
Many features in the KGS CD-ROM were designed to accommodate what
meteorology novices would need to observe real-time weather effectively. Lowe’s
work (1988, 1993, 1996) on the differences between professional weather
forecasters and undergraduates in the cognitive processing of weather maps
articulates major considerations made in the development of the KGS CD-ROM.
Lowe (1996) identified that undergraduates generally had difficulties in visualizing
weather systems beyond the weather map and in estimating the change of weather
patterns over time. On the KGS CD-ROM the magnifier allows students to view
weather maps over a specific region as well as over an entire continent. In addition,
students can view still images of current weather and animated images of weather
over a 24-h or 4-day period. Lowe (1996) also found that, owing to their lack of
knowledge in meteorology, undergraduates focused on external visuo-spartial
aspects of weather maps without understanding meteorological relationships. On
the KGS CD-ROM, two or more weather maps can be overlapped to allow students
to test the relationships between weather elements. Lowe (1988) recommended
explicit visual cues to foster making connections between information on the
weather maps and personal experiences. On the KGS CD-ROM the clothing of
the bunny, the weather outside the window, and the thermometer facilitate the
connections between everyday experiences and scientifically visualized
information.
Subjects
The forecasting data were collected on the KGS message board from distant
locations as well as from local classrooms. During the 4 weeks of the forecasting
period, 251 forecasts from 20 schools in eight states were collected. The schools
consisted of five elementary schools, 10 middle schools, three high schools, and two
home schools. The total number of forecasting posts from each school varied,
ranging from one post to 96 posts. This variation occurred because the KGS
curriculum did not specify how many times students needed to forecast online. For
this study, the forecasts from one focus school were selected for detailed analysis.
This local school was selected because it was necessary to collect detailed
observations on the classroom practices associated with forecasting as well as the
forecasts themselves in order to have a comprehensive understanding of the data.
The local school was located in an urban school district where 95 per cent of the
students are African-American and 70 per cent receive a free or reduced lunch. This
school has been involved with various technology-rich projects as a result of the
12. 934 H.S. LEE AND N.B. SONGER
enthusiasm of Ms Adams, a technology teacher. KGS has been implemented by
various science teachers in this school since 1997. Ms Adams and Ms Truman
partnered for the teaching of technology-rich science. Ms Truman has been
teaching middle school science for more than 13 years and had 1 year of teaching
experience with KGS prior to this study. Ms Adams helped Ms Truman when the
KGS classes took place in the computer lab.
Data collection
The implementation of the real-time forecasting task was discussed with Ms
Truman and Ms Adams. They agreed to an idea that forecasting would be a good
opportunity for students to apply the knowledge they obtained about weather. They
implemented the forecasting task three times, providing current forecasts for the
cities of Dallas, Buffalo and Denver in the USA. Prior to this task, students learned
about meteorological entities and weather systems through hands-on experiments,
KGS CD-ROM investigations, and message board communications. During the
forecasting task, Ms Adams and Ms Truman gave students several questions to
ponder for the exploration of weather maps. Two students were paired to explore
weather maps on the KGS CD-ROM but made separate forecasts. Three weather
situations forecast by students are shown in figure 3.
In summary, three forecasting situations provided different challenges to
students. On 14 March 2000 in Dallas, Texas, a locally developed low pressure
system occurred without accompanying fronts. This quickly became a problem to
students who were familiar with cold and warm fronts attached to the low pressure
system, not the one without them. This low pressure system was caused by the
heating of a large body of water in the Gulf of Mexico, not by the meeting of the cold
air and the warm air. A cold front passing over Buffalo, New York, featured on 16
March 2002, exactly followed a textbook example (Ahrens 1994). On 23 March
2000, the weather for Denver, Colorado, was more complicated than the previous
2 days because, without a dominant weather system, high and low pressure systems
around Denver moved unexpectedly. Eventually, the high pressure system near the
Rocky Mountains affected Denver’s weather. As the high pressure system moved
from the high mountains to Denver, the air heated up adiabatically. Among the
three forecasting situations, the weather specialist indicated that Buffalo was the
easiest case and Denver was the most difficult case because of the influence of local
geography on the weather outcomes. Hereafter, the three forecasting situations will
be referred to by their city name.
Data analysis
This research investigated how the complexity of authentic real-time weather
situations affected students’ development of knowledge and inquiry. As shown in
table 1, the development of knowledge and inquiry was assessed in students’
explanations for temperature, cloud condition, and wind direction in terms of
meteorological entity consideration, explanation type, and scientific knowledge use.
In addition, prediction agreement with actual data was assessed based on students’
responses to four multiple choice predictions on minimum and maximum
temperatures, cloud condition, and wind direction.
13. MAKING AUTHENTIC SCIENCE ACCESSIBLE 935
Weather situation students Major weather system Knowledge for forecasting
forecasted
03/14/2000, Dallas, TX On 03/14 a storm system ᭹ Low pressure system that
was fuelled by the large does not accompany
amount of the warm and fronts
moist air from the Gulf of ᭹ Cloud coverage
Mexico. As this system ᭹ Geographical influence of
moved to Louisiana on the Gulf of Mexico
03/15, clouds gradually
decreased toward the
afternoon.
Actual data on 03/15
᭹ Max. temp.: moderately
higher
᭹ Min. temp.: steady
᭹ Cloud: mostly cloudy
᭹ Wind direction: east
03/16/2000, Buffalo, NY On 03/17 as the cold front ᭹ Cold front
had passed, the temperature ᭹ High pressure system
dropped significantly. The
high pressure cell behind the
cold front caused north-
westerly wind and clear
skies.
Actual data on 03/17
᭹ Max. temp: a lot lower
᭹ Min. temp: moderately
lower
᭹ Cloud: partly cloudy
᭹ Wind direction: northwest
03/22/2000, Denver, CO On 03/23 the high pressure ᭹ High pressure system
near Denver caused winds ᭹ Cloud coverage
to blow from W-NW. Due to ᭹ Geographical influence of
the high mountains these the Rocky Mountains
winds were down slope
winds, which made the
moving air heat up
adiabatically. Around the
high pressure the cloud
cover was not extensive.
Actual data on 03/23
᭹ Max. temp.: a lot higher
᭹ Min. temp.: moderately
higher
᭹ Cloud: partly cloudy
᭹ Wind direction: northwest
Figure 3. Three days of forecasting.
14. 936 H.S. LEE AND N.B. SONGER
Table 2a. Coding scheme: actual data to code prediction agreement.
Date Max. temp* Min. temp* Cloud condition Wind direction†
15 March 2000 Higher ( + 8.1°F) Steady ( + 1.1°F) Mostly cloudy E (SE–NE)
17 March 2000 Lower (–22.0°F) Lower (–5.0°F) Partly cloudy NW (N–W)
23 March 2000 Higher ( + 18.0°F) Higher ( + 8.0°F) Partly cloudy NW (N–W)
* The values in the parentheses were the actual temperature differences between the day students forecasted and
the following day.
† We allowed + /– 45° from the actual wind direction for a correct response.
Prediction agreement. Students’ predictions on minimum and maximum tem-
peratures, cloud condition, and wind direction were scored by comparing them with
actual weather data as shown in table 2a. For each weather element, one point was
given if students’ prediction agreed with actual data. A total prediction agreement
score on a particular day was calculated by combining the scores of four weather
elements, ranging from zero to four points. ANOVAs were performed to compare
total prediction agreement scores across three forecast situations.
Meteorological entity consideration. This coding rubric evaluated how many
meteorological entities were incorporated into students’ explanations. This decision
Table 2b. Coding scheme: evidence in explanation.
Coding categories Criteria Examples
Meteorological entity Count the number of For cloud prediction: ‘Because
consideration meteorological entities cited in of the front and the temperatures
the explanation such as around Buffalo and the
temperature, pressure, wind, temperatures today, and I chose
precipitation, cloud, humidity, partly cloudy because scattered
fronts, pressure systems, air clouds are moving north of
mass, etc. Buffalo coming from the south.’
(3 meteorological entities in
this explanation.)
Explanation type Persistent: The reasoning Persistent: ‘Tomorrow the wind
presented in the explanation will blow from southeast
was based on a consistency because the wind is coming
between current weather and from southeast today.’
future weather. Local: ‘It will be a lot lower
Local: The reasoning was based than today because you can see
on predicted relationships all of the cold winds coming
between measurement-based from the east.’
entities without referring to the Systemic: ‘It is going to be a lot
weather system. lower from today because the
Systemic: The reasoning was cold front is moving out from
based on the behaviours of the Buffalo.’
weather elements within the
weather system.
15. MAKING AUTHENTIC SCIENCE ACCESSIBLE 937
Table 2c. Coding scheme: scientific knowledge use.
Score Criteria Examples
0 Students restated their prediction. I think Dallas, TX, will have a slight
Students cited the current weather steady change for maximum.
without mentioning why this projection Tomorrow will be partly cloudy because
would be possible. it is not that cloudy in Denver [right
Students did not use weather. now].
I saw it from the computer.
1 Students used the relationships between Min and max temperatures will be higher
weather elements and/or weather systems because the cold fronts and winds are
but their explanations were somewhat coming from the northwest.
incomplete or inconsistent. It is going to be colder because of the
low pressure system is close by Denver
and it will be a lot lower.
2 Students used the relationships between I think the maximum temperature will go
weather elements and/or weather systems down because if the clouds stay for a
appropriately, and their explanations long period of time, it’s going to block
were consistent and scientifically the sun that heats it up.
elaborated.
was based on Lowe’s study (1996) that, compared with non-experts, professional
weather forecasters provided rich explanations about weather phenomena because
they were able to consider more meteorological entities. Lowe (1996) defined
meteorological entities as constituents of the weather map such as temperature,
pressure, humidity, wind, and fronts. Each day’s total number of meteorological
entities was calculated by combining the scores for the number of meteorological
entities presented in temperature, cloud, and wind explanations. A higher score
revealed more meteorological entities incorporated into explanations. ANOVAs
were performed to compare the total number of meteorological entities students
considered in their explanations for the three forecasting situations.
Explanation type. Depending on the reasoning students provided, their explanations
were categorized as persistent, local, and systemic as adapted from Ahrens (1994).
‘Persistent’ explanations assume that future weather is the same as current weather.
‘Local’ explanations use local measurements of meteorological entities such as
temperature, pressure and wind. ‘Systemic’ explanations include weather systems.
Systemic explanations were considered to be the strongest because weather systems
are the dominant influence on weather outcomes. The intercorder reliability was
0.95.
Scientific knowledge use. Students’ explanations were coded on a scale of 0–2 based
on the consistency and sophistication of scientific knowledge. Zero points were
assigned if students (1) restated their answers to multiple-choice-based predictions,
(2) cited current weather without mentioning why this projection was possible, or
(3) did not use any weather concepts. One point was assigned if students used the
relationships between weather elements and/or weather systems but their explana-
16. 938 H.S. LEE AND N.B. SONGER
tions were incomplete or inconsistent. Two points were given if students used
relationships between weather elements and/or weather systems appropriately, and
their explanations were consistent and scientifically elaborated. To calculate a total
scientific knowledge score for each day, three knowledge scores for temperature,
cloud, and wind explanations were combined for a possible score of six. The
intercorder reliability was 0.90. ANOVAs were performed to compare the total
knowledge scores across three forecast situations.
Results
In this section, two major findings are described: (1) how students’ performances on
prediction agreement, meteorological entity consideration, explanation type, and
scientific knowledge use depended upon weather situations students faced, and (2)
how students applied their knowledge to forecasting. Results of data analyses are
presented by each coding category with examples of student work.
Prediction agreement
Figure 4a shows how well students’ predictions agreed with the actual weather data.
Students’ predictions were most accurate in the Buffalo case (M = 2.11, SD =
1.13) compared with the Denver case (M = 1.13, SD = 0.92) and the Dallas case
(M = 1.42, SD = 0.91). This pattern was statistically significant: F(0.05, 2) =
15.1, p < 0.001. This tendency agreed with the weather specialist’s forecasting
difficulty rating as explained earlier. Forecasting difficulty depended upon how
closely actual weather followed typical weather patterns caused by the dominant
weather system. Similarly, Ahrens (1994) indicated that cold fronts in the Northern
Hemisphere during the winter, like the one in the Buffalo case, are most
predictable. In the other two cases, local geographies such as a large body of water
in the Gulf of Mexico and the Rocky Mountains contributed to the unusual weather
system behaviours that made forecasting more difficult.
Meteorological entity consideration
One of the differences between professional meteorologists and novice learners is
experts’ ability to process many meteorological entities towards more accurate
forecasts. As shown in figure 4b, the average number of meteorological entities
considered in each forecast was highest in the Buffalo case (M = 3.83, SD = 1.89)
and lowest in the Dallas case (M = 2.81, SD = 1.49) with the Denver case in the
middle (M = 3.54, SD = 1.78). This difference was statistically significant: F(0.05,
2) = 5.4, p < 0.01. The largest differences occurred between Dallas and Buffalo
cases as confirmed by the Tukey’s post-hoc test: p < 0.01. These differences
occurred because more students incorporated weather systems information into
their explanations in the Buffalo case to explain the noticeable cold front. Results
also indicate that students considered more entities with time and experience.
Significant differences existed in the number of meteorological entities in
explanations between Dallas and Denver cases: p < 0.05. In general, consideration
of more meteorological entities resulted in stronger scientific explanations.
However, mere consideration of more meteorological entities did not always result
18. 940 H.S. LEE AND N.B. SONGER
in scientific explanations and accurate prediction, as shown in the following
examples from student temperature predictions for Dallas:
Student A: There will be cold air. It is going to move to Dallas because the coverage of the
clouds is going to affect the temperature. The wind is medium so it [the maximum
temperature] may be cold and the temperature at night [the minimum temperature] will be
cool also.
Student B: The maximum temperature is [going to be] higher. The reason I think it’s going
to be hot [is] because the warm air mass is coming from the south [the Gulf of Mexico].
Student A’s explanation includes more meteorological entities – cold air, clouds and
winds – than Student B’s explanation – warm air – but Student A’s explanation is
scientifically incomplete because she did not elaborate how cloud coverage affected
temperatures. As a result, Student A’s explanation was scored high in the
meteorological entity consideration category and low in the scientific knowledge use
category, while Student B’s explanation was scored in the opposite way. Scientif-
ically productive forecasting requires students to consider salient meteorological
entities that would affect the next day’s weather instead of every meteorological
entity the weather map provides.
Explanation type
Figure 5 shows the classification result of students’ explanations for temperature,
cloud and wind predictions. In the Dallas case, system-based forecasts were rare for
all cities including temperatures (14%), clouds (5%) and winds (3%). The
proportion of system-based forecasts increased for temperature in the next 2
forecasting days (64% for Buffalo; 42 % for Denver). System-based cloud and wind
explanations also increased but not as much as system-based temperature
explanations.
Explanation type was related to what type of meteorological entities students
considered in explaining their predictions. When students considered only a
meteorological entity that was going to be predicted, i.e. temperature for
temperature prediction, it was unlikely that making more forecasts would improve
their ability to consider changes caused by the weather system. For example, a
student predicted maximum temperature would be steady ‘because today is 35(F
and the temperature will not change’; and for wind prediction ‘tomorrow will be
NW because today is NW’. Figure 5 shows that persistent forecasts like these were
common for cloud and wind predictions regardless of weather situations. This
indicated that students had difficulty understanding how clouds and winds
influence predictions in a real world context. Other students offered explanations
that were based only on local signs. This type of explanation was different from the
system-based explanations because it often failed to recognize the relationships
between local signs that took place within the weather system.
Forecasting experts recognize that weather operates as a system. Unlike experts,
students did not often consider weather systems except the cold front system in
forecasting. Students did not easily connect the idea that pressure systems are
strongly related to temperature change, wind direction, and cloud formation. The
direction from which winds blow can determine temperature. In Dallas, the south-
westerly winds brought warm air from the Gulf of Mexico resulting in high
temperatures. The distribution of high and low pressure systems can indicate the
19. MAKING AUTHENTIC SCIENCE ACCESSIBLE 941
(a) Temperature
(b) Cloud
(c) Wind
Figure 5. Explanation types by weather system.
20. 942 H.S. LEE AND N.B. SONGER
wind direction because winds blow from the high pressure centre and towards the
low pressure centre. Cloud formation is associated with rising air above low pressure
systems and cloud dissipation is associated with sinking air above high pressure
systems. Students often cite ‘Low pressure brings bad weather and high pressure
brings fair weather’ without knowing this relationship between cloud formation and
pressure systems.
Scientific knowledge use
Figure 4c shows that the level of scientific knowledge expressed in students’
explanations was highest in the Buffalo case (M = 2.27, SD = 1.73), lowest in the
Dallas case (M = 1.27, SD = 1.06), and in the middle in the Denver case (M =
1.76, SD = 1.19). This difference was statistically significant, F(0.05, 2) = 14.75,
p < 0.001. Tukey’s post-hoc test shows significance between the Dallas and the
Buffalo cases, p < 0.001. Scientific knowledge in students’ explanations appeared
to improve as they repeated forecasting because, even though the Denver case was
more difficult than the Dallas case, several general patterns demonstrating good and
weak uses of evidence were observed. Four are discussed here.
Weather systems. The goal of teaching weather systems was to show how
meteorological entities interact within a system. When weather systems such as
high and low pressure cells or cold fronts were addressed for the purpose of
forecasting in the curricula, students would use these systems to predict
temperature, cloud, and wind patterns. However, students did not equally
incorporate various weather systems into their forecasting. Cold front systems
were used more often by students to explain temperature, cloud and wind
predictions than other systems:
Student C: Minimum and maximum temperatures will be much lower than today because
the cold air is pushing clouds away so it will be cold because there are no clouds to keep
Buffalo warm.
Student D: It will be partly cloudy because the cold front is pushing clouds. The high
pressure creates winds that blow away clouds.
Student E: The wind direction will be Northwest because it is the cold wind coming behind
the cold front and the cold front which just passed through Buffalo, NY.
Some students considered pressure distribution to estimate wind direction such as
‘the wind is going from high pressure’ or ‘the wind is going toward the low pressure’.
However, most students rarely considered pressure to determine wind direction.
Many students connected wind direction with the movement of the cold front.
Relationships between meteorological entities. Some students used relationships
between meteorological entities to predict upcoming weather. The following
example illustrates the consideration of a relationship between cloud coverage and
temperature:
Student F: The minimum temperature will be steady because the clouds in the sky are
keeping it warm so it will stay the same all night because the clouds keep it warm at night
just like our blankets and the clouds are moving.
One of the common mistakes was relating high (low) temperature to high (low)
pressure such as ‘the clouds will keep themselves warm which will make the pressure
21. MAKING AUTHENTIC SCIENCE ACCESSIBLE 943
go higher’ and ‘I think the temperature will go up a little bit because of the pressure
will go up’. The relationship between temperature and pressure in weather systems
is not the same as the relationship between temperature and pressure in thermal
physics. As a container half filled with water is heated, the pressure of the container
increases owing to the increased movement of gaseous molecules. In the atmosphere
as the heated air rises, its density decreases, resulting in lower pressure. Another
misconception is the relationship between low (or high) temperature and cloud
formation such as ‘I think it will be partly cloudy because the temperature is going
to be low and when the temperature is low sometimes the clouds come out’. The
consideration of dew point or humidity provides more relevant evidence for cloud
formation.
Weather system movement. In general, students had difficulty estimating changes in
the movement and strength of weather systems. Some students made forecasts
assuming that all weather systems would stay in the same places for the next day.
Other students thought weather systems always moved from west to east. This
overgeneralization occurred because of the general movement of weather systems
due to the prevailing westerlies in the middle latitude. As a result, some students
thought winds always blew from west to east:
Student G: I think the wind is coming from the west. The reason why is that the wind is
blowing in a rounded or boxed path basically. The wind goes around and now it is blowing
from the west. The wind is pushing from the west because it blows in a circle path. The winds
are blowing around in a circle all around the earth.
Geographical features. Students rarely incorporated geographical influences into their
forecasts. Perhaps students did not consider geography because they were not
familiar with its influence on weather. Large bodies of water affect weather owing to
the supply of humid air. Mountains are important because they can force the air to
go up or down depending upon their slope. Rising (sinking) air is related to cooling
(heating) of the air, resulting in cloud formation (dissipation). No students
considered mountains to forecast the weather of Denver, while several students
mentioned the influence of the Gulf of Mexico on the weather of Dallas.
Student H: The temperature will be higher because the water from the Gulf of Mexico is
carrying moisture and the water evaporated and makes clouds and more and more clouds
keeps the earth warm.
Discussion
National Science Education Standards (NRC 1996) put a strong emphasis on
scientific inquiry for k-12 science classrooms because of the emphasis on rich
understandings of scientific knowledge beyond simplistic definitions. Scientific
inquiry presented in scientists’ authentic practices can be used for students’ inquiry
if the situation is transformed so that it is accessible and relevant to students’ lives.
For this research, a real-time forecasting task was developed through the
simultaneous transformation of content knowledge, scientific thinking skills, and
resources and implemented in 6th grade urban middle-school classrooms. This
study investigated whether students’ development of knowledge and inquiry
differed on account of the scientific complexity involved in authentic forecasting
situations. Results show that the scientific complexity of forecasting situations
22. 944 H.S. LEE AND N.B. SONGER
influenced students’ explanations for their predictions as well as their forecasting
accuracy. When forecasting situations closely matched their content understandings
about weather systems, students were better able to use scientific knowledge and
evidence in their explanations. In addition, results show that students did not always
apply knowledge about weather systems to forecasting spontaneously. Students
applied the cold front system better than the high and low pressure systems because
they acquired the cold front system through a curricular activity where they
explored how weather patterns change as the cold front system moved over a region.
Students exercised their understandings about weather systems more actively for
forecasting temperatures than clouds or winds. Students’ forecasting difficulties
resulted from both their misconceptions about relationships among meteorological
entities and real-world weather situations complicated by local geography.
While National Standards and policy documents advocate the use of authentic
contexts for problem solving and scientific experimentation, this study shows that
not all authentic situations are appropriate for the development of students’
understandings of scientific knowledge. The following section outlines three
guidelines for the development and transformation of science activities that utilize
authentic contexts for student inquiry: (1) Real-world situations must map closely
to students’ content understandings and curricular activities; (2) authentic science
tasks should be developed through the simultaneous transformation of content
knowledge, scientific thinking and resources; and (3) students need specific
guidance for the use of transformed products towards inquiry learning goals.
Real-world situations must map closely to students’ content understandings
and curricular activities
Real-world situations are inherently complex even for professional scientists
because they are ill defined and contain so many uncontrolled variables that
influence outcomes. As a result, some authentic real-world situations cannot be
used effectively by students. Real-world situations that closely match simple
patterns in the knowledge students possess provide a better opportunity for the
application of students’ developing knowledge. When real-world situations distantly
resemble the way knowledge is previously presented to students, they are likely to
experience difficulty applying their knowledge and often resort to non-scientific
reasoning.
A real-time forecasting activity in this study was created for students so that they
could predict future weather using current weather information. Results of this
study demonstrate that weather situations should be carefully selected to enable
students to practice inquiry about weather systems. The Buffalo case served as a
perfect example for students to apply the cold front concept because the cold front
featured in this case behaved exactly as experienced earlier by students. However,
Dallas and Denver cases were much more difficult because students needed to
incorporate understanding of local geography towards predicted outcomes.
Authentic science tasks should be developed through the simultaneous
transformation of content knowledge, scientific thinking and resources
Developing scientific knowledge through scientific inquiry can have cognitive,
motivational, and epistemological benefits because of ‘the relational interdepend-
23. MAKING AUTHENTIC SCIENCE ACCESSIBLE 945
ency of agent and world, activity, meaning, cognition, learning, and knowing’ (Lave
and Wenger 1991: 50). The development of scientific knowledge distinct from
contexts of use is long thought to be a problem of traditional science instruction. To
create inquiry tasks for students based on scientists’ practices, transformation of
content knowledge, scientific thinking, and resources is necessary owing to the
fundamental differences between scientists and students in their domain-specific
knowledge, sophisticated strategies, and resources (Kuhn 1989). In addition, this
transformation needs to occur in concert to support curricular learning goals
effectively. A good way to achieve this result is to employ a team of specialists in
areas of science, education, and technology in developing curricular activities.
One example of transformed resources is the KGS CD-ROM. The real-time
forecasting task asked students to make 24-h forecasts on temperature, cloud
condition and wind direction in a city. These meteorological entities were chosen
because their changes were strongly associated with the passage of weather systems.
With the KGS CD-ROM, students could explore three meteorological entities in
real-time, 24-h animation, and 4-day animation formats. Real-time weather maps
on the KGS CD-ROM allowed students to evaluate current weather conditions for
any city. Animated weather maps and images were useful for students to estimate
how fast weather systems moved and how their strength changed over time.
Moreover, to enable students to examine changes in these three meteorological
entities, the KGS CD-ROM also provided fronts and pressure maps. The
transformation and presentation of specific content in specific formats connected to
student inquiry activities illustrates the importance of resource transformation that
is aligned with learning goals. Without the specific transformation of content and
resources in the KGS CD-ROM, student inquiry through forecasting would not be
possible.
Students need specific guidance for the use of transformed products towards
inquiry learning goals
Developing scientific understandings through authentic inquiry is challenging
because students do not often possess the background knowledge or thinking skills
to reduce the complexity of the authentic inquiry situations. In the KGS
curriculum, several supports were present to guide students appropriately. Relevant
weather background knowledge was provided through both the weather map
presentation and weather specialists. Features on the KGS CD-ROM interface
organized the presentation of weather maps and images – for example, only certain
maps could be overlaid on others – to guide students towards salient weather
features (Songer and Samson 2000). On the web-based KGS message board,
weather specialists provided daily weather updates and explained certain weather
patterns outcomes. Experts’ weather knowledge also reduced the burden that might
be imposed on teachers, allowing easier guidance of students’ thinking.
This study also demonstrates that in two of the three forecasting cases the
transformation of content knowledge, scientific thinking and resources into a real-
time forecasting task did not result in a simple authentic learning experience for all
students. While the current curricular supports specifically reduced some of the
unnecessary complexity so that students could more easily focus on salient problem
features, they did not provide all of the necessary information such as information
on local geography.
24. 946 H.S. LEE AND N.B. SONGER
Conclusion
Unlike traditional laboratory tasks which are often used to foster inquiry, authentic
inquiry tasks provide opportunities for students to experience knowledge develop-
ment in actual contexts of use. As students often lack much of the necessary
background knowledge and inquiry skills required to build successful explanations
in these contexts, educators need to organize the resources, content and activities
carefully into transformed products that make inquiry accessible. This study
provided a case for the transformation of resources, content and thinking into a
science activity that capitalizes on authentic contexts and data towards knowledge-
rich inquiry understandings. Authentic activities are important in promoting
inquiry because they can provide opportunities for students to develop ‘identities as
capable and responsible learners’ (Greeno 1997: 9), but they sometimes provide
unnecessary complexity. Simultaneous transformations can reduce the complexity
of real-world contexts towards the learning benefits available with authentic
science.
Acknowledgements
This material is based in part upon research supported by the National Science
Foundation under grants REC–9896054 and REC–9805472. Any opinions,
findings, and conclusion or recommendations expressed in this publication are
those of the authors and do not necessarily reflect the views of the National Science
Foundation.
References
AHRENS, C. D. (1994) Meteorology Today (New York: West Publishing Company).
AULT, C. R., Jr (1994) Research on problem solving: earth science. In D. L. Gabel (ed.), Handbook
of Research on Science Teaching and Learning (New York: Macmillan), 269–283.
BARRON, B. J. S., SCHWARTZ, D. L., VYE, N. J., MOORE, A., PETROSINO, A., ZECH, L., BRANSFORD,
J. D. and THE COGNITION AND TECHNOLOGY GROUP AT VANDERBILT (1998) Doing with
understanding: lessons from research on problem- and project-based learning. Journal of the
Learning Sciences, 7(3/4), 271–311.
BELL, P. and LINN, M. C. (2000) Scientific arguments as learning artifacts: designing for learning
from the web with KIE. International Journal of Science Education, 22(8), 797–817.
BLUMENFELD, P. C., SOLOWAY, E., MARX, R. W., KRAJCIK, J. S., GUZDIAL, M. and PALINCSAR, A.
(1991) Motivating project-based learning: sustaining the doing, supporting the learning.
Educational Psychologist, 26(3/4), 369–398.
BRANSFORD, J. D. and SCHWARTZ, D. L. (1999) Rethinking transfer: a simple proposal with
multiple implications. Review of Research in Education, 24, 61–100.
BRANSFORD, J. D., VYE, N. J., ADAMS, L. T. and PERFETTO, G. A. (1989) Learning skills and
acquisition of knowledge. In A. Lesgold and R. Glaser (eds), Foundations for a psychology
of education (Hillsdale, NJ: Lawrence Erlbaum Associates), 199–249.
BRANSFORD, J. D., BROWN, A. L. and COCKING, R. R. (2000) How People Learn: Brain, Mind,
Experience, and School (Washington, DC: National Academy Press).
BROWN, J. S., COLLINS, A. and DUGUID, P. (1989) Situated cognition and the culture of learning.
Educational Researcher, 18(1), 32–42.
BROWN, A., ASH, D., RUTHERFORD, M., NAKAGAWA, K., GORDON, A. and CAMPIONE, J. C. (1993)
Distributed expertise in the classroom. In G. Salomon (ed.), Distributed Cognition:
Psychological and Educational Considerations (New York: Cambridge University Press),
188–228.
BYBEE, R. W. (2000) Teaching science as inquiry. In J. Minstrell and E. H. van Zee (eds), Inquiring
into Inquiry Learning and Teaching in Science (Washington, DC: American Association for the
Advancement of Science), 20–46.
25. MAKING AUTHENTIC SCIENCE ACCESSIBLE 947
CHI, M. T. H., LEWIS, M. W., REIMANN, P. and GLASER, R. (1989) Self-explanations: how students
study and examples in learning to solve problems. Cognitive Science, 13, 145–182.
CLEMENT, J. (1991) Nonformal reasoning in experts and in science students: the use of analogies,
extreme cases, and physical intuition. In J. Voss, D. Perkins and J. Segan (eds), Informal
Reasoning and Education (Hillsdale, NJ: Erlbaum), 345–362.
COGNITION AND TECHNOLOGY GROUP AT VANDERBILT (CTGV) (1992) The Jasper Series as an
example of anchored instruction: theory, program description, and assessment data.
Educational Psychologist, 27(3), 291–315.
DAVIS, E. A. and LINN, M. C. (2000) Scaffolding students’ knowledge integration: prompts for
reflection in KIE. International Journal of Science Education, 22(8), 819–837.
DEBOER, G. E. (1991) A History of Ideas in Science Education (New York: Teachers College
Press).
DEWEY, J. (1938) Experience and Education (New York: Macmillan).
EDELSON, D. C. (1998) Realizing authentic science learning through the adaptation of scientific
practice. In B. J. Fraser and K. G. Tobin (eds), International Handbook of Science Education
(Dordrecht: Kluwer), 317–331.
EDELSON, D. C. (2001) Learning-for-use: a framework for the design of technology-supported
inquiry activities. Journal of Research in Science Teaching, 38(3), 355–385.
EDELSON, D. C., GORDIN, D. N. and PEA, R. D. (1999) Addressing the challenges of inquiry-based
learning through technology and curriculum design. Journal of the Learning Sciences, 8(3/4),
391–450.
GOLDMAN, S. R., PETROSINO, A. J., SHERWOOD, R. D., GARRISON, S., HICKEY, D., BRANSFORD, J.
D. and PELLEGRINO, J. W. (1996) Anchoring science instruction in multimedia learning
environments. In S. Voniadou, E. DeCorte, R. Glaser and H. Handl (eds), Interactional
Perspectives on the Design of Technology-supported Learning Environments (Hillsdale, NJ:
Lawrence Erlbaum Associates), 257–284.
GREENO, J. G. (1997) On claims that answer the wrong question. Educational Researcher, 26(1),
5–17.
GREENO, J. G. (1998) The situativity of knowing, learning, and research. American Psychologist,
53(1), 5–26.
KARPLUS, R. (1977) Science teaching and the development of reasoning. Journal of Research in
Science Education, 14(2), 169–175.
KRAJCIK, J., BLUMENFELD, P. C., MARX, R. W., BASS, K. M. and FREDRICKS, J. (1998) Inquiry in
project-based science classrooms: initial attempts by middle school students. Journal of the
Learning Sciences, 7(34), 313–350.
KRAJCIK, J., BLUMENFELD, P., MARX, R. and SOLOWAY, E. (2000) Instructional, curricular, and
technological supports for inquiry in science classrooms. In J. Minstrell and E. H. van Zee
(eds), Inquiring into Inquiry Learning and Teaching in Science (Washington, DC: American
Association for the Advancement of Science), 283–315.
KUHN, D. (1989) Children and adults as intuitive scientists. Psychological Review, 96(4),
674–689.
KUHN, T. S. (1970) The Structure of Scientific Revolutions, 2nd edn (Chicago: The University of
Chicago Press).
LAVE, J. and WENGER, E. (1991) Situated Learning: Legitimate Peripheral Participation (Cambridge,
MA: Cambridge University Press).
LEWIS, E. L. and LINN, M. C. (1994) Heat energy and temperature concepts of adolescents,
adults, and experts: implications for curricular improvements. Journal of Research in Science
Teaching, 31(6), 657–677.
LINN, M. C. (1982) Theoretical and practical significance of formal reasoning. Journal of Research
in Science Teaching, 19(9), 727–742.
LINN, M. C. and MUILENBURG, L. (1996) Creating lifelong science learners: what models from a
firm foundation? Educational Researcher, 25(5), 18–24.
LINN, M. C. and SONGER, N. B. (1991) Teaching thermodynamics to middle school students: what
are appropriate cognitive demands? Journal of Research in Science Teaching, 28, 885–918.
LOWE, R. (1988) ‘Reading’ scientific diagrams: characterising components of skilled performance.
Research in Science Education, 18, 112–122.
LOWE, R. K. (1993) Constructing a mental representation from an abstract technical diagram.
Learning and Instruction, 3, 157–179.
26. 948 MAKING AUTHENTIC SCIENCE ACCESSIBLE
LOWE, R. K. (1996) Background knowledge and the construction of a situational representation
from a diagram. European Journal of Psychology of Education, 11(4), 377–397.
MILLAR, R. and DRIVER, R. (1987) Beyond processes. Studies in Science Education, 14, 33–62.
MOKROS, J. R. and TINKER, R. F. (1987) The impact of microcomputer-based labs on children’s
ability to interpret graphs. Journal of Research in Science Teaching, 24(4), 369–383.
NACHMIAS, R. and LINN, M. C. (1987) Evaluations of science laboratory data: the role of
computer-presented information. Journal of Research in Science Teaching, 24(5), 491–506.
NRC (NATIONAL RESEARCH COUNCIL) (1996) National Science Education Standards (Washington,
DC: National Academy Press).
NRC (NATIONAL RESEARCH COUNCIL) (2000) Inquiry and the National Science Education Standards
(Washington, DC: National Academy Press).
PALINCSAR, A. S. and BROWN, A. L. (1984) Reciprocal teaching of comprehension-fostering and
comprehension-monitoring activities. Cognition and Instruction, 1(2), 117–175.
PEA, R. D. (1994) Seeing what we build together: distributed multimedia learning environments
for transformative communications. Journal of the Learning Sciences, 3(3), 285–299.
PERKINS, D. N. and SALOMON, G. (1989) Are cognitive skills context-bound? Educational
Researcher, 18(1), 16–25.
SCARDAMALIA, M. and BEREITER, C. (1991) Higher levels of agency for children in knowledge
building: a challenge for the design of new knowledge media. Journal of the Learning Sciences,
1(1), 37–68.
SCARDAMALIA, M. and BEREITER, C. (1994) Computer support for knowledge-building
communities. Journal of the Learning Sciences, 3(3), 265–283.
SCHWAB, J. J. (1962) The teaching of science as enquiry. In J. J. Schwab and P. F. Brandwein (eds),
The Teaching of Science (Cambridge, MA: Harvard University Press), 3–103.
SONGER, N. B. (1996) Exploring learning opportunities in coordinated network-enhanced
classrooms: a case of kids as global scientists. Journal of the Learning Sciences, 5(4),
297–327.
SONGER, N. B. (1998) Can technology bring students closer to science? In B. J. Fraser and K. G.
Tobin (eds), International Handbook of Science Education (Dordrecht: Kluwer), 333–348.
SONGER, N. B., LEE, H.-S. and KAM, R. (2002) Technology-rich inquiry science in urban
classrooms: what are the barriers to inquiry pedagogy? Journal of Research in Science Teaching,
39(2), 128–150.
SONGER, N. B. and SAMSON, P. J. (2000) Internet-enabled multimedia that supports inquiry
understandings in middle school digital learning environments. Paper presented at the
Annual Meeting of the American Educational Research Association (Seattle, WA).
SPITULNIK, M. W., STRATFORD, S., KRAJCIK, J. and SOLOWAY, E. (1998) Using technology to
support students’ artifact construction in science. In B. J. Fraser and K. G. Tobin (eds),
International Handbook of Science Education (Dordrecht: Kluwer), 363–381.
VYGOTSKY, L. S. (1978) Mind in Society (Cambridge, MA: Harvard University Press).
WHITE, B. Y. (1993) ThinkerTools: causal models, conceptual change, and science education.
Cognition and Instruction, 10(1), 1–100.
WHITE, B. Y. and FREDERIKSEN, J. R. (1998) Inquiry, modeling, and metacognition: making
science accessible to all students. Cognition and Instruction, 16(1), 3–118.
WHITE, B. Y. and FREDERIKSEN, J. R. (2000) Metacognitive facilitation: an approach to making
scientific inquiry accessible to all. In J. Minstrell and E. H. van Zee (eds), Inquiring into
Inquiry Learning and Teaching in Science (Washington, DC: American Association for the
Advancement of Science), 331–370.