Statistics for management assignment

This document provides information on statistics and probability sampling methods. It defines statistics as the science of collecting, organizing, summarizing, analyzing, and interpreting data. It describes the four main components of statistics as data collection, presentation, analysis, and interpretation. It also lists seven key characteristics of statistics. The document then discusses probability concepts like probability, experiments, outcomes, and definitions. It provides an example to calculate probabilities. Finally, it describes various probability sampling methods like simple random sampling, stratified random sampling, systematic sampling, cluster sampling, and multi-stage sampling as well as non-probability sampling methods like judgment sampling, convenience sampling, and quota sampling.

Recommended
More Related Content
What's hot
What's hot (20)
Viewers also liked
Viewers also liked (10)
Similar to Statistics for management assignment
Similar to Statistics for management assignment (20)
More from GIEDEEAM SOLAR and Gajanana Publications, LIC
More from GIEDEEAM SOLAR and Gajanana Publications, LIC (20)
Recently uploaded
Recently uploaded (20)
Statistics for management assignment
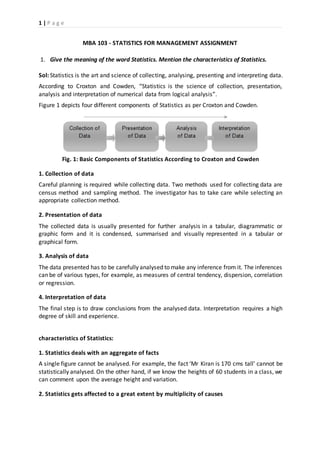
- 1. 1 | P a g e MBA 103 - STATISTICS FOR MANAGEMENT ASSIGNMENT 1. Give the meaning of the word Statistics. Mention the characteristics of Statistics. Sol: Statistics is the art and science of collecting, analysing, presenting and interpreting data. According to Croxton and Cowden, “Statistics is the science of collection, presentation, analysis and interpretation of numerical data from logical analysis”. Figure 1 depicts four different components of Statistics as per Croxton and Cowden. Fig. 1: Basic Components of Statistics According to Croxton and Cowden 1. Collection of data Careful planning is required while collecting data. Two methods used for collecting data are census method and sampling method. The investigator has to take care while selecting an appropriate collection method. 2. Presentation of data The collected data is usually presented for further analysis in a tabular, diagrammatic or graphic form and it is condensed, summarised and visually represented in a tabular or graphical form. 3. Analysis of data The data presented has to be carefully analysed to make any inference from it. The inferences can be of various types, for example, as measures of central tendency, dispersion, correlation or regression. 4. Interpretation of data The final step is to draw conclusions from the analysed data. Interpretation requires a high degree of skill and experience. characteristics of Statistics: 1. Statistics deals with an aggregate of facts A single figure cannot be analysed. For example, the fact ‘Mr Kiran is 170 cms tall’ cannot be statistically analysed. On the other hand, if we know the heights of 60 students in a class, we can comment upon the average height and variation. 2. Statistics gets affected to a great extent by multiplicity of causes
- 2. 2 | P a g e The Statistics of the yield of a crop is the result of several factors, such as the fertility of soil, amount of rainfall, the quality of seed used, the quality and quantity of fertilizer used. 3. Statistics are numerically expressed Only numerical facts can be statistically analysed. Therefore, facts such as ‘price decreases with increasing production’ cannot be called statistics. The qualitative data such as, the categorical data cannot be called as statistics, for example, the eye colour of a person or the brand name of an automobile. 4. Statistics are enumerated or estimated with required degree of accuracy The facts have to be collected from the field or estimated (computed) with the required degree of accuracy. The degree of accuracy differs depending upon the purpose. For example, in measuring the length of screws,an accuracy of up to amillimetre may be required, whereas while measuring the heights of students in aclass,anaccuracyof up to acentimetre is enough. 5. Statistics are collected in a systematic manner The facts should be collected according to planned and scientific methods otherwise, they are likely to be wrong and misleading. 6. Statistics are collected for a pre-determined purpose There must be adefinite purpose for collecting facts.Otherwise, indiscriminate data collection might take place which would lead to wrong diagnosis. 7. Statistics are placed in relation to each other The facts must be placed in such a way that a comparative and analytical study becomes possible. Thus, only related facts which are arranged in a logical order can be called Statistics. Statistical analysis cannot be used to compare heterogeneous data. 2. a. What do you mean by Probability? b. A bag contains 5 white, 6 red, 2 green and 2 black balls. One ball is selected at random from the bag. Find the probability that the selected ball is- i. white ii. non-white iii. white or green iv. black or red sol: a. What do you mean by Probability? Sol: Probability is a numerical measure which indicates the chance of occurrence of an event ‘A’. It is denoted by P(A). It is the ratio between the favourable outcomes of an event ‘A’ (m) to the total outcomes of the experiment (n). In other words:
- 3. 3 | P a g e Where, ‘m’ is the number of favourable outcomes of an event ‘A’ and ‘n’ is the total number of outcomes of the experiment. Probability is a numerical measure which indicates the chance of occurrence. b. A bag contains 5 white, 6 red, 2 green and 2 black balls. One ball is selected at random from the bag. Find the probability that the selected ball is- i. white ii. non-white iii. white or green iv. black or red Sol: The bag has a total of 15 balls. Since the ball drawn can be any one of them, there are 15 equally likely, mutually exclusive and exhaustive outcomes. Let events A, B, C and D be A: selected ball is white B: selected ball is non-white C: selected ball is white or green D: selected ball is black or red (i) There are 5 white balls in the bag. Therefore, out of the 15 outcomes, 5 are favourable to event A. ∴P [white ball] = P (A) = 5/15 = 1/3 (ii) Event B is the complement of event A. Therefore, ∴ P[non-white ball] = P(B) = 1 - P(A) = 1 – 1/3 = 2/3 (iii) There are 5 white balls and 2 green balls in the bag. Therefore, out of 15 outcomes, 7 are either white or green. ∴ P[white ball or green ball] = P(C) = 7/15 (iv) There are 2 black balls and 6 red balls in the bag. Therefore, out of 15 outcomes, 7 are either white or green. ∴ P[black ball or red ball] = P(D) = 7/15
- 4. 4 | P a g e 2. What Do you mean by Sampling? Describe various Probability and Non- Probability Sampling Methods Sol: Sample is a finite subset of a population. A sample is drawn from apopulation to estimate the characteristics of the population. Sampling is a tool which enables us to draw conclusions about the characteristics of the population. The figure 2. depicts the population and sample. Fig. 2 : Illustration of Population and Sample The sampling techniques may be broadly classified into the following categories: i)Probability sampling ii)Non-probability sampling Probability sampling Probability sampling provides a scientific technique of drawing samples from the population. The technique of drawing samples is according to the law in which each unit has a predetermined probability of being included in the sample. The different ways of assigning probability are as follows: i)each unit is assigned with the same chance of being selected ii)sampling units are assigned with varying probability depending on priorities iii)units are assigned with probability proportional to the sample size We will discuss here some of the important probability sampling designs. 1. Simple random sampling Under this technique, sample units are drawn in such a way that each and every unit in the population has an equal and independent chance of being included in the sample. If a sample unit is replaced before drawing the next unit, then it is known as simple random sampling with replacement [SRSWR]. If the sample unit is not replaced before drawing the next unit, then it is called simple random sampling without replacement [SRSWOR]. In first case, probability of drawing a unit is 1/N, where N is the population size. In the second case, probability of drawing a unit is 1/Nn. The selection of simple random sampling can be done by the following ways: •Lottery method – In lottery method, we identify each and every unit with distinct numbers by allotting an identical card. The cards are put in a drum and thoroughly shuffled before
- 5. 5 | P a g e each unit is drawn. The figure 3. depicts a lotto machine through which samples can be selected randomly. Fig. 3: Lotto Machine •The use of table of random numbers – There are several random number tables. They are Tippet’s random number table, Fisher’s and Yate’s tables, Kendall and Babington Smiths random tables, Rand Corporation random numbers etc. The table 1 depicts the specimen of random numbers by Tippett’s. Table 1: Tippett’s Random Number Table 2952 6641 3992 9792 7979 5911 3170 5624 4167 9524 1545 1396 7203 5356 1300 2693 2370 7483 3408 2762 3563 1089 6913 7691 0560 5246 1112 6107 6008 8126 4233 8776 2754 9143 1405 9025 7002 6111 8816 6446 Example 2: Suppose, we want to select 10 units from a population size of 100. We number the population units from 00 to 99. Then we start taking 2 digits. Suppose, we start with 41 (second row) then the other numbers selected will be 67, 95, 24, 15, 45, 13, 96, 72, 03. Example 3: If we want to select 10 students out of 30 students in a class, then number the students from 00 to 29. Then, from the random number table choose a two digit number. In the Table 1, we start from the third row. The first number selected is 23, which lies between 00 and 29. So the 23rd student is selected as the first unit of the sample. The second number is 70, but it greater than 29 we cannot choose that number. The bold numbers in Table 1 are the selected sample that is the numbers selected are 23, 08, 27, 1013, 05, 11, 12, 07, 08. The corresponding students constitute the required sample. 2. Stratified random sampling This sampling design is most appropriate if the population is heterogeneous with respect to characteristic under study or the population distribution is highly skewed. We subdivide the population into several groups or strata such that: i)Units within each stratum is more homogeneous ii)Units between strata are heterogeneous iii)Strata do not overlap, in other words, every unit of the population belongs to one and only one stratum
- 6. 6 | P a g e The criteria used for stratification are geographical, sociological, age, sex, income etc. The population of size ‘N’ is divided into ‘k’ strata relatively homogenous of size N1, N2…….Nk such that ‘N1 + N2 +……… + Nk = N’. Then, we draw a simple random sample from each stratum either proportional to size of stratum or equal units from each stratum. Example 4 The items produced by factories located at three cities ‘X’, ‘Y’ and ‘Z’ are 200, 300 and 500, respectively. We wish to draw a sample of 20 items under proportional stratified sampling. We number the unit from 0 to 999. Then refer to random numbers table and select the numbers as depicted in Table 2. Table 2: Stratified Random Sampling 27717 43584 85192 88977 29490 69714 94015 62874 32444 48277 13025 14338 54066 15423 47724 66733 74108 82228 888570 74015 80217 36292 98525 24335 24432 24896 62880 Proportions of samples to be selected are calculated as follows: Total = 20 For the first factory sample units selected are 174, 192, 069, 156 For the second factory sample units selected are 287, 432, 444, 482, 302, 254 For the third factory sample units selected are 854, 772, 733, 741, 822, 853, 570, 802, 629, 525 3. Systematic sampling This design is recommended if we have a complete list of sampling units arranged in some systematic order such as geographical, chronological or alphabetical order. Suppose the population size is ‘N’. The population units are serially numbered ‘1’ to ‘N’ in some systematic order and we wish to draw a sample of ‘n’ units. Then we divide units from ‘1’ to ‘N’ into ‘K’ groups such that each group has ‘n’ units. This implies ‘nK = N’ or ‘K = N/n’. From the first group, we select a unit at random. Suppose the unit selected is 6th unit, thereafter we select every 6 + Kth units. If ‘K’ is 20, ‘n’ is 5 and ‘N’ is 100 then units selected are 6, 26, 46, 66, 86. 6. Cluster sampling
- 7. 7 | P a g e The total population is divided into recognisable sub-divisions, known as clusters such that within each cluster, units are more heterogeneous and between clusters they are homogenous. The units are selected from each cluster by suitable sampling techniques. The figure 3 depicts the cluster sampling where each packet of candy packets forms a cluster. Fig. 3: Cluster Sampling 8. Multi-stage sampling The total population is divided into severalstages.Thesampling process is carried out through several stages. It is as depicted in figure 4. Fig. 4: Multistage Sampling Non-probability sampling: Depending upon the object of enquiry and other considerations a predetermined number of sample units is selected purposely so that they represent the true characteristics of the population. A serious drawback of this sampling design is that it is highly subjective in nature. The selection of sample units depends entirely upon the personal convenience, biases, prejudices and beliefs of the investigator. This method will be more successful if the investigator is thoroughly skilled and experienced. 1. Judgment sampling The choice of sample items depends exclusively on the judgment of the investigator. The investigator’s experience and knowledge about the population will help to select the sample units. It is the most suitable method if the population size is less. 2. Convenience sampling
- 8. 8 | P a g e The sample units are selectedaccording to the convenience of the investigator. It is alsocalled “chunk” which refers to the fraction of the population being investigated, which is selected neither by probability nor by judgment. Moreover, a list or framework should be available for the selection of the sample. It is used to make pilot studies. However, there is a high chance of bias being introduced. 3. Quota sampling It is a type of judgment sampling. Under this design, quotas are set up according to some specified characteristic such as age groups or income groups. From each group a specified number of units are sampled according to the quota allotted to the group. Within the group the selection of sampleunits depends on personal judgment. It has arisk of personal prejudice and bias entering the process. This method is often used in public opinion studies.