
Download to read offline
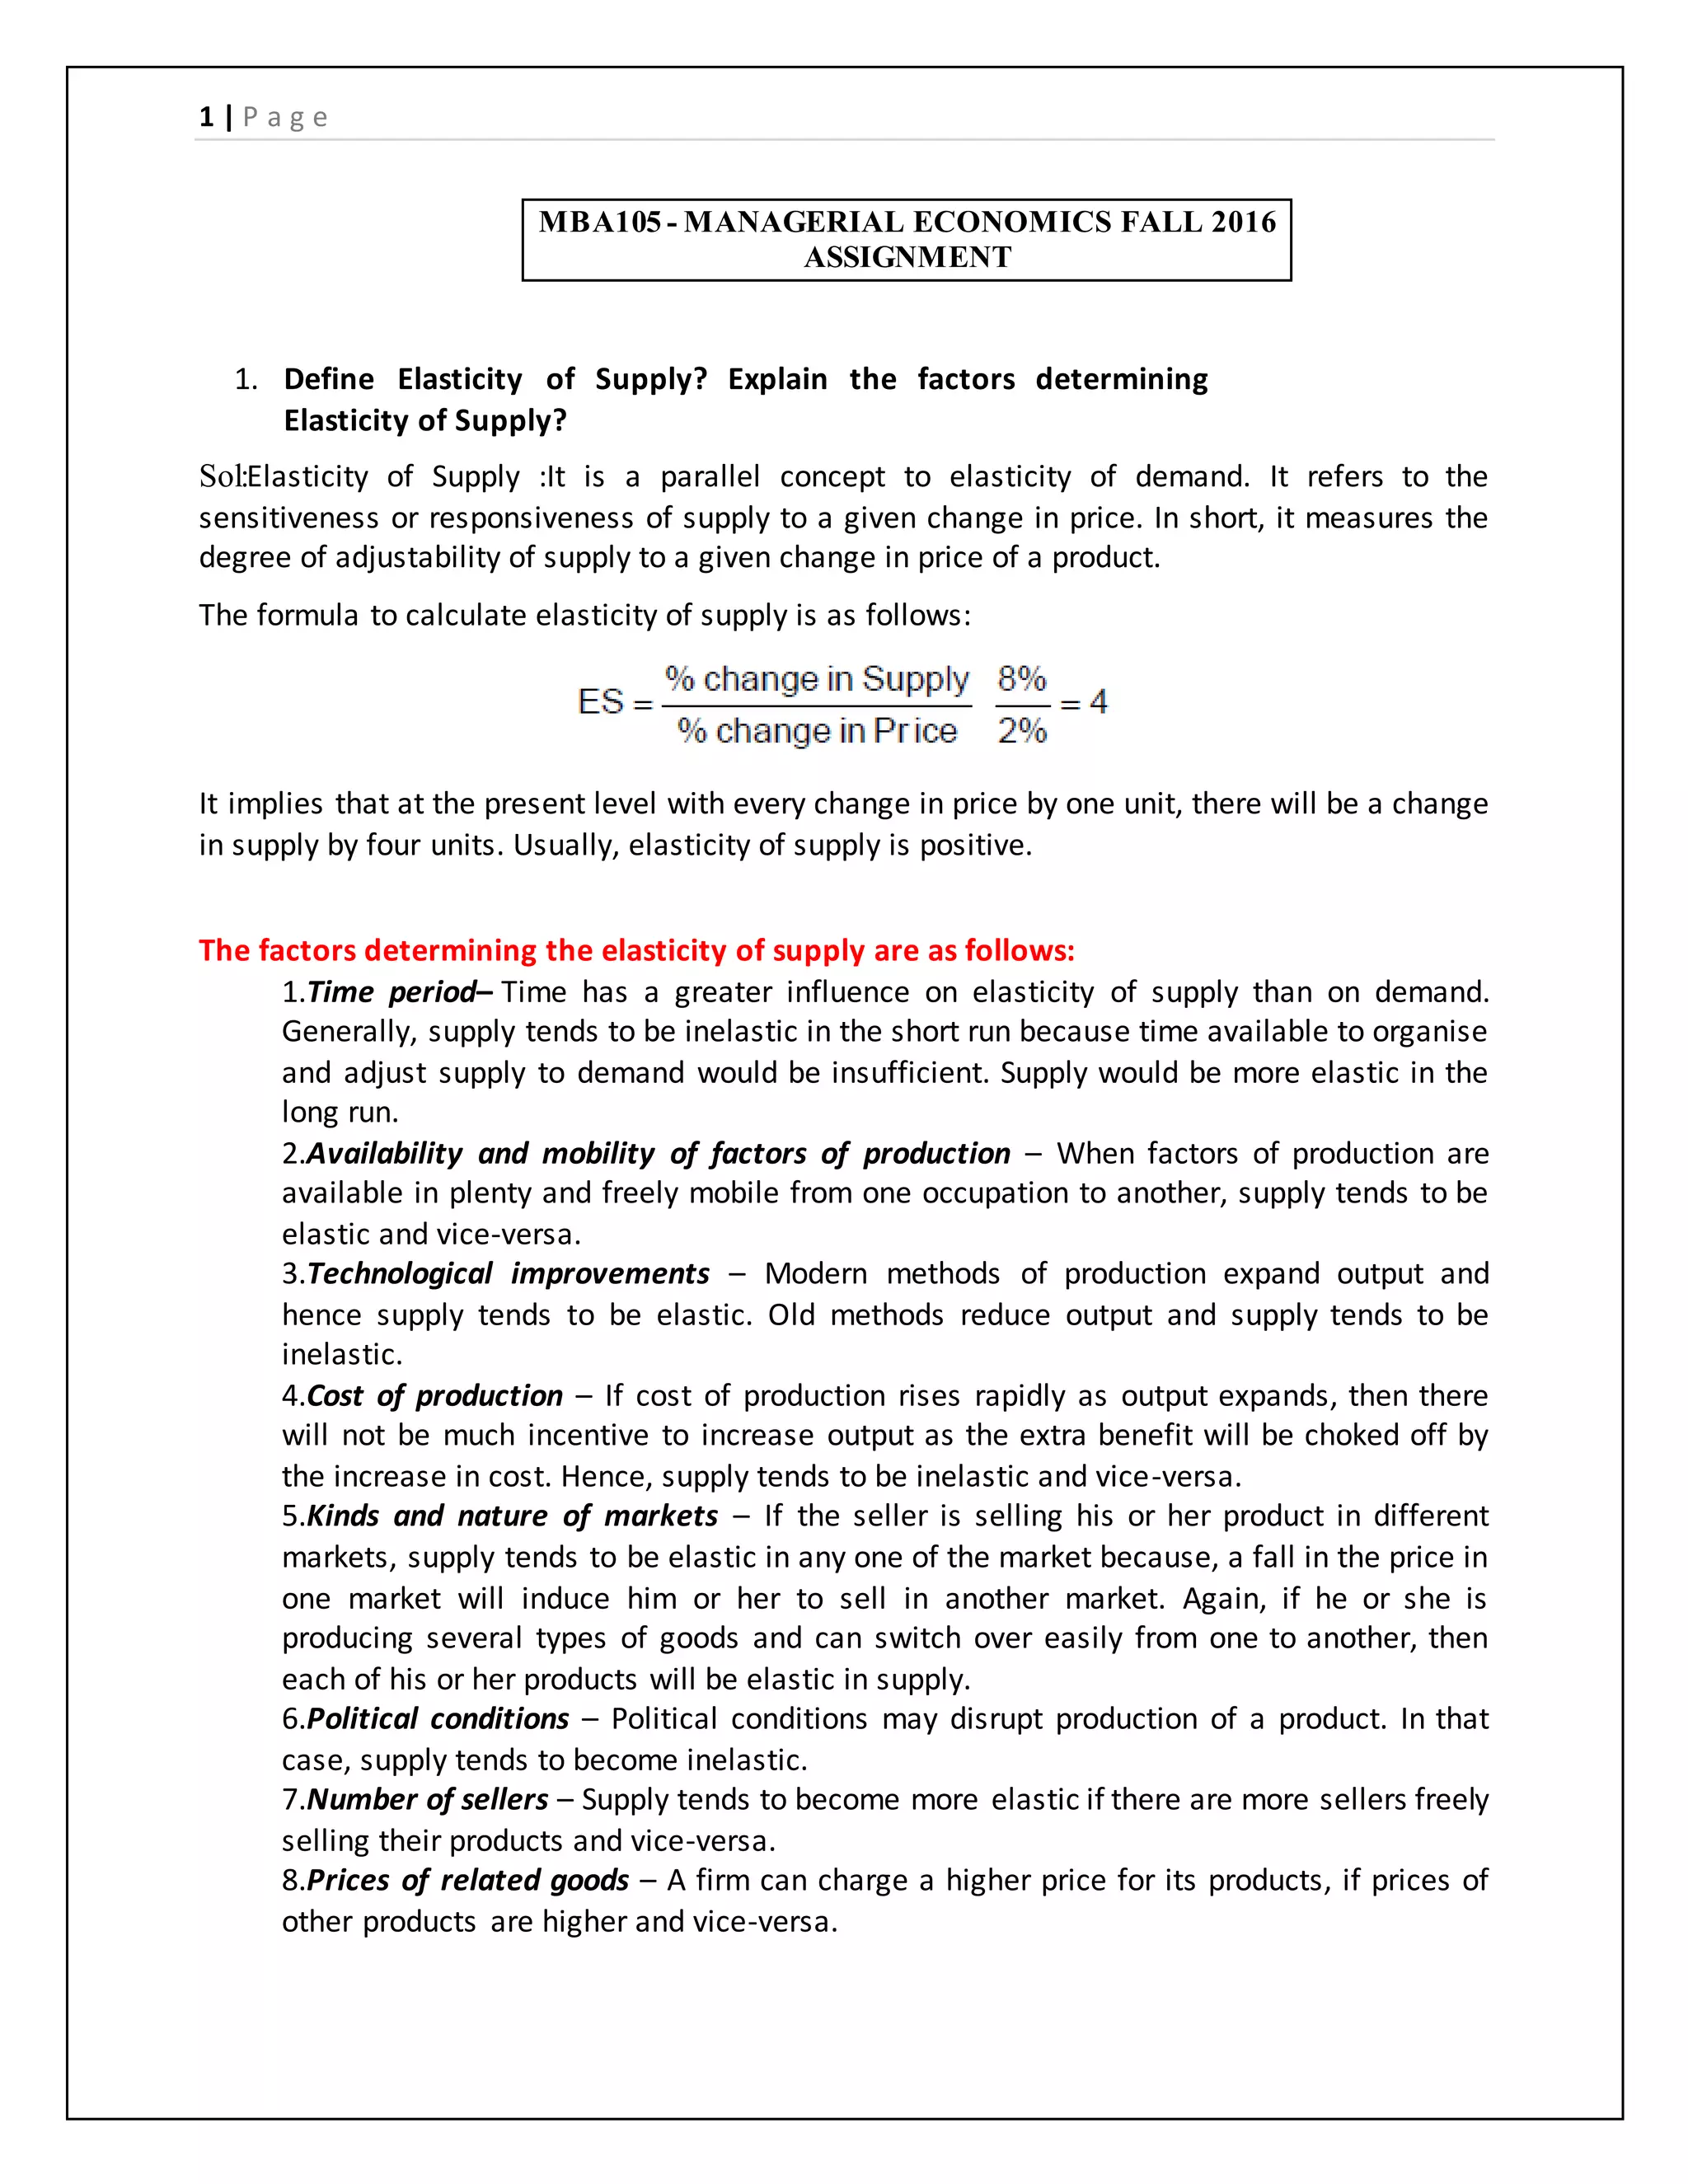

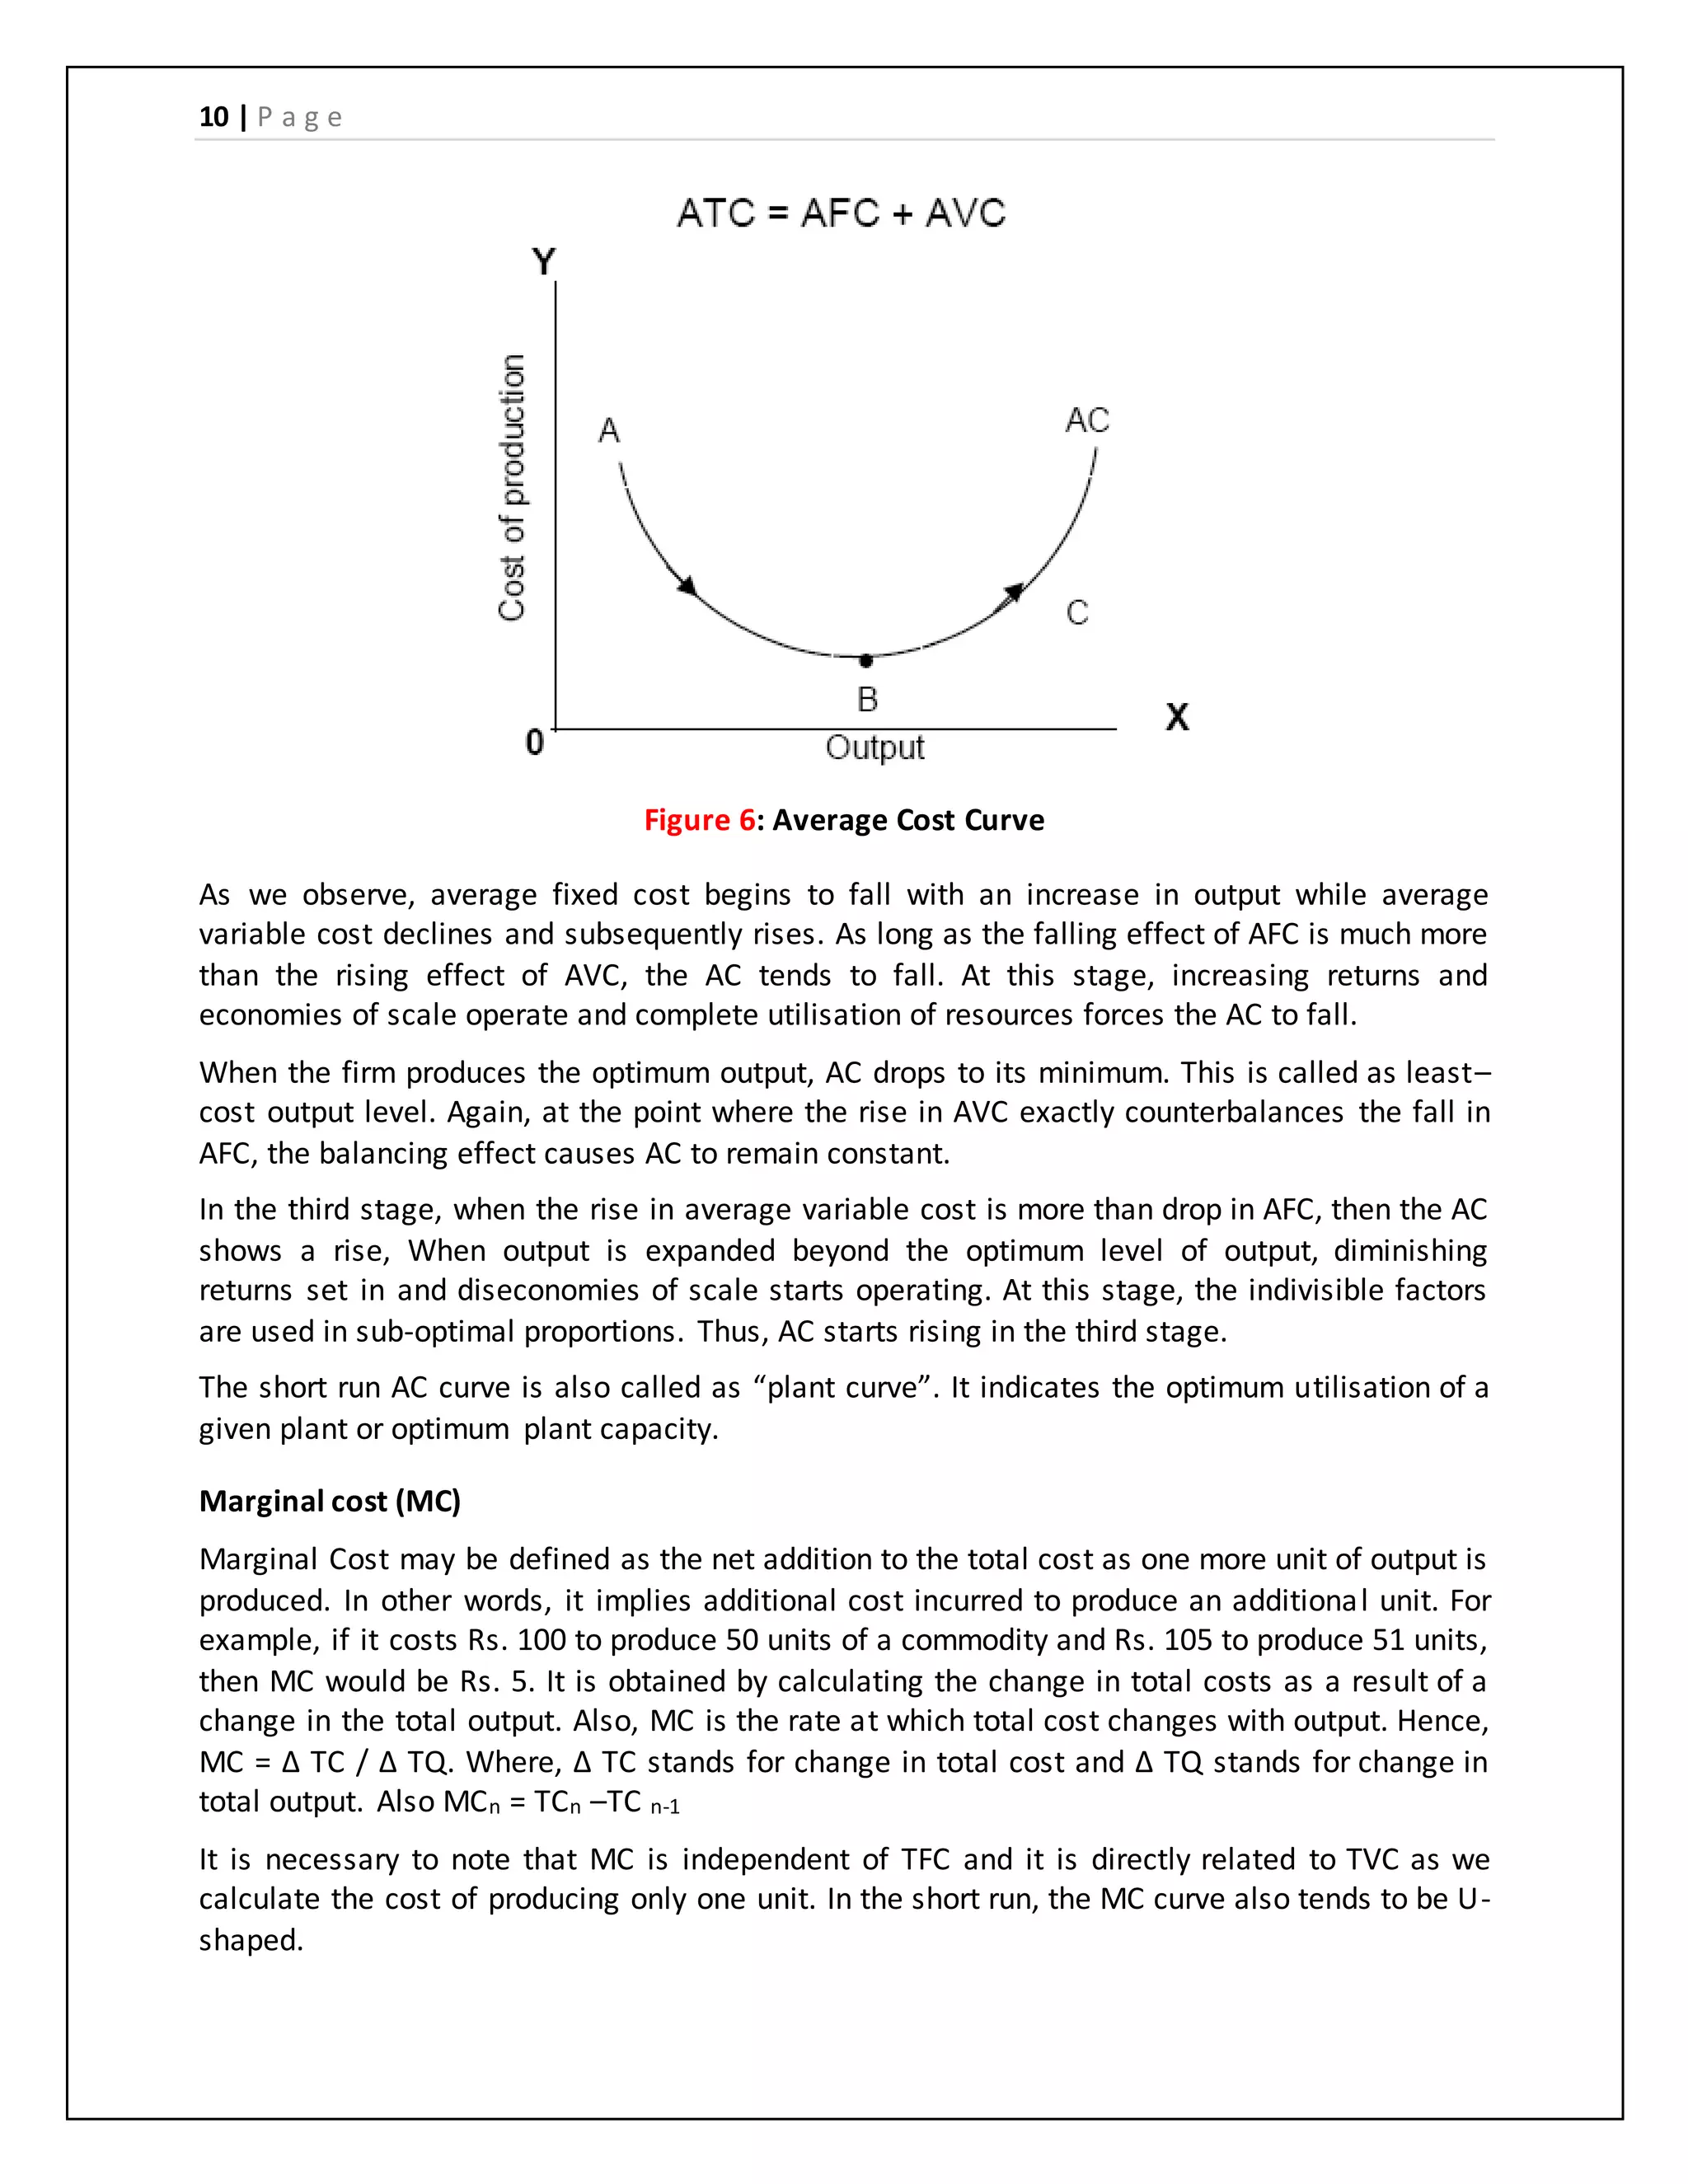
The document defines key concepts related to elasticity of supply and perfect competition. It provides the following key points: 1. Elasticity of supply measures the responsiveness of supply to changes in price. It is determined by factors like time period, availability of inputs, technology, and production costs. 2. Perfect competition is characterized by many small sellers and buyers, homogeneous products, free entry and exit, perfect information and mobility of inputs. Features include price taking behavior and normal profits. 3. Monopolistic competition involves differentiated products, some monopoly power for each seller, and non-price competition through product differentiation, branding, and advertising.


