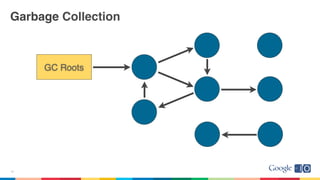
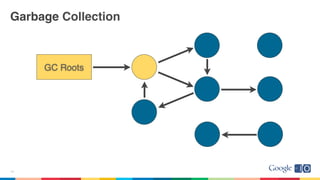
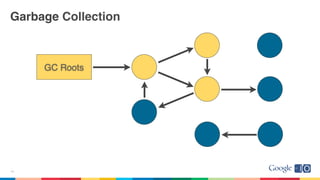
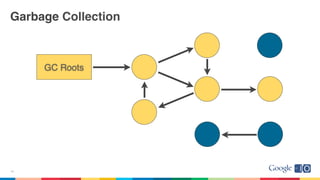
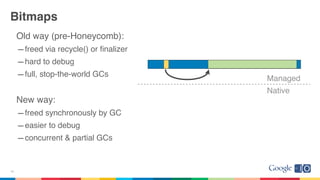
- Memory management for Android apps has changed with Gingerbread and Honeycomb, increasing heap sizes and improving garbage collection to reduce pauses
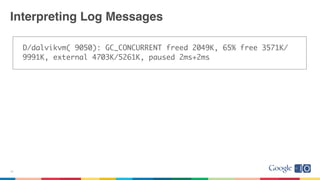
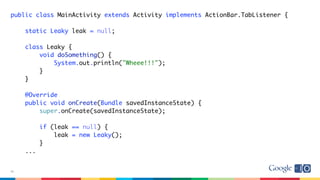
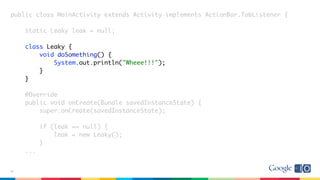
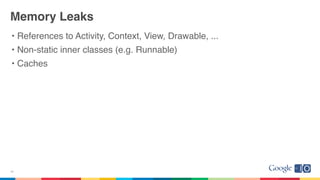
- Understanding log messages and using heap dumps can help debug memory issues like leaks caused by lingering references to activities or contexts
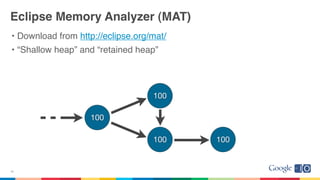
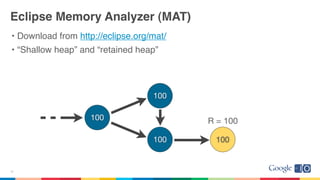
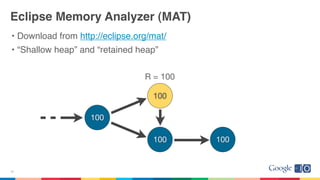
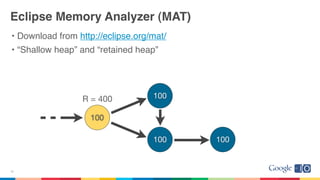
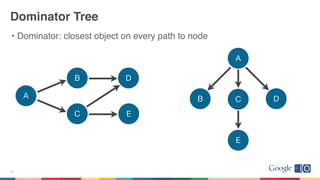
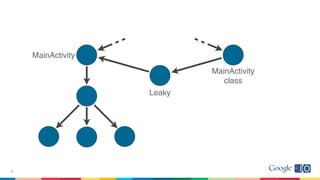
- The Eclipse Memory Analyzer tool allows inspection of heap dumps to identify dominator trees and retained objects causing leaks


![[Vietnam Mobile Day 2013] - Memory management for android applications](https://cdn.slidesharecdn.com/ss_thumbnails/presentation1-130521023037-phpapp01-thumbnail.jpg?width=640&height=640&fit=bounds)