Downloaded 338 times


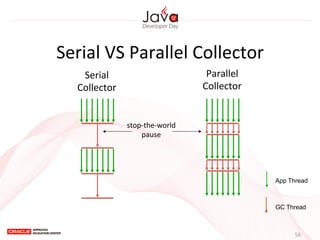
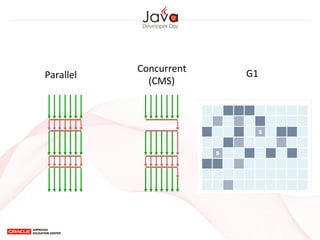
![Performance
Impact
of
GC
5
Java
SE
6
HotSpot[tm]
Virtual
Machine
Garbage
CollecRon
Tuning
h[p://www.oracle.com/technetwork/java/javase/gc-‐tuning-‐6-‐140523.html
0.6
0.2
8
32](https://image.slidesharecdn.com/javagcjavadeveloperdaytw-140801231304-phpapp02/85/Java-GC-5-320.jpg)


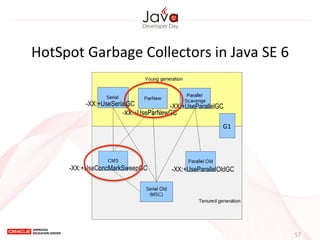


![• Java
Performance
–
Charlie
Hunt,
Binu
John
• HotSpot
GC
Tuning
Guide
for
Java
SE
6
h[p://www.oracle.com/technetwork/java/javase/gc-‐
tuning-‐6-‐140523.html
• Memory
Management
in
the
Java
HotSpot
VM
h[p://www.oracle.com/technetwork/java/javase/
memorymanagement-‐whitepaper-‐150215.pdf
• Java
6
Performance
Whitepaper
h]p://java.sun.com/performance/reference/whitepapers/6_performance.html
78](https://image.slidesharecdn.com/javagcjavadeveloperdaytw-140801231304-phpapp02/85/Java-GC-78-320.jpg)


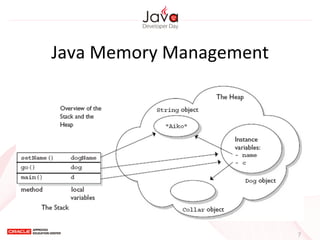
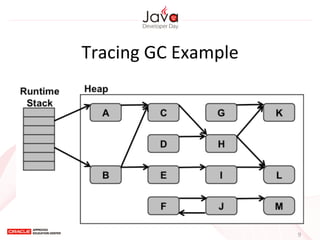
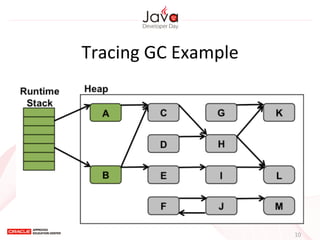
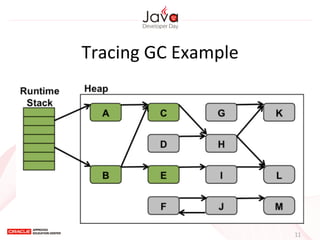
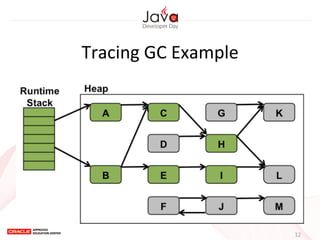
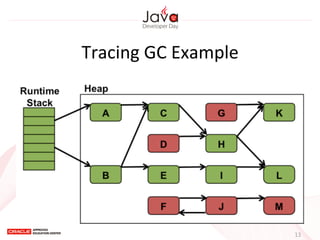
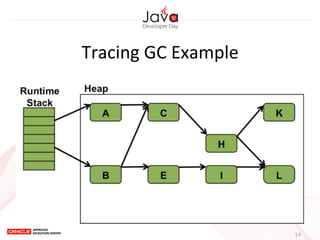
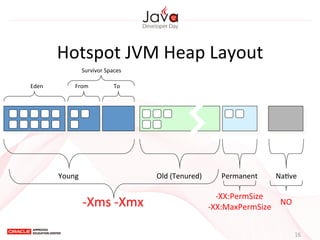
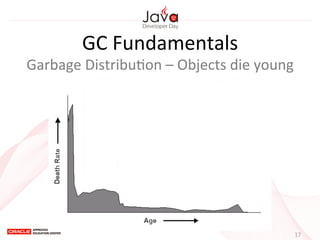
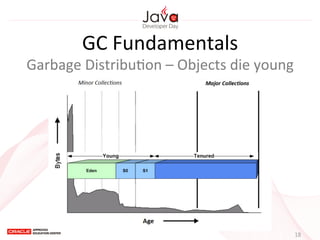
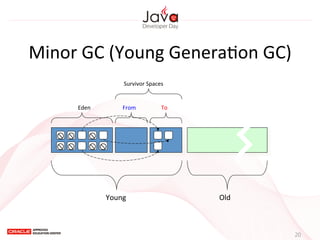
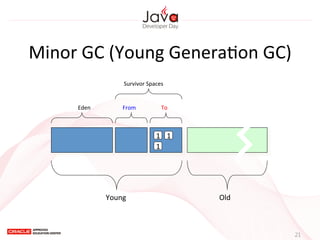
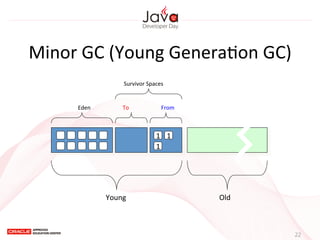
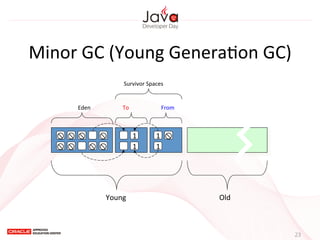
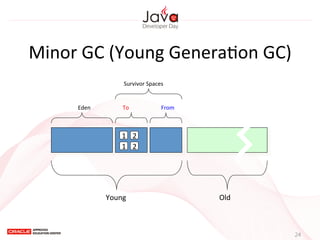
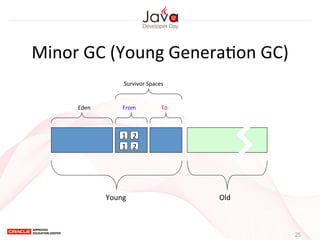
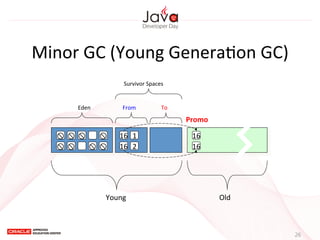
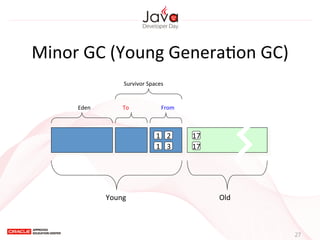
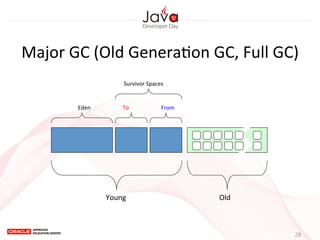
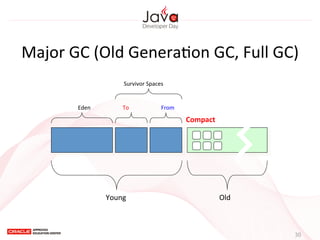
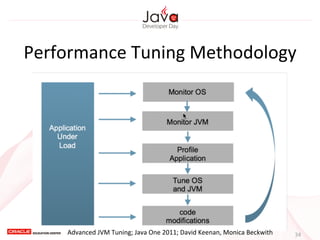
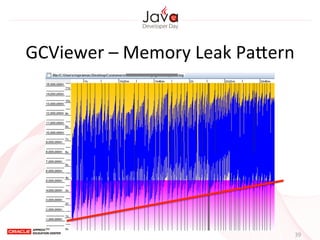
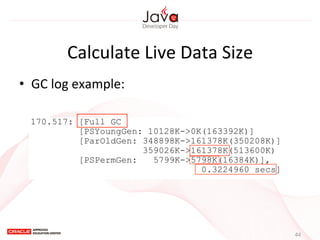
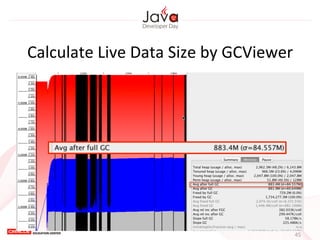
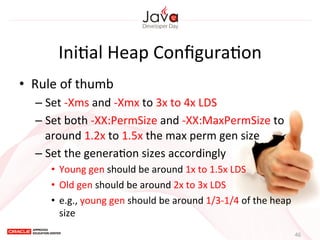
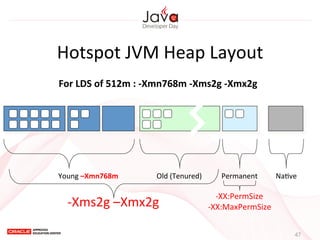
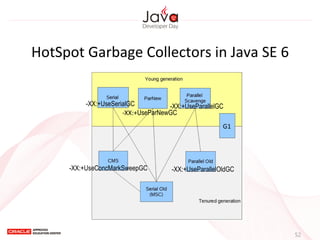
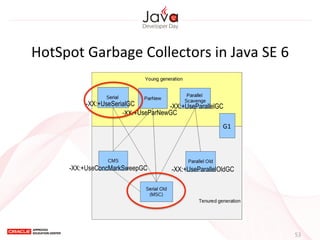
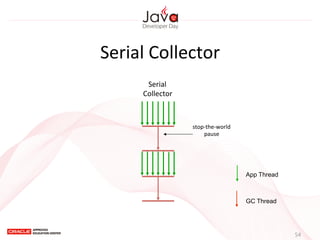
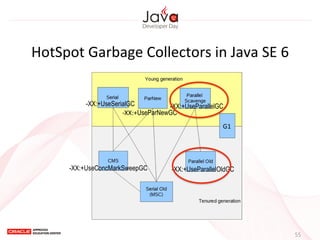
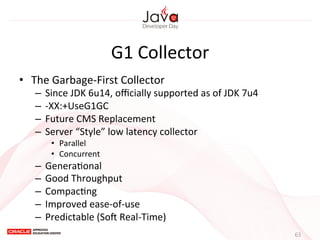
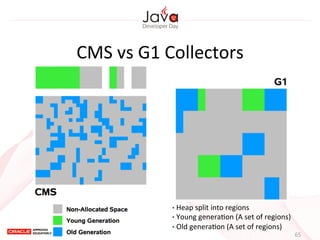
This document provides an overview of garbage collection in Java. It begins with an introduction to the presenter Leon Chen and his background. It then discusses Java memory management and garbage collection fundamentals, including the young and old generations, minor and major garbage collections, and how objects are promoted between generations. The document provides examples of garbage collection using diagrams and discusses tuning the Java heap size based on the live data size. It emphasizes the importance of garbage collection logging for performance analysis.


![[Oracle DBA & Developer Day 2016] しばちょう先生の特別講義!!ストレージ管理のベストプラクティス ~ASMからExada...](https://cdn.slidesharecdn.com/ss_thumbnails/mktgdd2-3stragemanagementfordl2-200702092359-thumbnail.jpg?width=640&height=640&fit=bounds)