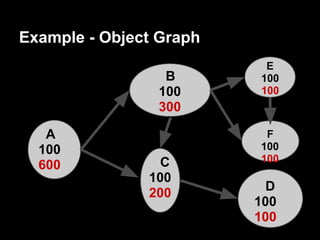
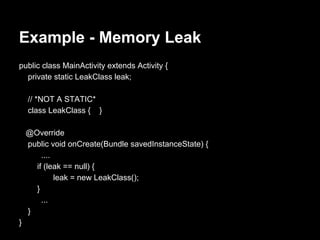
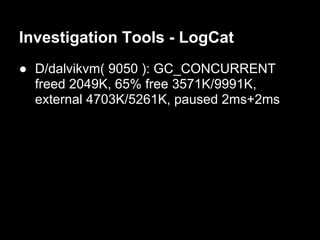
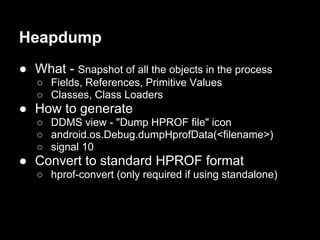
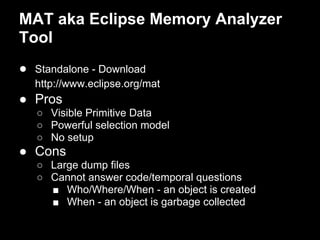
Eclipse Memory Analyzer
          Tool
      Lakshman Kakkirala
         little eye labs
Agenda
●   Memory Analysis
●   Some Definitions
●   An example leak code
●   Demo of MAT and some basic functionality
Prereqs
● Android app development
● Basic Heap and Garbage Collection

Disqualification
● Advanced knowledge of MAT :-)
littleEye appInsight

CT Scanner for your app
 http://www.littleeye.co
Why Memory Analysis?
● Identify Leaks
● Reduce memory footprint
Typical problems
● Holding Context object (an Activity, a View
  or a Drawable)
  which actually happens to be an Activity
● Non-static inner classes
● Caches
● Aggressive Caching
Some definitions

●   Shallow Size
●   Retained Size
●   Dominator
●   Dominator Tree
●   GCRoots
Example - Object Graph
                          E
                 B       100
                100      100
                300

   A                      F
  100                    100
                 C       100
  600
               100
               200         D
                         100
                         100
Example (contd) - Dominator Tree

                             E
                 B

                             F

   A

                C                D
Example - Memory Leak
public class MainActivity extends Activity {
  private static LeakClass leak;

    // *NOT A STATIC*
    class LeakClass { }

    @Override
    public void onCreate(Bundle savedInstanceState) {
        ....
      if (leak == null) {
             leak = new LeakClass();
      }
        ...
    }
}
Investigation Tools - LogCat
● D/dalvikvm( 9050 ): GC_CONCURRENT
  freed 2049K, 65% free 3571K/9991K,
  external 4703K/5261K, paused 2ms+2ms
Heapdump
● What - Snapshot of all the objects in the process
   ○ Fields, References, Primitive Values
   ○ Classes, Class Loaders
● How to generate
   ○ DDMS view - "Dump HPROF file" icon
   ○ android.os.Debug.dumpHprofData(<filename>)
   ○ signal 10
● Convert to standard HPROF format
   ○ hprof-convert (only required if using standalone)
MAT aka Eclipse Memory Analyzer
Tool
● Standalone - Download
  http://www.eclipse.org/mat
● Pros
   ○ Visible Primitive Data
   ○ Powerful selection model
   ○ No setup
● Cons
   ○ Large dump files
   ○ Cannot answer code/temporal questions
     ■ Who/Where/When - an object is created
     ■ When - an object is garbage collected
Demo
Covering
● View Dominator Tree
● Inspector
  ○ look at the field values
  ○ browse through entries in a Collection
● Class Histograms
● Group by Value
Demo (contd...)
●   Immediate Dominators
●   Path from GC roots
●   Retained Set
●   Object Query Language
References
● Google IO 2011 - "Memory Management for Android
    apps" http://www.google.
    com/events/io/2011/sessions/memory-management-for-
    android-apps.html
●   Java Memory Analysis
    http://vimeo.com/21356498
●   Markus Kohler's Java Performance Blog
    http://kohlerm.blogspot.com
●   Memory Analyzer Blog
    http://memoryanalyzer.blogspot.in/
Backup Slides
Application Attributes:
<application
 android:largeHeap="true">
Garbage Collection
Pre Gingerbread:
GC: stop the world gc, >100ms

Gingerbread and beyond:
concurrent gc,
two pauses - at the beginning and at the end
             < 5ms
partial collections
Bitmap
pre-honeycomb:
● pixel data was stored in native mem
● recycle() or finalize()
● invisible to MAT

honeycomb and after:
● pixel data inside dalvik heap
● visible to MAT
● works with partial and concurrent GC
Typical Garbage Collections
GC_CONCURRENT
GC_FOR_MALLOC
GC_EXTERNAL_ALLOC (pre-honeycomb)
GC_HPROF_DUMP_HEAP
GC_EXPLICIT - app calling System.gc()

Eclipse Memory Analyzer Tool

  • 1.
    Eclipse Memory Analyzer Tool Lakshman Kakkirala little eye labs
  • 2.
    Agenda ● Memory Analysis ● Some Definitions ● An example leak code ● Demo of MAT and some basic functionality
  • 3.
    Prereqs ● Android appdevelopment ● Basic Heap and Garbage Collection Disqualification ● Advanced knowledge of MAT :-)
  • 4.
    littleEye appInsight CT Scannerfor your app http://www.littleeye.co
  • 5.
    Why Memory Analysis? ●Identify Leaks ● Reduce memory footprint
  • 6.
    Typical problems ● HoldingContext object (an Activity, a View or a Drawable) which actually happens to be an Activity ● Non-static inner classes ● Caches ● Aggressive Caching
  • 7.
    Some definitions ● Shallow Size ● Retained Size ● Dominator ● Dominator Tree ● GCRoots
  • 8.
    Example - ObjectGraph E B 100 100 100 300 A F 100 100 C 100 600 100 200 D 100 100
  • 9.
    Example (contd) -Dominator Tree E B F A C D
  • 10.
    Example - MemoryLeak public class MainActivity extends Activity { private static LeakClass leak; // *NOT A STATIC* class LeakClass { } @Override public void onCreate(Bundle savedInstanceState) { .... if (leak == null) { leak = new LeakClass(); } ... } }
  • 11.
    Investigation Tools -LogCat ● D/dalvikvm( 9050 ): GC_CONCURRENT freed 2049K, 65% free 3571K/9991K, external 4703K/5261K, paused 2ms+2ms
  • 12.
    Heapdump ● What -Snapshot of all the objects in the process ○ Fields, References, Primitive Values ○ Classes, Class Loaders ● How to generate ○ DDMS view - "Dump HPROF file" icon ○ android.os.Debug.dumpHprofData(<filename>) ○ signal 10 ● Convert to standard HPROF format ○ hprof-convert (only required if using standalone)
  • 13.
    MAT aka EclipseMemory Analyzer Tool ● Standalone - Download http://www.eclipse.org/mat ● Pros ○ Visible Primitive Data ○ Powerful selection model ○ No setup ● Cons ○ Large dump files ○ Cannot answer code/temporal questions ■ Who/Where/When - an object is created ■ When - an object is garbage collected
  • 14.
    Demo Covering ● View DominatorTree ● Inspector ○ look at the field values ○ browse through entries in a Collection ● Class Histograms ● Group by Value
  • 15.
    Demo (contd...) ● Immediate Dominators ● Path from GC roots ● Retained Set ● Object Query Language
  • 16.
    References ● Google IO2011 - "Memory Management for Android apps" http://www.google. com/events/io/2011/sessions/memory-management-for- android-apps.html ● Java Memory Analysis http://vimeo.com/21356498 ● Markus Kohler's Java Performance Blog http://kohlerm.blogspot.com ● Memory Analyzer Blog http://memoryanalyzer.blogspot.in/
  • 18.
  • 19.
    Garbage Collection Pre Gingerbread: GC:stop the world gc, >100ms Gingerbread and beyond: concurrent gc, two pauses - at the beginning and at the end < 5ms partial collections
  • 20.
    Bitmap pre-honeycomb: ● pixel datawas stored in native mem ● recycle() or finalize() ● invisible to MAT honeycomb and after: ● pixel data inside dalvik heap ● visible to MAT ● works with partial and concurrent GC
  • 21.
    Typical Garbage Collections GC_CONCURRENT GC_FOR_MALLOC GC_EXTERNAL_ALLOC(pre-honeycomb) GC_HPROF_DUMP_HEAP GC_EXPLICIT - app calling System.gc()