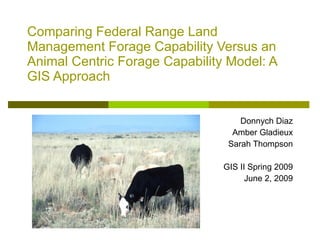
1. Comparing Federal Range Land Management Forage Capability Versus an Animal Centric Forage Capability Model: A GIS Approach Donnych Diaz Amber Gladieux Sarah Thompson GIS II Spring 2009 June 2, 2009
11. Allotment (12 Polygons) DEM (Resampled to 30m) Landcover Stream Polyline Stream Buffer Convert to Distance Raster Set to 200m and 400m % Slope Raster 4 Classes at 90m 1-10% 11-20% 21-60% 61% and Above Allotment Polygons Overlay with Landcover Produces: Allotment Polygons With Landcover Regions
12. Allotment (12 Polygons) DEM (Resampled to 30m) Landcover Stream Polyline Stream Buffer Convert to Distance Raster Set to 200m and 400m % Slope Raster 4 Classes at 90m 1-10% 11-20% 21-60% 61% and Above Allotment Polygons Overlay with Landcover Produces: Allotment Polygons With Landcover Regions Reclass Regions in Allotment Polygons To Desirability Score 1,2,3 Reclass Raster To Desirability Score 1,2,3,4 Reclass Stream Distances To Desirability Score 1, 2
14. Combine Tool Suitability Matrix 24 Combinations of Weight Extract By Attribute Scores of 2 or Less Convert to Shapefile
15. Combine Tool Suitability Matrix 24 Combinations of Weight Extract By Attribute Scores of 2 or Less Convert to Shapefile Calculate Area and Acreage Of Optimal Area
16. Combine Tool Suitability Matrix 24 Combinations of Weight Extract By Attribute Scores of 2 or Less Convert to Shapefile Calculate Area and Acreage Of Optimal Area Compare Original and Optimal Acreage
17. Combine Tool Suitability Matrix 24 Combinations of Weight Extract By Attribute Scores of 2 or Less Convert to Shapefile Calculate Area and Acreage Of Optimal Area Compare Original and Optimal Acreage Result: Significant Reduction in Grazing Acreage, leading to an overuse of optimal areas through overstock of cattle
![What’s the Issue? ,[object Object],[object Object],[object Object],[object Object],[object Object],[object Object],[object Object]](data:image/gif;base64,R0lGODlhAQABAIAAAAAAAP///yH5BAEAAAAALAAAAAABAAEAAAIBRAA7)