Download as PDF, PPTX


![4 of 24
Best Practice
Association for Project Management
Planning, Scheduling, Monitoring & Control [2015]
Introduction to Project Planning [2008]
The Scheduling Maturity Model [2012]
Project Management Institute
Practice Standard for Work Breakdown Structures, Second Edition [2006]
Practice Standard for Scheduling, Second Edition [2011] ](https://image.slidesharecdn.com/planning-151208155324-lva1-app6891/75/Planning-4-2048.jpg)


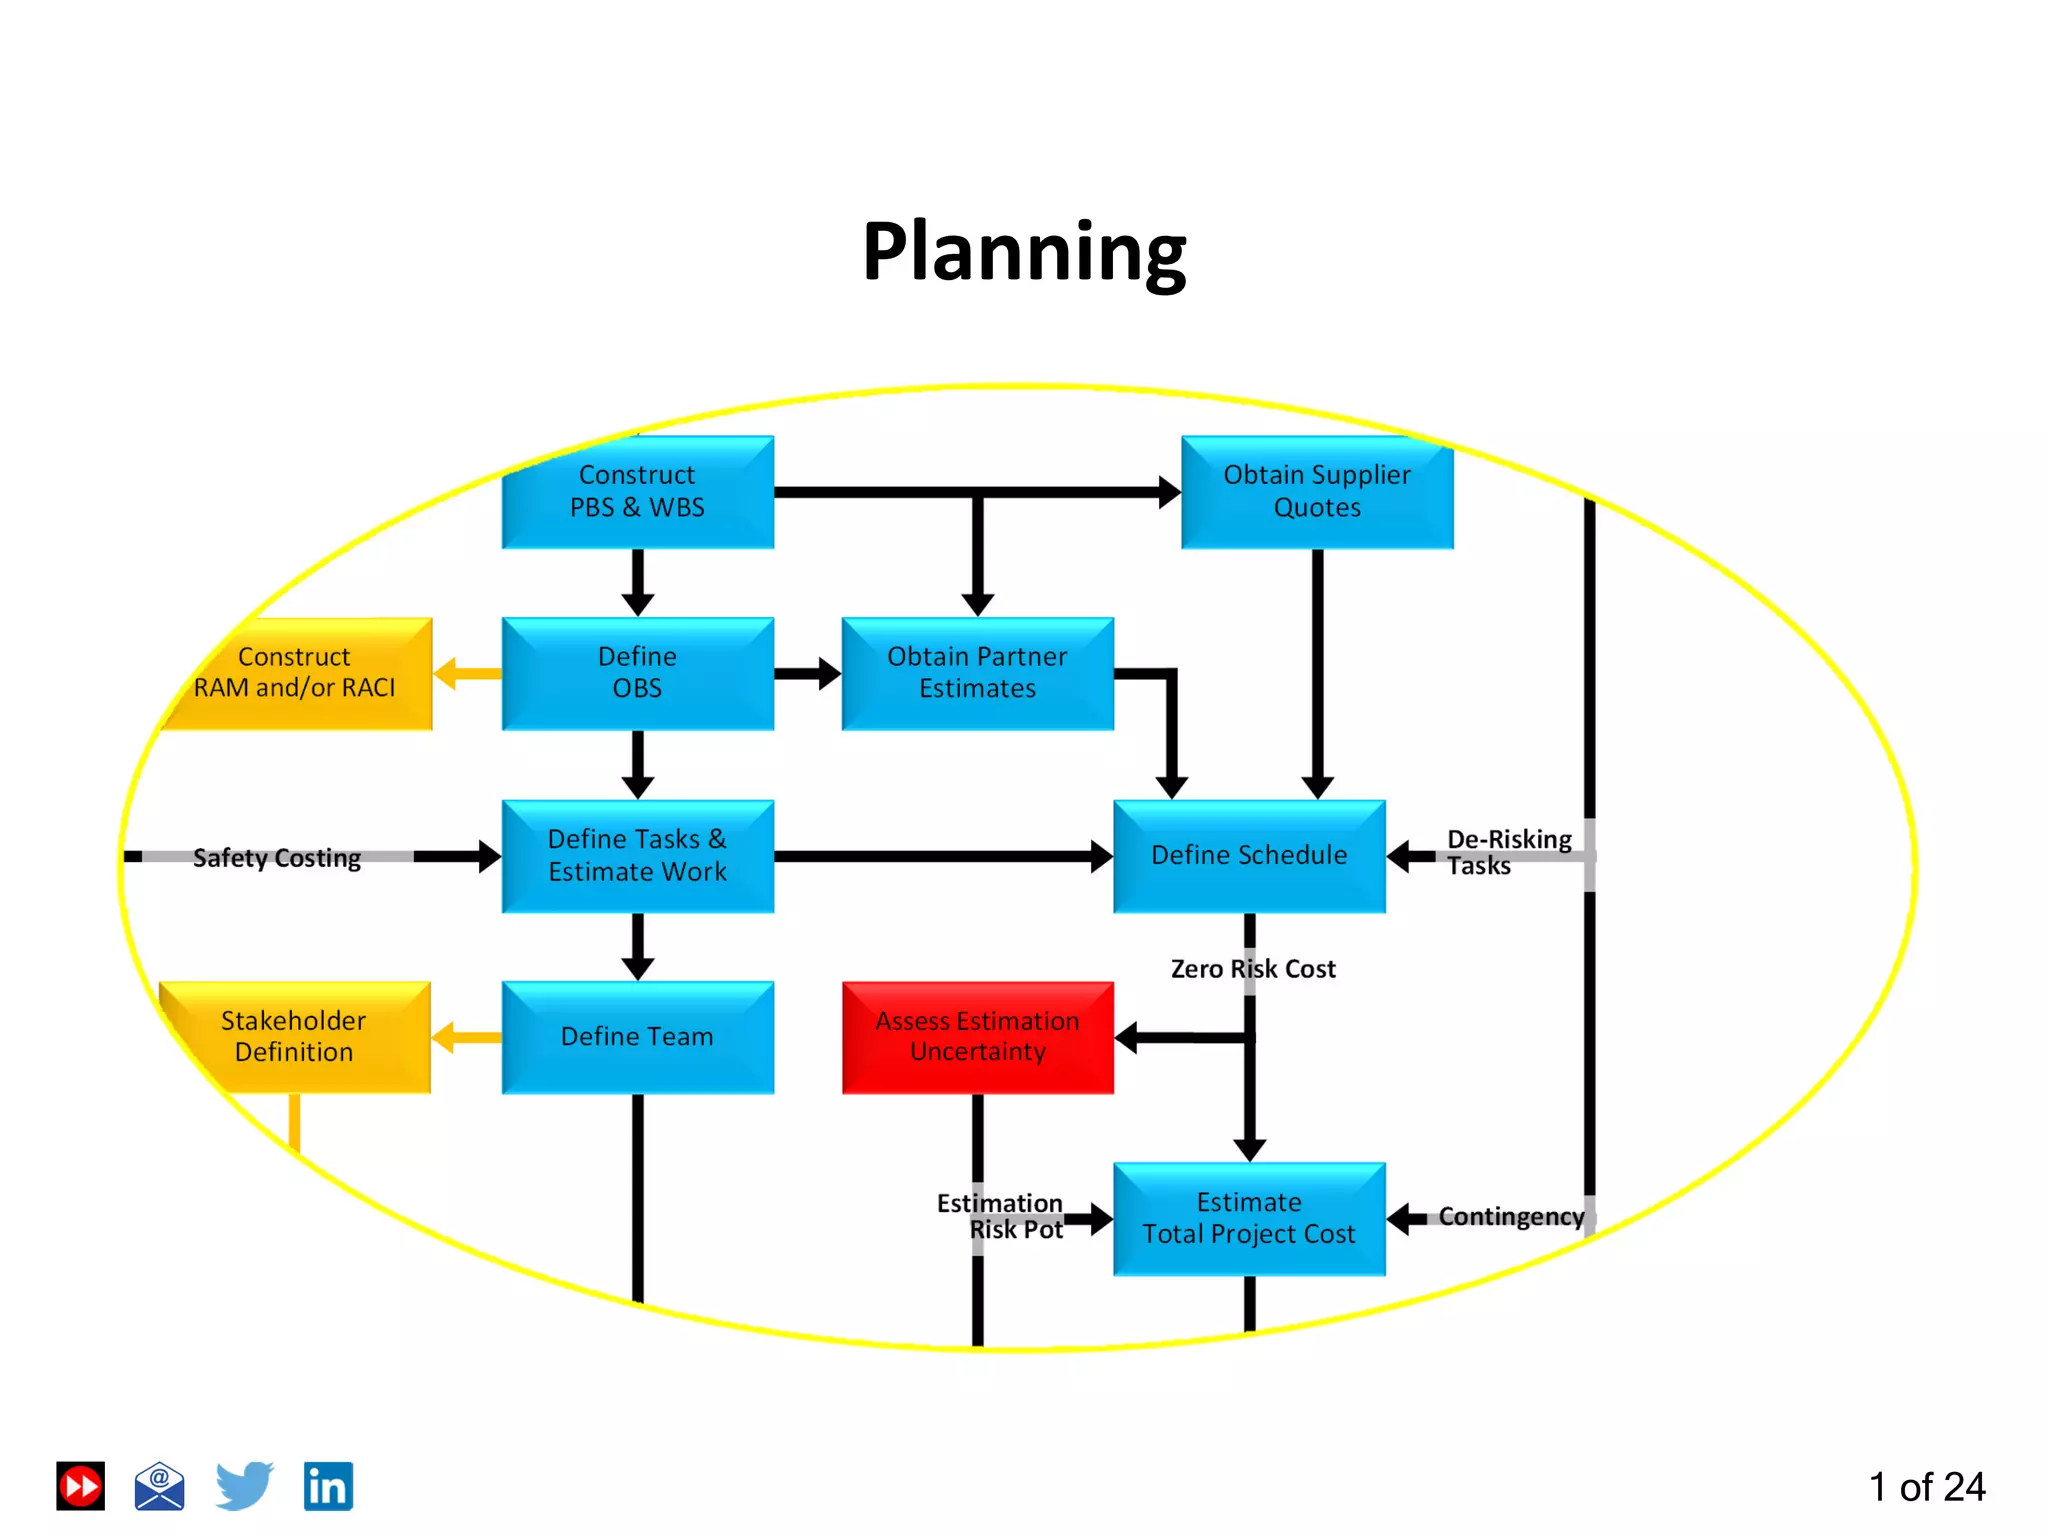
The document provides a comprehensive overview of project planning processes, emphasizing the importance of effective planning to enhance project success and minimize costs. It outlines key components such as work breakdown structures, risk management, and scheduling techniques, while also highlighting the significance of stakeholder management and safety considerations. The text further discusses methodologies including Agile and Critical Chain Project Management to optimize project delivery.


