SlideShare a Scribd company logo
1 of 16
Download to read offline
February 2018 Monthly Snapshot
One-Year Change in One-Year Change in
Median Sales Price
Single Family
Median Sales Price
Condo/TIC/Coop
2
3
4
5
6
7
8
9
10
11
12
13
14
15
16
Current as of March 11, 2018.All data from the San Francisco MLS. Report © 2018 ShowingTime.
Condo/TIC/Coop Activity Overview
Inventory of Active Listings
% of Properties Sold Over List Price
% of List Price Received
Housing Affordability Ratio
All Properties Activity Overview
New Listings
Pending Sales
Sold Listings
Median Sales Price
Average Sales Price
Days on Market Until Sale
Activity by District
Monthly Indicators
+ 32.9% - 6.8% + 8.2%
One-Year Change in
The three most prominent national market trends for residential real estate are
the ongoing lack of abundant inventory, the steadily upward movement of home
prices and year-over-year declines in home sales. Sales declines are a natural
result of there being fewer homes for sale, but higher prices often indicate
higher demand leading to competitive bidding. Markets are poised for increased
supply, so there is hope that more sellers will take advantage of what appears
to be a ready and willing buyer base.
New Listings were down 9.6 percent for single family homes and 18.2 percent
for Condo/TIC/Coop properties. Pending Sales increased 15.6 percent for
single family homes and 8.6 percent for Condo/TIC/Coop properties.
The Median Sales Price was up 32.9 percent to $1,715,000 for single family
homes but decreased 6.8 percent to $1,104,500 for Condo/TIC/Coop
properties. Months Supply of Inventory decreased 26.3 percent for single family
units and 32.1 percent for Condo/TIC/Coop units.
In February, prevailing mortgage rates continued to rise. This has a notable
impact on housing affordability and can leave consumers choosing between
higher payments or lower-priced homes. According to the Mortgage Bankers
Association, the average rate for 30-year fixed-rate mortgages with a 20
percent down payment that qualify for backing by Fannie Mae and Freddie Mac
rose to its highest level since January 2014. A 4.5 or 4.6 percent rate might not
seem high to those with extensive real estate experience, but it is newly high for
many potential first-time home buyers. Upward rate pressure is likely to
continue as long as the economy fares well.
Median Sales Price
All Property Types
Residential real estate activity in San Francisco County (Districts 1-10),
comprised of single-family properties, townhomes and condominiums.
Percent changes are calculated using rounded figures.
Single Family Activity Overview
Months Supply of Inventory
Single Family Activity Overview
Key metrics by report month and for year-to-date (YTD) starting from the first of the year.
Key Metrics Historical Sparkbars 2-2017 2-2018 Percent Change YTD 2017 YTD 2018 Percent Change
- 7.4%337
196 - 9.7%
$1,500,000 + 17.6%
+ 17.5%
Pending Sales 135 156 + 15.6% + 6.6%228 243
New Listings 187 169 - 9.6% 364
Sold Listings 111 102 - 8.1% 217
Median Sales Price $1,290,000 $1,715,000 + 32.9% $1,275,000
28 - 26.3%
$1,948,890
-- --
Days on Market 34 22 - 35.3% 38
Avg. Sales Price $1,684,181 $2,147,432 + 27.5% $1,659,253
Active Listings 359 267 - 25.6% --
% of Properties Sold Over List Price 78.4% 80.4% + 2.6% 70.5%
39
76.0% + 7.8%
+ 3.1%
33 - 15.4%
114.2%% of List Price Received 113.8% 115.9% + 1.8% 110.8%
Current as ofMarch 11, 2018.All data from the San Francisco MLS. Report © 2018 ShowingTime. | 2
Months Supply 1.9 1.4 - 26.3% -- -- --
Affordability Ratio 39 29 - 25.6%
2-2015 2-2016 2-2017 2-2018
2-2015 2-2016 2-2017 2-2018
2-2015 2-2016 2-2017 2-2018
2-2015 2-2016 2-2017 2-2018
2-2015 2-2016 2-2017 2-2018
2-2015 2-2016 2-2017 2-2018
2-2015 2-2016 2-2017 2-2018
2-2015 2-2016 2-2017 2-2018
2-2015 2-2016 2-2017 2-2018
2-2015 2-2016 2-2017 2-2018
2-2015 2-2016 2-2017 2-2018
Condo/TIC/Coop Activity Overview
Key metrics by report month and for year-to-date (YTD) starting from the first of the year.
Key Metrics Historical Sparkbars 2-2017 2-2018 Percent Change YTD 2017 YTD 2018 Percent Change
- 12.6%
Pending Sales 209 227 + 8.6% 353 403 + 14.2%
New Listings 330 270 - 18.2% 659 576
Sold Listings 157 196 + 24.8% 307 342 + 11.4%
Median Sales Price $1,185,000 $1,104,500 - 6.8% $1,100,000 $1,095,000 - 0.5%
+ 2.2%
45 - 4.3%
$1,289,936
-- --
Days on Market 36 37 + 2.8% 47
Avg. Sales Price $1,358,682 $1,270,194 - 6.5% $1,262,501
Active Listings 638 474 - 25.7% --
% of Properties Sold Over List Price 57.3% 59.2% + 3.3% 48.2%
53
48.5% + 0.6%
+ 1.1%
52 - 1.9%
103.7%% of List Price Received 103.9% 105.2% + 1.3% 102.6%
Current as ofMarch 11, 2018.All data from the San Francisco MLS. Report © 2018 ShowingTime. | 3
Months Supply 2.8 1.9 - 32.1% -- -- --
Affordability Ratio 49 52 + 6.1%
2-2015 2-2016 2-2017 2-2018
2-2015 2-2016 2-2017 2-2018
2-2015 2-2016 2-2017 2-2018
2-2015 2-2016 2-2017 2-2018
2-2015 2-2016 2-2017 2-2018
2-2015 2-2016 2-2017 2-2018
2-2015 2-2016 2-2017 2-2018
2-2015 2-2016 2-2017 2-2018
2-2015 2-2016 2-2017 2-2018
2-2015 2-2016 2-2017 2-2018
2-2015 2-2016 2-2017 2-2018
New Listings
New Listings
Single
Family
Year-Over-Year
Change
Condo/TIC/
Coop
Year-Over-Year
Change
Mar-2017 277 +1.5% 348 -7.7%
Apr-2017 247 -12.7% 284 -23.7%
May-2017 288 +12.1% 361 -3.5%
Jun-2017 238 0.0% 313 -23.3%
Jul-2017 210 -9.5% 273 -1.4%
Aug-2017 212 +5.0% 288 +0.7%
Sep-2017 299 -13.8% 433 -0.5%
Oct-2017 238 +7.2% 325 +8.3%
Nov-2017 138 0.0% 202 +27.0%
Dec-2017 70 0.0% 120 0.0%
Jan-2018 168 -5.1% 306 -7.0%
Feb-2018 169 -9.6% 270 -18.2%
12-Month Avg 213 -2.7% 294 -6.5%
Historical New Listings by Month
Current as ofMarch 11, 2018.All data from the San Francisco MLS. Report © 2018 ShowingTime. | 4
A count of the properties that have been newly listed on the market in a given month.
228
338
187
330
169
270
Single Family Condo/TIC/Coop
February
0
100
200
300
400
500
600
700
1-2005 1-2006 1-2007 1-2008 1-2009 1-2010 1-2011 1-2012 1-2013 1-2014 1-2015 1-2016 1-2017 1-2018
Single Family Condo/TIC/Coop
410
632
364
659
337
576
Single Family Condo/TIC/Coop
Year to Date
2016 2017 2018
- 18.2%- 2.4%- 9.6%- 18.0% + 4.3%- 7.4%- 11.2% - 12.6%
2016 2017 2018 2016 2017 2018 2016 2017 2018
- 4.2% - 6.2% + 12.3%+ 14.2%
Pending Sales
Pending Sales
Single
Family
Year-Over-Year
Change
Condo/TIC/
Coop
Year-Over-Year
Change
Mar-2017 213 +9.2% 304 +34.5%
Apr-2017 198 -7.5% 226 -7.4%
May-2017 240 -4.0% 306 +7.4%
Jun-2017 249 +8.7% 290 +11.1%
Jul-2017 174 +3.0% 209 -19.0%
Aug-2017 206 +4.0% 212 -10.2%
Sep-2017 204 +9.7% 245 +13.4%
Oct-2017 248 +11.7% 331 +33.5%
Nov-2017 198 -5.3% 234 -11.4%
Dec-2017 108 -12.2% 190 +6.7%
Jan-2018 87 -6.5% 176 +22.2%
Feb-2018 156 +15.6% 227 +8.6%
12-Month Avg 190 +2.6% 246 +6.5%
Historical Pending Sales by Month
Current as ofMarch 11, 2018.All data from the San Francisco MLS. Report © 2018 ShowingTime. | 5
A count of the properties on which offers have been accepted in a given month.
124
227
135
209
156
227
Single Family Condo/TIC/Coop
February
0
100
200
300
400
1-2005 1-2006 1-2007 1-2008 1-2009 1-2010 1-2011 1-2012 1-2013 1-2014 1-2015 1-2016 1-2017 1-2018
Single Family Condo/TIC/Coop
223
370
228
353
243
403
Single Family Condo/TIC/Coop
Year to Date
2016 2017 2018
+ 8.6%- 7.9%+ 15.6%+ 8.9% - 4.6%+ 6.6%+ 2.2% + 14.2%
2016 2017 2018 2016 2017 2018 2016 2017 2018
- 10.1% - 9.7% + 2.2%+ 6.6%
Sold Listings
Sold Listings
Single
Family
Year-Over-Year
Change
Condo/TIC/
Coop
Year-Over-Year
Change
Mar-2017 173 +9.5% 287 +14.3%
Apr-2017 203 -2.9% 232 +4.5%
May-2017 218 +9.0% 272 +5.4%
Jun-2017 230 -6.5% 324 +20.9%
Jul-2017 210 +4.0% 239 -4.0%
Aug-2017 212 +11.0% 219 -15.4%
Sep-2017 177 -0.6% 175 -25.2%
Oct-2017 233 +2.6% 311 +31.8%
Nov-2017 244 +18.4% 278 +5.7%
Dec-2017 148 -26.0% 246 +3.4%
Jan-2018 94 -11.3% 146 -2.7%
Feb-2018 102 -8.1% 196 +24.8%
12-Month Avg 187 +0.4% 244 +5.0%
Historical Sold Listings by Month
Current as ofMarch 11, 2018.All data from the San Francisco MLS. Report © 2018 ShowingTime. | 6
A count of the actual sales that closed in a given month.
102
168
111
157
102
196
Single Family Condo/TIC/Coop
February
0
100
200
300
400
1-2005 1-2006 1-2007 1-2008 1-2009 1-2010 1-2011 1-2012 1-2013 1-2014 1-2015 1-2016 1-2017 1-2018
Single Family Condo/TIC/Coop
206
317
217
307
196
342
Single Family Condo/TIC/Coop
Year to Date
2016 2017 2018
+ 24.8%- 6.5%- 8.1%+ 8.8% - 3.2%- 9.7%+ 5.3% + 11.4%
2016 2017 2018 2016 2017 2018 2016 2017 2018
- 20.9% - 13.8% - 0.6%+ 4.3%
Median Sales Price
Median Sales Price
Single
Family
Year-Over-Year
Change
Condo/TIC/
Coop
Year-Over-Year
Change
Mar-2017 $1,350,000 -0.2% $1,137,500 +3.9%
Apr-2017 $1,380,000 0.0% $1,100,000 -4.3%
May-2017 $1,475,000 +9.3% $1,169,044 +8.0%
Jun-2017 $1,461,000 +9.8% $1,125,000 -4.3%
Jul-2017 $1,400,000 +7.3% $1,150,000 +10.0%
Aug-2017 $1,377,500 +10.2% $1,175,000 +10.8%
Sep-2017 $1,320,000 +8.5% $1,095,000 +7.1%
Oct-2017 $1,575,000 +12.5% $1,140,000 +0.2%
Nov-2017 $1,492,500 +10.3% $1,237,500 +17.0%
Dec-2017 $1,460,000 +12.2% $1,127,000 +11.5%
Jan-2018 $1,330,000 +6.4% $1,095,000 +9.5%
Feb-2018 $1,715,000 +32.9% $1,104,500 -6.8%
12-Month Avg* $1,430,000 +7.9% $1,145,000 +5.5%
Historical Median Sales Price by Month
* Median Sales Price for all properties from March 2017 through February 2018. This is not the
average of the individual figures above.
Current as ofMarch 11, 2018.All data from the San Francisco MLS. Report © 2018 ShowingTime. | 7
Point at which half of the sales sold for more and half sold for less, not accounting for seller concessions, in a given month.
$1,390,000
$1,097,500
$1,290,000
$1,185,000
$1,715,000
$1,104,500
Single Family Condo/TIC/Coop
February
$400,000
$600,000
$800,000
$1,000,000
$1,200,000
$1,400,000
$1,600,000
$1,800,000
1-2005 1-2006 1-2007 1-2008 1-2009 1-2010 1-2011 1-2012 1-2013 1-2014 1-2015 1-2016 1-2017 1-2018
Single Family Condo/TIC/Coop
$1,260,000
$1,090,000
$1,275,000
$1,100,000
$1,500,000
$1,095,000
Single Family Condo/TIC/Coop
Year to Date
2016 2017 2018
- 6.8%+ 8.0%+ 32.9%- 7.2% + 0.9%+ 17.6%+ 1.2% - 0.5%
2016 2017 2018 2016 2017 2018 2016 2017 2018
+ 24.7% + 16.7% + 10.7%- 0.2%
Average Sales Price
Avg. Sales Price
Single
Family
Year-Over-Year
Change
Condo/TIC/
Coop
Year-Over-Year
Change
Mar-2017 $1,891,127 +6.0% $1,282,583 +2.2%
Apr-2017 $1,880,160 +6.3% $1,296,502 -5.2%
May-2017 $1,835,738 +12.4% $1,346,544 +6.1%
Jun-2017 $1,727,201 -1.4% $1,351,503 +10.9%
Jul-2017 $1,738,803 +1.0% $1,242,939 +3.1%
Aug-2017 $1,567,141 +2.0% $1,269,212 +3.3%
Sep-2017 $1,611,232 +8.3% $1,217,415 +0.7%
Oct-2017 $2,007,445 +0.4% $1,275,773 +0.9%
Nov-2017 $1,754,366 -0.7% $1,386,511 +21.6%
Dec-2017 $1,914,314 +15.4% $1,274,356 +1.9%
Jan-2018 $1,733,452 +6.1% $1,316,439 +13.3%
Feb-2018 $2,147,432 +27.5% $1,270,194 -6.5%
12-Month Avg* $1,804,793 +5.4% $1,298,451 +4.6%
Historical Average Sales Price by Month
* Avg. Sales Price for all properties from March 2017 through February 2018. This is not the
average of the individual figures above.
Current as ofMarch 11, 2018.All data from the San Francisco MLS. Report © 2018 ShowingTime. | 8
Average sales price for all closed sales, not accounting for seller concessions, in a given month.
$1,611,354
$1,209,523
$1,684,181
$1,358,682
$2,147,432
$1,270,194
Single Family Condo/TIC/Coop
February
$500,000
$750,000
$1,000,000
$1,250,000
$1,500,000
$1,750,000
$2,000,000
$2,250,000
1-2005 1-2006 1-2007 1-2008 1-2009 1-2010 1-2011 1-2012 1-2013 1-2014 1-2015 1-2016 1-2017 1-2018
Single Family Condo/TIC/Coop
$1,590,518
$1,190,565
$1,659,253
$1,262,501
$1,948,890
$1,289,936
Single Family Condo/TIC/Coop
Year to Date
2016 2017 2018
- 6.5%+ 12.3%+ 27.5%+ 4.5% + 6.0%+ 17.5%+ 4.3% + 2.2%
2016 2017 2018 2016 2017 2018 2016 2017 2018
+ 3.9% + 11.6% + 3.5%+ 0.4%
Days on Market Until Sale
Days on Market
Single
Family
Year-Over-Year
Change
Condo/TIC/
Coop
Year-Over-Year
Change
Mar-2017 31 +24.0% 32 +6.7%
Apr-2017 26 -18.8% 32 -15.8%
May-2017 24 -7.7% 33 0.0%
Jun-2017 27 -6.9% 37 +5.7%
Jul-2017 24 -25.0% 33 -15.4%
Aug-2017 27 -18.2% 41 -10.9%
Sep-2017 28 -31.7% 42 +5.0%
Oct-2017 23 -14.8% 31 -8.8%
Nov-2017 26 -31.6% 35 -12.5%
Dec-2017 28 -31.7% 44 -8.3%
Jan-2018 34 -19.0% 56 -5.1%
Feb-2018 22 -35.3% 37 +2.8%
12-Month Avg* 26 -19.9% 37 -6.3%
Historical Days on Market Until Sale by Month
* Days on Market for all properties from March 2017 through February 2018. This is not the
average of the individual figures above.
Current as ofMarch 11, 2018.All data from the San Francisco MLS. Report © 2018 ShowingTime. | 9
Average number of days between when a property is listed and when an offer is accepted in a given month.
31
3534
36
22
37
Single Family Condo/TIC/Coop
February
20
40
60
80
100
120
1-2005 1-2006 1-2007 1-2008 1-2009 1-2010 1-2011 1-2012 1-2013 1-2014 1-2015 1-2016 1-2017 1-2018
Single Family Condo/TIC/Coop
36
3938
47
28
45
Single Family Condo/TIC/Coop
Year to Date
2016 2017 2018
+ 2.8%+ 2.9%- 35.3%+ 9.7% + 20.5%- 26.3%+ 5.6% - 4.3%
2016 2017 2018 2016 2017 2018 2016 2017 2018
+ 10.7% + 2.9% 0.0%+ 20.7%
Inventory of Active Listings
Active Listings
Single
Family
Year-Over-Year
Change
Condo/TIC/
Coop
Year-Over-Year
Change
Mar-2017 393 -12.3% 640 -2.9%
Apr-2017 421 -13.4% 653 -10.3%
May-2017 436 -6.6% 669 -10.8%
Jun-2017 395 -10.6% 624 -22.8%
Jul-2017 400 -13.6% 612 -15.6%
Aug-2017 376 -9.6% 613 -10.9%
Sep-2017 439 -17.3% 754 -9.2%
Oct-2017 402 -18.0% 684 -15.1%
Nov-2017 317 -17.2% 581 -2.7%
Dec-2017 201 -22.7% 385 -6.8%
Jan-2018 273 -15.5% 485 -14.0%
Feb-2018 267 -25.6% 474 -25.7%
12-Month Avg* 360 -14.8% 598 -12.6%
Historical Inventory of Active Listings by Month
* Active Listings for all properties from March 2017 through February 2018. This is not the
average of the individual figures above.
Current as ofMarch 11, 2018.All data from the San Francisco MLS. Report © 2018 ShowingTime. | 10
The number of properties available for sale in active status at the end of a given month.
387
559
359
638
267
474
Single Family Condo/TIC/Coop
February
0
200
400
600
800
1,000
1,200
1,400
1,600
1-2005 1-2006 1-2007 1-2008 1-2009 1-2010 1-2011 1-2012 1-2013 1-2014 1-2015 1-2016 1-2017 1-2018
Single Family Condo/TIC/Coop
2016 2017 2018
- 25.7%+ 14.1%- 25.6%- 7.2%
2016 2017 2018
+ 6.6% + 27.9%
% of Properties Sold Over List Price
% of Properties
Sold Over List Price
Single
Family
Year-Over-Year
Change
Condo/TIC/
Coop
Year-Over-Year
Change
Mar-2017 74.6% -9.4% 62.0% -8.4%
Apr-2017 77.3% +2.2% 62.1% +2.8%
May-2017 78.9% -0.8% 61.0% -9.5%
Jun-2017 80.0% +11.1% 58.6% -6.5%
Jul-2017 81.4% +6.8% 62.8% +7.2%
Aug-2017 78.8% +3.8% 60.7% +21.9%
Sep-2017 85.9% +10.8% 53.1% -9.2%
Oct-2017 83.7% +6.1% 66.6% +23.8%
Nov-2017 80.7% +10.9% 58.3% -7.6%
Dec-2017 73.0% +5.8% 55.3% +30.4%
Jan-2018 71.3% +14.4% 34.2% -11.6%
Feb-2018 80.4% +2.6% 59.2% +3.3%
12-Month Avg 79.4% +5.5% 59.0% +2.7%
Historical % of Properties Sold Over List Price by Month
* % of Properties Sold Over List Price for all properties from March 2017 through February 2018.
This is not the average of the individual figures above.
Current as ofMarch 11, 2018.All data from the San Francisco MLS. Report © 2018 ShowingTime. | 11
Percentage found when dividing the number of properties sold by properties sold over its original list price, not accounting for seller
concessions.
77.5%
58.3%
78.4%
57.3%
80.4%
59.2%
Single Family Condo/TIC/Coop
February
0.0%
20.0%
40.0%
60.0%
80.0%
100.0%
1-2005 1-2006 1-2007 1-2008 1-2009 1-2010 1-2011 1-2012 1-2013 1-2014 1-2015 1-2016 1-2017 1-2018
Single Family Condo/TIC/Coop
76.7%
55.8%
70.5%
48.2%
76.0%
48.5%
Single Family Condo/TIC/Coop
Year to Date
2016 2017 2018
+ 3.3%- 1.7%+ 2.6%+ 1.2% - 13.6%+ 7.8%- 8.1% + 0.6%
2016 2017 2018 2016 2017 2018 2016 2017 2018
- 5.7% + 3.5% - 10.1%- 11.4%
% of List Price Received
% of List Price
Received
Single
Family
Year-Over-Year
Change
Condo/TIC/
Coop
Year-Over-Year
Change
Mar-2017 112.4% -2.0% 104.9% -1.3%
Apr-2017 115.4% +1.9% 105.1% -0.1%
May-2017 115.3% +0.1% 105.4% -0.7%
Jun-2017 116.8% +5.9% 105.8% +0.5%
Jul-2017 117.1% +4.7% 106.0% +1.1%
Aug-2017 115.5% +3.6% 105.7% +2.7%
Sep-2017 116.3% +5.0% 104.8% +0.5%
Oct-2017 115.6% +4.0% 106.6% +2.3%
Nov-2017 115.5% +5.9% 104.5% -0.1%
Dec-2017 114.2% +5.4% 103.8% +2.3%
Jan-2018 112.4% +4.5% 101.8% +0.4%
Feb-2018 115.9% +1.8% 105.2% +1.3%
12-Month Avg* 115.4% +3.5% 105.1% +0.8%
Historical % of List Price Received by Month
* % of List Price Received for all properties from March 2017 through February 2018. This is not
the average of the individual figures above.
Current as ofMarch 11, 2018.All data from the San Francisco MLS. Report © 2018 ShowingTime. | 12
Percentage found when dividing a property’s sales price by its most recent list price, then taking the average for all properties sold in a given
month, not accounting for seller concessions.
112.6%
105.9%
113.8%
103.9%
115.9%
105.2%
Single Family Condo/TIC/Coop
February
111.8%
104.9%
110.8%
102.6%
114.2%
103.7%
Single Family Condo/TIC/Coop
Year to Date
95.0%
100.0%
105.0%
110.0%
115.0%
120.0%
1-2005 1-2006 1-2007 1-2008 1-2009 1-2010 1-2011 1-2012 1-2013 1-2014 1-2015 1-2016 1-2017 1-2018
Single Family Condo/TIC/Coop
2016 2017 2018
+ 1.3%- 1.9%+ 1.8%+ 1.1%
2016 2017 2018
- 1.7% - 2.0%
2016 2017 2018
+ 1.1%- 2.2%+ 3.1%- 0.9%
2016 2017 2018
+ 0.3% - 1.5%
Housing Affordability Ratio
Affordability Ratio
Single
Family
Year-Over-Year
Change
Condo/TIC/
Coop
Year-Over-Year
Change
Mar-2017 37 -5.1% 51 -8.9%
Apr-2017 37 -2.6% 54 +1.9%
May-2017 35 -10.3% 51 -8.9%
Jun-2017 35 -12.5% 53 0.0%
Jul-2017 37 -9.8% 52 -11.9%
Aug-2017 38 -11.6% 52 -11.9%
Sep-2017 39 -11.4% 55 -9.8%
Oct-2017 32 -17.9% 52 -7.1%
Nov-2017 35 -7.9% 49 -12.5%
Dec-2017 35 -7.9% 53 -5.4%
Jan-2018 37 -5.1% 52 -7.1%
Feb-2018 29 -25.6% 52 +6.1%
12-Month Avg* 36 -26.8% 40 -7.0%
Historical Housing Affordability Ratio by Month
* Affordability Ratio for all properties from March 2017 through February 2018. This is not the
average of the individual figures above.
Current as ofMarch 11, 2018.All data from the San Francisco MLS. Report © 2018 ShowingTime. | 13
This index measures housing affordability for the region. For example, an index of 120 means the median household income is 120% of what is
necessary to qualify for the median-priced home under prevailing interest rates. A higher number means greater affordability.
38
56
39
49
29
52
Single Family Condo/TIC/Coop
February
20
40
60
80
100
1-2005 1-2006 1-2007 1-2008 1-2009 1-2010 1-2011 1-2012 1-2013 1-2014 1-2015 1-2016 1-2017 1-2018
Single Family Condo/TIC/Coop
2016 2017 2018
+ 6.1%- 12.5%- 25.6%+ 2.6%
2016 2017 2018
- 13.6% + 7.7%
42
56
39
53
33
52
Single Family Condo/TIC/Coop
Year to Date
2016 2017 2018
- 1.9%- 5.4%- 15.4%- 7.1%
2016 2017 2018
- 8.7% - 3.4%
Months Supply of Inventory
Months Supply
Single
Family
Year-Over-Year
Change
Condo/TIC/
Coop
Year-Over-Year
Change
Mar-2017 2.1 -12.5% 2.7 -3.6%
Apr-2017 2.3 -11.5% 2.8 -9.7%
May-2017 2.4 -4.0% 2.8 -12.5%
Jun-2017 2.1 -8.7% 2.6 -25.7%
Jul-2017 2.1 -16.0% 2.6 -16.1%
Aug-2017 2.0 -9.1% 2.6 -13.3%
Sep-2017 2.3 -17.9% 3.2 -11.1%
Oct-2017 2.1 -22.2% 2.8 -20.0%
Nov-2017 1.7 -19.0% 2.4 -7.7%
Dec-2017 1.1 -21.4% 1.6 -11.1%
Jan-2018 1.4 -22.2% 2.0 -16.7%
Feb-2018 1.4 -26.3% 1.9 -32.1%
12-Month Avg* 1.9 -15.1% 2.5 -14.9%
Historical Months Supply of Inventory by Month
* Months Supply for all properties from March 2017 through February 2018. This is not the
average of the individual figures above.
Current as ofMarch 11, 2018.All data from the San Francisco MLS. Report © 2018 ShowingTime. | 14
The inventory of homes for sale at the end of a given month, divided by the average monthly pending sales from the last 12 months.
2.0
2.3
1.9
2.8
1.4
1.9
Single Family Condo/TIC/Coop
February
0.0
2.0
4.0
6.0
8.0
10.0
1-2005 1-2006 1-2007 1-2008 1-2009 1-2010 1-2011 1-2012 1-2013 1-2014 1-2015 1-2016 1-2017 1-2018
Single Family Condo/TIC/Coop
2016 2017 2018
- 32.1%+ 21.7%- 26.3%- 5.0%
2016 2017 2018
+ 5.3% + 35.3%
All Properties Activity Overview
Key metrics by report month and for year-to-date (YTD) starting from the first of the year.
Key Metrics Historical Sparkbars 2-2017 2-2018 Percent Change YTD 2017 YTD 2018 Percent Change
- 10.8%
Pending Sales 344 383 + 11.3% 581 646 + 11.2%
New Listings 517 439 - 15.1% 1,023 913
Sold Listings 268 298 + 11.2% 524 538 + 2.7%
Median Sales Price $1,215,764 $1,315,500 + 8.2% $1,175,000 $1,267,500 + 7.9%
+ 7.2%
39 - 9.3%
$1,530,001
-- --
Days on Market 35 32 - 8.6% 43
Avg. Sales Price $1,493,497 $1,570,457 + 5.2% $1,426,805
Active Listings 997 741 - 25.7% --
% of Properties Sold Over List Price 66.0% 66.4% + 0.6% 57.4%
41
58.6% + 2.1%
+ 1.4%
38 - 7.3%
107.5%% of List Price Received 108.0% 108.8% + 0.7% 106.0%
Current as ofMarch 11, 2018.All data from the San Francisco MLS. Report © 2018 ShowingTime. | 15
Months Supply 2.4 1.7 - 29.2% -- -- --
Affordability Ratio 39 37 - 5.1%
2-2015 2-2016 2-2017 2-2018
2-2015 2-2016 2-2017 2-2018
2-2015 2-2016 2-2017 2-2018
2-2015 2-2016 2-2017 2-2018
2-2015 2-2016 2-2017 2-2018
2-2015 2-2016 2-2017 2-2018
2-2015 2-2016 2-2017 2-2018
2-2015 2-2016 2-2017 2-2018
2-2015 2-2016 2-2017 2-2018
2-2015 2-2016 2-2017 2-2018
2-2015 2-2016 2-2017 2-2018
Activity by District
SF District 1: Northwest (Sea Cliff, Lake, Jordan Park / Laurel Heights, Outer Richmond, Central Richmond, Inner Richmond, Lone Mountain)
SF District 2: Central West (Outer Sunset, Central Sunset, Inner Sunset, Outer Parkside, Parkside, Inner Parkside, Golden Gate Heights)
SF District 3: Southwest (Pine Lake Park, Lake Shore, Merced Manor, Stonestown, Lakeside, Merced Heights, Ingleside, Ingleside Heights, Oceanview)
SF District 4: Twin Peaks W (Forest Hill (& Ext), W Portal, St Francis Wd, Balboa Terr, Mt Dav Manor, Ingleside Terr, Monterey Hts, Wstwd Pk & H'lnds, Shrwd Fst, Miraloma Pk, Dmnd Hts, Mdtwn Terr)
SF District 5: Central (Haight Ashbury, Cole Vly / Prnssus Hts, Clarndn Hts, Corona Hts, Twin Pks, Glen Pk, Noe Vly, Eureka Vly / Dolores Hts, Mission Dolores, Duboce Trngl, Buena Vista / Ashbury Hts)
SF District 6: Central North (Lower Pacific Heights, Anza Vista, Western Addition, North Panhandle, Alamo Square, Hayes Valley)
SF District 7: North (Marina, Cow Hollow, Presidio Heights, Pacific Heights)
SF District 8: Northeast (North Waterfront, North Beach, Russian Hill, Telegraph Hill, Nob Hill, Financial District / Barbary Coast, Downtown, Van Ness / Civic Center, Tenderloin)
SF District 9: Central East (Yerba Buena, South Beach, South of Market, Mission Bay, Inner Mission, Potrero Hill, Central Waterfront / Dogpatch, Bernal Heights)
SF District 10: Southeast (Outer Mission, Mission Terr, Excelsior, Portola, Bayview, Silver Terr, Hunters Pt, Candlestick Pt, Bayview Hts, Little Hollywood, Visitation Vly, Crocker Amazon)
2-2017 2-2018 + / – 2-2017 2-2018 + / – 2-2017 2-2018 + / – 2-2017 2-2018 + / – 2-2017 2-2018 + / –
Single Family
1 SF District 1 21 21 0.0% 5 9 +80.0% $2,025,000 $1,925,000 -4.9% 48 31 -35.4% 1.4 1.6 +14.3%
2 SF District 2 40 24 -40.0% 14 9 -35.7% $1,255,500 $1,410,000 +12.3% 25 6 -76.0% 1.2 0.7 -41.7%
3 SF District 3 15 14 -6.7% 7 6 -14.3% $920,000 $1,025,500 +11.5% 78 46 -41.0% 1.0 1.1 +10.0%
4 SF District 4 40 21 -47.5% 12 15 +25.0% $1,591,000 $1,850,000 +16.3% 22 14 -36.4% 1.5 0.8 -46.7%
5 SF District 5 64 48 -25.0% 22 20 -9.1% $2,305,000 $2,925,500 +26.9% 24 24 0.0% 2.4 1.8 -25.0%
6 SF District 6 7 6 -14.3% 3 3 0.0% $3,250,000 $2,215,000 -31.8% 9 33 +266.7% 2.3 1.8 -21.7%
7 SF District 7 29 30 +3.4% 2 5 +150.0% $6,755,000 $4,900,000 -27.5% 60 11 -81.7% 3.4 3.4 0.0%
8 SF District 8 12 11 -8.3% 1 1 0.0% $6,100,000 $4,995,000 -18.1% 170 72 -57.6% 6.0 4.3 -28.3%
9 SF District 9 52 37 -28.8% 18 13 -27.8% $1,287,500 $1,740,000 +35.1% 26 9 -65.4% 2.5 1.7 -32.0%
10 SF District 10 79 55 -30.4% 27 21 -22.2% $863,000 $1,080,000 +25.1% 40 29 -27.5% 2.3 1.3 -43.5%
Condo/TIC/Coop
1 SF District 1 20 13 -35.0% 5 8 +60.0% $1,360,000 $1,268,500 -6.7% 8 17 +112.5% 1.8 1.2 -33.3%
2 SF District 2 7 6 -14.3% 0 5 -- $0 $1,370,000 -- 0 22 -- 1.8 1.9 +5.6%
3 SF District 3 11 7 -36.4% 4 1 -75.0% $900,000 $810,000 -10.0% 9 187 +1977.8% 2.8 2.7 -3.6%
4 SF District 4 7 8 +14.3% 2 4 +100.0% $645,000 $510,846 -20.8% 33 89 +169.7% 3.0 2.2 -26.7%
5 SF District 5 81 53 -34.6% 23 25 +8.7% $1,526,000 $1,500,000 -1.7% 22 27 +22.7% 2.4 1.5 -37.5%
6 SF District 6 67 51 -23.9% 15 22 +46.7% $1,350,000 $1,190,000 -11.9% 21 44 +109.5% 2.5 1.9 -24.0%
7 SF District 7 47 43 -8.5% 29 15 -48.3% $1,725,000 $1,650,000 -4.3% 41 20 -51.2% 1.7 1.7 0.0%
8 SF District 8 123 94 -23.6% 21 20 -4.8% $865,000 $1,241,500 +43.5% 49 48 -2.0% 3.2 2.3 -28.1%
9 SF District 9 252 181 -28.2% 53 85 +60.4% $988,000 $979,000 -0.9% 42 37 -11.9% 3.2 2.0 -37.5%
10 SF District 10 23 18 -21.7% 5 11 +120.0% $675,000 $638,500 -5.4% 34 48 +41.2% 3.4 2.0 -41.2%
Key metrics by report month for the districts of San Fransisco.
Current as ofMarch 11, 2018.All data from the San Francisco MLS. Report © 2018 ShowingTime. | 16
Active Listings Sold Listings Median Sales Price Days on Market Months Supply

More Related Content

What's hot

San Francisco Market Focus June 2017
San Francisco Market Focus June 2017San Francisco Market Focus June 2017
San Francisco Market Focus June 2017Ronny Budiutama
 
San Francisco Market Focus May 2017
San Francisco Market Focus May 2017San Francisco Market Focus May 2017
San Francisco Market Focus May 2017Ronny Budiutama
 
January 2018 San Francisco Market Update
January 2018 San Francisco Market UpdateJanuary 2018 San Francisco Market Update
January 2018 San Francisco Market UpdateRonny Budiutama
 
San Francisco Real Estate Housing Market December 2016
San Francisco Real Estate Housing Market December 2016San Francisco Real Estate Housing Market December 2016
San Francisco Real Estate Housing Market December 2016Ronny Budiutama
 
San Francisco market focus report June 2018
San Francisco market focus report June 2018San Francisco market focus report June 2018
San Francisco market focus report June 2018Ronny Budiutama
 
San Francisco Market Focus Report Aug 2018
San Francisco Market Focus Report Aug 2018San Francisco Market Focus Report Aug 2018
San Francisco Market Focus Report Aug 2018Ronny Budiutama
 
San Francisco Market Report March 2021
San Francisco Market Report March 2021San Francisco Market Report March 2021
San Francisco Market Report March 2021Ronny Budiutama
 
San Francisco Market Focus Report September 2018
San Francisco Market Focus Report September 2018San Francisco Market Focus Report September 2018
San Francisco Market Focus Report September 2018Ronny Budiutama
 
San Francisco Market Focus Report May
San Francisco Market Focus Report MaySan Francisco Market Focus Report May
San Francisco Market Focus Report MayRonny Budiutama
 
San Francisco Market Focus March 2017
San Francisco Market Focus March 2017San Francisco Market Focus March 2017
San Francisco Market Focus March 2017Ronny Budiutama
 
San Francisco Market Focus Report May 2019
San Francisco Market Focus Report May 2019San Francisco Market Focus Report May 2019
San Francisco Market Focus Report May 2019Ronny Budiutama
 
San Francisco Market Focus Report Jan 2019
San Francisco Market Focus Report Jan 2019San Francisco Market Focus Report Jan 2019
San Francisco Market Focus Report Jan 2019Ronny Budiutama
 
San Francisco Market Focus Report March 2019
San Francisco Market Focus Report March 2019San Francisco Market Focus Report March 2019
San Francisco Market Focus Report March 2019Ronny Budiutama
 
San Francisco market focus report December 2019
San Francisco market focus report December 2019San Francisco market focus report December 2019
San Francisco market focus report December 2019Ronny Budiutama
 
San Francisco Market Focus Report Jan 2020
San Francisco Market Focus Report Jan 2020San Francisco Market Focus Report Jan 2020
San Francisco Market Focus Report Jan 2020Ronny Budiutama
 
San Francisco Market Focus Sept 2017
San Francisco Market Focus Sept 2017San Francisco Market Focus Sept 2017
San Francisco Market Focus Sept 2017Ronny Budiutama
 
San Francisco Market Focus March 2016
San Francisco Market Focus March 2016San Francisco Market Focus March 2016
San Francisco Market Focus March 2016Ronny Budiutama
 
San Francisco market report April 2020
San Francisco market report April 2020San Francisco market report April 2020
San Francisco market report April 2020Ronny Budiutama
 
Gbar monthly-market-insights-report-november20
Gbar monthly-market-insights-report-november20Gbar monthly-market-insights-report-november20
Gbar monthly-market-insights-report-november20Joe Schutt
 
Gbar monthly-market-insight-report-jan20
Gbar monthly-market-insight-report-jan20Gbar monthly-market-insight-report-jan20
Gbar monthly-market-insight-report-jan20Joe Schutt
 

What's hot (20)

San Francisco Market Focus June 2017
San Francisco Market Focus June 2017San Francisco Market Focus June 2017
San Francisco Market Focus June 2017
 
San Francisco Market Focus May 2017
San Francisco Market Focus May 2017San Francisco Market Focus May 2017
San Francisco Market Focus May 2017
 
January 2018 San Francisco Market Update
January 2018 San Francisco Market UpdateJanuary 2018 San Francisco Market Update
January 2018 San Francisco Market Update
 
San Francisco Real Estate Housing Market December 2016
San Francisco Real Estate Housing Market December 2016San Francisco Real Estate Housing Market December 2016
San Francisco Real Estate Housing Market December 2016
 
San Francisco market focus report June 2018
San Francisco market focus report June 2018San Francisco market focus report June 2018
San Francisco market focus report June 2018
 
San Francisco Market Focus Report Aug 2018
San Francisco Market Focus Report Aug 2018San Francisco Market Focus Report Aug 2018
San Francisco Market Focus Report Aug 2018
 
San Francisco Market Report March 2021
San Francisco Market Report March 2021San Francisco Market Report March 2021
San Francisco Market Report March 2021
 
San Francisco Market Focus Report September 2018
San Francisco Market Focus Report September 2018San Francisco Market Focus Report September 2018
San Francisco Market Focus Report September 2018
 
San Francisco Market Focus Report May
San Francisco Market Focus Report MaySan Francisco Market Focus Report May
San Francisco Market Focus Report May
 
San Francisco Market Focus March 2017
San Francisco Market Focus March 2017San Francisco Market Focus March 2017
San Francisco Market Focus March 2017
 
San Francisco Market Focus Report May 2019
San Francisco Market Focus Report May 2019San Francisco Market Focus Report May 2019
San Francisco Market Focus Report May 2019
 
San Francisco Market Focus Report Jan 2019
San Francisco Market Focus Report Jan 2019San Francisco Market Focus Report Jan 2019
San Francisco Market Focus Report Jan 2019
 
San Francisco Market Focus Report March 2019
San Francisco Market Focus Report March 2019San Francisco Market Focus Report March 2019
San Francisco Market Focus Report March 2019
 
San Francisco market focus report December 2019
San Francisco market focus report December 2019San Francisco market focus report December 2019
San Francisco market focus report December 2019
 
San Francisco Market Focus Report Jan 2020
San Francisco Market Focus Report Jan 2020San Francisco Market Focus Report Jan 2020
San Francisco Market Focus Report Jan 2020
 
San Francisco Market Focus Sept 2017
San Francisco Market Focus Sept 2017San Francisco Market Focus Sept 2017
San Francisco Market Focus Sept 2017
 
San Francisco Market Focus March 2016
San Francisco Market Focus March 2016San Francisco Market Focus March 2016
San Francisco Market Focus March 2016
 
San Francisco market report April 2020
San Francisco market report April 2020San Francisco market report April 2020
San Francisco market report April 2020
 
Gbar monthly-market-insights-report-november20
Gbar monthly-market-insights-report-november20Gbar monthly-market-insights-report-november20
Gbar monthly-market-insights-report-november20
 
Gbar monthly-market-insight-report-jan20
Gbar monthly-market-insight-report-jan20Gbar monthly-market-insight-report-jan20
Gbar monthly-market-insight-report-jan20
 

Similar to San Francisco Market Focus February 2018

San Francisco Market Focus July 2017
San Francisco Market Focus July 2017San Francisco Market Focus July 2017
San Francisco Market Focus July 2017Ronny Budiutama
 
San Francisco Market Focus Report April 2019
San Francisco Market Focus Report April 2019San Francisco Market Focus Report April 2019
San Francisco Market Focus Report April 2019Ronny Budiutama
 
San Francisco Market Focus August 2017
San Francisco Market Focus August 2017San Francisco Market Focus August 2017
San Francisco Market Focus August 2017Ronny Budiutama
 
San Francisco Market Focus August 2017
San Francisco Market Focus August 2017San Francisco Market Focus August 2017
San Francisco Market Focus August 2017Ronny Budiutama
 
San Francisco Market Focus Report Feb 2019
San Francisco Market Focus Report Feb 2019San Francisco Market Focus Report Feb 2019
San Francisco Market Focus Report Feb 2019Ronny Budiutama
 
San Francisco Market Focus April 2016
San Francisco Market Focus April 2016San Francisco Market Focus April 2016
San Francisco Market Focus April 2016Ronny Budiutama
 
San Francisco Market Focus October 2017
San Francisco Market Focus October 2017San Francisco Market Focus October 2017
San Francisco Market Focus October 2017Ronny Budiutama
 
San Francisco Real Estate Housing Market January 2017
San Francisco Real Estate Housing Market January 2017San Francisco Real Estate Housing Market January 2017
San Francisco Real Estate Housing Market January 2017Ronny Budiutama
 
San Francisco market report July 2020
San Francisco market report July 2020San Francisco market report July 2020
San Francisco market report July 2020Ronny Budiutama
 
San Fancisco Market Focus Report June 2019
San Fancisco Market Focus Report June 2019San Fancisco Market Focus Report June 2019
San Fancisco Market Focus Report June 2019Ronny Budiutama
 
San Francisco market report June 2020
San Francisco market report June 2020San Francisco market report June 2020
San Francisco market report June 2020Ronny Budiutama
 
San Francisco Market Report for March 2020
San Francisco Market Report for March 2020San Francisco Market Report for March 2020
San Francisco Market Report for March 2020Ronny Budiutama
 
San Francisco Market Report September 2021
San Francisco Market Report September 2021San Francisco Market Report September 2021
San Francisco Market Report September 2021Ronny Budiutama
 

Similar to San Francisco Market Focus February 2018 (13)

San Francisco Market Focus July 2017
San Francisco Market Focus July 2017San Francisco Market Focus July 2017
San Francisco Market Focus July 2017
 
San Francisco Market Focus Report April 2019
San Francisco Market Focus Report April 2019San Francisco Market Focus Report April 2019
San Francisco Market Focus Report April 2019
 
San Francisco Market Focus August 2017
San Francisco Market Focus August 2017San Francisco Market Focus August 2017
San Francisco Market Focus August 2017
 
San Francisco Market Focus August 2017
San Francisco Market Focus August 2017San Francisco Market Focus August 2017
San Francisco Market Focus August 2017
 
San Francisco Market Focus Report Feb 2019
San Francisco Market Focus Report Feb 2019San Francisco Market Focus Report Feb 2019
San Francisco Market Focus Report Feb 2019
 
San Francisco Market Focus April 2016
San Francisco Market Focus April 2016San Francisco Market Focus April 2016
San Francisco Market Focus April 2016
 
San Francisco Market Focus October 2017
San Francisco Market Focus October 2017San Francisco Market Focus October 2017
San Francisco Market Focus October 2017
 
San Francisco Real Estate Housing Market January 2017
San Francisco Real Estate Housing Market January 2017San Francisco Real Estate Housing Market January 2017
San Francisco Real Estate Housing Market January 2017
 
San Francisco market report July 2020
San Francisco market report July 2020San Francisco market report July 2020
San Francisco market report July 2020
 
San Fancisco Market Focus Report June 2019
San Fancisco Market Focus Report June 2019San Fancisco Market Focus Report June 2019
San Fancisco Market Focus Report June 2019
 
San Francisco market report June 2020
San Francisco market report June 2020San Francisco market report June 2020
San Francisco market report June 2020
 
San Francisco Market Report for March 2020
San Francisco Market Report for March 2020San Francisco Market Report for March 2020
San Francisco Market Report for March 2020
 
San Francisco Market Report September 2021
San Francisco Market Report September 2021San Francisco Market Report September 2021
San Francisco Market Report September 2021
 

More from Ronny Budiutama

San Francisco January 2024 Market Report
San Francisco January 2024 Market ReportSan Francisco January 2024 Market Report
San Francisco January 2024 Market ReportRonny Budiutama
 
San Francisco December 2023 Market Report
San Francisco December 2023 Market ReportSan Francisco December 2023 Market Report
San Francisco December 2023 Market ReportRonny Budiutama
 
San Francisco November 2023 Market Report
San Francisco November 2023 Market ReportSan Francisco November 2023 Market Report
San Francisco November 2023 Market ReportRonny Budiutama
 
2023 Annual San Francisco Housing Market
2023 Annual San Francisco Housing Market2023 Annual San Francisco Housing Market
2023 Annual San Francisco Housing MarketRonny Budiutama
 
October 2023 Report: San Francisco Real Estate Market Insights
October 2023 Report: San Francisco Real Estate Market InsightsOctober 2023 Report: San Francisco Real Estate Market Insights
October 2023 Report: San Francisco Real Estate Market InsightsRonny Budiutama
 
CA Weekly MLS Market Data Report - August 2023
CA Weekly MLS Market Data Report - August 2023CA Weekly MLS Market Data Report - August 2023
CA Weekly MLS Market Data Report - August 2023Ronny Budiutama
 
San Francisco Market Report July 2023.pdf
San Francisco Market Report July 2023.pdfSan Francisco Market Report July 2023.pdf
San Francisco Market Report July 2023.pdfRonny Budiutama
 
San Francisco May 2023 Market Report.pdf
San Francisco May 2023 Market Report.pdfSan Francisco May 2023 Market Report.pdf
San Francisco May 2023 Market Report.pdfRonny Budiutama
 
San Francisco June 2023 Market Report.pdf
San Francisco June 2023 Market Report.pdfSan Francisco June 2023 Market Report.pdf
San Francisco June 2023 Market Report.pdfRonny Budiutama
 
San Francisco Market Report March 2023.pdf
San Francisco Market Report March 2023.pdfSan Francisco Market Report March 2023.pdf
San Francisco Market Report March 2023.pdfRonny Budiutama
 
San Francisco Market Report February 2023
San Francisco Market Report February 2023San Francisco Market Report February 2023
San Francisco Market Report February 2023Ronny Budiutama
 
San Francisco Market Report January 2023.pdf
San Francisco Market Report January 2023.pdfSan Francisco Market Report January 2023.pdf
San Francisco Market Report January 2023.pdfRonny Budiutama
 
Annual Report on the San Francisco County Housing Market.pdf
Annual Report on the San Francisco County Housing Market.pdfAnnual Report on the San Francisco County Housing Market.pdf
Annual Report on the San Francisco County Housing Market.pdfRonny Budiutama
 
San Francisco Market Report December 2022.pdf
San Francisco Market Report December 2022.pdfSan Francisco Market Report December 2022.pdf
San Francisco Market Report December 2022.pdfRonny Budiutama
 
San Francisco Market Report November 2022.pdf
San Francisco Market Report November 2022.pdfSan Francisco Market Report November 2022.pdf
San Francisco Market Report November 2022.pdfRonny Budiutama
 
San Francisco Market Report October 2022.pdf
San Francisco Market Report October 2022.pdfSan Francisco Market Report October 2022.pdf
San Francisco Market Report October 2022.pdfRonny Budiutama
 
San Francisco Market Report September 2022.pdf
San Francisco Market Report September 2022.pdfSan Francisco Market Report September 2022.pdf
San Francisco Market Report September 2022.pdfRonny Budiutama
 
San Francisco Market Report August 2022.pdf
San Francisco Market Report August 2022.pdfSan Francisco Market Report August 2022.pdf
San Francisco Market Report August 2022.pdfRonny Budiutama
 
San Francisco Market Report July 2022.pdf
San Francisco Market Report July 2022.pdfSan Francisco Market Report July 2022.pdf
San Francisco Market Report July 2022.pdfRonny Budiutama
 
San Francisco Market Report June 2022.pdf
San Francisco Market Report June 2022.pdfSan Francisco Market Report June 2022.pdf
San Francisco Market Report June 2022.pdfRonny Budiutama
 

More from Ronny Budiutama (20)

San Francisco January 2024 Market Report
San Francisco January 2024 Market ReportSan Francisco January 2024 Market Report
San Francisco January 2024 Market Report
 
San Francisco December 2023 Market Report
San Francisco December 2023 Market ReportSan Francisco December 2023 Market Report
San Francisco December 2023 Market Report
 
San Francisco November 2023 Market Report
San Francisco November 2023 Market ReportSan Francisco November 2023 Market Report
San Francisco November 2023 Market Report
 
2023 Annual San Francisco Housing Market
2023 Annual San Francisco Housing Market2023 Annual San Francisco Housing Market
2023 Annual San Francisco Housing Market
 
October 2023 Report: San Francisco Real Estate Market Insights
October 2023 Report: San Francisco Real Estate Market InsightsOctober 2023 Report: San Francisco Real Estate Market Insights
October 2023 Report: San Francisco Real Estate Market Insights
 
CA Weekly MLS Market Data Report - August 2023
CA Weekly MLS Market Data Report - August 2023CA Weekly MLS Market Data Report - August 2023
CA Weekly MLS Market Data Report - August 2023
 
San Francisco Market Report July 2023.pdf
San Francisco Market Report July 2023.pdfSan Francisco Market Report July 2023.pdf
San Francisco Market Report July 2023.pdf
 
San Francisco May 2023 Market Report.pdf
San Francisco May 2023 Market Report.pdfSan Francisco May 2023 Market Report.pdf
San Francisco May 2023 Market Report.pdf
 
San Francisco June 2023 Market Report.pdf
San Francisco June 2023 Market Report.pdfSan Francisco June 2023 Market Report.pdf
San Francisco June 2023 Market Report.pdf
 
San Francisco Market Report March 2023.pdf
San Francisco Market Report March 2023.pdfSan Francisco Market Report March 2023.pdf
San Francisco Market Report March 2023.pdf
 
San Francisco Market Report February 2023
San Francisco Market Report February 2023San Francisco Market Report February 2023
San Francisco Market Report February 2023
 
San Francisco Market Report January 2023.pdf
San Francisco Market Report January 2023.pdfSan Francisco Market Report January 2023.pdf
San Francisco Market Report January 2023.pdf
 
Annual Report on the San Francisco County Housing Market.pdf
Annual Report on the San Francisco County Housing Market.pdfAnnual Report on the San Francisco County Housing Market.pdf
Annual Report on the San Francisco County Housing Market.pdf
 
San Francisco Market Report December 2022.pdf
San Francisco Market Report December 2022.pdfSan Francisco Market Report December 2022.pdf
San Francisco Market Report December 2022.pdf
 
San Francisco Market Report November 2022.pdf
San Francisco Market Report November 2022.pdfSan Francisco Market Report November 2022.pdf
San Francisco Market Report November 2022.pdf
 
San Francisco Market Report October 2022.pdf
San Francisco Market Report October 2022.pdfSan Francisco Market Report October 2022.pdf
San Francisco Market Report October 2022.pdf
 
San Francisco Market Report September 2022.pdf
San Francisco Market Report September 2022.pdfSan Francisco Market Report September 2022.pdf
San Francisco Market Report September 2022.pdf
 
San Francisco Market Report August 2022.pdf
San Francisco Market Report August 2022.pdfSan Francisco Market Report August 2022.pdf
San Francisco Market Report August 2022.pdf
 
San Francisco Market Report July 2022.pdf
San Francisco Market Report July 2022.pdfSan Francisco Market Report July 2022.pdf
San Francisco Market Report July 2022.pdf
 
San Francisco Market Report June 2022.pdf
San Francisco Market Report June 2022.pdfSan Francisco Market Report June 2022.pdf
San Francisco Market Report June 2022.pdf
 

Recently uploaded

3D Architectural Rendering Company by Panoram CGI
3D Architectural Rendering Company by Panoram CGI3D Architectural Rendering Company by Panoram CGI
3D Architectural Rendering Company by Panoram CGIPanoram CGI
 
Premium Villa Projects in Sarjapur Road Bengaluru
Premium Villa Projects in Sarjapur Road BengaluruPremium Villa Projects in Sarjapur Road Bengaluru
Premium Villa Projects in Sarjapur Road BengaluruShivaSeo3
 
9990771857 Call Girls in Dwarka Sector 1 Delhi (Call Girls) Delhi
9990771857 Call Girls in Dwarka Sector 1 Delhi (Call Girls) Delhi9990771857 Call Girls in Dwarka Sector 1 Delhi (Call Girls) Delhi
9990771857 Call Girls in Dwarka Sector 1 Delhi (Call Girls) Delhidelhimodel235
 
How to Build Multifamily and Laneway Suites in Toronto!! (feat. Expert Archi...
How to Build Multifamily and Laneway Suites  in Toronto!! (feat. Expert Archi...How to Build Multifamily and Laneway Suites  in Toronto!! (feat. Expert Archi...
How to Build Multifamily and Laneway Suites in Toronto!! (feat. Expert Archi...Volition Properties
 
call girls in ganesh nagar Delhi 8264348440 ✅ call girls ❤️
call girls in ganesh nagar Delhi 8264348440 ✅ call girls ❤️call girls in ganesh nagar Delhi 8264348440 ✅ call girls ❤️
call girls in ganesh nagar Delhi 8264348440 ✅ call girls ❤️soniya singh
 
Call Girls In Laxmi Nagar Delhi +91-8447779280! !Best Woman Seeking Man Escor...
Call Girls In Laxmi Nagar Delhi +91-8447779280! !Best Woman Seeking Man Escor...Call Girls In Laxmi Nagar Delhi +91-8447779280! !Best Woman Seeking Man Escor...
Call Girls In Laxmi Nagar Delhi +91-8447779280! !Best Woman Seeking Man Escor...asmaqueen5
 
M3M 129 E Brochure Noida Expressway, Sector 129, Noida
M3M 129 E Brochure Noida Expressway, Sector 129, NoidaM3M 129 E Brochure Noida Expressway, Sector 129, Noida
M3M 129 E Brochure Noida Expressway, Sector 129, Noidasarak0han45400
 
Purva Soukhyam in Guduvancheri Chennai.pdf
Purva Soukhyam in Guduvancheri Chennai.pdfPurva Soukhyam in Guduvancheri Chennai.pdf
Purva Soukhyam in Guduvancheri Chennai.pdfpritika141199
 
Listing Turkey Sylvana Istanbul - Bahcesehir
Listing Turkey Sylvana Istanbul - BahcesehirListing Turkey Sylvana Istanbul - Bahcesehir
Listing Turkey Sylvana Istanbul - BahcesehirListing Turkey
 
Call Girls in Noida Sector 77 Noida 💯Call Us 🔝 9582086666 🔝 South Delhi Escor...
Call Girls in Noida Sector 77 Noida 💯Call Us 🔝 9582086666 🔝 South Delhi Escor...Call Girls in Noida Sector 77 Noida 💯Call Us 🔝 9582086666 🔝 South Delhi Escor...
Call Girls in Noida Sector 77 Noida 💯Call Us 🔝 9582086666 🔝 South Delhi Escor...delhimodel235
 
Call Girls In Mayur Vihar Delhi ☆↫8447779280 ❤Escorts Service In Delhi
Call Girls In Mayur Vihar Delhi ☆↫8447779280 ❤Escorts Service In DelhiCall Girls In Mayur Vihar Delhi ☆↫8447779280 ❤Escorts Service In Delhi
Call Girls In Mayur Vihar Delhi ☆↫8447779280 ❤Escorts Service In Delhiasmaqueen5
 
Call Girls in Adarsh Nagar Delhi 💯Call Us 🔝 9582086666🔝 South Delhi Escorts S...
Call Girls in Adarsh Nagar Delhi 💯Call Us 🔝 9582086666🔝 South Delhi Escorts S...Call Girls in Adarsh Nagar Delhi 💯Call Us 🔝 9582086666🔝 South Delhi Escorts S...
Call Girls in Adarsh Nagar Delhi 💯Call Us 🔝 9582086666🔝 South Delhi Escorts S...delhimodel235
 
Properties for Sale in Istanbul with Schools and Parks | Antalya Development
Properties for Sale in Istanbul with Schools and Parks | Antalya DevelopmentProperties for Sale in Istanbul with Schools and Parks | Antalya Development
Properties for Sale in Istanbul with Schools and Parks | Antalya DevelopmentAntalya Development
 
2k Shot Call girls Karol Bagh Delhi 9205541914
2k Shot Call girls Karol Bagh Delhi 92055419142k Shot Call girls Karol Bagh Delhi 9205541914
2k Shot Call girls Karol Bagh Delhi 9205541914Delhi Call girls
 
:/Call Girls In Saidulajab Delhi ➥9990211544 High profile Riya Escorts In 24/...
:/Call Girls In Saidulajab Delhi ➥9990211544 High profile Riya Escorts In 24/...:/Call Girls In Saidulajab Delhi ➥9990211544 High profile Riya Escorts In 24/...
:/Call Girls In Saidulajab Delhi ➥9990211544 High profile Riya Escorts In 24/...lizamodels9
 
Kohinoor Flats In Hinjewadi Phase 2 | Homes Built To Suit Your Needs
Kohinoor Flats In Hinjewadi Phase 2 | Homes Built To Suit Your NeedsKohinoor Flats In Hinjewadi Phase 2 | Homes Built To Suit Your Needs
Kohinoor Flats In Hinjewadi Phase 2 | Homes Built To Suit Your Needsaidasheikh47
 
Call Girls In Chand Nagar (Delhi)+918447779280 Welcome To Vip Women Seeking M...
Call Girls In Chand Nagar (Delhi)+918447779280 Welcome To Vip Women Seeking M...Call Girls In Chand Nagar (Delhi)+918447779280 Welcome To Vip Women Seeking M...
Call Girls In Chand Nagar (Delhi)+918447779280 Welcome To Vip Women Seeking M...asmaqueen5
 
Girls in Kalyanpuri }Delhi↫8447779280↬Escort Service. In Delhi NCR
Girls in Kalyanpuri }Delhi↫8447779280↬Escort Service. In Delhi NCRGirls in Kalyanpuri }Delhi↫8447779280↬Escort Service. In Delhi NCR
Girls in Kalyanpuri }Delhi↫8447779280↬Escort Service. In Delhi NCRasmaqueen5
 
Sankla East World Hadapsar Pune E-Brochure.pdf
Sankla East World Hadapsar Pune  E-Brochure.pdfSankla East World Hadapsar Pune  E-Brochure.pdf
Sankla East World Hadapsar Pune E-Brochure.pdfManishSaxena95
 
Greater Vancouver Realtors Statistics Package April 2024
Greater Vancouver Realtors Statistics Package April 2024Greater Vancouver Realtors Statistics Package April 2024
Greater Vancouver Realtors Statistics Package April 2024VickyAulakh1
 

Recently uploaded (20)

3D Architectural Rendering Company by Panoram CGI
3D Architectural Rendering Company by Panoram CGI3D Architectural Rendering Company by Panoram CGI
3D Architectural Rendering Company by Panoram CGI
 
Premium Villa Projects in Sarjapur Road Bengaluru
Premium Villa Projects in Sarjapur Road BengaluruPremium Villa Projects in Sarjapur Road Bengaluru
Premium Villa Projects in Sarjapur Road Bengaluru
 
9990771857 Call Girls in Dwarka Sector 1 Delhi (Call Girls) Delhi
9990771857 Call Girls in Dwarka Sector 1 Delhi (Call Girls) Delhi9990771857 Call Girls in Dwarka Sector 1 Delhi (Call Girls) Delhi
9990771857 Call Girls in Dwarka Sector 1 Delhi (Call Girls) Delhi
 
How to Build Multifamily and Laneway Suites in Toronto!! (feat. Expert Archi...
How to Build Multifamily and Laneway Suites  in Toronto!! (feat. Expert Archi...How to Build Multifamily and Laneway Suites  in Toronto!! (feat. Expert Archi...
How to Build Multifamily and Laneway Suites in Toronto!! (feat. Expert Archi...
 
call girls in ganesh nagar Delhi 8264348440 ✅ call girls ❤️
call girls in ganesh nagar Delhi 8264348440 ✅ call girls ❤️call girls in ganesh nagar Delhi 8264348440 ✅ call girls ❤️
call girls in ganesh nagar Delhi 8264348440 ✅ call girls ❤️
 
Call Girls In Laxmi Nagar Delhi +91-8447779280! !Best Woman Seeking Man Escor...
Call Girls In Laxmi Nagar Delhi +91-8447779280! !Best Woman Seeking Man Escor...Call Girls In Laxmi Nagar Delhi +91-8447779280! !Best Woman Seeking Man Escor...
Call Girls In Laxmi Nagar Delhi +91-8447779280! !Best Woman Seeking Man Escor...
 
M3M 129 E Brochure Noida Expressway, Sector 129, Noida
M3M 129 E Brochure Noida Expressway, Sector 129, NoidaM3M 129 E Brochure Noida Expressway, Sector 129, Noida
M3M 129 E Brochure Noida Expressway, Sector 129, Noida
 
Purva Soukhyam in Guduvancheri Chennai.pdf
Purva Soukhyam in Guduvancheri Chennai.pdfPurva Soukhyam in Guduvancheri Chennai.pdf
Purva Soukhyam in Guduvancheri Chennai.pdf
 
Listing Turkey Sylvana Istanbul - Bahcesehir
Listing Turkey Sylvana Istanbul - BahcesehirListing Turkey Sylvana Istanbul - Bahcesehir
Listing Turkey Sylvana Istanbul - Bahcesehir
 
Call Girls in Noida Sector 77 Noida 💯Call Us 🔝 9582086666 🔝 South Delhi Escor...
Call Girls in Noida Sector 77 Noida 💯Call Us 🔝 9582086666 🔝 South Delhi Escor...Call Girls in Noida Sector 77 Noida 💯Call Us 🔝 9582086666 🔝 South Delhi Escor...
Call Girls in Noida Sector 77 Noida 💯Call Us 🔝 9582086666 🔝 South Delhi Escor...
 
Call Girls In Mayur Vihar Delhi ☆↫8447779280 ❤Escorts Service In Delhi
Call Girls In Mayur Vihar Delhi ☆↫8447779280 ❤Escorts Service In DelhiCall Girls In Mayur Vihar Delhi ☆↫8447779280 ❤Escorts Service In Delhi
Call Girls In Mayur Vihar Delhi ☆↫8447779280 ❤Escorts Service In Delhi
 
Call Girls in Adarsh Nagar Delhi 💯Call Us 🔝 9582086666🔝 South Delhi Escorts S...
Call Girls in Adarsh Nagar Delhi 💯Call Us 🔝 9582086666🔝 South Delhi Escorts S...Call Girls in Adarsh Nagar Delhi 💯Call Us 🔝 9582086666🔝 South Delhi Escorts S...
Call Girls in Adarsh Nagar Delhi 💯Call Us 🔝 9582086666🔝 South Delhi Escorts S...
 
Properties for Sale in Istanbul with Schools and Parks | Antalya Development
Properties for Sale in Istanbul with Schools and Parks | Antalya DevelopmentProperties for Sale in Istanbul with Schools and Parks | Antalya Development
Properties for Sale in Istanbul with Schools and Parks | Antalya Development
 
2k Shot Call girls Karol Bagh Delhi 9205541914
2k Shot Call girls Karol Bagh Delhi 92055419142k Shot Call girls Karol Bagh Delhi 9205541914
2k Shot Call girls Karol Bagh Delhi 9205541914
 
:/Call Girls In Saidulajab Delhi ➥9990211544 High profile Riya Escorts In 24/...
:/Call Girls In Saidulajab Delhi ➥9990211544 High profile Riya Escorts In 24/...:/Call Girls In Saidulajab Delhi ➥9990211544 High profile Riya Escorts In 24/...
:/Call Girls In Saidulajab Delhi ➥9990211544 High profile Riya Escorts In 24/...
 
Kohinoor Flats In Hinjewadi Phase 2 | Homes Built To Suit Your Needs
Kohinoor Flats In Hinjewadi Phase 2 | Homes Built To Suit Your NeedsKohinoor Flats In Hinjewadi Phase 2 | Homes Built To Suit Your Needs
Kohinoor Flats In Hinjewadi Phase 2 | Homes Built To Suit Your Needs
 
Call Girls In Chand Nagar (Delhi)+918447779280 Welcome To Vip Women Seeking M...
Call Girls In Chand Nagar (Delhi)+918447779280 Welcome To Vip Women Seeking M...Call Girls In Chand Nagar (Delhi)+918447779280 Welcome To Vip Women Seeking M...
Call Girls In Chand Nagar (Delhi)+918447779280 Welcome To Vip Women Seeking M...
 
Girls in Kalyanpuri }Delhi↫8447779280↬Escort Service. In Delhi NCR
Girls in Kalyanpuri }Delhi↫8447779280↬Escort Service. In Delhi NCRGirls in Kalyanpuri }Delhi↫8447779280↬Escort Service. In Delhi NCR
Girls in Kalyanpuri }Delhi↫8447779280↬Escort Service. In Delhi NCR
 
Sankla East World Hadapsar Pune E-Brochure.pdf
Sankla East World Hadapsar Pune  E-Brochure.pdfSankla East World Hadapsar Pune  E-Brochure.pdf
Sankla East World Hadapsar Pune E-Brochure.pdf
 
Greater Vancouver Realtors Statistics Package April 2024
Greater Vancouver Realtors Statistics Package April 2024Greater Vancouver Realtors Statistics Package April 2024
Greater Vancouver Realtors Statistics Package April 2024
 

San Francisco Market Focus February 2018

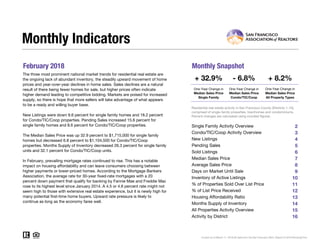
  • 1. February 2018 Monthly Snapshot One-Year Change in One-Year Change in Median Sales Price Single Family Median Sales Price Condo/TIC/Coop 2 3 4 5 6 7 8 9 10 11 12 13 14 15 16 Current as of March 11, 2018.All data from the San Francisco MLS. Report © 2018 ShowingTime. Condo/TIC/Coop Activity Overview Inventory of Active Listings % of Properties Sold Over List Price % of List Price Received Housing Affordability Ratio All Properties Activity Overview New Listings Pending Sales Sold Listings Median Sales Price Average Sales Price Days on Market Until Sale Activity by District Monthly Indicators + 32.9% - 6.8% + 8.2% One-Year Change in The three most prominent national market trends for residential real estate are the ongoing lack of abundant inventory, the steadily upward movement of home prices and year-over-year declines in home sales. Sales declines are a natural result of there being fewer homes for sale, but higher prices often indicate higher demand leading to competitive bidding. Markets are poised for increased supply, so there is hope that more sellers will take advantage of what appears to be a ready and willing buyer base. New Listings were down 9.6 percent for single family homes and 18.2 percent for Condo/TIC/Coop properties. Pending Sales increased 15.6 percent for single family homes and 8.6 percent for Condo/TIC/Coop properties. The Median Sales Price was up 32.9 percent to $1,715,000 for single family homes but decreased 6.8 percent to $1,104,500 for Condo/TIC/Coop properties. Months Supply of Inventory decreased 26.3 percent for single family units and 32.1 percent for Condo/TIC/Coop units. In February, prevailing mortgage rates continued to rise. This has a notable impact on housing affordability and can leave consumers choosing between higher payments or lower-priced homes. According to the Mortgage Bankers Association, the average rate for 30-year fixed-rate mortgages with a 20 percent down payment that qualify for backing by Fannie Mae and Freddie Mac rose to its highest level since January 2014. A 4.5 or 4.6 percent rate might not seem high to those with extensive real estate experience, but it is newly high for many potential first-time home buyers. Upward rate pressure is likely to continue as long as the economy fares well. Median Sales Price All Property Types Residential real estate activity in San Francisco County (Districts 1-10), comprised of single-family properties, townhomes and condominiums. Percent changes are calculated using rounded figures. Single Family Activity Overview Months Supply of Inventory
  • 2. Single Family Activity Overview Key metrics by report month and for year-to-date (YTD) starting from the first of the year. Key Metrics Historical Sparkbars 2-2017 2-2018 Percent Change YTD 2017 YTD 2018 Percent Change - 7.4%337 196 - 9.7% $1,500,000 + 17.6% + 17.5% Pending Sales 135 156 + 15.6% + 6.6%228 243 New Listings 187 169 - 9.6% 364 Sold Listings 111 102 - 8.1% 217 Median Sales Price $1,290,000 $1,715,000 + 32.9% $1,275,000 28 - 26.3% $1,948,890 -- -- Days on Market 34 22 - 35.3% 38 Avg. Sales Price $1,684,181 $2,147,432 + 27.5% $1,659,253 Active Listings 359 267 - 25.6% -- % of Properties Sold Over List Price 78.4% 80.4% + 2.6% 70.5% 39 76.0% + 7.8% + 3.1% 33 - 15.4% 114.2%% of List Price Received 113.8% 115.9% + 1.8% 110.8% Current as ofMarch 11, 2018.All data from the San Francisco MLS. Report © 2018 ShowingTime. | 2 Months Supply 1.9 1.4 - 26.3% -- -- -- Affordability Ratio 39 29 - 25.6% 2-2015 2-2016 2-2017 2-2018 2-2015 2-2016 2-2017 2-2018 2-2015 2-2016 2-2017 2-2018 2-2015 2-2016 2-2017 2-2018 2-2015 2-2016 2-2017 2-2018 2-2015 2-2016 2-2017 2-2018 2-2015 2-2016 2-2017 2-2018 2-2015 2-2016 2-2017 2-2018 2-2015 2-2016 2-2017 2-2018 2-2015 2-2016 2-2017 2-2018 2-2015 2-2016 2-2017 2-2018
  • 3. Condo/TIC/Coop Activity Overview Key metrics by report month and for year-to-date (YTD) starting from the first of the year. Key Metrics Historical Sparkbars 2-2017 2-2018 Percent Change YTD 2017 YTD 2018 Percent Change - 12.6% Pending Sales 209 227 + 8.6% 353 403 + 14.2% New Listings 330 270 - 18.2% 659 576 Sold Listings 157 196 + 24.8% 307 342 + 11.4% Median Sales Price $1,185,000 $1,104,500 - 6.8% $1,100,000 $1,095,000 - 0.5% + 2.2% 45 - 4.3% $1,289,936 -- -- Days on Market 36 37 + 2.8% 47 Avg. Sales Price $1,358,682 $1,270,194 - 6.5% $1,262,501 Active Listings 638 474 - 25.7% -- % of Properties Sold Over List Price 57.3% 59.2% + 3.3% 48.2% 53 48.5% + 0.6% + 1.1% 52 - 1.9% 103.7%% of List Price Received 103.9% 105.2% + 1.3% 102.6% Current as ofMarch 11, 2018.All data from the San Francisco MLS. Report © 2018 ShowingTime. | 3 Months Supply 2.8 1.9 - 32.1% -- -- -- Affordability Ratio 49 52 + 6.1% 2-2015 2-2016 2-2017 2-2018 2-2015 2-2016 2-2017 2-2018 2-2015 2-2016 2-2017 2-2018 2-2015 2-2016 2-2017 2-2018 2-2015 2-2016 2-2017 2-2018 2-2015 2-2016 2-2017 2-2018 2-2015 2-2016 2-2017 2-2018 2-2015 2-2016 2-2017 2-2018 2-2015 2-2016 2-2017 2-2018 2-2015 2-2016 2-2017 2-2018 2-2015 2-2016 2-2017 2-2018
  • 4. New Listings New Listings Single Family Year-Over-Year Change Condo/TIC/ Coop Year-Over-Year Change Mar-2017 277 +1.5% 348 -7.7% Apr-2017 247 -12.7% 284 -23.7% May-2017 288 +12.1% 361 -3.5% Jun-2017 238 0.0% 313 -23.3% Jul-2017 210 -9.5% 273 -1.4% Aug-2017 212 +5.0% 288 +0.7% Sep-2017 299 -13.8% 433 -0.5% Oct-2017 238 +7.2% 325 +8.3% Nov-2017 138 0.0% 202 +27.0% Dec-2017 70 0.0% 120 0.0% Jan-2018 168 -5.1% 306 -7.0% Feb-2018 169 -9.6% 270 -18.2% 12-Month Avg 213 -2.7% 294 -6.5% Historical New Listings by Month Current as ofMarch 11, 2018.All data from the San Francisco MLS. Report © 2018 ShowingTime. | 4 A count of the properties that have been newly listed on the market in a given month. 228 338 187 330 169 270 Single Family Condo/TIC/Coop February 0 100 200 300 400 500 600 700 1-2005 1-2006 1-2007 1-2008 1-2009 1-2010 1-2011 1-2012 1-2013 1-2014 1-2015 1-2016 1-2017 1-2018 Single Family Condo/TIC/Coop 410 632 364 659 337 576 Single Family Condo/TIC/Coop Year to Date 2016 2017 2018 - 18.2%- 2.4%- 9.6%- 18.0% + 4.3%- 7.4%- 11.2% - 12.6% 2016 2017 2018 2016 2017 2018 2016 2017 2018 - 4.2% - 6.2% + 12.3%+ 14.2%
  • 5. Pending Sales Pending Sales Single Family Year-Over-Year Change Condo/TIC/ Coop Year-Over-Year Change Mar-2017 213 +9.2% 304 +34.5% Apr-2017 198 -7.5% 226 -7.4% May-2017 240 -4.0% 306 +7.4% Jun-2017 249 +8.7% 290 +11.1% Jul-2017 174 +3.0% 209 -19.0% Aug-2017 206 +4.0% 212 -10.2% Sep-2017 204 +9.7% 245 +13.4% Oct-2017 248 +11.7% 331 +33.5% Nov-2017 198 -5.3% 234 -11.4% Dec-2017 108 -12.2% 190 +6.7% Jan-2018 87 -6.5% 176 +22.2% Feb-2018 156 +15.6% 227 +8.6% 12-Month Avg 190 +2.6% 246 +6.5% Historical Pending Sales by Month Current as ofMarch 11, 2018.All data from the San Francisco MLS. Report © 2018 ShowingTime. | 5 A count of the properties on which offers have been accepted in a given month. 124 227 135 209 156 227 Single Family Condo/TIC/Coop February 0 100 200 300 400 1-2005 1-2006 1-2007 1-2008 1-2009 1-2010 1-2011 1-2012 1-2013 1-2014 1-2015 1-2016 1-2017 1-2018 Single Family Condo/TIC/Coop 223 370 228 353 243 403 Single Family Condo/TIC/Coop Year to Date 2016 2017 2018 + 8.6%- 7.9%+ 15.6%+ 8.9% - 4.6%+ 6.6%+ 2.2% + 14.2% 2016 2017 2018 2016 2017 2018 2016 2017 2018 - 10.1% - 9.7% + 2.2%+ 6.6%
  • 6. Sold Listings Sold Listings Single Family Year-Over-Year Change Condo/TIC/ Coop Year-Over-Year Change Mar-2017 173 +9.5% 287 +14.3% Apr-2017 203 -2.9% 232 +4.5% May-2017 218 +9.0% 272 +5.4% Jun-2017 230 -6.5% 324 +20.9% Jul-2017 210 +4.0% 239 -4.0% Aug-2017 212 +11.0% 219 -15.4% Sep-2017 177 -0.6% 175 -25.2% Oct-2017 233 +2.6% 311 +31.8% Nov-2017 244 +18.4% 278 +5.7% Dec-2017 148 -26.0% 246 +3.4% Jan-2018 94 -11.3% 146 -2.7% Feb-2018 102 -8.1% 196 +24.8% 12-Month Avg 187 +0.4% 244 +5.0% Historical Sold Listings by Month Current as ofMarch 11, 2018.All data from the San Francisco MLS. Report © 2018 ShowingTime. | 6 A count of the actual sales that closed in a given month. 102 168 111 157 102 196 Single Family Condo/TIC/Coop February 0 100 200 300 400 1-2005 1-2006 1-2007 1-2008 1-2009 1-2010 1-2011 1-2012 1-2013 1-2014 1-2015 1-2016 1-2017 1-2018 Single Family Condo/TIC/Coop 206 317 217 307 196 342 Single Family Condo/TIC/Coop Year to Date 2016 2017 2018 + 24.8%- 6.5%- 8.1%+ 8.8% - 3.2%- 9.7%+ 5.3% + 11.4% 2016 2017 2018 2016 2017 2018 2016 2017 2018 - 20.9% - 13.8% - 0.6%+ 4.3%
  • 7. Median Sales Price Median Sales Price Single Family Year-Over-Year Change Condo/TIC/ Coop Year-Over-Year Change Mar-2017 $1,350,000 -0.2% $1,137,500 +3.9% Apr-2017 $1,380,000 0.0% $1,100,000 -4.3% May-2017 $1,475,000 +9.3% $1,169,044 +8.0% Jun-2017 $1,461,000 +9.8% $1,125,000 -4.3% Jul-2017 $1,400,000 +7.3% $1,150,000 +10.0% Aug-2017 $1,377,500 +10.2% $1,175,000 +10.8% Sep-2017 $1,320,000 +8.5% $1,095,000 +7.1% Oct-2017 $1,575,000 +12.5% $1,140,000 +0.2% Nov-2017 $1,492,500 +10.3% $1,237,500 +17.0% Dec-2017 $1,460,000 +12.2% $1,127,000 +11.5% Jan-2018 $1,330,000 +6.4% $1,095,000 +9.5% Feb-2018 $1,715,000 +32.9% $1,104,500 -6.8% 12-Month Avg* $1,430,000 +7.9% $1,145,000 +5.5% Historical Median Sales Price by Month * Median Sales Price for all properties from March 2017 through February 2018. This is not the average of the individual figures above. Current as ofMarch 11, 2018.All data from the San Francisco MLS. Report © 2018 ShowingTime. | 7 Point at which half of the sales sold for more and half sold for less, not accounting for seller concessions, in a given month. $1,390,000 $1,097,500 $1,290,000 $1,185,000 $1,715,000 $1,104,500 Single Family Condo/TIC/Coop February $400,000 $600,000 $800,000 $1,000,000 $1,200,000 $1,400,000 $1,600,000 $1,800,000 1-2005 1-2006 1-2007 1-2008 1-2009 1-2010 1-2011 1-2012 1-2013 1-2014 1-2015 1-2016 1-2017 1-2018 Single Family Condo/TIC/Coop $1,260,000 $1,090,000 $1,275,000 $1,100,000 $1,500,000 $1,095,000 Single Family Condo/TIC/Coop Year to Date 2016 2017 2018 - 6.8%+ 8.0%+ 32.9%- 7.2% + 0.9%+ 17.6%+ 1.2% - 0.5% 2016 2017 2018 2016 2017 2018 2016 2017 2018 + 24.7% + 16.7% + 10.7%- 0.2%
  • 8. Average Sales Price Avg. Sales Price Single Family Year-Over-Year Change Condo/TIC/ Coop Year-Over-Year Change Mar-2017 $1,891,127 +6.0% $1,282,583 +2.2% Apr-2017 $1,880,160 +6.3% $1,296,502 -5.2% May-2017 $1,835,738 +12.4% $1,346,544 +6.1% Jun-2017 $1,727,201 -1.4% $1,351,503 +10.9% Jul-2017 $1,738,803 +1.0% $1,242,939 +3.1% Aug-2017 $1,567,141 +2.0% $1,269,212 +3.3% Sep-2017 $1,611,232 +8.3% $1,217,415 +0.7% Oct-2017 $2,007,445 +0.4% $1,275,773 +0.9% Nov-2017 $1,754,366 -0.7% $1,386,511 +21.6% Dec-2017 $1,914,314 +15.4% $1,274,356 +1.9% Jan-2018 $1,733,452 +6.1% $1,316,439 +13.3% Feb-2018 $2,147,432 +27.5% $1,270,194 -6.5% 12-Month Avg* $1,804,793 +5.4% $1,298,451 +4.6% Historical Average Sales Price by Month * Avg. Sales Price for all properties from March 2017 through February 2018. This is not the average of the individual figures above. Current as ofMarch 11, 2018.All data from the San Francisco MLS. Report © 2018 ShowingTime. | 8 Average sales price for all closed sales, not accounting for seller concessions, in a given month. $1,611,354 $1,209,523 $1,684,181 $1,358,682 $2,147,432 $1,270,194 Single Family Condo/TIC/Coop February $500,000 $750,000 $1,000,000 $1,250,000 $1,500,000 $1,750,000 $2,000,000 $2,250,000 1-2005 1-2006 1-2007 1-2008 1-2009 1-2010 1-2011 1-2012 1-2013 1-2014 1-2015 1-2016 1-2017 1-2018 Single Family Condo/TIC/Coop $1,590,518 $1,190,565 $1,659,253 $1,262,501 $1,948,890 $1,289,936 Single Family Condo/TIC/Coop Year to Date 2016 2017 2018 - 6.5%+ 12.3%+ 27.5%+ 4.5% + 6.0%+ 17.5%+ 4.3% + 2.2% 2016 2017 2018 2016 2017 2018 2016 2017 2018 + 3.9% + 11.6% + 3.5%+ 0.4%
  • 9. Days on Market Until Sale Days on Market Single Family Year-Over-Year Change Condo/TIC/ Coop Year-Over-Year Change Mar-2017 31 +24.0% 32 +6.7% Apr-2017 26 -18.8% 32 -15.8% May-2017 24 -7.7% 33 0.0% Jun-2017 27 -6.9% 37 +5.7% Jul-2017 24 -25.0% 33 -15.4% Aug-2017 27 -18.2% 41 -10.9% Sep-2017 28 -31.7% 42 +5.0% Oct-2017 23 -14.8% 31 -8.8% Nov-2017 26 -31.6% 35 -12.5% Dec-2017 28 -31.7% 44 -8.3% Jan-2018 34 -19.0% 56 -5.1% Feb-2018 22 -35.3% 37 +2.8% 12-Month Avg* 26 -19.9% 37 -6.3% Historical Days on Market Until Sale by Month * Days on Market for all properties from March 2017 through February 2018. This is not the average of the individual figures above. Current as ofMarch 11, 2018.All data from the San Francisco MLS. Report © 2018 ShowingTime. | 9 Average number of days between when a property is listed and when an offer is accepted in a given month. 31 3534 36 22 37 Single Family Condo/TIC/Coop February 20 40 60 80 100 120 1-2005 1-2006 1-2007 1-2008 1-2009 1-2010 1-2011 1-2012 1-2013 1-2014 1-2015 1-2016 1-2017 1-2018 Single Family Condo/TIC/Coop 36 3938 47 28 45 Single Family Condo/TIC/Coop Year to Date 2016 2017 2018 + 2.8%+ 2.9%- 35.3%+ 9.7% + 20.5%- 26.3%+ 5.6% - 4.3% 2016 2017 2018 2016 2017 2018 2016 2017 2018 + 10.7% + 2.9% 0.0%+ 20.7%
  • 10. Inventory of Active Listings Active Listings Single Family Year-Over-Year Change Condo/TIC/ Coop Year-Over-Year Change Mar-2017 393 -12.3% 640 -2.9% Apr-2017 421 -13.4% 653 -10.3% May-2017 436 -6.6% 669 -10.8% Jun-2017 395 -10.6% 624 -22.8% Jul-2017 400 -13.6% 612 -15.6% Aug-2017 376 -9.6% 613 -10.9% Sep-2017 439 -17.3% 754 -9.2% Oct-2017 402 -18.0% 684 -15.1% Nov-2017 317 -17.2% 581 -2.7% Dec-2017 201 -22.7% 385 -6.8% Jan-2018 273 -15.5% 485 -14.0% Feb-2018 267 -25.6% 474 -25.7% 12-Month Avg* 360 -14.8% 598 -12.6% Historical Inventory of Active Listings by Month * Active Listings for all properties from March 2017 through February 2018. This is not the average of the individual figures above. Current as ofMarch 11, 2018.All data from the San Francisco MLS. Report © 2018 ShowingTime. | 10 The number of properties available for sale in active status at the end of a given month. 387 559 359 638 267 474 Single Family Condo/TIC/Coop February 0 200 400 600 800 1,000 1,200 1,400 1,600 1-2005 1-2006 1-2007 1-2008 1-2009 1-2010 1-2011 1-2012 1-2013 1-2014 1-2015 1-2016 1-2017 1-2018 Single Family Condo/TIC/Coop 2016 2017 2018 - 25.7%+ 14.1%- 25.6%- 7.2% 2016 2017 2018 + 6.6% + 27.9%
  • 11. % of Properties Sold Over List Price % of Properties Sold Over List Price Single Family Year-Over-Year Change Condo/TIC/ Coop Year-Over-Year Change Mar-2017 74.6% -9.4% 62.0% -8.4% Apr-2017 77.3% +2.2% 62.1% +2.8% May-2017 78.9% -0.8% 61.0% -9.5% Jun-2017 80.0% +11.1% 58.6% -6.5% Jul-2017 81.4% +6.8% 62.8% +7.2% Aug-2017 78.8% +3.8% 60.7% +21.9% Sep-2017 85.9% +10.8% 53.1% -9.2% Oct-2017 83.7% +6.1% 66.6% +23.8% Nov-2017 80.7% +10.9% 58.3% -7.6% Dec-2017 73.0% +5.8% 55.3% +30.4% Jan-2018 71.3% +14.4% 34.2% -11.6% Feb-2018 80.4% +2.6% 59.2% +3.3% 12-Month Avg 79.4% +5.5% 59.0% +2.7% Historical % of Properties Sold Over List Price by Month * % of Properties Sold Over List Price for all properties from March 2017 through February 2018. This is not the average of the individual figures above. Current as ofMarch 11, 2018.All data from the San Francisco MLS. Report © 2018 ShowingTime. | 11 Percentage found when dividing the number of properties sold by properties sold over its original list price, not accounting for seller concessions. 77.5% 58.3% 78.4% 57.3% 80.4% 59.2% Single Family Condo/TIC/Coop February 0.0% 20.0% 40.0% 60.0% 80.0% 100.0% 1-2005 1-2006 1-2007 1-2008 1-2009 1-2010 1-2011 1-2012 1-2013 1-2014 1-2015 1-2016 1-2017 1-2018 Single Family Condo/TIC/Coop 76.7% 55.8% 70.5% 48.2% 76.0% 48.5% Single Family Condo/TIC/Coop Year to Date 2016 2017 2018 + 3.3%- 1.7%+ 2.6%+ 1.2% - 13.6%+ 7.8%- 8.1% + 0.6% 2016 2017 2018 2016 2017 2018 2016 2017 2018 - 5.7% + 3.5% - 10.1%- 11.4%
  • 12. % of List Price Received % of List Price Received Single Family Year-Over-Year Change Condo/TIC/ Coop Year-Over-Year Change Mar-2017 112.4% -2.0% 104.9% -1.3% Apr-2017 115.4% +1.9% 105.1% -0.1% May-2017 115.3% +0.1% 105.4% -0.7% Jun-2017 116.8% +5.9% 105.8% +0.5% Jul-2017 117.1% +4.7% 106.0% +1.1% Aug-2017 115.5% +3.6% 105.7% +2.7% Sep-2017 116.3% +5.0% 104.8% +0.5% Oct-2017 115.6% +4.0% 106.6% +2.3% Nov-2017 115.5% +5.9% 104.5% -0.1% Dec-2017 114.2% +5.4% 103.8% +2.3% Jan-2018 112.4% +4.5% 101.8% +0.4% Feb-2018 115.9% +1.8% 105.2% +1.3% 12-Month Avg* 115.4% +3.5% 105.1% +0.8% Historical % of List Price Received by Month * % of List Price Received for all properties from March 2017 through February 2018. This is not the average of the individual figures above. Current as ofMarch 11, 2018.All data from the San Francisco MLS. Report © 2018 ShowingTime. | 12 Percentage found when dividing a property’s sales price by its most recent list price, then taking the average for all properties sold in a given month, not accounting for seller concessions. 112.6% 105.9% 113.8% 103.9% 115.9% 105.2% Single Family Condo/TIC/Coop February 111.8% 104.9% 110.8% 102.6% 114.2% 103.7% Single Family Condo/TIC/Coop Year to Date 95.0% 100.0% 105.0% 110.0% 115.0% 120.0% 1-2005 1-2006 1-2007 1-2008 1-2009 1-2010 1-2011 1-2012 1-2013 1-2014 1-2015 1-2016 1-2017 1-2018 Single Family Condo/TIC/Coop 2016 2017 2018 + 1.3%- 1.9%+ 1.8%+ 1.1% 2016 2017 2018 - 1.7% - 2.0% 2016 2017 2018 + 1.1%- 2.2%+ 3.1%- 0.9% 2016 2017 2018 + 0.3% - 1.5%
  • 13. Housing Affordability Ratio Affordability Ratio Single Family Year-Over-Year Change Condo/TIC/ Coop Year-Over-Year Change Mar-2017 37 -5.1% 51 -8.9% Apr-2017 37 -2.6% 54 +1.9% May-2017 35 -10.3% 51 -8.9% Jun-2017 35 -12.5% 53 0.0% Jul-2017 37 -9.8% 52 -11.9% Aug-2017 38 -11.6% 52 -11.9% Sep-2017 39 -11.4% 55 -9.8% Oct-2017 32 -17.9% 52 -7.1% Nov-2017 35 -7.9% 49 -12.5% Dec-2017 35 -7.9% 53 -5.4% Jan-2018 37 -5.1% 52 -7.1% Feb-2018 29 -25.6% 52 +6.1% 12-Month Avg* 36 -26.8% 40 -7.0% Historical Housing Affordability Ratio by Month * Affordability Ratio for all properties from March 2017 through February 2018. This is not the average of the individual figures above. Current as ofMarch 11, 2018.All data from the San Francisco MLS. Report © 2018 ShowingTime. | 13 This index measures housing affordability for the region. For example, an index of 120 means the median household income is 120% of what is necessary to qualify for the median-priced home under prevailing interest rates. A higher number means greater affordability. 38 56 39 49 29 52 Single Family Condo/TIC/Coop February 20 40 60 80 100 1-2005 1-2006 1-2007 1-2008 1-2009 1-2010 1-2011 1-2012 1-2013 1-2014 1-2015 1-2016 1-2017 1-2018 Single Family Condo/TIC/Coop 2016 2017 2018 + 6.1%- 12.5%- 25.6%+ 2.6% 2016 2017 2018 - 13.6% + 7.7% 42 56 39 53 33 52 Single Family Condo/TIC/Coop Year to Date 2016 2017 2018 - 1.9%- 5.4%- 15.4%- 7.1% 2016 2017 2018 - 8.7% - 3.4%
  • 14. Months Supply of Inventory Months Supply Single Family Year-Over-Year Change Condo/TIC/ Coop Year-Over-Year Change Mar-2017 2.1 -12.5% 2.7 -3.6% Apr-2017 2.3 -11.5% 2.8 -9.7% May-2017 2.4 -4.0% 2.8 -12.5% Jun-2017 2.1 -8.7% 2.6 -25.7% Jul-2017 2.1 -16.0% 2.6 -16.1% Aug-2017 2.0 -9.1% 2.6 -13.3% Sep-2017 2.3 -17.9% 3.2 -11.1% Oct-2017 2.1 -22.2% 2.8 -20.0% Nov-2017 1.7 -19.0% 2.4 -7.7% Dec-2017 1.1 -21.4% 1.6 -11.1% Jan-2018 1.4 -22.2% 2.0 -16.7% Feb-2018 1.4 -26.3% 1.9 -32.1% 12-Month Avg* 1.9 -15.1% 2.5 -14.9% Historical Months Supply of Inventory by Month * Months Supply for all properties from March 2017 through February 2018. This is not the average of the individual figures above. Current as ofMarch 11, 2018.All data from the San Francisco MLS. Report © 2018 ShowingTime. | 14 The inventory of homes for sale at the end of a given month, divided by the average monthly pending sales from the last 12 months. 2.0 2.3 1.9 2.8 1.4 1.9 Single Family Condo/TIC/Coop February 0.0 2.0 4.0 6.0 8.0 10.0 1-2005 1-2006 1-2007 1-2008 1-2009 1-2010 1-2011 1-2012 1-2013 1-2014 1-2015 1-2016 1-2017 1-2018 Single Family Condo/TIC/Coop 2016 2017 2018 - 32.1%+ 21.7%- 26.3%- 5.0% 2016 2017 2018 + 5.3% + 35.3%
  • 15. All Properties Activity Overview Key metrics by report month and for year-to-date (YTD) starting from the first of the year. Key Metrics Historical Sparkbars 2-2017 2-2018 Percent Change YTD 2017 YTD 2018 Percent Change - 10.8% Pending Sales 344 383 + 11.3% 581 646 + 11.2% New Listings 517 439 - 15.1% 1,023 913 Sold Listings 268 298 + 11.2% 524 538 + 2.7% Median Sales Price $1,215,764 $1,315,500 + 8.2% $1,175,000 $1,267,500 + 7.9% + 7.2% 39 - 9.3% $1,530,001 -- -- Days on Market 35 32 - 8.6% 43 Avg. Sales Price $1,493,497 $1,570,457 + 5.2% $1,426,805 Active Listings 997 741 - 25.7% -- % of Properties Sold Over List Price 66.0% 66.4% + 0.6% 57.4% 41 58.6% + 2.1% + 1.4% 38 - 7.3% 107.5%% of List Price Received 108.0% 108.8% + 0.7% 106.0% Current as ofMarch 11, 2018.All data from the San Francisco MLS. Report © 2018 ShowingTime. | 15 Months Supply 2.4 1.7 - 29.2% -- -- -- Affordability Ratio 39 37 - 5.1% 2-2015 2-2016 2-2017 2-2018 2-2015 2-2016 2-2017 2-2018 2-2015 2-2016 2-2017 2-2018 2-2015 2-2016 2-2017 2-2018 2-2015 2-2016 2-2017 2-2018 2-2015 2-2016 2-2017 2-2018 2-2015 2-2016 2-2017 2-2018 2-2015 2-2016 2-2017 2-2018 2-2015 2-2016 2-2017 2-2018 2-2015 2-2016 2-2017 2-2018 2-2015 2-2016 2-2017 2-2018
  • 16. Activity by District SF District 1: Northwest (Sea Cliff, Lake, Jordan Park / Laurel Heights, Outer Richmond, Central Richmond, Inner Richmond, Lone Mountain) SF District 2: Central West (Outer Sunset, Central Sunset, Inner Sunset, Outer Parkside, Parkside, Inner Parkside, Golden Gate Heights) SF District 3: Southwest (Pine Lake Park, Lake Shore, Merced Manor, Stonestown, Lakeside, Merced Heights, Ingleside, Ingleside Heights, Oceanview) SF District 4: Twin Peaks W (Forest Hill (& Ext), W Portal, St Francis Wd, Balboa Terr, Mt Dav Manor, Ingleside Terr, Monterey Hts, Wstwd Pk & H'lnds, Shrwd Fst, Miraloma Pk, Dmnd Hts, Mdtwn Terr) SF District 5: Central (Haight Ashbury, Cole Vly / Prnssus Hts, Clarndn Hts, Corona Hts, Twin Pks, Glen Pk, Noe Vly, Eureka Vly / Dolores Hts, Mission Dolores, Duboce Trngl, Buena Vista / Ashbury Hts) SF District 6: Central North (Lower Pacific Heights, Anza Vista, Western Addition, North Panhandle, Alamo Square, Hayes Valley) SF District 7: North (Marina, Cow Hollow, Presidio Heights, Pacific Heights) SF District 8: Northeast (North Waterfront, North Beach, Russian Hill, Telegraph Hill, Nob Hill, Financial District / Barbary Coast, Downtown, Van Ness / Civic Center, Tenderloin) SF District 9: Central East (Yerba Buena, South Beach, South of Market, Mission Bay, Inner Mission, Potrero Hill, Central Waterfront / Dogpatch, Bernal Heights) SF District 10: Southeast (Outer Mission, Mission Terr, Excelsior, Portola, Bayview, Silver Terr, Hunters Pt, Candlestick Pt, Bayview Hts, Little Hollywood, Visitation Vly, Crocker Amazon) 2-2017 2-2018 + / – 2-2017 2-2018 + / – 2-2017 2-2018 + / – 2-2017 2-2018 + / – 2-2017 2-2018 + / – Single Family 1 SF District 1 21 21 0.0% 5 9 +80.0% $2,025,000 $1,925,000 -4.9% 48 31 -35.4% 1.4 1.6 +14.3% 2 SF District 2 40 24 -40.0% 14 9 -35.7% $1,255,500 $1,410,000 +12.3% 25 6 -76.0% 1.2 0.7 -41.7% 3 SF District 3 15 14 -6.7% 7 6 -14.3% $920,000 $1,025,500 +11.5% 78 46 -41.0% 1.0 1.1 +10.0% 4 SF District 4 40 21 -47.5% 12 15 +25.0% $1,591,000 $1,850,000 +16.3% 22 14 -36.4% 1.5 0.8 -46.7% 5 SF District 5 64 48 -25.0% 22 20 -9.1% $2,305,000 $2,925,500 +26.9% 24 24 0.0% 2.4 1.8 -25.0% 6 SF District 6 7 6 -14.3% 3 3 0.0% $3,250,000 $2,215,000 -31.8% 9 33 +266.7% 2.3 1.8 -21.7% 7 SF District 7 29 30 +3.4% 2 5 +150.0% $6,755,000 $4,900,000 -27.5% 60 11 -81.7% 3.4 3.4 0.0% 8 SF District 8 12 11 -8.3% 1 1 0.0% $6,100,000 $4,995,000 -18.1% 170 72 -57.6% 6.0 4.3 -28.3% 9 SF District 9 52 37 -28.8% 18 13 -27.8% $1,287,500 $1,740,000 +35.1% 26 9 -65.4% 2.5 1.7 -32.0% 10 SF District 10 79 55 -30.4% 27 21 -22.2% $863,000 $1,080,000 +25.1% 40 29 -27.5% 2.3 1.3 -43.5% Condo/TIC/Coop 1 SF District 1 20 13 -35.0% 5 8 +60.0% $1,360,000 $1,268,500 -6.7% 8 17 +112.5% 1.8 1.2 -33.3% 2 SF District 2 7 6 -14.3% 0 5 -- $0 $1,370,000 -- 0 22 -- 1.8 1.9 +5.6% 3 SF District 3 11 7 -36.4% 4 1 -75.0% $900,000 $810,000 -10.0% 9 187 +1977.8% 2.8 2.7 -3.6% 4 SF District 4 7 8 +14.3% 2 4 +100.0% $645,000 $510,846 -20.8% 33 89 +169.7% 3.0 2.2 -26.7% 5 SF District 5 81 53 -34.6% 23 25 +8.7% $1,526,000 $1,500,000 -1.7% 22 27 +22.7% 2.4 1.5 -37.5% 6 SF District 6 67 51 -23.9% 15 22 +46.7% $1,350,000 $1,190,000 -11.9% 21 44 +109.5% 2.5 1.9 -24.0% 7 SF District 7 47 43 -8.5% 29 15 -48.3% $1,725,000 $1,650,000 -4.3% 41 20 -51.2% 1.7 1.7 0.0% 8 SF District 8 123 94 -23.6% 21 20 -4.8% $865,000 $1,241,500 +43.5% 49 48 -2.0% 3.2 2.3 -28.1% 9 SF District 9 252 181 -28.2% 53 85 +60.4% $988,000 $979,000 -0.9% 42 37 -11.9% 3.2 2.0 -37.5% 10 SF District 10 23 18 -21.7% 5 11 +120.0% $675,000 $638,500 -5.4% 34 48 +41.2% 3.4 2.0 -41.2% Key metrics by report month for the districts of San Fransisco. Current as ofMarch 11, 2018.All data from the San Francisco MLS. Report © 2018 ShowingTime. | 16 Active Listings Sold Listings Median Sales Price Days on Market Months Supply