SlideShare a Scribd company logo
1 of 16
Download to read offline
October 2018 Monthly Snapshot
One-Year Change in One-Year Change in
Median Sales Price
Single Family
Median Sales Price
Condo/TIC/Coop
2
3
4
5
6
7
8
9
10
11
12
13
14
15
16
Current as of November 11, 2018. All data from the San Francisco MLS. Report © 2018 ShowingTime.
Condo/TIC/Coop Activity Overview
Inventory of Active Listings
% of Properties Sold Over List Price
% of List Price Received
Housing Affordability Ratio
All Properties Activity Overview
New Listings
Pending Sales
Sold Listings
Median Sales Price
Average Sales Price
Days on Market Until Sale
Activity by District
Monthly Indicators
+ 1.6% + 7.3% + 7.5%
One-Year Change in
If the last few months are an indication of the temperature of housing markets
across the country, a period of relative calm can be expected during the last
three months of the year. A trend of market balance is emerging as we
approach the end of 2018. Prices are still rising in most areas, and the number
of homes for sale is still low, but there is a general shrinking of year-over-year
percentage change gaps in sales, inventory and prices.
New Listings were down 2.1 percent for single family homes and 9.7 percent for
Condo/TIC/Coop properties. Pending Sales increased 0.8 percent for single
family homes but decreased 14.2 percent for Condo/TIC/Coop properties.
The Median Sales Price was up 1.6 percent to $1,600,000 for single family
homes and 7.3 percent to $1,223,500 for Condo/TIC/Coop properties. Months
Supply of Inventory increased 13.6 percent for single family units and 3.4
percent for Condo/TIC/Coop units.
Stock markets experienced an October setback, but that does not necessarily
translate to a decline in the real estate market. The national unemployment rate
has been below 4.0 percent for three straight months and during five of the last
six months. This is exceptional news for industries related to real estate.
Meanwhile, homebuilder confidence remains positive, homeownership rates
have increased in the key under-35 buyer group and prices, though still rising,
have widely reduced the march toward record highs.
Median Sales Price
All Property Types
Residential real estate activity in San Francisco County (Districts 1-10),
comprised of single-family properties, townhomes and condominiums.
Percent changes are calculated using rounded figures.
Single Family Activity Overview
Months Supply of Inventory
Single Family Activity Overview
Key metrics by report month and for year-to-date (YTD) starting from the first of the year.
Key Metrics Historical Sparkbars 10-2017 10-2018 Percent Change YTD 2017 YTD 2018 Percent Change
+ 5.1%2,499
1,845 - 1.5%
$1,601,000 + 14.4%
+ 12.5%
Pending Sales 248 250 + 0.8% - 1.7%1,959 1,926
New Listings 239 234 - 2.1% 2,378
Sold Listings 233 244 + 4.7% 1,873
Median Sales Price $1,575,000 $1,600,000 + 1.6% $1,400,000
22 - 18.5%
$1,992,820
-- --
Days on Market 23 24 + 4.3% 27
Avg. Sales Price $2,007,445 $2,168,225 + 8.0% $1,770,768
Active Listings 412 469 + 13.8% --
% of Properties Sold Over List Price 83.7% 82.4% - 1.6% 79.0%
37
81.7% + 3.4%
+ 1.7%
28 - 24.3%
117.0%% of List Price Received 115.6% 114.0% - 1.4% 115.1%
Current as of November 11, 2018. All data from the San Francisco MLS. Report © 2018 ShowingTime. | 2
Months Supply 2.2 2.5 + 13.6% -- -- --
Affordability Ratio 32 28 - 12.5%
10-2015 10-2016 10-2017 10-2018
10-2015 10-2016 10-2017 10-2018
10-2015 10-2016 10-2017 10-2018
10-2015 10-2016 10-2017 10-2018
10-2015 10-2016 10-2017 10-2018
10-2015 10-2016 10-2017 10-2018
10-2015 10-2016 10-2017 10-2018
10-2015 10-2016 10-2017 10-2018
10-2015 10-2016 10-2017 10-2018
10-2015 10-2016 10-2017 10-2018
10-2015 10-2016 10-2017 10-2018
Condo/TIC/Coop Activity Overview
Key metrics by report month and for year-to-date (YTD) starting from the first of the year.
Key Metrics Historical Sparkbars 10-2017 10-2018 Percent Change YTD 2017 YTD 2018 Percent Change
+ 5.7%
Pending Sales 330 283 - 14.2% 2,474 2,604 + 5.3%
New Listings 329 297 - 9.7% 3,304 3,492
Sold Listings 311 288 - 7.4% 2,366 2,546 + 7.6%
Median Sales Price $1,140,000 $1,223,500 + 7.3% $1,125,000 $1,200,000 + 6.7%
+ 3.1%
31 - 13.9%
$1,327,038
-- --
Days on Market 31 27 - 12.9% 36
Avg. Sales Price $1,275,773 $1,348,944 + 5.7% $1,287,186
Active Listings 708 765 + 8.1% --
% of Properties Sold Over List Price 66.6% 67.7% + 1.7% 59.6%
53
62.3% + 4.5%
+ 1.6%
42 - 20.8%
106.9%% of List Price Received 106.6% 107.7% + 1.0% 105.2%
Current as of November 11, 2018. All data from the San Francisco MLS. Report © 2018 ShowingTime. | 3
Months Supply 2.9 3.0 + 3.4% -- -- --
Affordability Ratio 52 41 - 21.2%
10-2015 10-2016 10-2017 10-2018
10-2015 10-2016 10-2017 10-2018
10-2015 10-2016 10-2017 10-2018
10-2015 10-2016 10-2017 10-2018
10-2015 10-2016 10-2017 10-2018
10-2015 10-2016 10-2017 10-2018
10-2015 10-2016 10-2017 10-2018
10-2015 10-2016 10-2017 10-2018
10-2015 10-2016 10-2017 10-2018
10-2015 10-2016 10-2017 10-2018
10-2015 10-2016 10-2017 10-2018
New Listings
New Listings
Single
Family
Year-Over-Year
Change
Condo/TIC/
Coop
Year-Over-Year
Change
Nov-2017 145 +5.1% 209 +31.4%
Dec-2017 78 +11.4% 129 +7.5%
Jan-2018 188 +5.6% 356 +8.2%
Feb-2018 207 +10.7% 356 +7.9%
Mar-2018 276 -0.4% 378 +8.0%
Apr-2018 270 +9.3% 380 +33.3%
May-2018 272 -5.2% 367 +1.7%
Jun-2018 264 +10.9% 352 +12.5%
Jul-2018 235 +11.4% 259 -5.5%
Aug-2018 231 +8.5% 300 +2.0%
Sep-2018 322 +7.0% 447 +1.8%
Oct-2018 234 -2.1% 297 -9.7%
12-Month Avg 227 +5.3% 319 +6.9%
Historical New Listings by Month
Current as of November 11, 2018. All data from the San Francisco MLS. Report © 2018 ShowingTime. | 4
A count of the properties that have been newly listed on the market in a given month.
222
300
239
329
234
297
Single Family Condo/TIC/Coop
October
0
100
200
300
400
500
600
700
1-2005 1-2006 1-2007 1-2008 1-2009 1-2010 1-2011 1-2012 1-2013 1-2014 1-2015 1-2016 1-2017 1-2018
Single Family Condo/TIC/Coop
2,464
3,461
2,378
3,304
2,499
3,492
Single Family Condo/TIC/Coop
Year to Date
2016 2017 2018
- 9.7%+ 9.7%- 2.1%+ 7.7% - 4.5%+ 5.1%- 3.5% + 5.7%
2016 2017 2018 2016 2017 2018 2016 2017 2018
- 15.6% - 2.6% + 6.9%- 6.8%
Pending Sales
Pending Sales
Single
Family
Year-Over-Year
Change
Condo/TIC/
Coop
Year-Over-Year
Change
Nov-2017 198 -4.8% 234 -11.0%
Dec-2017 108 -12.2% 192 +7.9%
Jan-2018 87 -6.5% 180 +24.1%
Feb-2018 158 +17.0% 224 +7.2%
Mar-2018 216 +1.4% 336 +10.5%
Apr-2018 207 +4.5% 287 +27.6%
May-2018 274 +14.2% 298 -2.6%
Jun-2018 203 -18.5% 301 +3.8%
Jul-2018 165 -5.2% 246 +17.7%
Aug-2018 174 -15.1% 231 +9.0%
Sep-2018 192 -5.9% 218 -10.7%
Oct-2018 250 +0.8% 283 -14.2%
12-Month Avg 186 -2.5% 253 +3.9%
Historical Pending Sales by Month
Current as of November 11, 2018. All data from the San Francisco MLS. Report © 2018 ShowingTime. | 5
A count of the properties on which offers have been accepted in a given month.
222
248248
330
250
283
Single Family Condo/TIC/Coop
October
0
100
200
300
400
1-2005 1-2006 1-2007 1-2008 1-2009 1-2010 1-2011 1-2012 1-2013 1-2014 1-2015 1-2016 1-2017 1-2018
Single Family Condo/TIC/Coop
1,886
2,344
1,959
2,474
1,926
2,604
Single Family Condo/TIC/Coop
Year to Date
2016 2017 2018
- 14.2%+ 33.1%+ 0.8%+ 11.7% + 5.5%- 1.7%+ 3.9% + 5.3%
2016 2017 2018 2016 2017 2018 2016 2017 2018
- 16.5% - 6.3% - 6.0%- 12.4%
Sold Listings
Sold Listings
Single
Family
Year-Over-Year
Change
Condo/TIC/
Coop
Year-Over-Year
Change
Nov-2017 245 +18.9% 278 +5.7%
Dec-2017 149 -25.5% 250 +5.0%
Jan-2018 95 -10.4% 149 -0.7%
Feb-2018 107 -3.6% 201 +28.0%
Mar-2018 200 +15.6% 289 +0.7%
Apr-2018 191 -5.9% 295 +27.2%
May-2018 248 +13.8% 312 +14.7%
Jun-2018 231 +0.4% 302 -6.8%
Jul-2018 193 -8.1% 271 +13.4%
Aug-2018 190 -10.4% 258 +17.8%
Sep-2018 146 -17.5% 181 +3.4%
Oct-2018 244 +4.7% 288 -7.4%
12-Month Avg 187 -1.8% 256 +7.2%
Historical Sold Listings by Month
Current as of November 11, 2018. All data from the San Francisco MLS. Report © 2018 ShowingTime. | 6
A count of the actual sales that closed in a given month.
227 236233
311
244
288
Single Family Condo/TIC/Coop
October
0
100
200
300
400
1-2005 1-2006 1-2007 1-2008 1-2009 1-2010 1-2011 1-2012 1-2013 1-2014 1-2015 1-2016 1-2017 1-2018
Single Family Condo/TIC/Coop
1,817
2,294
1,873
2,366
1,845
2,546
Single Family Condo/TIC/Coop
Year to Date
2016 2017 2018
- 7.4%+ 31.8%+ 4.7%+ 2.6% + 3.1%- 1.5%+ 3.1% + 7.6%
2016 2017 2018 2016 2017 2018 2016 2017 2018
- 7.3% - 5.1% - 4.3%- 11.3%
Median Sales Price
Median Sales Price
Single
Family
Year-Over-Year
Change
Condo/TIC/
Coop
Year-Over-Year
Change
Nov-2017 $1,495,000 +10.5% $1,237,500 +17.0%
Dec-2017 $1,450,000 +11.4% $1,120,000 +10.8%
Jan-2018 $1,330,000 +6.4% $1,100,000 +10.0%
Feb-2018 $1,700,000 +31.8% $1,076,000 -9.2%
Mar-2018 $1,687,500 +25.0% $1,250,000 +9.9%
Apr-2018 $1,650,000 +19.6% $1,250,000 +13.6%
May-2018 $1,616,944 +9.6% $1,257,500 +7.6%
Jun-2018 $1,625,000 +11.2% $1,169,750 +4.0%
Jul-2018 $1,627,500 +16.3% $1,150,000 0.0%
Aug-2018 $1,550,000 +12.5% $1,234,400 +5.1%
Sep-2018 $1,500,000 +13.6% $1,150,000 +5.0%
Oct-2018 $1,600,000 +1.6% $1,223,500 +7.3%
12-Month Avg* $1,600,000 +15.9% $1,200,000 +8.6%
Historical Median Sales Price by Month
* Median Sales Price for all properties from November 2017 through October 2018. This is not the
average of the individual figures above.
Current as of November 11, 2018. All data from the San Francisco MLS. Report © 2018 ShowingTime. | 7
Point at which half of the sales sold for more and half sold for less, not accounting for seller concessions, in a given month.
$1,400,000
$1,137,500
$1,575,000
$1,140,000
$1,600,000
$1,223,500
Single Family Condo/TIC/Coop
October
$400,000
$600,000
$800,000
$1,000,000
$1,200,000
$1,400,000
$1,600,000
$1,800,000
1-2005 1-2006 1-2007 1-2008 1-2009 1-2010 1-2011 1-2012 1-2013 1-2014 1-2015 1-2016 1-2017 1-2018
Single Family Condo/TIC/Coop
$1,325,000
$1,096,618
$1,400,000
$1,125,000
$1,601,000
$1,200,000
Single Family Condo/TIC/Coop
Year to Date
2016 2017 2018
+ 7.3%+ 0.2%+ 1.6%+ 12.5% + 2.6%+ 14.4%+ 5.7% + 6.7%
2016 2017 2018 2016 2017 2018 2016 2017 2018
+ 10.2% + 6.0% + 2.0%+ 3.4%
Average Sales Price
Avg. Sales Price
Single
Family
Year-Over-Year
Change
Condo/TIC/
Coop
Year-Over-Year
Change
Nov-2017 $1,755,315 -0.7% $1,386,511 +21.6%
Dec-2017 $1,908,433 +15.1% $1,263,727 +1.1%
Jan-2018 $1,787,311 +9.4% $1,321,377 +13.7%
Feb-2018 $2,107,409 +25.1% $1,263,105 -7.0%
Mar-2018 $1,949,493 +3.1% $1,371,131 +6.9%
Apr-2018 $2,202,113 +17.1% $1,335,718 +3.0%
May-2018 $1,992,346 +8.5% $1,399,046 +3.9%
Jun-2018 $1,943,346 +12.5% $1,335,648 -1.2%
Jul-2018 $1,977,413 +13.7% $1,232,997 -0.8%
Aug-2018 $1,844,836 +17.7% $1,347,023 +6.1%
Sep-2018 $1,826,997 +13.4% $1,257,117 +3.2%
Oct-2018 $2,168,225 +8.0% $1,348,944 +5.7%
12-Month Avg* $1,961,215 +11.4% $1,327,268 +4.5%
Historical Average Sales Price by Month
* Avg. Sales Price for all properties from November 2017 through October 2018. This is not the
average of the individual figures above.
Current as of November 11, 2018. All data from the San Francisco MLS. Report © 2018 ShowingTime. | 8
Average sales price for all closed sales, not accounting for seller concessions, in a given month.
$2,000,319
$1,263,882
$2,007,445
$1,275,773
$2,168,225
$1,348,944
Single Family Condo/TIC/Coop
October
$500,000
$1,000,000
$1,500,000
$2,000,000
$2,500,000
1-2005 1-2006 1-2007 1-2008 1-2009 1-2010 1-2011 1-2012 1-2013 1-2014 1-2015 1-2016 1-2017 1-2018
Single Family Condo/TIC/Coop
$1,704,234
$1,242,414
$1,770,768
$1,287,186
$1,992,820
$1,327,038
Single Family Condo/TIC/Coop
Year to Date
2016 2017 2018
+ 5.7%+ 0.9%+ 8.0%+ 0.4% + 3.6%+ 12.5%+ 3.9% + 3.1%
2016 2017 2018 2016 2017 2018 2016 2017 2018
+ 22.9% + 3.9% + 0.2%+ 6.7%
Days on Market Until Sale
Days on Market
Single
Family
Year-Over-Year
Change
Condo/TIC/
Coop
Year-Over-Year
Change
Nov-2017 26 -31.6% 35 -12.5%
Dec-2017 28 -31.7% 45 -6.3%
Jan-2018 33 -21.4% 55 -6.8%
Feb-2018 22 -35.3% 37 +2.8%
Mar-2018 22 -29.0% 26 -18.8%
Apr-2018 18 -30.8% 26 -18.8%
May-2018 20 -16.7% 27 -18.2%
Jun-2018 18 -33.3% 27 -27.0%
Jul-2018 21 -12.5% 31 -6.1%
Aug-2018 22 -18.5% 36 -12.2%
Sep-2018 23 -17.9% 30 -28.6%
Oct-2018 24 +4.3% 27 -12.9%
12-Month Avg* 23 -23.3% 32 -13.9%
Historical Days on Market Until Sale by Month
* Days on Market for all properties from November 2017 through October 2018. This is not the
average of the individual figures above.
Current as of November 11, 2018. All data from the San Francisco MLS. Report © 2018 ShowingTime. | 9
Average number of days between when a property is listed and when an offer is accepted in a given month.
27
34
23
31
24
27
Single Family Condo/TIC/Coop
October
0
20
40
60
80
100
120
1-2005 1-2006 1-2007 1-2008 1-2009 1-2010 1-2011 1-2012 1-2013 1-2014 1-2015 1-2016 1-2017 1-2018
Single Family Condo/TIC/Coop
31
37
27
36
22
31
Single Family Condo/TIC/Coop
Year to Date
2016 2017 2018
- 12.9%- 8.8%+ 4.3%- 14.8% - 2.7%- 18.5%- 12.9% - 13.9%
2016 2017 2018 2016 2017 2018 2016 2017 2018
+ 3.8% + 14.8% + 23.3%+ 30.8%
Inventory of Active Listings
Active Listings
Single
Family
Year-Over-Year
Change
Condo/TIC/
Coop
Year-Over-Year
Change
Nov-2017 334 -13.2% 612 +2.3%
Dec-2017 229 -12.6% 424 +2.4%
Jan-2018 321 -1.5% 574 +1.6%
Feb-2018 354 -2.2% 663 +3.8%
Mar-2018 397 +0.3% 658 +2.3%
Apr-2018 434 +2.4% 709 +7.8%
May-2018 408 -7.1% 724 +7.4%
Jun-2018 431 +8.3% 704 +11.9%
Jul-2018 457 +13.1% 643 +4.0%
Aug-2018 465 +21.7% 646 +3.2%
Sep-2018 545 +22.2% 817 +5.6%
Oct-2018 469 +13.8% 765 +8.1%
12-Month Avg* 404 +4.5% 662 +5.2%
Historical Inventory of Active Listings by Month
* Active Listings for all properties from November 2017 through October 2018. This is not the
average of the individual figures above.
Current as of November 11, 2018. All data from the San Francisco MLS. Report © 2018 ShowingTime. | 10
The number of properties available for sale in active status at the end of a given month.
491
806
412
708
469
765
Single Family Condo/TIC/Coop
October
200
400
600
800
1,000
1,200
1,400
1,600
1-2005 1-2006 1-2007 1-2008 1-2009 1-2010 1-2011 1-2012 1-2013 1-2014 1-2015 1-2016 1-2017 1-2018
Single Family Condo/TIC/Coop
2016 2017 2018
+ 8.1%- 12.2%+ 13.8%- 16.1%
2016 2017 2018
+ 11.3% + 22.3%
% of Properties Sold Over List Price
% of Properties
Sold Over List Price
Single
Family
Year-Over-Year
Change
Condo/TIC/
Coop
Year-Over-Year
Change
Nov-2017 80.8% +11.0% 58.3% -7.6%
Dec-2017 73.2% +6.1% 54.4% +28.3%
Jan-2018 70.5% +13.2% 33.6% -13.2%
Feb-2018 80.4% +2.6% 58.7% +2.4%
Mar-2018 77.5% +3.9% 59.2% -4.5%
Apr-2018 77.5% +0.3% 66.8% +7.6%
May-2018 84.7% +7.4% 67.6% +10.8%
Jun-2018 88.3% +10.4% 68.2% +16.4%
Jul-2018 85.0% +4.4% 63.8% +1.6%
Aug-2018 81.1% +2.9% 57.8% -4.8%
Sep-2018 81.5% -5.1% 63.5% +19.6%
Oct-2018 82.4% -1.6% 67.7% +1.7%
12-Month Avg 81.1% +4.5% 61.3% +4.8%
Historical % of Properties Sold Over List Price by Month
* % of Properties Sold Over List Price for all properties from November 2017 through October
2018. This is not the average of the individual figures above.
Current as of November 11, 2018. All data from the San Francisco MLS. Report © 2018 ShowingTime. | 11
Percentage found when dividing the number of properties sold by properties sold over its original list price, not accounting for seller
concessions.
78.9%
53.8%
83.7%
66.6%
82.4%
67.7%
Single Family Condo/TIC/Coop
October
0.0%
20.0%
40.0%
60.0%
80.0%
100.0%
1-2005 1-2006 1-2007 1-2008 1-2009 1-2010 1-2011 1-2012 1-2013 1-2014 1-2015 1-2016 1-2017 1-2018
Single Family Condo/TIC/Coop
76.9%
59.3%
79.0%
59.6%
81.7%
62.3%
Single Family Condo/TIC/Coop
Year to Date
2016 2017 2018
+ 1.7%+ 23.8%- 1.6%+ 6.1% + 0.5%+ 3.4%+ 2.7% + 4.5%
2016 2017 2018 2016 2017 2018 2016 2017 2018
- 5.3% - 7.5% - 17.3%- 29.5%
% of List Price Received
% of List Price
Received
Single
Family
Year-Over-Year
Change
Condo/TIC/
Coop
Year-Over-Year
Change
Nov-2017 115.5% +5.9% 104.5% -0.1%
Dec-2017 114.3% +5.4% 103.8% +2.3%
Jan-2018 112.3% +4.4% 101.7% +0.3%
Feb-2018 115.8% +1.8% 105.1% +1.2%
Mar-2018 117.5% +4.5% 107.1% +2.1%
Apr-2018 119.2% +3.3% 108.9% +3.6%
May-2018 119.4% +3.6% 108.4% +2.8%
Jun-2018 120.1% +2.8% 107.3% +1.4%
Jul-2018 117.1% 0.0% 107.2% +1.1%
Aug-2018 114.9% -0.5% 105.7% 0.0%
Sep-2018 115.4% -0.8% 106.6% +1.7%
Oct-2018 114.0% -1.4% 107.7% +1.0%
12-Month Avg* 116.6% +2.3% 106.4% +1.5%
Historical % of List Price Received by Month
* % of List Price Received for all properties from November 2017 through October 2018. This is
not the average of the individual figures above.
Current as of November 11, 2018. All data from the San Francisco MLS. Report © 2018 ShowingTime. | 12
Percentage found when dividing a property’s sales price by its most recent list price, then taking the average for all properties sold in a given
month, not accounting for seller concessions.
111.2%
104.2%
115.6%
106.6%
114.0%
107.7%
Single Family Condo/TIC/Coop
October
112.2%
104.9%
115.1%
105.2%
117.0%
106.9%
Single Family Condo/TIC/Coop
Year to Date
90.0%
100.0%
110.0%
120.0%
130.0%
1-2005 1-2006 1-2007 1-2008 1-2009 1-2010 1-2011 1-2012 1-2013 1-2014 1-2015 1-2016 1-2017 1-2018
Single Family Condo/TIC/Coop
2016 2017 2018
+ 1.0%+ 2.3%- 1.4%+ 4.0%
2016 2017 2018
- 2.9% - 4.7%
2016 2017 2018
+ 1.6%+ 0.3%+ 1.7%+ 2.6%
2016 2017 2018
- 3.3% - 4.0%
Housing Affordability Ratio
Affordability Ratio
Single
Family
Year-Over-Year
Change
Condo/TIC/
Coop
Year-Over-Year
Change
Nov-2017 35 -7.9% 49 -12.5%
Dec-2017 35 -7.9% 53 -5.4%
Jan-2018 37 -5.1% 52 -7.1%
Feb-2018 29 -25.6% 53 +8.2%
Mar-2018 29 -21.6% 46 -9.8%
Apr-2018 29 -21.6% 45 -16.7%
May-2018 30 -14.3% 44 -13.7%
Jun-2018 30 -14.3% 48 -9.4%
Jul-2018 30 -18.9% 49 -5.8%
Aug-2018 31 -18.4% 45 -13.5%
Sep-2018 31 -20.5% 47 -14.5%
Oct-2018 28 -12.5% 41 -21.2%
12-Month Avg* 31 -24.5% 37 -23.0%
Historical Housing Affordability Ratio by Month
* Affordability Ratio for all properties from November 2017 through October 2018. This is not the
average of the individual figures above.
Current as of November 11, 2018. All data from the San Francisco MLS. Report © 2018 ShowingTime. | 13
This index measures housing affordability for the region. For example, an index of 120 means the median household income is 120% of what is
necessary to qualify for the median-priced home under prevailing interest rates. A higher number means greater affordability.
39
56
32
52
28
41
Single Family Condo/TIC/Coop
October
20
40
60
80
100
1-2005 1-2006 1-2007 1-2008 1-2009 1-2010 1-2011 1-2012 1-2013 1-2014 1-2015 1-2016 1-2017 1-2018
Single Family Condo/TIC/Coop
2016 2017 2018
- 21.2%- 7.1%- 12.5%- 17.9%
2016 2017 2018
+ 2.6% + 9.8%
41
58
37
53
28
42
Single Family Condo/TIC/Coop
Year to Date
2016 2017 2018
- 20.8%- 8.6%- 24.3%- 9.8%
2016 2017 2018
+ 5.1% + 9.4%
Months Supply of Inventory
Months Supply
Single
Family
Year-Over-Year
Change
Condo/TIC/
Coop
Year-Over-Year
Change
Nov-2017 1.8 -14.3% 2.5 -3.8%
Dec-2017 1.2 -14.3% 1.8 0.0%
Jan-2018 1.7 -5.6% 2.3 -4.2%
Feb-2018 1.9 -5.0% 2.7 -3.6%
Mar-2018 2.1 0.0% 2.6 -3.7%
Apr-2018 2.3 0.0% 2.8 0.0%
May-2018 2.1 -12.5% 2.9 +3.6%
Jun-2018 2.3 +9.5% 2.8 +7.7%
Jul-2018 2.4 +9.1% 2.5 -3.8%
Aug-2018 2.5 +25.0% 2.5 -7.4%
Sep-2018 2.9 +20.8% 3.2 -3.0%
Oct-2018 2.5 +13.6% 3.0 +3.4%
12-Month Avg* 2.1 +3.0% 2.6 -1.2%
Historical Months Supply of Inventory by Month
* Months Supply for all properties from November 2017 through October 2018. This is not the
average of the individual figures above.
Current as of November 11, 2018. All data from the San Francisco MLS. Report © 2018 ShowingTime. | 14
The inventory of homes for sale at the end of a given month, divided by the average monthly pending sales from the last 12 months.
2.7
3.5
2.2
2.9
2.5
3.0
Single Family Condo/TIC/Coop
October
0.0
2.0
4.0
6.0
8.0
10.0
1-2005 1-2006 1-2007 1-2008 1-2009 1-2010 1-2011 1-2012 1-2013 1-2014 1-2015 1-2016 1-2017 1-2018
Single Family Condo/TIC/Coop
2016 2017 2018
+ 3.4%- 17.1%+ 13.6%- 18.5%
2016 2017 2018
+ 22.7% + 29.6%
All Properties Activity Overview
Key metrics by report month and for year-to-date (YTD) starting from the first of the year.
Key Metrics Historical Sparkbars 10-2017 10-2018 Percent Change YTD 2017 YTD 2018 Percent Change
+ 5.4%
Pending Sales 578 533 - 7.8% 4,433 4,530 + 2.2%
New Listings 568 531 - 6.5% 5,682 5,991
Sold Listings 544 532 - 2.2% 4,239 4,391 + 3.6%
Median Sales Price $1,292,500 $1,389,000 + 7.5% $1,250,000 $1,355,000 + 8.4%
+ 7.1%
27 - 15.6%
$1,606,785
-- --
Days on Market 27 26 - 3.7% 32
Avg. Sales Price $1,589,155 $1,724,704 + 8.5% $1,500,856
Active Listings 1,120 1,234 + 10.2% --
% of Properties Sold Over List Price 73.9% 74.4% + 0.7% 68.2%
40
70.4% + 3.2%
+ 1.4%
32 - 20.0%
111.1%% of List Price Received 110.5% 110.6% + 0.1% 109.6%
Current as of November 11, 2018. All data from the San Francisco MLS. Report © 2018 ShowingTime. | 15
Months Supply 2.6 2.8 + 7.7% -- -- --
Affordability Ratio 38 29 - 23.7%
10-2015 10-2016 10-2017 10-2018
10-2015 10-2016 10-2017 10-2018
10-2015 10-2016 10-2017 10-2018
10-2015 10-2016 10-2017 10-2018
10-2015 10-2016 10-2017 10-2018
10-2015 10-2016 10-2017 10-2018
10-2015 10-2016 10-2017 10-2018
10-2015 10-2016 10-2017 10-2018
10-2015 10-2016 10-2017 10-2018
10-2015 10-2016 10-2017 10-2018
10-2015 10-2016 10-2017 10-2018
Activity by District
SF District 1: Northwest (Sea Cliff, Lake, Jordan Park / Laurel Heights, Outer Richmond, Central Richmond, Inner Richmond, Lone Mountain)
SF District 2: Central West (Outer Sunset, Central Sunset, Inner Sunset, Outer Parkside, Parkside, Inner Parkside, Golden Gate Heights)
SF District 3: Southwest (Pine Lake Park, Lake Shore, Merced Manor, Stonestown, Lakeside, Merced Heights, Ingleside, Ingleside Heights, Oceanview)
SF District 4: Twin Peaks W (Forest Hill (& Ext), W Portal, St Francis Wd, Balboa Terr, Mt Dav Manor, Ingleside Terr, Monterey Hts, Wstwd Pk & H'lnds, Shrwd Fst, Miraloma Pk, Dmnd Hts, Mdtwn Terr)
SF District 5: Central (Haight Ashbury, Cole Vly / Prnssus Hts, Clarndn Hts, Corona Hts, Twin Pks, Glen Pk, Noe Vly, Eureka Vly / Dolores Hts, Mission Dolores, Duboce Trngl, Buena Vista / Ashbury Hts)
SF District 6: Central North (Lower Pacific Heights, Anza Vista, Western Addition, North Panhandle, Alamo Square, Hayes Valley)
SF District 7: North (Marina, Cow Hollow, Presidio Heights, Pacific Heights)
SF District 8: Northeast (North Waterfront, North Beach, Russian Hill, Telegraph Hill, Nob Hill, Financial District / Barbary Coast, Downtown, Van Ness / Civic Center, Tenderloin)
SF District 9: Central East (Yerba Buena, South Beach, South of Market, Mission Bay, Inner Mission, Potrero Hill, Central Waterfront / Dogpatch, Bernal Heights)
SF District 10: Southeast (Outer Mission, Mission Terr, Excelsior, Portola, Bayview, Silver Terr, Hunters Pt, Candlestick Pt, Bayview Hts, Little Hollywood, Visitation Vly, Crocker Amazon)
10-2017 10-2018 + / – 10-2017 10-2018 + / – 10-2017 10-2018 + / – 10-2017 10-2018 + / – 10-2017 10-2018 + / –
Single Family
1 SF District 1 25 35 +40.0% 21 24 +14.3% $1,825,000 $2,140,000 +17.3% 19 25 +31.6% 1.8 2.3 +27.8%
2 SF District 2 40 57 +42.5% 32 33 +3.1% $1,495,000 $1,380,000 -7.7% 20 22 +10.0% 1.2 1.8 +50.0%
3 SF District 3 23 31 +34.8% 18 17 -5.6% $1,007,500 $1,156,000 +14.7% 34 35 +2.9% 1.6 2.5 +56.3%
4 SF District 4 48 62 +29.2% 30 39 +30.0% $1,642,500 $1,765,000 +7.5% 16 27 +68.8% 1.9 2.3 +21.1%
5 SF District 5 61 72 +18.0% 37 43 +16.2% $2,250,000 $2,500,000 +11.1% 23 19 -17.4% 2.2 2.7 +22.7%
6 SF District 6 15 13 -13.3% 6 4 -33.3% $2,563,000 $2,995,000 +16.9% 11 19 +72.7% 5.1 3.7 -27.5%
7 SF District 7 39 35 -10.3% 15 11 -26.7% $5,625,000 $6,150,000 +9.3% 26 26 0.0% 4.9 4.1 -16.3%
8 SF District 8 13 19 +46.2% 2 1 -50.0% $2,557,500 $16,000,000 +525.6% 16 168 +950.0% 5.3 7.1 +34.0%
9 SF District 9 53 59 +11.3% 28 27 -3.6% $1,652,500 $1,500,000 -9.2% 16 23 +43.8% 2.5 2.8 +12.0%
10 SF District 10 95 86 -9.5% 44 45 +2.3% $956,000 $1,150,000 +20.3% 30 22 -26.7% 2.3 2.3 0.0%
Condo/TIC/Coop
1 SF District 1 30 34 +13.3% 20 18 -10.0% $1,117,500 $1,275,000 +14.1% 30 17 -43.3% 3.1 2.4 -22.6%
2 SF District 2 6 10 +66.7% 3 10 +233.3% $1,100,000 $1,245,000 +13.2% 40 21 -47.5% 1.9 2.3 +21.1%
3 SF District 3 7 8 +14.3% 1 3 +200.0% $540,000 $788,000 +45.9% 19 30 +57.9% 2.3 2.7 +17.4%
4 SF District 4 16 13 -18.8% 2 8 +300.0% $515,565 $849,500 +64.8% 20 22 +10.0% 5.2 2.4 -53.8%
5 SF District 5 75 87 +16.0% 54 48 -11.1% $1,331,632 $1,384,250 +4.0% 20 21 +5.0% 2.1 2.3 +9.5%
6 SF District 6 91 67 -26.4% 16 27 +68.8% $1,215,000 $975,000 -19.8% 21 27 +28.6% 3.4 2.8 -17.6%
7 SF District 7 64 67 +4.7% 29 20 -31.0% $1,250,000 $1,414,000 +13.1% 17 24 +41.2% 2.3 2.7 +17.4%
8 SF District 8 126 172 +36.5% 56 47 -16.1% $1,112,500 $1,160,000 +4.3% 32 27 -15.6% 3.1 4.3 +38.7%
9 SF District 9 266 276 +3.8% 119 104 -12.6% $1,099,000 $1,252,500 +14.0% 38 32 -15.8% 3.1 3.0 -3.2%
10 SF District 10 27 31 +14.8% 11 3 -72.7% $730,000 $850,000 +16.4% 51 29 -43.1% 3.4 4.6 +35.3%
Key metrics by report month for the districts of San Fransisco.
Current as of November 11, 2018. All data from the San Francisco MLS. Report © 2018 ShowingTime. | 16
Active Listings Sold Listings Median Sales Price Days on Market Months Supply

More Related Content

What's hot

San Francisco market focus report June 2018
San Francisco market focus report June 2018San Francisco market focus report June 2018
San Francisco market focus report June 2018Ronny Budiutama
 
San Francisco Market Focus Report September 2018
San Francisco Market Focus Report September 2018San Francisco Market Focus Report September 2018
San Francisco Market Focus Report September 2018Ronny Budiutama
 
San Francisco Market Focus March 2018
San Francisco Market Focus March 2018San Francisco Market Focus March 2018
San Francisco Market Focus March 2018Ronny Budiutama
 
San Francisco Real Estate Housing Market December 2016
San Francisco Real Estate Housing Market December 2016San Francisco Real Estate Housing Market December 2016
San Francisco Real Estate Housing Market December 2016Ronny Budiutama
 
San Francisco Market Focus Report Aug 2018
San Francisco Market Focus Report Aug 2018San Francisco Market Focus Report Aug 2018
San Francisco Market Focus Report Aug 2018Ronny Budiutama
 
San Francisco Market Focus Report November 2018
San Francisco Market Focus Report November 2018San Francisco Market Focus Report November 2018
San Francisco Market Focus Report November 2018Ronny Budiutama
 
San Francisco Market Focus October 2017
San Francisco Market Focus October 2017San Francisco Market Focus October 2017
San Francisco Market Focus October 2017Ronny Budiutama
 
San Francisco Market Focus February 2018
San Francisco Market Focus February 2018San Francisco Market Focus February 2018
San Francisco Market Focus February 2018Ronny Budiutama
 
San Francisco Market Focus May 2013
San Francisco Market Focus May 2013San Francisco Market Focus May 2013
San Francisco Market Focus May 2013Ronny Budiutama
 
Gbar monthly-market-insights-report-november20
Gbar monthly-market-insights-report-november20Gbar monthly-market-insights-report-november20
Gbar monthly-market-insights-report-november20Joe Schutt
 
San Francisco Market Focus Report December 2018
San Francisco Market Focus Report December 2018San Francisco Market Focus Report December 2018
San Francisco Market Focus Report December 2018Ronny Budiutama
 
San Francisco Market Data October 2020
San Francisco Market Data October 2020San Francisco Market Data October 2020
San Francisco Market Data October 2020Ronny Budiutama
 
San Francisco Market Focus November 2017
San Francisco Market Focus November 2017San Francisco Market Focus November 2017
San Francisco Market Focus November 2017Ronny Budiutama
 
San Francisco Market Focus June 2014
San Francisco Market Focus June 2014San Francisco Market Focus June 2014
San Francisco Market Focus June 2014Ronny Budiutama
 
January 2018 San Francisco Market Update
January 2018 San Francisco Market UpdateJanuary 2018 San Francisco Market Update
January 2018 San Francisco Market UpdateRonny Budiutama
 
San Francisco Market Focus Report Nov 2020
San Francisco Market Focus Report Nov 2020San Francisco Market Focus Report Nov 2020
San Francisco Market Focus Report Nov 2020Ronny Budiutama
 
San Francisco Market Focus July 2017
San Francisco Market Focus July 2017San Francisco Market Focus July 2017
San Francisco Market Focus July 2017Ronny Budiutama
 
San Francisco Market Focus June 2013
San Francisco Market Focus June 2013San Francisco Market Focus June 2013
San Francisco Market Focus June 2013Ronny Budiutama
 
San Francisco Market Focus March 2017
San Francisco Market Focus March 2017San Francisco Market Focus March 2017
San Francisco Market Focus March 2017Ronny Budiutama
 
June 2018 Gallatin Valley Market Reports
June 2018 Gallatin Valley Market ReportsJune 2018 Gallatin Valley Market Reports
June 2018 Gallatin Valley Market ReportsReferred Realty Group
 

What's hot (20)

San Francisco market focus report June 2018
San Francisco market focus report June 2018San Francisco market focus report June 2018
San Francisco market focus report June 2018
 
San Francisco Market Focus Report September 2018
San Francisco Market Focus Report September 2018San Francisco Market Focus Report September 2018
San Francisco Market Focus Report September 2018
 
San Francisco Market Focus March 2018
San Francisco Market Focus March 2018San Francisco Market Focus March 2018
San Francisco Market Focus March 2018
 
San Francisco Real Estate Housing Market December 2016
San Francisco Real Estate Housing Market December 2016San Francisco Real Estate Housing Market December 2016
San Francisco Real Estate Housing Market December 2016
 
San Francisco Market Focus Report Aug 2018
San Francisco Market Focus Report Aug 2018San Francisco Market Focus Report Aug 2018
San Francisco Market Focus Report Aug 2018
 
San Francisco Market Focus Report November 2018
San Francisco Market Focus Report November 2018San Francisco Market Focus Report November 2018
San Francisco Market Focus Report November 2018
 
San Francisco Market Focus October 2017
San Francisco Market Focus October 2017San Francisco Market Focus October 2017
San Francisco Market Focus October 2017
 
San Francisco Market Focus February 2018
San Francisco Market Focus February 2018San Francisco Market Focus February 2018
San Francisco Market Focus February 2018
 
San Francisco Market Focus May 2013
San Francisco Market Focus May 2013San Francisco Market Focus May 2013
San Francisco Market Focus May 2013
 
Gbar monthly-market-insights-report-november20
Gbar monthly-market-insights-report-november20Gbar monthly-market-insights-report-november20
Gbar monthly-market-insights-report-november20
 
San Francisco Market Focus Report December 2018
San Francisco Market Focus Report December 2018San Francisco Market Focus Report December 2018
San Francisco Market Focus Report December 2018
 
San Francisco Market Data October 2020
San Francisco Market Data October 2020San Francisco Market Data October 2020
San Francisco Market Data October 2020
 
San Francisco Market Focus November 2017
San Francisco Market Focus November 2017San Francisco Market Focus November 2017
San Francisco Market Focus November 2017
 
San Francisco Market Focus June 2014
San Francisco Market Focus June 2014San Francisco Market Focus June 2014
San Francisco Market Focus June 2014
 
January 2018 San Francisco Market Update
January 2018 San Francisco Market UpdateJanuary 2018 San Francisco Market Update
January 2018 San Francisco Market Update
 
San Francisco Market Focus Report Nov 2020
San Francisco Market Focus Report Nov 2020San Francisco Market Focus Report Nov 2020
San Francisco Market Focus Report Nov 2020
 
San Francisco Market Focus July 2017
San Francisco Market Focus July 2017San Francisco Market Focus July 2017
San Francisco Market Focus July 2017
 
San Francisco Market Focus June 2013
San Francisco Market Focus June 2013San Francisco Market Focus June 2013
San Francisco Market Focus June 2013
 
San Francisco Market Focus March 2017
San Francisco Market Focus March 2017San Francisco Market Focus March 2017
San Francisco Market Focus March 2017
 
June 2018 Gallatin Valley Market Reports
June 2018 Gallatin Valley Market ReportsJune 2018 Gallatin Valley Market Reports
June 2018 Gallatin Valley Market Reports
 

Similar to SF October 2018 Monthly Snapshot

San Francisco Market Focus August 2017
San Francisco Market Focus August 2017San Francisco Market Focus August 2017
San Francisco Market Focus August 2017Ronny Budiutama
 
San Francisco Market Focus August 2017
San Francisco Market Focus August 2017San Francisco Market Focus August 2017
San Francisco Market Focus August 2017Ronny Budiutama
 
San Francisco market focus report December 2019
San Francisco market focus report December 2019San Francisco market focus report December 2019
San Francisco market focus report December 2019Ronny Budiutama
 
San Francisco Market Focus Report Jan 2019
San Francisco Market Focus Report Jan 2019San Francisco Market Focus Report Jan 2019
San Francisco Market Focus Report Jan 2019Ronny Budiutama
 
San Francisco Market Focus Report May 2019
San Francisco Market Focus Report May 2019San Francisco Market Focus Report May 2019
San Francisco Market Focus Report May 2019Ronny Budiutama
 
San Francisco Market Report September 2021
San Francisco Market Report September 2021San Francisco Market Report September 2021
San Francisco Market Report September 2021Ronny Budiutama
 
San Francisco Market Focus April 2016
San Francisco Market Focus April 2016San Francisco Market Focus April 2016
San Francisco Market Focus April 2016Ronny Budiutama
 
San Francisco November 2023 Market Report
San Francisco November 2023 Market ReportSan Francisco November 2023 Market Report
San Francisco November 2023 Market ReportRonny Budiutama
 
San Francisco market report September 2020
San Francisco market report September 2020San Francisco market report September 2020
San Francisco market report September 2020Ronny Budiutama
 
San Francisco Market Report March 2021
San Francisco Market Report March 2021San Francisco Market Report March 2021
San Francisco Market Report March 2021Ronny Budiutama
 
San Francisco Market Focus August 2016
San Francisco Market Focus August 2016San Francisco Market Focus August 2016
San Francisco Market Focus August 2016Ronny Budiutama
 
San Francisco Market Focus July 2015
San Francisco Market Focus July 2015San Francisco Market Focus July 2015
San Francisco Market Focus July 2015Ronny Budiutama
 
San Francisco January 2024 Market Report
San Francisco January 2024 Market ReportSan Francisco January 2024 Market Report
San Francisco January 2024 Market ReportRonny Budiutama
 
San Francisco market report July 2020
San Francisco market report July 2020San Francisco market report July 2020
San Francisco market report July 2020Ronny Budiutama
 
San Francisco Market Focus September 2015
San Francisco Market Focus September 2015San Francisco Market Focus September 2015
San Francisco Market Focus September 2015Ronny Budiutama
 

Similar to SF October 2018 Monthly Snapshot (15)

San Francisco Market Focus August 2017
San Francisco Market Focus August 2017San Francisco Market Focus August 2017
San Francisco Market Focus August 2017
 
San Francisco Market Focus August 2017
San Francisco Market Focus August 2017San Francisco Market Focus August 2017
San Francisco Market Focus August 2017
 
San Francisco market focus report December 2019
San Francisco market focus report December 2019San Francisco market focus report December 2019
San Francisco market focus report December 2019
 
San Francisco Market Focus Report Jan 2019
San Francisco Market Focus Report Jan 2019San Francisco Market Focus Report Jan 2019
San Francisco Market Focus Report Jan 2019
 
San Francisco Market Focus Report May 2019
San Francisco Market Focus Report May 2019San Francisco Market Focus Report May 2019
San Francisco Market Focus Report May 2019
 
San Francisco Market Report September 2021
San Francisco Market Report September 2021San Francisco Market Report September 2021
San Francisco Market Report September 2021
 
San Francisco Market Focus April 2016
San Francisco Market Focus April 2016San Francisco Market Focus April 2016
San Francisco Market Focus April 2016
 
San Francisco November 2023 Market Report
San Francisco November 2023 Market ReportSan Francisco November 2023 Market Report
San Francisco November 2023 Market Report
 
San Francisco market report September 2020
San Francisco market report September 2020San Francisco market report September 2020
San Francisco market report September 2020
 
San Francisco Market Report March 2021
San Francisco Market Report March 2021San Francisco Market Report March 2021
San Francisco Market Report March 2021
 
San Francisco Market Focus August 2016
San Francisco Market Focus August 2016San Francisco Market Focus August 2016
San Francisco Market Focus August 2016
 
San Francisco Market Focus July 2015
San Francisco Market Focus July 2015San Francisco Market Focus July 2015
San Francisco Market Focus July 2015
 
San Francisco January 2024 Market Report
San Francisco January 2024 Market ReportSan Francisco January 2024 Market Report
San Francisco January 2024 Market Report
 
San Francisco market report July 2020
San Francisco market report July 2020San Francisco market report July 2020
San Francisco market report July 2020
 
San Francisco Market Focus September 2015
San Francisco Market Focus September 2015San Francisco Market Focus September 2015
San Francisco Market Focus September 2015
 

More from Ronny Budiutama

San Francisco December 2023 Market Report
San Francisco December 2023 Market ReportSan Francisco December 2023 Market Report
San Francisco December 2023 Market ReportRonny Budiutama
 
2023 Annual San Francisco Housing Market
2023 Annual San Francisco Housing Market2023 Annual San Francisco Housing Market
2023 Annual San Francisco Housing MarketRonny Budiutama
 
October 2023 Report: San Francisco Real Estate Market Insights
October 2023 Report: San Francisco Real Estate Market InsightsOctober 2023 Report: San Francisco Real Estate Market Insights
October 2023 Report: San Francisco Real Estate Market InsightsRonny Budiutama
 
CA Weekly MLS Market Data Report - August 2023
CA Weekly MLS Market Data Report - August 2023CA Weekly MLS Market Data Report - August 2023
CA Weekly MLS Market Data Report - August 2023Ronny Budiutama
 
San Francisco Market Report July 2023.pdf
San Francisco Market Report July 2023.pdfSan Francisco Market Report July 2023.pdf
San Francisco Market Report July 2023.pdfRonny Budiutama
 
San Francisco May 2023 Market Report.pdf
San Francisco May 2023 Market Report.pdfSan Francisco May 2023 Market Report.pdf
San Francisco May 2023 Market Report.pdfRonny Budiutama
 
San Francisco June 2023 Market Report.pdf
San Francisco June 2023 Market Report.pdfSan Francisco June 2023 Market Report.pdf
San Francisco June 2023 Market Report.pdfRonny Budiutama
 
San Francisco Market Report March 2023.pdf
San Francisco Market Report March 2023.pdfSan Francisco Market Report March 2023.pdf
San Francisco Market Report March 2023.pdfRonny Budiutama
 
San Francisco Market Report February 2023
San Francisco Market Report February 2023San Francisco Market Report February 2023
San Francisco Market Report February 2023Ronny Budiutama
 
San Francisco Market Report January 2023.pdf
San Francisco Market Report January 2023.pdfSan Francisco Market Report January 2023.pdf
San Francisco Market Report January 2023.pdfRonny Budiutama
 
Annual Report on the San Francisco County Housing Market.pdf
Annual Report on the San Francisco County Housing Market.pdfAnnual Report on the San Francisco County Housing Market.pdf
Annual Report on the San Francisco County Housing Market.pdfRonny Budiutama
 
San Francisco Market Report December 2022.pdf
San Francisco Market Report December 2022.pdfSan Francisco Market Report December 2022.pdf
San Francisco Market Report December 2022.pdfRonny Budiutama
 
San Francisco Market Report November 2022.pdf
San Francisco Market Report November 2022.pdfSan Francisco Market Report November 2022.pdf
San Francisco Market Report November 2022.pdfRonny Budiutama
 
San Francisco Market Report October 2022.pdf
San Francisco Market Report October 2022.pdfSan Francisco Market Report October 2022.pdf
San Francisco Market Report October 2022.pdfRonny Budiutama
 
San Francisco Market Report September 2022.pdf
San Francisco Market Report September 2022.pdfSan Francisco Market Report September 2022.pdf
San Francisco Market Report September 2022.pdfRonny Budiutama
 
San Francisco Market Report August 2022.pdf
San Francisco Market Report August 2022.pdfSan Francisco Market Report August 2022.pdf
San Francisco Market Report August 2022.pdfRonny Budiutama
 
San Francisco Market Report July 2022.pdf
San Francisco Market Report July 2022.pdfSan Francisco Market Report July 2022.pdf
San Francisco Market Report July 2022.pdfRonny Budiutama
 
San Francisco Market Report June 2022.pdf
San Francisco Market Report June 2022.pdfSan Francisco Market Report June 2022.pdf
San Francisco Market Report June 2022.pdfRonny Budiutama
 
San Francisco Market Report May 2022.
San Francisco Market Report May 2022.San Francisco Market Report May 2022.
San Francisco Market Report May 2022.Ronny Budiutama
 
San Francisco Market Report April 2022.pdf
San Francisco Market Report April 2022.pdfSan Francisco Market Report April 2022.pdf
San Francisco Market Report April 2022.pdfRonny Budiutama
 

More from Ronny Budiutama (20)

San Francisco December 2023 Market Report
San Francisco December 2023 Market ReportSan Francisco December 2023 Market Report
San Francisco December 2023 Market Report
 
2023 Annual San Francisco Housing Market
2023 Annual San Francisco Housing Market2023 Annual San Francisco Housing Market
2023 Annual San Francisco Housing Market
 
October 2023 Report: San Francisco Real Estate Market Insights
October 2023 Report: San Francisco Real Estate Market InsightsOctober 2023 Report: San Francisco Real Estate Market Insights
October 2023 Report: San Francisco Real Estate Market Insights
 
CA Weekly MLS Market Data Report - August 2023
CA Weekly MLS Market Data Report - August 2023CA Weekly MLS Market Data Report - August 2023
CA Weekly MLS Market Data Report - August 2023
 
San Francisco Market Report July 2023.pdf
San Francisco Market Report July 2023.pdfSan Francisco Market Report July 2023.pdf
San Francisco Market Report July 2023.pdf
 
San Francisco May 2023 Market Report.pdf
San Francisco May 2023 Market Report.pdfSan Francisco May 2023 Market Report.pdf
San Francisco May 2023 Market Report.pdf
 
San Francisco June 2023 Market Report.pdf
San Francisco June 2023 Market Report.pdfSan Francisco June 2023 Market Report.pdf
San Francisco June 2023 Market Report.pdf
 
San Francisco Market Report March 2023.pdf
San Francisco Market Report March 2023.pdfSan Francisco Market Report March 2023.pdf
San Francisco Market Report March 2023.pdf
 
San Francisco Market Report February 2023
San Francisco Market Report February 2023San Francisco Market Report February 2023
San Francisco Market Report February 2023
 
San Francisco Market Report January 2023.pdf
San Francisco Market Report January 2023.pdfSan Francisco Market Report January 2023.pdf
San Francisco Market Report January 2023.pdf
 
Annual Report on the San Francisco County Housing Market.pdf
Annual Report on the San Francisco County Housing Market.pdfAnnual Report on the San Francisco County Housing Market.pdf
Annual Report on the San Francisco County Housing Market.pdf
 
San Francisco Market Report December 2022.pdf
San Francisco Market Report December 2022.pdfSan Francisco Market Report December 2022.pdf
San Francisco Market Report December 2022.pdf
 
San Francisco Market Report November 2022.pdf
San Francisco Market Report November 2022.pdfSan Francisco Market Report November 2022.pdf
San Francisco Market Report November 2022.pdf
 
San Francisco Market Report October 2022.pdf
San Francisco Market Report October 2022.pdfSan Francisco Market Report October 2022.pdf
San Francisco Market Report October 2022.pdf
 
San Francisco Market Report September 2022.pdf
San Francisco Market Report September 2022.pdfSan Francisco Market Report September 2022.pdf
San Francisco Market Report September 2022.pdf
 
San Francisco Market Report August 2022.pdf
San Francisco Market Report August 2022.pdfSan Francisco Market Report August 2022.pdf
San Francisco Market Report August 2022.pdf
 
San Francisco Market Report July 2022.pdf
San Francisco Market Report July 2022.pdfSan Francisco Market Report July 2022.pdf
San Francisco Market Report July 2022.pdf
 
San Francisco Market Report June 2022.pdf
San Francisco Market Report June 2022.pdfSan Francisco Market Report June 2022.pdf
San Francisco Market Report June 2022.pdf
 
San Francisco Market Report May 2022.
San Francisco Market Report May 2022.San Francisco Market Report May 2022.
San Francisco Market Report May 2022.
 
San Francisco Market Report April 2022.pdf
San Francisco Market Report April 2022.pdfSan Francisco Market Report April 2022.pdf
San Francisco Market Report April 2022.pdf
 

Recently uploaded

Call Girls in Model Town Delhi 💯Call Us 🔝8264348440🔝
Call Girls in Model Town Delhi 💯Call Us 🔝8264348440🔝Call Girls in Model Town Delhi 💯Call Us 🔝8264348440🔝
Call Girls in Model Town Delhi 💯Call Us 🔝8264348440🔝soniya singh
 
Call Girls In Mayur Vihar-1 Delhi ❤️8860477959 Good Looking Escorts In 24/7 D...
Call Girls In Mayur Vihar-1 Delhi ❤️8860477959 Good Looking Escorts In 24/7 D...Call Girls In Mayur Vihar-1 Delhi ❤️8860477959 Good Looking Escorts In 24/7 D...
Call Girls In Mayur Vihar-1 Delhi ❤️8860477959 Good Looking Escorts In 24/7 D...lizamodels9
 
Listing Turkey Sylvana Istanbul - Bahcesehir
Listing Turkey Sylvana Istanbul - BahcesehirListing Turkey Sylvana Istanbul - Bahcesehir
Listing Turkey Sylvana Istanbul - BahcesehirListing Turkey
 
Call Girls in Pitampura Delhi 💯Call Us 🔝8264348440🔝
Call Girls in Pitampura Delhi 💯Call Us 🔝8264348440🔝Call Girls in Pitampura Delhi 💯Call Us 🔝8264348440🔝
Call Girls in Pitampura Delhi 💯Call Us 🔝8264348440🔝soniya singh
 
Call Girls In Madipur Metro Delhi꧁ +91)8447779280꧂Low Rate 2 short 2000 full ...
Call Girls In Madipur Metro Delhi꧁ +91)8447779280꧂Low Rate 2 short 2000 full ...Call Girls In Madipur Metro Delhi꧁ +91)8447779280꧂Low Rate 2 short 2000 full ...
Call Girls In Madipur Metro Delhi꧁ +91)8447779280꧂Low Rate 2 short 2000 full ...asmaqueen5
 
call girls in Shahdara (DELHI) 🔝 >༒9953330565🔝 genuine Escort Service 🔝✔️✔️
call girls in Shahdara (DELHI) 🔝 >༒9953330565🔝 genuine Escort Service 🔝✔️✔️call girls in Shahdara (DELHI) 🔝 >༒9953330565🔝 genuine Escort Service 🔝✔️✔️
call girls in Shahdara (DELHI) 🔝 >༒9953330565🔝 genuine Escort Service 🔝✔️✔️9953056974 Low Rate Call Girls In Saket, Delhi NCR
 
Namrata 7 Plumeria Drive Pimpri Chinchwad Pune Brochure.pdf
Namrata 7 Plumeria Drive Pimpri Chinchwad Pune Brochure.pdfNamrata 7 Plumeria Drive Pimpri Chinchwad Pune Brochure.pdf
Namrata 7 Plumeria Drive Pimpri Chinchwad Pune Brochure.pdfPrachiRudram
 
Purva Palm Hills Devanahalli, Bangalore E- Brochure.pdf
Purva Palm Hills Devanahalli, Bangalore E- Brochure.pdfPurva Palm Hills Devanahalli, Bangalore E- Brochure.pdf
Purva Palm Hills Devanahalli, Bangalore E- Brochure.pdffaheemali990101
 
9990771857 Call Girls in Noida Sector 10 Noida (Call Girls) Delhi
9990771857 Call Girls in Noida Sector 10 Noida (Call Girls) Delhi9990771857 Call Girls in Noida Sector 10 Noida (Call Girls) Delhi
9990771857 Call Girls in Noida Sector 10 Noida (Call Girls) Delhidelhimodel235
 
9990771857 Call Girls in Noida Sector 06 Noida (Call Girls) Delhi
9990771857 Call Girls in Noida Sector 06 Noida (Call Girls) Delhi9990771857 Call Girls in Noida Sector 06 Noida (Call Girls) Delhi
9990771857 Call Girls in Noida Sector 06 Noida (Call Girls) Delhidelhimodel235
 
Call Girls in Kashmiri Gate Delhi 💯Call Us 🔝8264348440🔝
Call Girls in Kashmiri Gate Delhi 💯Call Us 🔝8264348440🔝Call Girls in Kashmiri Gate Delhi 💯Call Us 🔝8264348440🔝
Call Girls in Kashmiri Gate Delhi 💯Call Us 🔝8264348440🔝soniya singh
 
9990771857 Call Girls in Noida Sector 03 Noida (Call Girls) Delhi
9990771857 Call Girls in Noida Sector 03 Noida (Call Girls) Delhi9990771857 Call Girls in Noida Sector 03 Noida (Call Girls) Delhi
9990771857 Call Girls in Noida Sector 03 Noida (Call Girls) Delhidelhimodel235
 
Call Girls in Inderpuri Delhi 💯Call Us 🔝8264348440🔝
Call Girls in Inderpuri Delhi 💯Call Us 🔝8264348440🔝Call Girls in Inderpuri Delhi 💯Call Us 🔝8264348440🔝
Call Girls in Inderpuri Delhi 💯Call Us 🔝8264348440🔝soniya singh
 
What Is Biophilic Design .pdf
What Is Biophilic Design            .pdfWhat Is Biophilic Design            .pdf
What Is Biophilic Design .pdfyamunaNMH
 
Call Girls in Sarai Kale Khan Delhi 💯Call Us 🔝8264348440🔝
Call Girls in Sarai Kale Khan Delhi 💯Call Us 🔝8264348440🔝Call Girls in Sarai Kale Khan Delhi 💯Call Us 🔝8264348440🔝
Call Girls in Sarai Kale Khan Delhi 💯Call Us 🔝8264348440🔝soniya singh
 
Sobha Aranya Sector 80 Gurgaon E- Brochure.pdf
Sobha Aranya Sector 80 Gurgaon E- Brochure.pdfSobha Aranya Sector 80 Gurgaon E- Brochure.pdf
Sobha Aranya Sector 80 Gurgaon E- Brochure.pdffaheemali990101
 
Omaxe Dwarka In Delhi E Brochure Pdf
Omaxe Dwarka In Delhi E Brochure     PdfOmaxe Dwarka In Delhi E Brochure     Pdf
Omaxe Dwarka In Delhi E Brochure Pdfashiyadav24
 
SVN Live 4.22.24 Weekly Property Broadcast
SVN Live 4.22.24 Weekly Property BroadcastSVN Live 4.22.24 Weekly Property Broadcast
SVN Live 4.22.24 Weekly Property BroadcastSVN International Corp.
 
Eco-Efficient Living: Redefining Sustainability through Leech's Green Design ...
Eco-Efficient Living: Redefining Sustainability through Leech's Green Design ...Eco-Efficient Living: Redefining Sustainability through Leech's Green Design ...
Eco-Efficient Living: Redefining Sustainability through Leech's Green Design ...Newman George Leech
 
Shapoorji Pallonji Parkwest Sequoia Tower Bangalore.pdf
Shapoorji Pallonji Parkwest Sequoia Tower Bangalore.pdfShapoorji Pallonji Parkwest Sequoia Tower Bangalore.pdf
Shapoorji Pallonji Parkwest Sequoia Tower Bangalore.pdfashiyadav24
 

Recently uploaded (20)

Call Girls in Model Town Delhi 💯Call Us 🔝8264348440🔝
Call Girls in Model Town Delhi 💯Call Us 🔝8264348440🔝Call Girls in Model Town Delhi 💯Call Us 🔝8264348440🔝
Call Girls in Model Town Delhi 💯Call Us 🔝8264348440🔝
 
Call Girls In Mayur Vihar-1 Delhi ❤️8860477959 Good Looking Escorts In 24/7 D...
Call Girls In Mayur Vihar-1 Delhi ❤️8860477959 Good Looking Escorts In 24/7 D...Call Girls In Mayur Vihar-1 Delhi ❤️8860477959 Good Looking Escorts In 24/7 D...
Call Girls In Mayur Vihar-1 Delhi ❤️8860477959 Good Looking Escorts In 24/7 D...
 
Listing Turkey Sylvana Istanbul - Bahcesehir
Listing Turkey Sylvana Istanbul - BahcesehirListing Turkey Sylvana Istanbul - Bahcesehir
Listing Turkey Sylvana Istanbul - Bahcesehir
 
Call Girls in Pitampura Delhi 💯Call Us 🔝8264348440🔝
Call Girls in Pitampura Delhi 💯Call Us 🔝8264348440🔝Call Girls in Pitampura Delhi 💯Call Us 🔝8264348440🔝
Call Girls in Pitampura Delhi 💯Call Us 🔝8264348440🔝
 
Call Girls In Madipur Metro Delhi꧁ +91)8447779280꧂Low Rate 2 short 2000 full ...
Call Girls In Madipur Metro Delhi꧁ +91)8447779280꧂Low Rate 2 short 2000 full ...Call Girls In Madipur Metro Delhi꧁ +91)8447779280꧂Low Rate 2 short 2000 full ...
Call Girls In Madipur Metro Delhi꧁ +91)8447779280꧂Low Rate 2 short 2000 full ...
 
call girls in Shahdara (DELHI) 🔝 >༒9953330565🔝 genuine Escort Service 🔝✔️✔️
call girls in Shahdara (DELHI) 🔝 >༒9953330565🔝 genuine Escort Service 🔝✔️✔️call girls in Shahdara (DELHI) 🔝 >༒9953330565🔝 genuine Escort Service 🔝✔️✔️
call girls in Shahdara (DELHI) 🔝 >༒9953330565🔝 genuine Escort Service 🔝✔️✔️
 
Namrata 7 Plumeria Drive Pimpri Chinchwad Pune Brochure.pdf
Namrata 7 Plumeria Drive Pimpri Chinchwad Pune Brochure.pdfNamrata 7 Plumeria Drive Pimpri Chinchwad Pune Brochure.pdf
Namrata 7 Plumeria Drive Pimpri Chinchwad Pune Brochure.pdf
 
Purva Palm Hills Devanahalli, Bangalore E- Brochure.pdf
Purva Palm Hills Devanahalli, Bangalore E- Brochure.pdfPurva Palm Hills Devanahalli, Bangalore E- Brochure.pdf
Purva Palm Hills Devanahalli, Bangalore E- Brochure.pdf
 
9990771857 Call Girls in Noida Sector 10 Noida (Call Girls) Delhi
9990771857 Call Girls in Noida Sector 10 Noida (Call Girls) Delhi9990771857 Call Girls in Noida Sector 10 Noida (Call Girls) Delhi
9990771857 Call Girls in Noida Sector 10 Noida (Call Girls) Delhi
 
9990771857 Call Girls in Noida Sector 06 Noida (Call Girls) Delhi
9990771857 Call Girls in Noida Sector 06 Noida (Call Girls) Delhi9990771857 Call Girls in Noida Sector 06 Noida (Call Girls) Delhi
9990771857 Call Girls in Noida Sector 06 Noida (Call Girls) Delhi
 
Call Girls in Kashmiri Gate Delhi 💯Call Us 🔝8264348440🔝
Call Girls in Kashmiri Gate Delhi 💯Call Us 🔝8264348440🔝Call Girls in Kashmiri Gate Delhi 💯Call Us 🔝8264348440🔝
Call Girls in Kashmiri Gate Delhi 💯Call Us 🔝8264348440🔝
 
9990771857 Call Girls in Noida Sector 03 Noida (Call Girls) Delhi
9990771857 Call Girls in Noida Sector 03 Noida (Call Girls) Delhi9990771857 Call Girls in Noida Sector 03 Noida (Call Girls) Delhi
9990771857 Call Girls in Noida Sector 03 Noida (Call Girls) Delhi
 
Call Girls in Inderpuri Delhi 💯Call Us 🔝8264348440🔝
Call Girls in Inderpuri Delhi 💯Call Us 🔝8264348440🔝Call Girls in Inderpuri Delhi 💯Call Us 🔝8264348440🔝
Call Girls in Inderpuri Delhi 💯Call Us 🔝8264348440🔝
 
What Is Biophilic Design .pdf
What Is Biophilic Design            .pdfWhat Is Biophilic Design            .pdf
What Is Biophilic Design .pdf
 
Call Girls in Sarai Kale Khan Delhi 💯Call Us 🔝8264348440🔝
Call Girls in Sarai Kale Khan Delhi 💯Call Us 🔝8264348440🔝Call Girls in Sarai Kale Khan Delhi 💯Call Us 🔝8264348440🔝
Call Girls in Sarai Kale Khan Delhi 💯Call Us 🔝8264348440🔝
 
Sobha Aranya Sector 80 Gurgaon E- Brochure.pdf
Sobha Aranya Sector 80 Gurgaon E- Brochure.pdfSobha Aranya Sector 80 Gurgaon E- Brochure.pdf
Sobha Aranya Sector 80 Gurgaon E- Brochure.pdf
 
Omaxe Dwarka In Delhi E Brochure Pdf
Omaxe Dwarka In Delhi E Brochure     PdfOmaxe Dwarka In Delhi E Brochure     Pdf
Omaxe Dwarka In Delhi E Brochure Pdf
 
SVN Live 4.22.24 Weekly Property Broadcast
SVN Live 4.22.24 Weekly Property BroadcastSVN Live 4.22.24 Weekly Property Broadcast
SVN Live 4.22.24 Weekly Property Broadcast
 
Eco-Efficient Living: Redefining Sustainability through Leech's Green Design ...
Eco-Efficient Living: Redefining Sustainability through Leech's Green Design ...Eco-Efficient Living: Redefining Sustainability through Leech's Green Design ...
Eco-Efficient Living: Redefining Sustainability through Leech's Green Design ...
 
Shapoorji Pallonji Parkwest Sequoia Tower Bangalore.pdf
Shapoorji Pallonji Parkwest Sequoia Tower Bangalore.pdfShapoorji Pallonji Parkwest Sequoia Tower Bangalore.pdf
Shapoorji Pallonji Parkwest Sequoia Tower Bangalore.pdf
 

SF October 2018 Monthly Snapshot

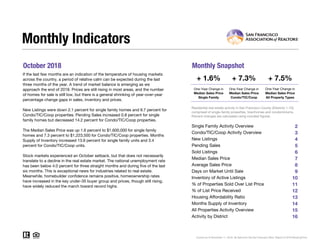
  • 1. October 2018 Monthly Snapshot One-Year Change in One-Year Change in Median Sales Price Single Family Median Sales Price Condo/TIC/Coop 2 3 4 5 6 7 8 9 10 11 12 13 14 15 16 Current as of November 11, 2018. All data from the San Francisco MLS. Report © 2018 ShowingTime. Condo/TIC/Coop Activity Overview Inventory of Active Listings % of Properties Sold Over List Price % of List Price Received Housing Affordability Ratio All Properties Activity Overview New Listings Pending Sales Sold Listings Median Sales Price Average Sales Price Days on Market Until Sale Activity by District Monthly Indicators + 1.6% + 7.3% + 7.5% One-Year Change in If the last few months are an indication of the temperature of housing markets across the country, a period of relative calm can be expected during the last three months of the year. A trend of market balance is emerging as we approach the end of 2018. Prices are still rising in most areas, and the number of homes for sale is still low, but there is a general shrinking of year-over-year percentage change gaps in sales, inventory and prices. New Listings were down 2.1 percent for single family homes and 9.7 percent for Condo/TIC/Coop properties. Pending Sales increased 0.8 percent for single family homes but decreased 14.2 percent for Condo/TIC/Coop properties. The Median Sales Price was up 1.6 percent to $1,600,000 for single family homes and 7.3 percent to $1,223,500 for Condo/TIC/Coop properties. Months Supply of Inventory increased 13.6 percent for single family units and 3.4 percent for Condo/TIC/Coop units. Stock markets experienced an October setback, but that does not necessarily translate to a decline in the real estate market. The national unemployment rate has been below 4.0 percent for three straight months and during five of the last six months. This is exceptional news for industries related to real estate. Meanwhile, homebuilder confidence remains positive, homeownership rates have increased in the key under-35 buyer group and prices, though still rising, have widely reduced the march toward record highs. Median Sales Price All Property Types Residential real estate activity in San Francisco County (Districts 1-10), comprised of single-family properties, townhomes and condominiums. Percent changes are calculated using rounded figures. Single Family Activity Overview Months Supply of Inventory
  • 2. Single Family Activity Overview Key metrics by report month and for year-to-date (YTD) starting from the first of the year. Key Metrics Historical Sparkbars 10-2017 10-2018 Percent Change YTD 2017 YTD 2018 Percent Change + 5.1%2,499 1,845 - 1.5% $1,601,000 + 14.4% + 12.5% Pending Sales 248 250 + 0.8% - 1.7%1,959 1,926 New Listings 239 234 - 2.1% 2,378 Sold Listings 233 244 + 4.7% 1,873 Median Sales Price $1,575,000 $1,600,000 + 1.6% $1,400,000 22 - 18.5% $1,992,820 -- -- Days on Market 23 24 + 4.3% 27 Avg. Sales Price $2,007,445 $2,168,225 + 8.0% $1,770,768 Active Listings 412 469 + 13.8% -- % of Properties Sold Over List Price 83.7% 82.4% - 1.6% 79.0% 37 81.7% + 3.4% + 1.7% 28 - 24.3% 117.0%% of List Price Received 115.6% 114.0% - 1.4% 115.1% Current as of November 11, 2018. All data from the San Francisco MLS. Report © 2018 ShowingTime. | 2 Months Supply 2.2 2.5 + 13.6% -- -- -- Affordability Ratio 32 28 - 12.5% 10-2015 10-2016 10-2017 10-2018 10-2015 10-2016 10-2017 10-2018 10-2015 10-2016 10-2017 10-2018 10-2015 10-2016 10-2017 10-2018 10-2015 10-2016 10-2017 10-2018 10-2015 10-2016 10-2017 10-2018 10-2015 10-2016 10-2017 10-2018 10-2015 10-2016 10-2017 10-2018 10-2015 10-2016 10-2017 10-2018 10-2015 10-2016 10-2017 10-2018 10-2015 10-2016 10-2017 10-2018
  • 3. Condo/TIC/Coop Activity Overview Key metrics by report month and for year-to-date (YTD) starting from the first of the year. Key Metrics Historical Sparkbars 10-2017 10-2018 Percent Change YTD 2017 YTD 2018 Percent Change + 5.7% Pending Sales 330 283 - 14.2% 2,474 2,604 + 5.3% New Listings 329 297 - 9.7% 3,304 3,492 Sold Listings 311 288 - 7.4% 2,366 2,546 + 7.6% Median Sales Price $1,140,000 $1,223,500 + 7.3% $1,125,000 $1,200,000 + 6.7% + 3.1% 31 - 13.9% $1,327,038 -- -- Days on Market 31 27 - 12.9% 36 Avg. Sales Price $1,275,773 $1,348,944 + 5.7% $1,287,186 Active Listings 708 765 + 8.1% -- % of Properties Sold Over List Price 66.6% 67.7% + 1.7% 59.6% 53 62.3% + 4.5% + 1.6% 42 - 20.8% 106.9%% of List Price Received 106.6% 107.7% + 1.0% 105.2% Current as of November 11, 2018. All data from the San Francisco MLS. Report © 2018 ShowingTime. | 3 Months Supply 2.9 3.0 + 3.4% -- -- -- Affordability Ratio 52 41 - 21.2% 10-2015 10-2016 10-2017 10-2018 10-2015 10-2016 10-2017 10-2018 10-2015 10-2016 10-2017 10-2018 10-2015 10-2016 10-2017 10-2018 10-2015 10-2016 10-2017 10-2018 10-2015 10-2016 10-2017 10-2018 10-2015 10-2016 10-2017 10-2018 10-2015 10-2016 10-2017 10-2018 10-2015 10-2016 10-2017 10-2018 10-2015 10-2016 10-2017 10-2018 10-2015 10-2016 10-2017 10-2018
  • 4. New Listings New Listings Single Family Year-Over-Year Change Condo/TIC/ Coop Year-Over-Year Change Nov-2017 145 +5.1% 209 +31.4% Dec-2017 78 +11.4% 129 +7.5% Jan-2018 188 +5.6% 356 +8.2% Feb-2018 207 +10.7% 356 +7.9% Mar-2018 276 -0.4% 378 +8.0% Apr-2018 270 +9.3% 380 +33.3% May-2018 272 -5.2% 367 +1.7% Jun-2018 264 +10.9% 352 +12.5% Jul-2018 235 +11.4% 259 -5.5% Aug-2018 231 +8.5% 300 +2.0% Sep-2018 322 +7.0% 447 +1.8% Oct-2018 234 -2.1% 297 -9.7% 12-Month Avg 227 +5.3% 319 +6.9% Historical New Listings by Month Current as of November 11, 2018. All data from the San Francisco MLS. Report © 2018 ShowingTime. | 4 A count of the properties that have been newly listed on the market in a given month. 222 300 239 329 234 297 Single Family Condo/TIC/Coop October 0 100 200 300 400 500 600 700 1-2005 1-2006 1-2007 1-2008 1-2009 1-2010 1-2011 1-2012 1-2013 1-2014 1-2015 1-2016 1-2017 1-2018 Single Family Condo/TIC/Coop 2,464 3,461 2,378 3,304 2,499 3,492 Single Family Condo/TIC/Coop Year to Date 2016 2017 2018 - 9.7%+ 9.7%- 2.1%+ 7.7% - 4.5%+ 5.1%- 3.5% + 5.7% 2016 2017 2018 2016 2017 2018 2016 2017 2018 - 15.6% - 2.6% + 6.9%- 6.8%
  • 5. Pending Sales Pending Sales Single Family Year-Over-Year Change Condo/TIC/ Coop Year-Over-Year Change Nov-2017 198 -4.8% 234 -11.0% Dec-2017 108 -12.2% 192 +7.9% Jan-2018 87 -6.5% 180 +24.1% Feb-2018 158 +17.0% 224 +7.2% Mar-2018 216 +1.4% 336 +10.5% Apr-2018 207 +4.5% 287 +27.6% May-2018 274 +14.2% 298 -2.6% Jun-2018 203 -18.5% 301 +3.8% Jul-2018 165 -5.2% 246 +17.7% Aug-2018 174 -15.1% 231 +9.0% Sep-2018 192 -5.9% 218 -10.7% Oct-2018 250 +0.8% 283 -14.2% 12-Month Avg 186 -2.5% 253 +3.9% Historical Pending Sales by Month Current as of November 11, 2018. All data from the San Francisco MLS. Report © 2018 ShowingTime. | 5 A count of the properties on which offers have been accepted in a given month. 222 248248 330 250 283 Single Family Condo/TIC/Coop October 0 100 200 300 400 1-2005 1-2006 1-2007 1-2008 1-2009 1-2010 1-2011 1-2012 1-2013 1-2014 1-2015 1-2016 1-2017 1-2018 Single Family Condo/TIC/Coop 1,886 2,344 1,959 2,474 1,926 2,604 Single Family Condo/TIC/Coop Year to Date 2016 2017 2018 - 14.2%+ 33.1%+ 0.8%+ 11.7% + 5.5%- 1.7%+ 3.9% + 5.3% 2016 2017 2018 2016 2017 2018 2016 2017 2018 - 16.5% - 6.3% - 6.0%- 12.4%
  • 6. Sold Listings Sold Listings Single Family Year-Over-Year Change Condo/TIC/ Coop Year-Over-Year Change Nov-2017 245 +18.9% 278 +5.7% Dec-2017 149 -25.5% 250 +5.0% Jan-2018 95 -10.4% 149 -0.7% Feb-2018 107 -3.6% 201 +28.0% Mar-2018 200 +15.6% 289 +0.7% Apr-2018 191 -5.9% 295 +27.2% May-2018 248 +13.8% 312 +14.7% Jun-2018 231 +0.4% 302 -6.8% Jul-2018 193 -8.1% 271 +13.4% Aug-2018 190 -10.4% 258 +17.8% Sep-2018 146 -17.5% 181 +3.4% Oct-2018 244 +4.7% 288 -7.4% 12-Month Avg 187 -1.8% 256 +7.2% Historical Sold Listings by Month Current as of November 11, 2018. All data from the San Francisco MLS. Report © 2018 ShowingTime. | 6 A count of the actual sales that closed in a given month. 227 236233 311 244 288 Single Family Condo/TIC/Coop October 0 100 200 300 400 1-2005 1-2006 1-2007 1-2008 1-2009 1-2010 1-2011 1-2012 1-2013 1-2014 1-2015 1-2016 1-2017 1-2018 Single Family Condo/TIC/Coop 1,817 2,294 1,873 2,366 1,845 2,546 Single Family Condo/TIC/Coop Year to Date 2016 2017 2018 - 7.4%+ 31.8%+ 4.7%+ 2.6% + 3.1%- 1.5%+ 3.1% + 7.6% 2016 2017 2018 2016 2017 2018 2016 2017 2018 - 7.3% - 5.1% - 4.3%- 11.3%
  • 7. Median Sales Price Median Sales Price Single Family Year-Over-Year Change Condo/TIC/ Coop Year-Over-Year Change Nov-2017 $1,495,000 +10.5% $1,237,500 +17.0% Dec-2017 $1,450,000 +11.4% $1,120,000 +10.8% Jan-2018 $1,330,000 +6.4% $1,100,000 +10.0% Feb-2018 $1,700,000 +31.8% $1,076,000 -9.2% Mar-2018 $1,687,500 +25.0% $1,250,000 +9.9% Apr-2018 $1,650,000 +19.6% $1,250,000 +13.6% May-2018 $1,616,944 +9.6% $1,257,500 +7.6% Jun-2018 $1,625,000 +11.2% $1,169,750 +4.0% Jul-2018 $1,627,500 +16.3% $1,150,000 0.0% Aug-2018 $1,550,000 +12.5% $1,234,400 +5.1% Sep-2018 $1,500,000 +13.6% $1,150,000 +5.0% Oct-2018 $1,600,000 +1.6% $1,223,500 +7.3% 12-Month Avg* $1,600,000 +15.9% $1,200,000 +8.6% Historical Median Sales Price by Month * Median Sales Price for all properties from November 2017 through October 2018. This is not the average of the individual figures above. Current as of November 11, 2018. All data from the San Francisco MLS. Report © 2018 ShowingTime. | 7 Point at which half of the sales sold for more and half sold for less, not accounting for seller concessions, in a given month. $1,400,000 $1,137,500 $1,575,000 $1,140,000 $1,600,000 $1,223,500 Single Family Condo/TIC/Coop October $400,000 $600,000 $800,000 $1,000,000 $1,200,000 $1,400,000 $1,600,000 $1,800,000 1-2005 1-2006 1-2007 1-2008 1-2009 1-2010 1-2011 1-2012 1-2013 1-2014 1-2015 1-2016 1-2017 1-2018 Single Family Condo/TIC/Coop $1,325,000 $1,096,618 $1,400,000 $1,125,000 $1,601,000 $1,200,000 Single Family Condo/TIC/Coop Year to Date 2016 2017 2018 + 7.3%+ 0.2%+ 1.6%+ 12.5% + 2.6%+ 14.4%+ 5.7% + 6.7% 2016 2017 2018 2016 2017 2018 2016 2017 2018 + 10.2% + 6.0% + 2.0%+ 3.4%
  • 8. Average Sales Price Avg. Sales Price Single Family Year-Over-Year Change Condo/TIC/ Coop Year-Over-Year Change Nov-2017 $1,755,315 -0.7% $1,386,511 +21.6% Dec-2017 $1,908,433 +15.1% $1,263,727 +1.1% Jan-2018 $1,787,311 +9.4% $1,321,377 +13.7% Feb-2018 $2,107,409 +25.1% $1,263,105 -7.0% Mar-2018 $1,949,493 +3.1% $1,371,131 +6.9% Apr-2018 $2,202,113 +17.1% $1,335,718 +3.0% May-2018 $1,992,346 +8.5% $1,399,046 +3.9% Jun-2018 $1,943,346 +12.5% $1,335,648 -1.2% Jul-2018 $1,977,413 +13.7% $1,232,997 -0.8% Aug-2018 $1,844,836 +17.7% $1,347,023 +6.1% Sep-2018 $1,826,997 +13.4% $1,257,117 +3.2% Oct-2018 $2,168,225 +8.0% $1,348,944 +5.7% 12-Month Avg* $1,961,215 +11.4% $1,327,268 +4.5% Historical Average Sales Price by Month * Avg. Sales Price for all properties from November 2017 through October 2018. This is not the average of the individual figures above. Current as of November 11, 2018. All data from the San Francisco MLS. Report © 2018 ShowingTime. | 8 Average sales price for all closed sales, not accounting for seller concessions, in a given month. $2,000,319 $1,263,882 $2,007,445 $1,275,773 $2,168,225 $1,348,944 Single Family Condo/TIC/Coop October $500,000 $1,000,000 $1,500,000 $2,000,000 $2,500,000 1-2005 1-2006 1-2007 1-2008 1-2009 1-2010 1-2011 1-2012 1-2013 1-2014 1-2015 1-2016 1-2017 1-2018 Single Family Condo/TIC/Coop $1,704,234 $1,242,414 $1,770,768 $1,287,186 $1,992,820 $1,327,038 Single Family Condo/TIC/Coop Year to Date 2016 2017 2018 + 5.7%+ 0.9%+ 8.0%+ 0.4% + 3.6%+ 12.5%+ 3.9% + 3.1% 2016 2017 2018 2016 2017 2018 2016 2017 2018 + 22.9% + 3.9% + 0.2%+ 6.7%
  • 9. Days on Market Until Sale Days on Market Single Family Year-Over-Year Change Condo/TIC/ Coop Year-Over-Year Change Nov-2017 26 -31.6% 35 -12.5% Dec-2017 28 -31.7% 45 -6.3% Jan-2018 33 -21.4% 55 -6.8% Feb-2018 22 -35.3% 37 +2.8% Mar-2018 22 -29.0% 26 -18.8% Apr-2018 18 -30.8% 26 -18.8% May-2018 20 -16.7% 27 -18.2% Jun-2018 18 -33.3% 27 -27.0% Jul-2018 21 -12.5% 31 -6.1% Aug-2018 22 -18.5% 36 -12.2% Sep-2018 23 -17.9% 30 -28.6% Oct-2018 24 +4.3% 27 -12.9% 12-Month Avg* 23 -23.3% 32 -13.9% Historical Days on Market Until Sale by Month * Days on Market for all properties from November 2017 through October 2018. This is not the average of the individual figures above. Current as of November 11, 2018. All data from the San Francisco MLS. Report © 2018 ShowingTime. | 9 Average number of days between when a property is listed and when an offer is accepted in a given month. 27 34 23 31 24 27 Single Family Condo/TIC/Coop October 0 20 40 60 80 100 120 1-2005 1-2006 1-2007 1-2008 1-2009 1-2010 1-2011 1-2012 1-2013 1-2014 1-2015 1-2016 1-2017 1-2018 Single Family Condo/TIC/Coop 31 37 27 36 22 31 Single Family Condo/TIC/Coop Year to Date 2016 2017 2018 - 12.9%- 8.8%+ 4.3%- 14.8% - 2.7%- 18.5%- 12.9% - 13.9% 2016 2017 2018 2016 2017 2018 2016 2017 2018 + 3.8% + 14.8% + 23.3%+ 30.8%
  • 10. Inventory of Active Listings Active Listings Single Family Year-Over-Year Change Condo/TIC/ Coop Year-Over-Year Change Nov-2017 334 -13.2% 612 +2.3% Dec-2017 229 -12.6% 424 +2.4% Jan-2018 321 -1.5% 574 +1.6% Feb-2018 354 -2.2% 663 +3.8% Mar-2018 397 +0.3% 658 +2.3% Apr-2018 434 +2.4% 709 +7.8% May-2018 408 -7.1% 724 +7.4% Jun-2018 431 +8.3% 704 +11.9% Jul-2018 457 +13.1% 643 +4.0% Aug-2018 465 +21.7% 646 +3.2% Sep-2018 545 +22.2% 817 +5.6% Oct-2018 469 +13.8% 765 +8.1% 12-Month Avg* 404 +4.5% 662 +5.2% Historical Inventory of Active Listings by Month * Active Listings for all properties from November 2017 through October 2018. This is not the average of the individual figures above. Current as of November 11, 2018. All data from the San Francisco MLS. Report © 2018 ShowingTime. | 10 The number of properties available for sale in active status at the end of a given month. 491 806 412 708 469 765 Single Family Condo/TIC/Coop October 200 400 600 800 1,000 1,200 1,400 1,600 1-2005 1-2006 1-2007 1-2008 1-2009 1-2010 1-2011 1-2012 1-2013 1-2014 1-2015 1-2016 1-2017 1-2018 Single Family Condo/TIC/Coop 2016 2017 2018 + 8.1%- 12.2%+ 13.8%- 16.1% 2016 2017 2018 + 11.3% + 22.3%
  • 11. % of Properties Sold Over List Price % of Properties Sold Over List Price Single Family Year-Over-Year Change Condo/TIC/ Coop Year-Over-Year Change Nov-2017 80.8% +11.0% 58.3% -7.6% Dec-2017 73.2% +6.1% 54.4% +28.3% Jan-2018 70.5% +13.2% 33.6% -13.2% Feb-2018 80.4% +2.6% 58.7% +2.4% Mar-2018 77.5% +3.9% 59.2% -4.5% Apr-2018 77.5% +0.3% 66.8% +7.6% May-2018 84.7% +7.4% 67.6% +10.8% Jun-2018 88.3% +10.4% 68.2% +16.4% Jul-2018 85.0% +4.4% 63.8% +1.6% Aug-2018 81.1% +2.9% 57.8% -4.8% Sep-2018 81.5% -5.1% 63.5% +19.6% Oct-2018 82.4% -1.6% 67.7% +1.7% 12-Month Avg 81.1% +4.5% 61.3% +4.8% Historical % of Properties Sold Over List Price by Month * % of Properties Sold Over List Price for all properties from November 2017 through October 2018. This is not the average of the individual figures above. Current as of November 11, 2018. All data from the San Francisco MLS. Report © 2018 ShowingTime. | 11 Percentage found when dividing the number of properties sold by properties sold over its original list price, not accounting for seller concessions. 78.9% 53.8% 83.7% 66.6% 82.4% 67.7% Single Family Condo/TIC/Coop October 0.0% 20.0% 40.0% 60.0% 80.0% 100.0% 1-2005 1-2006 1-2007 1-2008 1-2009 1-2010 1-2011 1-2012 1-2013 1-2014 1-2015 1-2016 1-2017 1-2018 Single Family Condo/TIC/Coop 76.9% 59.3% 79.0% 59.6% 81.7% 62.3% Single Family Condo/TIC/Coop Year to Date 2016 2017 2018 + 1.7%+ 23.8%- 1.6%+ 6.1% + 0.5%+ 3.4%+ 2.7% + 4.5% 2016 2017 2018 2016 2017 2018 2016 2017 2018 - 5.3% - 7.5% - 17.3%- 29.5%
  • 12. % of List Price Received % of List Price Received Single Family Year-Over-Year Change Condo/TIC/ Coop Year-Over-Year Change Nov-2017 115.5% +5.9% 104.5% -0.1% Dec-2017 114.3% +5.4% 103.8% +2.3% Jan-2018 112.3% +4.4% 101.7% +0.3% Feb-2018 115.8% +1.8% 105.1% +1.2% Mar-2018 117.5% +4.5% 107.1% +2.1% Apr-2018 119.2% +3.3% 108.9% +3.6% May-2018 119.4% +3.6% 108.4% +2.8% Jun-2018 120.1% +2.8% 107.3% +1.4% Jul-2018 117.1% 0.0% 107.2% +1.1% Aug-2018 114.9% -0.5% 105.7% 0.0% Sep-2018 115.4% -0.8% 106.6% +1.7% Oct-2018 114.0% -1.4% 107.7% +1.0% 12-Month Avg* 116.6% +2.3% 106.4% +1.5% Historical % of List Price Received by Month * % of List Price Received for all properties from November 2017 through October 2018. This is not the average of the individual figures above. Current as of November 11, 2018. All data from the San Francisco MLS. Report © 2018 ShowingTime. | 12 Percentage found when dividing a property’s sales price by its most recent list price, then taking the average for all properties sold in a given month, not accounting for seller concessions. 111.2% 104.2% 115.6% 106.6% 114.0% 107.7% Single Family Condo/TIC/Coop October 112.2% 104.9% 115.1% 105.2% 117.0% 106.9% Single Family Condo/TIC/Coop Year to Date 90.0% 100.0% 110.0% 120.0% 130.0% 1-2005 1-2006 1-2007 1-2008 1-2009 1-2010 1-2011 1-2012 1-2013 1-2014 1-2015 1-2016 1-2017 1-2018 Single Family Condo/TIC/Coop 2016 2017 2018 + 1.0%+ 2.3%- 1.4%+ 4.0% 2016 2017 2018 - 2.9% - 4.7% 2016 2017 2018 + 1.6%+ 0.3%+ 1.7%+ 2.6% 2016 2017 2018 - 3.3% - 4.0%
  • 13. Housing Affordability Ratio Affordability Ratio Single Family Year-Over-Year Change Condo/TIC/ Coop Year-Over-Year Change Nov-2017 35 -7.9% 49 -12.5% Dec-2017 35 -7.9% 53 -5.4% Jan-2018 37 -5.1% 52 -7.1% Feb-2018 29 -25.6% 53 +8.2% Mar-2018 29 -21.6% 46 -9.8% Apr-2018 29 -21.6% 45 -16.7% May-2018 30 -14.3% 44 -13.7% Jun-2018 30 -14.3% 48 -9.4% Jul-2018 30 -18.9% 49 -5.8% Aug-2018 31 -18.4% 45 -13.5% Sep-2018 31 -20.5% 47 -14.5% Oct-2018 28 -12.5% 41 -21.2% 12-Month Avg* 31 -24.5% 37 -23.0% Historical Housing Affordability Ratio by Month * Affordability Ratio for all properties from November 2017 through October 2018. This is not the average of the individual figures above. Current as of November 11, 2018. All data from the San Francisco MLS. Report © 2018 ShowingTime. | 13 This index measures housing affordability for the region. For example, an index of 120 means the median household income is 120% of what is necessary to qualify for the median-priced home under prevailing interest rates. A higher number means greater affordability. 39 56 32 52 28 41 Single Family Condo/TIC/Coop October 20 40 60 80 100 1-2005 1-2006 1-2007 1-2008 1-2009 1-2010 1-2011 1-2012 1-2013 1-2014 1-2015 1-2016 1-2017 1-2018 Single Family Condo/TIC/Coop 2016 2017 2018 - 21.2%- 7.1%- 12.5%- 17.9% 2016 2017 2018 + 2.6% + 9.8% 41 58 37 53 28 42 Single Family Condo/TIC/Coop Year to Date 2016 2017 2018 - 20.8%- 8.6%- 24.3%- 9.8% 2016 2017 2018 + 5.1% + 9.4%
  • 14. Months Supply of Inventory Months Supply Single Family Year-Over-Year Change Condo/TIC/ Coop Year-Over-Year Change Nov-2017 1.8 -14.3% 2.5 -3.8% Dec-2017 1.2 -14.3% 1.8 0.0% Jan-2018 1.7 -5.6% 2.3 -4.2% Feb-2018 1.9 -5.0% 2.7 -3.6% Mar-2018 2.1 0.0% 2.6 -3.7% Apr-2018 2.3 0.0% 2.8 0.0% May-2018 2.1 -12.5% 2.9 +3.6% Jun-2018 2.3 +9.5% 2.8 +7.7% Jul-2018 2.4 +9.1% 2.5 -3.8% Aug-2018 2.5 +25.0% 2.5 -7.4% Sep-2018 2.9 +20.8% 3.2 -3.0% Oct-2018 2.5 +13.6% 3.0 +3.4% 12-Month Avg* 2.1 +3.0% 2.6 -1.2% Historical Months Supply of Inventory by Month * Months Supply for all properties from November 2017 through October 2018. This is not the average of the individual figures above. Current as of November 11, 2018. All data from the San Francisco MLS. Report © 2018 ShowingTime. | 14 The inventory of homes for sale at the end of a given month, divided by the average monthly pending sales from the last 12 months. 2.7 3.5 2.2 2.9 2.5 3.0 Single Family Condo/TIC/Coop October 0.0 2.0 4.0 6.0 8.0 10.0 1-2005 1-2006 1-2007 1-2008 1-2009 1-2010 1-2011 1-2012 1-2013 1-2014 1-2015 1-2016 1-2017 1-2018 Single Family Condo/TIC/Coop 2016 2017 2018 + 3.4%- 17.1%+ 13.6%- 18.5% 2016 2017 2018 + 22.7% + 29.6%
  • 15. All Properties Activity Overview Key metrics by report month and for year-to-date (YTD) starting from the first of the year. Key Metrics Historical Sparkbars 10-2017 10-2018 Percent Change YTD 2017 YTD 2018 Percent Change + 5.4% Pending Sales 578 533 - 7.8% 4,433 4,530 + 2.2% New Listings 568 531 - 6.5% 5,682 5,991 Sold Listings 544 532 - 2.2% 4,239 4,391 + 3.6% Median Sales Price $1,292,500 $1,389,000 + 7.5% $1,250,000 $1,355,000 + 8.4% + 7.1% 27 - 15.6% $1,606,785 -- -- Days on Market 27 26 - 3.7% 32 Avg. Sales Price $1,589,155 $1,724,704 + 8.5% $1,500,856 Active Listings 1,120 1,234 + 10.2% -- % of Properties Sold Over List Price 73.9% 74.4% + 0.7% 68.2% 40 70.4% + 3.2% + 1.4% 32 - 20.0% 111.1%% of List Price Received 110.5% 110.6% + 0.1% 109.6% Current as of November 11, 2018. All data from the San Francisco MLS. Report © 2018 ShowingTime. | 15 Months Supply 2.6 2.8 + 7.7% -- -- -- Affordability Ratio 38 29 - 23.7% 10-2015 10-2016 10-2017 10-2018 10-2015 10-2016 10-2017 10-2018 10-2015 10-2016 10-2017 10-2018 10-2015 10-2016 10-2017 10-2018 10-2015 10-2016 10-2017 10-2018 10-2015 10-2016 10-2017 10-2018 10-2015 10-2016 10-2017 10-2018 10-2015 10-2016 10-2017 10-2018 10-2015 10-2016 10-2017 10-2018 10-2015 10-2016 10-2017 10-2018 10-2015 10-2016 10-2017 10-2018
  • 16. Activity by District SF District 1: Northwest (Sea Cliff, Lake, Jordan Park / Laurel Heights, Outer Richmond, Central Richmond, Inner Richmond, Lone Mountain) SF District 2: Central West (Outer Sunset, Central Sunset, Inner Sunset, Outer Parkside, Parkside, Inner Parkside, Golden Gate Heights) SF District 3: Southwest (Pine Lake Park, Lake Shore, Merced Manor, Stonestown, Lakeside, Merced Heights, Ingleside, Ingleside Heights, Oceanview) SF District 4: Twin Peaks W (Forest Hill (& Ext), W Portal, St Francis Wd, Balboa Terr, Mt Dav Manor, Ingleside Terr, Monterey Hts, Wstwd Pk & H'lnds, Shrwd Fst, Miraloma Pk, Dmnd Hts, Mdtwn Terr) SF District 5: Central (Haight Ashbury, Cole Vly / Prnssus Hts, Clarndn Hts, Corona Hts, Twin Pks, Glen Pk, Noe Vly, Eureka Vly / Dolores Hts, Mission Dolores, Duboce Trngl, Buena Vista / Ashbury Hts) SF District 6: Central North (Lower Pacific Heights, Anza Vista, Western Addition, North Panhandle, Alamo Square, Hayes Valley) SF District 7: North (Marina, Cow Hollow, Presidio Heights, Pacific Heights) SF District 8: Northeast (North Waterfront, North Beach, Russian Hill, Telegraph Hill, Nob Hill, Financial District / Barbary Coast, Downtown, Van Ness / Civic Center, Tenderloin) SF District 9: Central East (Yerba Buena, South Beach, South of Market, Mission Bay, Inner Mission, Potrero Hill, Central Waterfront / Dogpatch, Bernal Heights) SF District 10: Southeast (Outer Mission, Mission Terr, Excelsior, Portola, Bayview, Silver Terr, Hunters Pt, Candlestick Pt, Bayview Hts, Little Hollywood, Visitation Vly, Crocker Amazon) 10-2017 10-2018 + / – 10-2017 10-2018 + / – 10-2017 10-2018 + / – 10-2017 10-2018 + / – 10-2017 10-2018 + / – Single Family 1 SF District 1 25 35 +40.0% 21 24 +14.3% $1,825,000 $2,140,000 +17.3% 19 25 +31.6% 1.8 2.3 +27.8% 2 SF District 2 40 57 +42.5% 32 33 +3.1% $1,495,000 $1,380,000 -7.7% 20 22 +10.0% 1.2 1.8 +50.0% 3 SF District 3 23 31 +34.8% 18 17 -5.6% $1,007,500 $1,156,000 +14.7% 34 35 +2.9% 1.6 2.5 +56.3% 4 SF District 4 48 62 +29.2% 30 39 +30.0% $1,642,500 $1,765,000 +7.5% 16 27 +68.8% 1.9 2.3 +21.1% 5 SF District 5 61 72 +18.0% 37 43 +16.2% $2,250,000 $2,500,000 +11.1% 23 19 -17.4% 2.2 2.7 +22.7% 6 SF District 6 15 13 -13.3% 6 4 -33.3% $2,563,000 $2,995,000 +16.9% 11 19 +72.7% 5.1 3.7 -27.5% 7 SF District 7 39 35 -10.3% 15 11 -26.7% $5,625,000 $6,150,000 +9.3% 26 26 0.0% 4.9 4.1 -16.3% 8 SF District 8 13 19 +46.2% 2 1 -50.0% $2,557,500 $16,000,000 +525.6% 16 168 +950.0% 5.3 7.1 +34.0% 9 SF District 9 53 59 +11.3% 28 27 -3.6% $1,652,500 $1,500,000 -9.2% 16 23 +43.8% 2.5 2.8 +12.0% 10 SF District 10 95 86 -9.5% 44 45 +2.3% $956,000 $1,150,000 +20.3% 30 22 -26.7% 2.3 2.3 0.0% Condo/TIC/Coop 1 SF District 1 30 34 +13.3% 20 18 -10.0% $1,117,500 $1,275,000 +14.1% 30 17 -43.3% 3.1 2.4 -22.6% 2 SF District 2 6 10 +66.7% 3 10 +233.3% $1,100,000 $1,245,000 +13.2% 40 21 -47.5% 1.9 2.3 +21.1% 3 SF District 3 7 8 +14.3% 1 3 +200.0% $540,000 $788,000 +45.9% 19 30 +57.9% 2.3 2.7 +17.4% 4 SF District 4 16 13 -18.8% 2 8 +300.0% $515,565 $849,500 +64.8% 20 22 +10.0% 5.2 2.4 -53.8% 5 SF District 5 75 87 +16.0% 54 48 -11.1% $1,331,632 $1,384,250 +4.0% 20 21 +5.0% 2.1 2.3 +9.5% 6 SF District 6 91 67 -26.4% 16 27 +68.8% $1,215,000 $975,000 -19.8% 21 27 +28.6% 3.4 2.8 -17.6% 7 SF District 7 64 67 +4.7% 29 20 -31.0% $1,250,000 $1,414,000 +13.1% 17 24 +41.2% 2.3 2.7 +17.4% 8 SF District 8 126 172 +36.5% 56 47 -16.1% $1,112,500 $1,160,000 +4.3% 32 27 -15.6% 3.1 4.3 +38.7% 9 SF District 9 266 276 +3.8% 119 104 -12.6% $1,099,000 $1,252,500 +14.0% 38 32 -15.8% 3.1 3.0 -3.2% 10 SF District 10 27 31 +14.8% 11 3 -72.7% $730,000 $850,000 +16.4% 51 29 -43.1% 3.4 4.6 +35.3% Key metrics by report month for the districts of San Fransisco. Current as of November 11, 2018. All data from the San Francisco MLS. Report © 2018 ShowingTime. | 16 Active Listings Sold Listings Median Sales Price Days on Market Months Supply