SlideShare a Scribd company logo
1 of 16
Download to read offline
March 2020 Monthly Snapshot
One-Year Change in One-Year Change in
Median Sales Price
Single Family
Median Sales Price
Condo/TIC/Coop
2
3
4
5
6
7
8
9
10
11
12
13
14
15
16
Monthly Indicators
+ 0.2% + 2.0% + 3.9%
One-Year Change in
As COVID-19’s impact spread across the country in March, the stock market
declines started in February accelerated downward before recovering a bit in
the last week of the month. With volatility across all the financial markets,
lenders began tightening underwriting standards and some buyers found they
no longer were approved for a loan. Massive layoffs also shook the economy
with 6.6 million initial jobless claims filed in a single week—double the number
last week and ten times higher than any other week on record prior to this
month.
New Listings were down 57.4 percent for single family homes and 56.3 percent
for Condo/TIC/Coop properties. Pending Sales decreased 28.6 percent for
single family homes and 40.8 percent for Condo/TIC/Coop properties.
The Median Sales Price was up 0.2 percent to $1,652,500 for single family
homes and 2.0 percent to $1,270,000 for Condo/TIC/Coop properties. Months
Supply of Inventory decreased 36.0 percent for single family units and 40.0
percent for Condo/TIC/Coop units.
While the effect of COVID-19 is varied throughout the country, we are likely to
see impacts to housing activity now and into the coming months. Its continued
spread is leading many companies and consumers to change their daily
activities. ShowingTime is closely monitoring the situation and releasing daily
updates on changes in showing activity. See national and state showing activity
trends at https://www.showingtime.com/impact-of-coronavirus/.
Median Sales Price
All Property Types
Residential real estate activity in San Francisco County (Districts 1-10)
composed of single-family properties, townhomes and condominiums.
Percent changes are calculated using rounded figures.
Single Family Activity Overview
Months Supply of Inventory
Current as of April 11, 2020. All data from the San Francisco MLS. Report © 2020 ShowingTime.
Condo/TIC/Coop Activity Overview
Inventory of Active Listings
% of Properties Sold Over List Price
% of List Price Received
Housing Affordability Ratio
All Properties Activity Overview
New Listings
Pending Sales
Sold Listings
Median Sales Price
Average Sales Price
Days on Market Until Sale
Activity by District
Single Family Activity Overview
Key metrics by report month and for year-to-date (YTD) starting from the first of the year.
Key Metrics Historical Sparkbars 3-2019 3-2020 Percent Change YTD 2019 YTD 2020 Percent Change
Current as of April 11, 2020. All data from the San Francisco MLS. Report © 2020 ShowingTime. | 2
Months Supply 2.5 1.6 - 36.0% -- -- --
Affordability Ratio 30 32 + 6.7%
% of List Price Received 110.5% 114.7% + 3.8% 110.0%
32
72.1% + 1.3%
+ 1.6%
33 + 3.1%
111.8%
% of Properties Sold Over List Price 73.3% 79.5% + 8.5% 71.2%
Active Listings 469 289 - 38.4% --
Avg. Sales Price $2,046,399 $2,096,326 + 2.4% $1,918,458
Days on Market 26 20 - 23.1% 30 26 - 13.3%
$2,083,150
-- --
Median Sales Price $1,650,000 $1,652,500 + 0.2% $1,549,000
Sold Listings 172 157 - 8.7% 385
New Listings 242 103 - 57.4% 655
Pending Sales 210 150 - 28.6% - 12.6%443 387
- 25.6%487
367 - 4.7%
$1,595,000 + 3.0%
+ 8.6%
3-2017 3-2018 3-2019 3-2020
3-2017 3-2018 3-2019 3-2020
3-2017 3-2018 3-2019 3-2020
3-2017 3-2018 3-2019 3-2020
3-2017 3-2018 3-2019 3-2020
3-2017 3-2018 3-2019 3-2020
3-2017 3-2018 3-2019 3-2020
3-2017 3-2018 3-2019 3-2020
3-2017 3-2018 3-2019 3-2020
3-2017 3-2018 3-2019 3-2020
3-2017 3-2018 3-2019 3-2020
Condo/TIC/Coop Activity Overview
Key metrics by report month and for year-to-date (YTD) starting from the first of the year.
Key Metrics Historical Sparkbars 3-2019 3-2020 Percent Change YTD 2019 YTD 2020 Percent Change
Current as of April 11, 2020. All data from the San Francisco MLS. Report © 2020 ShowingTime. | 3
Months Supply 3.0 1.8 - 40.0% -- -- --
Affordability Ratio 47 48 + 2.1%
% of List Price Received 104.7% 104.5% - 0.2% 103.8%
49
53.8% + 3.7%
- 0.2%
49 0.0%
103.6%
% of Properties Sold Over List Price 55.8% 60.8% + 9.0% 51.9%
Active Listings 715 420 - 41.3% --
Avg. Sales Price $1,335,673 $1,378,517 + 3.2% $1,310,721
Days on Market 35 27 - 22.9% 40
$1,250,000 + 6.8%
+ 4.6%
37 - 7.5%
$1,370,741
-- --
Sold Listings 265 217 - 18.1% 543 546 + 0.6%
Median Sales Price $1,245,000 $1,270,000 + 2.0% $1,170,000
- 22.3%
Pending Sales 299 177 - 40.8% 648 570 - 12.0%
New Listings 352 154 - 56.3% 1,016 789
3-2017 3-2018 3-2019 3-2020
3-2017 3-2018 3-2019 3-2020
3-2017 3-2018 3-2019 3-2020
3-2017 3-2018 3-2019 3-2020
3-2017 3-2018 3-2019 3-2020
3-2017 3-2018 3-2019 3-2020
3-2017 3-2018 3-2019 3-2020
3-2017 3-2018 3-2019 3-2020
3-2017 3-2018 3-2019 3-2020
3-2017 3-2018 3-2019 3-2020
3-2017 3-2018 3-2019 3-2020
New Listings
New Listings
Single
Family
Year-Over-Year
Change
Condo/TIC/
Coop
Year-Over-Year
Change
Apr-2019 252 -7.0% 377 -0.3%
May-2019 275 +1.5% 367 -0.8%
Jun-2019 233 -12.1% 285 -20.4%
Jul-2019 197 -17.6% 320 +22.6%
Aug-2019 245 -2.0% 328 +5.5%
Sep-2019 305 -9.8% 506 +11.5%
Oct-2019 242 -6.2% 340 -0.3%
Nov-2019 129 -18.9% 152 -22.4%
Dec-2019 79 -3.7% 128 +4.9%
Jan-2020 186 -17.0% 309 -13.7%
Feb-2020 198 +4.8% 326 +6.5%
Mar-2020 103 -57.4% 154 -56.3%
12-Month Avg 204 -12.3% 299 -5.6%
Historical New Listings by Month
Current as of April 11, 2020. All data from the San Francisco MLS. Report © 2020 ShowingTime. | 4
A count of the properties that have been newly listed on the market in a given month.
278
379
242
352
103
154
Single Family Condo/TIC/Coop
March
0
100
200
300
400
500
600
700
1-2005 1-2006 1-2007 1-2008 1-2009 1-2010 1-2011 1-2012 1-2013 1-2014 1-2015 1-2016 1-2017 1-2018 1-2019 1-2020
Single Family Condo/TIC/Coop
675
1,105
655
1,016
487
789
Single Family Condo/TIC/Coop
Year to Date
2018 2019 2020
- 56.3%- 7.1%- 57.4%- 12.9% - 8.1%- 25.6%- 3.0% - 22.3%
2018 2019 2020 2018 2019 2020 2018 2019 2020
+ 0.7% + 5.3% + 9.5%+ 8.3%
Pending Sales
Pending Sales
Single
Family
Year-Over-Year
Change
Condo/TIC/
Coop
Year-Over-Year
Change
Apr-2019 222 +7.2% 313 +9.1%
May-2019 248 -9.8% 337 +13.5%
Jun-2019 194 -4.9% 245 -18.9%
Jul-2019 183 +10.9% 205 -17.0%
Aug-2019 151 -11.2% 211 -9.1%
Sep-2019 195 +1.0% 229 +4.6%
Oct-2019 247 -1.6% 303 +4.1%
Nov-2019 191 +2.1% 234 +5.4%
Dec-2019 115 -5.0% 156 +6.1%
Jan-2020 101 +13.5% 157 +29.8%
Feb-2020 136 -5.6% 236 +3.5%
Mar-2020 150 -28.6% 177 -40.8%
12-Month Avg 178 -3.7% 234 -3.1%
Historical Pending Sales by Month
A count of the properties on which offers have been accepted in a given month.
Current as of April 11, 2020. All data from the San Francisco MLS. Report © 2020 ShowingTime. | 5
215
336
210
299
150
177
Single Family Condo/TIC/Coop
March
0
100
200
300
400
1-2005 1-2006 1-2007 1-2008 1-2009 1-2010 1-2011 1-2012 1-2013 1-2014 1-2015 1-2016 1-2017 1-2018 1-2019 1-2020
Single Family Condo/TIC/Coop
460
740
443
648
387
570
Single Family Condo/TIC/Coop
Year to Date
2018 2019 2020
- 40.8%- 11.0%- 28.6%- 2.3% - 12.4%- 12.6%- 3.7% - 12.0%
2018 2019 2020 2018 2019 2020 2018 2019 2020
+ 0.9% + 4.3% + 12.5%+ 10.5%
Sold Listings
Sold Listings
Single
Family
Year-Over-Year
Change
Condo/TIC/
Coop
Year-Over-Year
Change
Apr-2019 226 +18.9% 319 +7.8%
May-2019 239 -4.0% 337 +8.0%
Jun-2019 190 -17.7% 265 -12.5%
Jul-2019 213 +10.9% 244 -10.9%
Aug-2019 168 -12.0% 207 -20.4%
Sep-2019 126 -14.3% 192 +4.9%
Oct-2019 255 +2.8% 259 -11.6%
Nov-2019 200 -9.1% 272 +3.0%
Dec-2019 175 +9.4% 215 +10.8%
Jan-2020 96 -4.0% 150 +31.6%
Feb-2020 114 +0.9% 179 +9.1%
Mar-2020 157 -8.7% 217 -18.1%
12-Month Avg 180 -2.4% 238 -2.3%
Historical Sold Listings by Month
A count of the actual sales that closed in a given month.
Current as of April 11, 2020. All data from the San Francisco MLS. Report © 2020 ShowingTime. | 6
200
289
172
265
157
217
Single Family Condo/TIC/Coop
March
0
100
200
300
400
1-2005 1-2006 1-2007 1-2008 1-2009 1-2010 1-2011 1-2012 1-2013 1-2014 1-2015 1-2016 1-2017 1-2018 1-2019 1-2020
Single Family Condo/TIC/Coop
402
640
385
543
367
546
Single Family Condo/TIC/Coop
Year to Date
2018 2019 2020
- 18.1%- 8.3%- 8.7%- 14.0% - 15.2%- 4.7%- 4.2% + 0.6%
2018 2019 2020 2018 2019 2020 2018 2019 2020
+ 15.6% + 3.1% + 7.7%+ 0.7%
Median Sales Price
Median Sales Price
Single
Family
Year-Over-Year
Change
Condo/TIC/
Coop
Year-Over-Year
Change
Apr-2019 $1,612,500 -2.2% $1,225,000 -2.0%
May-2019 $1,685,000 +4.1% $1,245,000 -1.0%
Jun-2019 $1,750,000 +7.7% $1,299,000 +11.0%
Jul-2019 $1,576,000 -3.1% $1,222,444 +6.3%
Aug-2019 $1,602,500 +4.2% $1,281,250 +3.8%
Sep-2019 $1,540,000 +2.7% $1,325,000 +15.2%
Oct-2019 $1,650,000 +3.1% $1,325,000 +9.1%
Nov-2019 $1,604,000 +12.4% $1,180,000 -1.1%
Dec-2019 $1,450,000 -2.8% $1,200,000 +2.6%
Jan-2020 $1,462,500 +5.3% $1,172,000 +12.7%
Feb-2020 $1,610,000 +7.3% $1,300,000 +15.0%
Mar-2020 $1,652,500 +0.2% $1,270,000 +2.0%
12-Month Avg* $1,607,500 +3.0% $1,250,000 +4.2%
Historical Median Sales Price by Month
Point at which half of the sales sold for more and half sold for less, not accounting for seller concessions, in a given month.
* Median Sales Price for all properties from April 2019 through March 2020. This is not the
average of the individual figures above.
Current as of April 11, 2020. All data from the San Francisco MLS. Report © 2020 ShowingTime. | 7
$1,687,500
$1,250,000
$1,650,000
$1,245,000
$1,652,500
$1,270,000
Single Family Condo/TIC/Coop
March
$500,000
$750,000
$1,000,000
$1,250,000
$1,500,000
$1,750,000
$2,000,000
1-2005 1-2006 1-2007 1-2008 1-2009 1-2010 1-2011 1-2012 1-2013 1-2014 1-2015 1-2016 1-2017 1-2018 1-2019 1-2020
Single Family Condo/TIC/Coop
$1,609,000
$1,170,000
$1,549,000
$1,170,000
$1,595,000
$1,250,000
Single Family Condo/TIC/Coop
Year to Date
2018 2019 2020
+ 2.0%- 0.4%+ 0.2%- 2.2% 0.0%+ 3.0%- 3.7% + 6.8%
2018 2019 2020 2018 2019 2020 2018 2019 2020
+ 25.0% + 23.8% + 4.9%+ 9.9%
Average Sales Price
Avg. Sales Price
Single
Family
Year-Over-Year
Change
Condo/TIC/
Coop
Year-Over-Year
Change
Apr-2019 $2,235,456 +2.3% $1,363,254 +2.1%
May-2019 $2,141,318 +6.0% $1,335,560 -4.5%
Jun-2019 $2,148,466 +10.6% $1,431,991 +7.1%
Jul-2019 $1,959,574 -0.5% $1,310,687 +5.8%
Aug-2019 $1,872,478 +3.3% $1,386,808 +2.9%
Sep-2019 $2,075,848 +14.1% $1,449,604 +15.4%
Oct-2019 $1,912,555 -11.1% $1,447,421 +7.8%
Nov-2019 $1,986,456 +6.6% $1,322,998 +4.7%
Dec-2019 $1,948,749 +9.1% $1,265,139 -4.9%
Jan-2020 $2,212,609 +26.3% $1,319,209 +12.1%
Feb-2020 $1,956,102 +4.5% $1,404,496 +3.0%
Mar-2020 $2,096,326 +2.4% $1,378,517 +3.2%
12-Month Avg* $2,042,250 +4.4% $1,367,229 +3.7%
Historical Average Sales Price by Month
Average sales price for all closed sales, not accounting for seller concessions, in a given month.
* Avg. Sales Price for all properties from April 2019 through March 2020. This is not the average
of the individual figures above.
Current as of April 11, 2020. All data from the San Francisco MLS. Report © 2020 ShowingTime. | 8
$1,949,288
$1,371,131
$2,046,399
$1,335,673
$2,096,326
$1,378,517
Single Family Condo/TIC/Coop
March
$500,000
$1,000,000
$1,500,000
$2,000,000
$2,500,000
1-2005 1-2006 1-2007 1-2008 1-2009 1-2010 1-2011 1-2012 1-2013 1-2014 1-2015 1-2016 1-2017 1-2018 1-2019 1-2020
Single Family Condo/TIC/Coop
$1,953,097
$1,325,939
$1,918,458
$1,310,721
$2,083,150
$1,370,741
Single Family Condo/TIC/Coop
Year to Date
2018 2019 2020
+ 3.2%- 2.6%+ 2.4%+ 5.0% - 1.1%+ 8.6%- 1.8% + 4.6%
2018 2019 2020 2018 2019 2020 2018 2019 2020
+ 3.1% + 10.8% + 4.2%+ 6.9%
Days on Market Until Sale
Days on Market
Single
Family
Year-Over-Year
Change
Condo/TIC/
Coop
Year-Over-Year
Change
Apr-2019 26 +44.4% 38 +46.2%
May-2019 22 +10.0% 29 +7.4%
Jun-2019 22 +22.2% 31 +14.8%
Jul-2019 23 +9.5% 33 +6.5%
Aug-2019 25 +13.6% 33 -8.3%
Sep-2019 28 +16.7% 34 +13.3%
Oct-2019 22 -8.3% 28 +3.7%
Nov-2019 24 -7.7% 34 -10.5%
Dec-2019 31 -6.1% 48 +9.1%
Jan-2020 38 -2.6% 62 +12.7%
Feb-2020 25 -13.8% 29 -27.5%
Mar-2020 20 -23.1% 27 -22.9%
12-Month Avg* 25 +3.0% 35 +5.0%
Historical Days on Market Until Sale by Month
Average number of days between when a property is listed and when an offer is accepted in a given month.
* Days on Market for all properties from April 2019 through March 2020. This is not the average of
the individual figures above.
Current as of April 11, 2020. All data from the San Francisco MLS. Report © 2020 ShowingTime. | 9
22
2626
35
20
27
Single Family Condo/TIC/Coop
March
0
20
40
60
80
100
120
1-2005 1-2006 1-2007 1-2008 1-2009 1-2010 1-2011 1-2012 1-2013 1-2014 1-2015 1-2016 1-2017 1-2018 1-2019 1-2020
Single Family Condo/TIC/Coop
25
36
30
40
26
37
Single Family Condo/TIC/Coop
Year to Date
2018 2019 2020
- 22.9%+ 34.6%- 23.1%+ 18.2% + 11.1%- 13.3%+ 20.0% - 7.5%
2018 2019 2020 2018 2019 2020 2018 2019 2020
- 29.0% - 28.6% - 10.0%- 18.8%
Inventory of Active Listings
Active Listings
Single
Family
Year-Over-Year
Change
Condo/TIC/
Coop
Year-Over-Year
Change
Apr-2019 482 +11.3% 733 +4.1%
May-2019 473 +16.5% 726 +0.3%
Jun-2019 491 +14.2% 708 -1.1%
Jul-2019 463 +0.2% 727 +10.7%
Aug-2019 514 +4.5% 752 +12.2%
Sep-2019 586 -1.2% 954 +12.2%
Oct-2019 536 -1.1% 906 +8.5%
Nov-2019 428 -7.8% 735 +2.9%
Dec-2019 310 -5.8% 531 +4.7%
Jan-2020 377 -15.7% 647 -6.0%
Feb-2020 422 -8.3% 680 -5.3%
Mar-2020 289 -38.4% 420 -41.3%
12-Month Avg* 448 -2.8% 710 +0.2%
Historical Inventory of Active Listings by Month
The number of properties available for sale in active status at the end of a given month.
* Active Listings for all properties from April 2019 through March 2020. This is not the average of
the individual figures above.
Current as of April 11, 2020. All data from the San Francisco MLS. Report © 2020 ShowingTime. | 10
396
655
469
715
289
420
Single Family Condo/TIC/Coop
March
0
250
500
750
1,000
1,250
1,500
1-2005 1-2006 1-2007 1-2008 1-2009 1-2010 1-2011 1-2012 1-2013 1-2014 1-2015 1-2016 1-2017 1-2018 1-2019 1-2020
Single Family Condo/TIC/Coop
2018 2019 2020
- 41.3%+ 9.2%- 38.4%+ 18.4%
2018 2019 2020
+ 2.1% + 3.6%
% of Properties Sold Over List Price
% of Properties
Sold Over List Price
Single
Family
Year-Over-Year
Change
Condo/TIC/
Coop
Year-Over-Year
Change
Apr-2019 73.9% -5.1% 55.2% -17.1%
May-2019 79.9% -5.7% 65.0% -3.8%
Jun-2019 81.1% -8.2% 64.5% -5.6%
Jul-2019 82.6% -3.3% 70.5% +11.7%
Aug-2019 82.1% +1.9% 58.9% +2.1%
Sep-2019 74.6% -7.9% 59.4% -6.3%
Oct-2019 80.8% -2.3% 65.3% -4.4%
Nov-2019 77.5% +5.3% 64.3% +18.0%
Dec-2019 66.3% -2.6% 47.9% +4.4%
Jan-2020 60.4% +0.7% 33.3% -19.2%
Feb-2020 71.9% -7.7% 62.6% +18.1%
Mar-2020 79.5% +8.5% 60.8% +9.0%
12-Month Avg 77.0% -2.7% 60.0% -0.8%
Historical % of Properties Sold Over List Price by Month
Percentage found when dividing the number of properties sold by properties sold over its original list price, not accounting for seller
concessions.
* % of Properties Sold Over List Price for all properties from April 2019 through March 2020. This
is not the average of the individual figures above.
Current as of April 11, 2020. All data from the San Francisco MLS. Report © 2020 ShowingTime. | 11
77.0%
59.2%
73.3%
55.8%
79.5%
60.8%
Single Family Condo/TIC/Coop
March
0.0%
20.0%
40.0%
60.0%
80.0%
100.0%
1-2005 1-2006 1-2007 1-2008 1-2009 1-2010 1-2011 1-2012 1-2013 1-2014 1-2015 1-2016 1-2017 1-2018 1-2019 1-2020
Single Family Condo/TIC/Coop
76.4%
53.1%
71.2%
51.9%
72.1%
53.8%
Single Family Condo/TIC/Coop
Year to Date
2018 2019 2020
+ 9.0%- 5.7%+ 8.5%- 4.8% - 2.3%+ 1.3%- 6.8% + 3.7%
2018 2019 2020 2018 2019 2020 2018 2019 2020
+ 3.2% + 5.7% - 3.3%- 4.5%
% of List Price Received
% of List Price
Received
Single
Family
Year-Over-Year
Change
Condo/TIC/
Coop
Year-Over-Year
Change
Apr-2019 112.4% -5.8% 104.9% -3.7%
May-2019 113.2% -5.3% 107.4% -0.9%
Jun-2019 115.3% -4.0% 107.2% -0.1%
Jul-2019 115.4% -1.5% 107.6% +0.5%
Aug-2019 115.3% +0.4% 105.8% +0.2%
Sep-2019 112.7% -2.3% 105.2% -1.2%
Oct-2019 114.0% 0.0% 105.9% -1.7%
Nov-2019 111.9% +0.6% 105.1% +1.0%
Dec-2019 109.7% -0.7% 103.2% +1.1%
Jan-2020 107.1% +1.0% 100.4% -0.6%
Feb-2020 111.8% -0.7% 105.2% +1.0%
Mar-2020 114.7% +3.8% 104.5% -0.2%
12-Month Avg* 113.1% -1.6% 105.5% -0.6%
Historical % of List Price Received by Month
Percentage found when dividing a property’s sales price by its most recent list price, then taking the average for all properties sold in a given
month, not accounting for seller concessions.
* % of List Price Received for all properties from April 2019 through March 2020. This is not the
average of the individual figures above.
Current as of April 11, 2020. All data from the San Francisco MLS. Report © 2020 ShowingTime. | 12
117.5%
107.1%110.5%
104.7%
114.7%
104.5%
Single Family Condo/TIC/Coop
March
115.8%
105.2%
110.0%
103.8%
111.8%
103.6%
Single Family Condo/TIC/Coop
Year to Date
90.0%
100.0%
110.0%
120.0%
130.0%
1-2005 1-2006 1-2007 1-2008 1-2009 1-2010 1-2011 1-2012 1-2013 1-2014 1-2015 1-2016 1-2017 1-2018 1-2019 1-2020
Single Family Condo/TIC/Coop
2018 2019 2020
- 0.2%- 2.2%+ 3.8%- 6.0%
2018 2019 2020
+ 4.5% + 2.1%
2018 2019 2020
- 0.2%- 1.3%+ 1.6%- 5.0%
2018 2019 2020
+ 3.9% + 1.4%
Housing Affordability Ratio
Affordability Ratio
Single
Family
Year-Over-Year
Change
Condo/TIC/
Coop
Year-Over-Year
Change
Apr-2019 31 +6.9% 48 +6.7%
May-2019 30 0.0% 47 +6.8%
Jun-2019 29 -3.3% 45 -6.3%
Jul-2019 33 +10.0% 49 0.0%
Aug-2019 34 +9.7% 49 +8.9%
Sep-2019 34 +9.7% 47 0.0%
Oct-2019 33 +17.9% 48 +17.1%
Nov-2019 33 +3.1% 52 +20.9%
Dec-2019 36 +9.1% 51 +6.3%
Jan-2020 37 +5.7% 54 0.0%
Feb-2020 34 +3.0% 49 -3.9%
Mar-2020 32 +6.7% 48 +2.1%
12-Month Avg* 33 +3.1% 31 +2.4%
Historical Housing Affordability Ratio by Month
This index measures housing affordability for the region. For example, an index of 120 means the median household income is 120% of what is
necessary to qualify for the median-priced home under prevailing interest rates. A higher number means greater affordability.
* Affordability Ratio for all properties from April 2019 through March 2020. This is not the average
of the individual figures above.
Current as of April 11, 2020. All data from the San Francisco MLS. Report © 2020 ShowingTime. | 13
29
46
30
47
32
48
Single Family Condo/TIC/Coop
March
20
40
60
80
100
1-2005 1-2006 1-2007 1-2008 1-2009 1-2010 1-2011 1-2012 1-2013 1-2014 1-2015 1-2016 1-2017 1-2018 1-2019 1-2020
Single Family Condo/TIC/Coop
2018 2019 2020
+ 2.1%+ 2.2%+ 6.7%+ 3.4%
2018 2019 2020
- 21.6% - 9.8%
31
49
32
49
33
49
Single Family Condo/TIC/Coop
Year to Date
2018 2019 2020
0.0%0.0%+ 3.1%+ 3.2%
2018 2019 2020
- 20.5% - 5.8%
Months Supply of Inventory
Months Supply
Single
Family
Year-Over-Year
Change
Condo/TIC/
Coop
Year-Over-Year
Change
Apr-2019 2.6 +13.0% 3.0 +7.1%
May-2019 2.6 +23.8% 2.9 0.0%
Jun-2019 2.7 +17.4% 2.9 +3.6%
Jul-2019 2.5 +4.2% 3.1 +19.2%
Aug-2019 2.8 +7.7% 3.2 +23.1%
Sep-2019 3.2 0.0% 4.0 +21.2%
Oct-2019 2.9 0.0% 3.8 +15.2%
Nov-2019 2.3 -8.0% 3.1 +10.7%
Dec-2019 1.7 -5.6% 2.2 +10.0%
Jan-2020 2.1 -12.5% 2.7 -3.6%
Feb-2020 2.3 -8.0% 2.8 -3.4%
Mar-2020 1.6 -36.0% 1.8 -40.0%
12-Month Avg* 2.4 -0.6% 3.0 +4.9%
Historical Months Supply of Inventory by Month
The inventory of homes for sale at the end of a given month, divided by the average monthly pending sales from the last 12 months.
* Months Supply for all properties from April 2019 through March 2020. This is not the average of
the individual figures above.
Current as of April 11, 2020. All data from the San Francisco MLS. Report © 2020 ShowingTime. | 14
2.1
2.62.5
3.0
1.6
1.8
Single Family Condo/TIC/Coop
March
0.0
2.0
4.0
6.0
8.0
10.0
1-2005 1-2006 1-2007 1-2008 1-2009 1-2010 1-2011 1-2012 1-2013 1-2014 1-2015 1-2016 1-2017 1-2018 1-2019 1-2020
Single Family Condo/TIC/Coop
2018 2019 2020
- 40.0%+ 15.4%- 36.0%+ 19.0%
2018 2019 2020
0.0% - 3.7%
All Properties Activity Overview
Key metrics by report month and for year-to-date (YTD) starting from the first of the year.
Key Metrics Historical Sparkbars 3-2019 3-2020 Percent Change YTD 2019 YTD 2020 Percent Change
Current as of April 11, 2020. All data from the San Francisco MLS. Report © 2020 ShowingTime. | 15
Months Supply 2.8 1.7 - 39.3% -- -- --
Affordability Ratio 36 37 + 2.8%
% of List Price Received 107.0% 108.8% + 1.7% 106.3%
37
61.2% + 2.2%
+ 0.6%
37 0.0%
106.9%
% of Properties Sold Over List Price 62.7% 68.6% + 9.4% 59.9%
Active Listings 1,184 709 - 40.1% --
Avg. Sales Price $1,615,409 $1,678,727 + 3.9% $1,562,854
Days on Market 31 24 - 22.6% 36
$1,400,000 + 7.7%
+ 6.0%
33 - 8.3%
$1,656,642
-- --
Sold Listings 437 374 - 14.4% 928 913 - 1.6%
Median Sales Price $1,395,000 $1,450,000 + 3.9% $1,300,000
- 23.6%
Pending Sales 509 327 - 35.8% 1,091 957 - 12.3%
New Listings 594 257 - 56.7% 1,671 1,276
3-2017 3-2018 3-2019 3-2020
3-2017 3-2018 3-2019 3-2020
3-2017 3-2018 3-2019 3-2020
3-2017 3-2018 3-2019 3-2020
3-2017 3-2018 3-2019 3-2020
3-2017 3-2018 3-2019 3-2020
3-2017 3-2018 3-2019 3-2020
3-2017 3-2018 3-2019 3-2020
3-2017 3-2018 3-2019 3-2020
3-2017 3-2018 3-2019 3-2020
3-2017 3-2018 3-2019 3-2020
Activity by District
SF District 1: Northwest (Sea Cliff, Lake, Jordan Park / Laurel Heights, Outer Richmond, Central Richmond, Inner Richmond, Lone Mountain)
SF District 2: Central West (Outer Sunset, Central Sunset, Inner Sunset, Outer Parkside, Parkside, Inner Parkside, Golden Gate Heights)
SF District 3: Southwest (Pine Lake Park, Lake Shore, Merced Manor, Stonestown, Lakeside, Merced Heights, Ingleside, Ingleside Heights, Oceanview)
SF District 4: Twin Peaks W (Forest Hill (& Ext), W Portal, St Francis Wd, Balboa Terr, Mt Dav Manor, Ingleside Terr, Monterey Hts, Wstwd Pk & H'lnds, Shrwd Fst, Miraloma Pk, Dmnd Hts, Mdtwn Terr)
SF District 5: Central (Haight Ashbury, Cole Vly / Prnssus Hts, Clarndn Hts, Corona Hts, Twin Pks, Glen Pk, Noe Vly, Eureka Vly / Dolores Hts, Mission Dolores, Duboce Trngl, Buena Vista / Ashbury Hts)
SF District 6: Central North (Lower Pacific Heights, Anza Vista, Western Addition, North Panhandle, Alamo Square, Hayes Valley)
SF District 7: North (Marina, Cow Hollow, Presidio Heights, Pacific Heights)
SF District 8: Northeast (North Waterfront, North Beach, Russian Hill, Telegraph Hill, Nob Hill, Financial District / Barbary Coast, Downtown, Van Ness / Civic Center, Tenderloin)
SF District 9: Central East (Yerba Buena, South Beach, South of Market, Mission Bay, Inner Mission, Potrero Hill, Central Waterfront / Dogpatch, Bernal Heights)
SF District 10: Southeast (Outer Mission, Mission Terr, Excelsior, Portola, Bayview, Silver Terr, Hunters Pt, Candlestick Pt, Bayview Hts, Little Hollywood, Visitation Vly, Crocker Amazon)
3-2019 3-2020 + / – 3-2019 3-2020 + / – 3-2019 3-2020 + / – 3-2019 3-2020 + / – 3-2019 3-2020 + / –
Single Family
1 SF District 1 38 21 -44.7% 15 12 -20.0% $2,150,000 $2,350,000 +9.3% 19 13 -31.6% 2.3 1.4 -39.1%
2 SF District 2 63 29 -54.0% 33 31 -6.1% $1,605,000 $1,500,000 -6.5% 18 20 +11.1% 1.9 0.9 -52.6%
3 SF District 3 28 21 -25.0% 7 9 +28.6% $1,100,000 $1,150,000 +4.5% 25 21 -16.0% 2.3 1.7 -26.1%
4 SF District 4 51 27 -47.1% 25 25 0.0% $1,605,000 $1,940,000 +20.9% 23 15 -34.8% 1.8 1.1 -38.9%
5 SF District 5 75 48 -36.0% 31 24 -22.6% $2,350,000 $2,687,000 +14.3% 27 21 -22.2% 2.8 1.8 -35.7%
6 SF District 6 16 11 -31.3% 6 4 -33.3% $3,537,500 $2,650,000 -25.1% 30 6 -80.0% 4.3 3.3 -23.3%
7 SF District 7 35 22 -37.1% 8 10 +25.0% $5,200,000 $4,412,500 -15.1% 45 34 -24.4% 4.4 2.6 -40.9%
8 SF District 8 18 16 -11.1% 1 1 0.0% $5,600,000 $3,850,000 -31.3% 50 44 -12.0% 8.6 6.8 -20.9%
9 SF District 9 63 42 -33.3% 14 19 +35.7% $1,702,500 $1,550,000 -9.0% 17 25 +47.1% 3.2 2.2 -31.3%
10 SF District 10 82 52 -36.6% 32 22 -31.3% $1,145,000 $1,207,500 +5.5% 35 20 -42.9% 2.2 1.5 -31.8%
Condo/TIC/Coop
1 SF District 1 31 24 -22.6% 14 10 -28.6% $1,300,000 $1,602,500 +23.3% 25 32 +28.0% 2.2 1.9 -13.6%
2 SF District 2 6 4 -33.3% 3 5 +66.7% $1,425,000 $1,070,000 -24.9% 27 19 -29.6% 1.4 0.9 -35.7%
3 SF District 3 12 3 -75.0% 1 1 0.0% $900,000 $875,000 -2.8% 14 88 +528.6% 4.3 0.9 -79.1%
4 SF District 4 16 6 -62.5% 4 5 +25.0% $751,250 $625,000 -16.8% 52 63 +21.2% 3.5 1.0 -71.4%
5 SF District 5 79 43 -45.6% 33 34 +3.0% $1,400,000 $1,425,000 +1.8% 21 22 +4.8% 2.3 1.2 -47.8%
6 SF District 6 67 27 -59.7% 26 17 -34.6% $1,048,524 $1,365,000 +30.2% 43 18 -58.1% 3.2 1.2 -62.5%
7 SF District 7 70 33 -52.9% 41 15 -63.4% $1,541,000 $1,640,000 +6.4% 32 26 -18.8% 2.8 1.3 -53.6%
8 SF District 8 163 79 -51.5% 46 34 -26.1% $1,040,000 $1,212,500 +16.6% 48 24 -50.0% 4.0 2.1 -47.5%
9 SF District 9 245 177 -27.8% 89 92 +3.4% $1,180,000 $1,250,000 +5.9% 32 29 -9.4% 2.8 2.2 -21.4%
10 SF District 10 26 24 -7.7% 8 4 -50.0% $675,500 $860,000 +27.3% 52 49 -5.8% 4.5 4.4 -2.2%
Key metrics by report month for the districts of San Fransisco.
Current as of April 11, 2020. All data from the San Francisco MLS. Report © 2020 ShowingTime. | 16
Active Listings Sold Listings Median Sales Price Days on Market Months Supply

More Related Content

What's hot

San Francisco market report July 2020
San Francisco market report July 2020San Francisco market report July 2020
San Francisco market report July 2020Ronny Budiutama
 
San Francisco Market Focus Report March 2019
San Francisco Market Focus Report March 2019San Francisco Market Focus Report March 2019
San Francisco Market Focus Report March 2019Ronny Budiutama
 
San Francisco Market Focus Report Feb 2019
San Francisco Market Focus Report Feb 2019San Francisco Market Focus Report Feb 2019
San Francisco Market Focus Report Feb 2019Ronny Budiutama
 
San Francisco Market Focus Report April 2019
San Francisco Market Focus Report April 2019San Francisco Market Focus Report April 2019
San Francisco Market Focus Report April 2019Ronny Budiutama
 
San Fancisco Market Focus Report June 2019
San Fancisco Market Focus Report June 2019San Fancisco Market Focus Report June 2019
San Fancisco Market Focus Report June 2019Ronny Budiutama
 
San Francisco Market Report March 2021
San Francisco Market Report March 2021San Francisco Market Report March 2021
San Francisco Market Report March 2021Ronny Budiutama
 
San Francisco Market Data October 2020
San Francisco Market Data October 2020San Francisco Market Data October 2020
San Francisco Market Data October 2020Ronny Budiutama
 
San Francisco Market Report December 2020
San Francisco Market Report December 2020San Francisco Market Report December 2020
San Francisco Market Report December 2020Ronny Budiutama
 
San Francisco Market Focus Report Jan 2019
San Francisco Market Focus Report Jan 2019San Francisco Market Focus Report Jan 2019
San Francisco Market Focus Report Jan 2019Ronny Budiutama
 
San Francisco market report May 2020
San Francisco market report May 2020San Francisco market report May 2020
San Francisco market report May 2020Ronny Budiutama
 
San Francisco Market Focus Report July 2019
San Francisco Market Focus Report July 2019San Francisco Market Focus Report July 2019
San Francisco Market Focus Report July 2019Ronny Budiutama
 
San Francisco Market Focus Report Nov 2020
San Francisco Market Focus Report Nov 2020San Francisco Market Focus Report Nov 2020
San Francisco Market Focus Report Nov 2020Ronny Budiutama
 
San Francisco Market Focus Report May 2019
San Francisco Market Focus Report May 2019San Francisco Market Focus Report May 2019
San Francisco Market Focus Report May 2019Ronny Budiutama
 
San Francisco Market Report January 2021
San Francisco Market Report January 2021San Francisco Market Report January 2021
San Francisco Market Report January 2021Ronny Budiutama
 
San Francisco Market Report April 2021
San Francisco Market Report April 2021San Francisco Market Report April 2021
San Francisco Market Report April 2021Ronny Budiutama
 
San Francisco Market Report May 2021
San Francisco Market Report May 2021San Francisco Market Report May 2021
San Francisco Market Report May 2021Ronny Budiutama
 
San Francisco Market Report June 2021
San Francisco Market Report June 2021San Francisco Market Report June 2021
San Francisco Market Report June 2021Ronny Budiutama
 
San Francisco Market Report August 2021
San Francisco Market Report August 2021San Francisco Market Report August 2021
San Francisco Market Report August 2021Ronny Budiutama
 
San Francisco Market Report For July 2021
San Francisco Market Report For July 2021San Francisco Market Report For July 2021
San Francisco Market Report For July 2021Ronny Budiutama
 
San Francisco Market Focus Report August 2019
San Francisco Market Focus Report August 2019San Francisco Market Focus Report August 2019
San Francisco Market Focus Report August 2019Ronny Budiutama
 

What's hot (20)

San Francisco market report July 2020
San Francisco market report July 2020San Francisco market report July 2020
San Francisco market report July 2020
 
San Francisco Market Focus Report March 2019
San Francisco Market Focus Report March 2019San Francisco Market Focus Report March 2019
San Francisco Market Focus Report March 2019
 
San Francisco Market Focus Report Feb 2019
San Francisco Market Focus Report Feb 2019San Francisco Market Focus Report Feb 2019
San Francisco Market Focus Report Feb 2019
 
San Francisco Market Focus Report April 2019
San Francisco Market Focus Report April 2019San Francisco Market Focus Report April 2019
San Francisco Market Focus Report April 2019
 
San Fancisco Market Focus Report June 2019
San Fancisco Market Focus Report June 2019San Fancisco Market Focus Report June 2019
San Fancisco Market Focus Report June 2019
 
San Francisco Market Report March 2021
San Francisco Market Report March 2021San Francisco Market Report March 2021
San Francisco Market Report March 2021
 
San Francisco Market Data October 2020
San Francisco Market Data October 2020San Francisco Market Data October 2020
San Francisco Market Data October 2020
 
San Francisco Market Report December 2020
San Francisco Market Report December 2020San Francisco Market Report December 2020
San Francisco Market Report December 2020
 
San Francisco Market Focus Report Jan 2019
San Francisco Market Focus Report Jan 2019San Francisco Market Focus Report Jan 2019
San Francisco Market Focus Report Jan 2019
 
San Francisco market report May 2020
San Francisco market report May 2020San Francisco market report May 2020
San Francisco market report May 2020
 
San Francisco Market Focus Report July 2019
San Francisco Market Focus Report July 2019San Francisco Market Focus Report July 2019
San Francisco Market Focus Report July 2019
 
San Francisco Market Focus Report Nov 2020
San Francisco Market Focus Report Nov 2020San Francisco Market Focus Report Nov 2020
San Francisco Market Focus Report Nov 2020
 
San Francisco Market Focus Report May 2019
San Francisco Market Focus Report May 2019San Francisco Market Focus Report May 2019
San Francisco Market Focus Report May 2019
 
San Francisco Market Report January 2021
San Francisco Market Report January 2021San Francisco Market Report January 2021
San Francisco Market Report January 2021
 
San Francisco Market Report April 2021
San Francisco Market Report April 2021San Francisco Market Report April 2021
San Francisco Market Report April 2021
 
San Francisco Market Report May 2021
San Francisco Market Report May 2021San Francisco Market Report May 2021
San Francisco Market Report May 2021
 
San Francisco Market Report June 2021
San Francisco Market Report June 2021San Francisco Market Report June 2021
San Francisco Market Report June 2021
 
San Francisco Market Report August 2021
San Francisco Market Report August 2021San Francisco Market Report August 2021
San Francisco Market Report August 2021
 
San Francisco Market Report For July 2021
San Francisco Market Report For July 2021San Francisco Market Report For July 2021
San Francisco Market Report For July 2021
 
San Francisco Market Focus Report August 2019
San Francisco Market Focus Report August 2019San Francisco Market Focus Report August 2019
San Francisco Market Focus Report August 2019
 

Similar to San Francisco Market Report for March 2020

San Francisco Market Report February 2021
San Francisco Market Report February 2021San Francisco Market Report February 2021
San Francisco Market Report February 2021Ronny Budiutama
 
San Francisco market focus report June 2018
San Francisco market focus report June 2018San Francisco market focus report June 2018
San Francisco market focus report June 2018Ronny Budiutama
 
San Francisco Market Report March 2022
San Francisco Market Report March 2022San Francisco Market Report March 2022
San Francisco Market Report March 2022Ronny Budiutama
 
San Francisco Market Report September 2021
San Francisco Market Report September 2021San Francisco Market Report September 2021
San Francisco Market Report September 2021Ronny Budiutama
 
San Francisco Market Focus April 2018
San Francisco Market Focus April 2018San Francisco Market Focus April 2018
San Francisco Market Focus April 2018Ronny Budiutama
 
San Francisco Market Focus Report July
San Francisco Market Focus Report JulySan Francisco Market Focus Report July
San Francisco Market Focus Report JulyRonny Budiutama
 
San Francisco Market Report July 2022.pdf
San Francisco Market Report July 2022.pdfSan Francisco Market Report July 2022.pdf
San Francisco Market Report July 2022.pdfRonny Budiutama
 
San Francisco Market Focus Report May
San Francisco Market Focus Report MaySan Francisco Market Focus Report May
San Francisco Market Focus Report MayRonny Budiutama
 
San Francisco Market Report February 2023
San Francisco Market Report February 2023San Francisco Market Report February 2023
San Francisco Market Report February 2023Ronny Budiutama
 
San Francisco Market Focus February 2018
San Francisco Market Focus February 2018San Francisco Market Focus February 2018
San Francisco Market Focus February 2018Ronny Budiutama
 
San Francisco Market Focus April 2017
San Francisco Market Focus April 2017San Francisco Market Focus April 2017
San Francisco Market Focus April 2017Ronny Budiutama
 

Similar to San Francisco Market Report for March 2020 (11)

San Francisco Market Report February 2021
San Francisco Market Report February 2021San Francisco Market Report February 2021
San Francisco Market Report February 2021
 
San Francisco market focus report June 2018
San Francisco market focus report June 2018San Francisco market focus report June 2018
San Francisco market focus report June 2018
 
San Francisco Market Report March 2022
San Francisco Market Report March 2022San Francisco Market Report March 2022
San Francisco Market Report March 2022
 
San Francisco Market Report September 2021
San Francisco Market Report September 2021San Francisco Market Report September 2021
San Francisco Market Report September 2021
 
San Francisco Market Focus April 2018
San Francisco Market Focus April 2018San Francisco Market Focus April 2018
San Francisco Market Focus April 2018
 
San Francisco Market Focus Report July
San Francisco Market Focus Report JulySan Francisco Market Focus Report July
San Francisco Market Focus Report July
 
San Francisco Market Report July 2022.pdf
San Francisco Market Report July 2022.pdfSan Francisco Market Report July 2022.pdf
San Francisco Market Report July 2022.pdf
 
San Francisco Market Focus Report May
San Francisco Market Focus Report MaySan Francisco Market Focus Report May
San Francisco Market Focus Report May
 
San Francisco Market Report February 2023
San Francisco Market Report February 2023San Francisco Market Report February 2023
San Francisco Market Report February 2023
 
San Francisco Market Focus February 2018
San Francisco Market Focus February 2018San Francisco Market Focus February 2018
San Francisco Market Focus February 2018
 
San Francisco Market Focus April 2017
San Francisco Market Focus April 2017San Francisco Market Focus April 2017
San Francisco Market Focus April 2017
 

More from Ronny Budiutama

San Francisco January 2024 Market Report
San Francisco January 2024 Market ReportSan Francisco January 2024 Market Report
San Francisco January 2024 Market ReportRonny Budiutama
 
San Francisco December 2023 Market Report
San Francisco December 2023 Market ReportSan Francisco December 2023 Market Report
San Francisco December 2023 Market ReportRonny Budiutama
 
San Francisco November 2023 Market Report
San Francisco November 2023 Market ReportSan Francisco November 2023 Market Report
San Francisco November 2023 Market ReportRonny Budiutama
 
2023 Annual San Francisco Housing Market
2023 Annual San Francisco Housing Market2023 Annual San Francisco Housing Market
2023 Annual San Francisco Housing MarketRonny Budiutama
 
October 2023 Report: San Francisco Real Estate Market Insights
October 2023 Report: San Francisco Real Estate Market InsightsOctober 2023 Report: San Francisco Real Estate Market Insights
October 2023 Report: San Francisco Real Estate Market InsightsRonny Budiutama
 
CA Weekly MLS Market Data Report - August 2023
CA Weekly MLS Market Data Report - August 2023CA Weekly MLS Market Data Report - August 2023
CA Weekly MLS Market Data Report - August 2023Ronny Budiutama
 
San Francisco Market Report July 2023.pdf
San Francisco Market Report July 2023.pdfSan Francisco Market Report July 2023.pdf
San Francisco Market Report July 2023.pdfRonny Budiutama
 
San Francisco May 2023 Market Report.pdf
San Francisco May 2023 Market Report.pdfSan Francisco May 2023 Market Report.pdf
San Francisco May 2023 Market Report.pdfRonny Budiutama
 
San Francisco June 2023 Market Report.pdf
San Francisco June 2023 Market Report.pdfSan Francisco June 2023 Market Report.pdf
San Francisco June 2023 Market Report.pdfRonny Budiutama
 
San Francisco Market Report March 2023.pdf
San Francisco Market Report March 2023.pdfSan Francisco Market Report March 2023.pdf
San Francisco Market Report March 2023.pdfRonny Budiutama
 
San Francisco Market Report January 2023.pdf
San Francisco Market Report January 2023.pdfSan Francisco Market Report January 2023.pdf
San Francisco Market Report January 2023.pdfRonny Budiutama
 
Annual Report on the San Francisco County Housing Market.pdf
Annual Report on the San Francisco County Housing Market.pdfAnnual Report on the San Francisco County Housing Market.pdf
Annual Report on the San Francisco County Housing Market.pdfRonny Budiutama
 
San Francisco Market Report December 2022.pdf
San Francisco Market Report December 2022.pdfSan Francisco Market Report December 2022.pdf
San Francisco Market Report December 2022.pdfRonny Budiutama
 
San Francisco Market Report November 2022.pdf
San Francisco Market Report November 2022.pdfSan Francisco Market Report November 2022.pdf
San Francisco Market Report November 2022.pdfRonny Budiutama
 
San Francisco Market Report October 2022.pdf
San Francisco Market Report October 2022.pdfSan Francisco Market Report October 2022.pdf
San Francisco Market Report October 2022.pdfRonny Budiutama
 
San Francisco Market Report September 2022.pdf
San Francisco Market Report September 2022.pdfSan Francisco Market Report September 2022.pdf
San Francisco Market Report September 2022.pdfRonny Budiutama
 
San Francisco Market Report August 2022.pdf
San Francisco Market Report August 2022.pdfSan Francisco Market Report August 2022.pdf
San Francisco Market Report August 2022.pdfRonny Budiutama
 
San Francisco Market Report June 2022.pdf
San Francisco Market Report June 2022.pdfSan Francisco Market Report June 2022.pdf
San Francisco Market Report June 2022.pdfRonny Budiutama
 
San Francisco Market Report May 2022.
San Francisco Market Report May 2022.San Francisco Market Report May 2022.
San Francisco Market Report May 2022.Ronny Budiutama
 
San Francisco Market Report April 2022.pdf
San Francisco Market Report April 2022.pdfSan Francisco Market Report April 2022.pdf
San Francisco Market Report April 2022.pdfRonny Budiutama
 

More from Ronny Budiutama (20)

San Francisco January 2024 Market Report
San Francisco January 2024 Market ReportSan Francisco January 2024 Market Report
San Francisco January 2024 Market Report
 
San Francisco December 2023 Market Report
San Francisco December 2023 Market ReportSan Francisco December 2023 Market Report
San Francisco December 2023 Market Report
 
San Francisco November 2023 Market Report
San Francisco November 2023 Market ReportSan Francisco November 2023 Market Report
San Francisco November 2023 Market Report
 
2023 Annual San Francisco Housing Market
2023 Annual San Francisco Housing Market2023 Annual San Francisco Housing Market
2023 Annual San Francisco Housing Market
 
October 2023 Report: San Francisco Real Estate Market Insights
October 2023 Report: San Francisco Real Estate Market InsightsOctober 2023 Report: San Francisco Real Estate Market Insights
October 2023 Report: San Francisco Real Estate Market Insights
 
CA Weekly MLS Market Data Report - August 2023
CA Weekly MLS Market Data Report - August 2023CA Weekly MLS Market Data Report - August 2023
CA Weekly MLS Market Data Report - August 2023
 
San Francisco Market Report July 2023.pdf
San Francisco Market Report July 2023.pdfSan Francisco Market Report July 2023.pdf
San Francisco Market Report July 2023.pdf
 
San Francisco May 2023 Market Report.pdf
San Francisco May 2023 Market Report.pdfSan Francisco May 2023 Market Report.pdf
San Francisco May 2023 Market Report.pdf
 
San Francisco June 2023 Market Report.pdf
San Francisco June 2023 Market Report.pdfSan Francisco June 2023 Market Report.pdf
San Francisco June 2023 Market Report.pdf
 
San Francisco Market Report March 2023.pdf
San Francisco Market Report March 2023.pdfSan Francisco Market Report March 2023.pdf
San Francisco Market Report March 2023.pdf
 
San Francisco Market Report January 2023.pdf
San Francisco Market Report January 2023.pdfSan Francisco Market Report January 2023.pdf
San Francisco Market Report January 2023.pdf
 
Annual Report on the San Francisco County Housing Market.pdf
Annual Report on the San Francisco County Housing Market.pdfAnnual Report on the San Francisco County Housing Market.pdf
Annual Report on the San Francisco County Housing Market.pdf
 
San Francisco Market Report December 2022.pdf
San Francisco Market Report December 2022.pdfSan Francisco Market Report December 2022.pdf
San Francisco Market Report December 2022.pdf
 
San Francisco Market Report November 2022.pdf
San Francisco Market Report November 2022.pdfSan Francisco Market Report November 2022.pdf
San Francisco Market Report November 2022.pdf
 
San Francisco Market Report October 2022.pdf
San Francisco Market Report October 2022.pdfSan Francisco Market Report October 2022.pdf
San Francisco Market Report October 2022.pdf
 
San Francisco Market Report September 2022.pdf
San Francisco Market Report September 2022.pdfSan Francisco Market Report September 2022.pdf
San Francisco Market Report September 2022.pdf
 
San Francisco Market Report August 2022.pdf
San Francisco Market Report August 2022.pdfSan Francisco Market Report August 2022.pdf
San Francisco Market Report August 2022.pdf
 
San Francisco Market Report June 2022.pdf
San Francisco Market Report June 2022.pdfSan Francisco Market Report June 2022.pdf
San Francisco Market Report June 2022.pdf
 
San Francisco Market Report May 2022.
San Francisco Market Report May 2022.San Francisco Market Report May 2022.
San Francisco Market Report May 2022.
 
San Francisco Market Report April 2022.pdf
San Francisco Market Report April 2022.pdfSan Francisco Market Report April 2022.pdf
San Francisco Market Report April 2022.pdf
 

Recently uploaded

call girls in Shahdara (DELHI) 🔝 >༒9953330565🔝 genuine Escort Service 🔝✔️✔️
call girls in Shahdara (DELHI) 🔝 >༒9953330565🔝 genuine Escort Service 🔝✔️✔️call girls in Shahdara (DELHI) 🔝 >༒9953330565🔝 genuine Escort Service 🔝✔️✔️
call girls in Shahdara (DELHI) 🔝 >༒9953330565🔝 genuine Escort Service 🔝✔️✔️9953056974 Low Rate Call Girls In Saket, Delhi NCR
 
Model Call Girl in Shastri Nagar Delhi reach out to us at 🔝8264348440🔝
Model Call Girl in Shastri Nagar Delhi reach out to us at 🔝8264348440🔝Model Call Girl in Shastri Nagar Delhi reach out to us at 🔝8264348440🔝
Model Call Girl in Shastri Nagar Delhi reach out to us at 🔝8264348440🔝soniya singh
 
SSPL The Strand Abodes Kharadi Pune Brochure.pdf
SSPL The Strand Abodes Kharadi Pune Brochure.pdfSSPL The Strand Abodes Kharadi Pune Brochure.pdf
SSPL The Strand Abodes Kharadi Pune Brochure.pdfabbu831446
 
Call Girls In Hari Nagar Dadb Block {8447779280}Hari Nagar {West Delhi Escort...
Call Girls In Hari Nagar Dadb Block {8447779280}Hari Nagar {West Delhi Escort...Call Girls In Hari Nagar Dadb Block {8447779280}Hari Nagar {West Delhi Escort...
Call Girls In Hari Nagar Dadb Block {8447779280}Hari Nagar {West Delhi Escort...asmaqueen5
 
Nanke Area Estate commercial ( Dir. Kat Kuo)
Nanke Area Estate commercial ( Dir. Kat Kuo)Nanke Area Estate commercial ( Dir. Kat Kuo)
Nanke Area Estate commercial ( Dir. Kat Kuo)jessica288382
 
Building Dreams: Newman Leech's Visionary Approach to Real Estate Investment
Building Dreams: Newman Leech's Visionary Approach to Real Estate InvestmentBuilding Dreams: Newman Leech's Visionary Approach to Real Estate Investment
Building Dreams: Newman Leech's Visionary Approach to Real Estate InvestmentNewman George Leech
 
Omaxe Dwarka In Delhi E Brochure Pdf
Omaxe Dwarka In Delhi E Brochure     PdfOmaxe Dwarka In Delhi E Brochure     Pdf
Omaxe Dwarka In Delhi E Brochure Pdfashiyadav24
 
Eco-Efficient Living: Redefining Sustainability through Leech's Green Design ...
Eco-Efficient Living: Redefining Sustainability through Leech's Green Design ...Eco-Efficient Living: Redefining Sustainability through Leech's Green Design ...
Eco-Efficient Living: Redefining Sustainability through Leech's Green Design ...Newman George Leech
 
Call Girls in Janakpuri ↫8447779280↫Short 1500 Night 6000-Escorts Service In ...
Call Girls in Janakpuri ↫8447779280↫Short 1500 Night 6000-Escorts Service In ...Call Girls in Janakpuri ↫8447779280↫Short 1500 Night 6000-Escorts Service In ...
Call Girls in Janakpuri ↫8447779280↫Short 1500 Night 6000-Escorts Service In ...asmaqueen5
 
Low Rate Call Girls in Triveni Complex Delhi Call 9990771857
Low Rate Call Girls in Triveni Complex Delhi Call 9990771857Low Rate Call Girls in Triveni Complex Delhi Call 9990771857
Low Rate Call Girls in Triveni Complex Delhi Call 9990771857delhimodel235
 
Call Girls in Model Town Delhi 💯Call Us 🔝8264348440🔝
Call Girls in Model Town Delhi 💯Call Us 🔝8264348440🔝Call Girls in Model Town Delhi 💯Call Us 🔝8264348440🔝
Call Girls in Model Town Delhi 💯Call Us 🔝8264348440🔝soniya singh
 
9990771857 Call Girls in Noida Sector 03 Noida (Call Girls) Delhi
9990771857 Call Girls in Noida Sector 03 Noida (Call Girls) Delhi9990771857 Call Girls in Noida Sector 03 Noida (Call Girls) Delhi
9990771857 Call Girls in Noida Sector 03 Noida (Call Girls) Delhidelhimodel235
 
Purva Palm Hills Devanahalli, Bangalore E- Brochure.pdf
Purva Palm Hills Devanahalli, Bangalore E- Brochure.pdfPurva Palm Hills Devanahalli, Bangalore E- Brochure.pdf
Purva Palm Hills Devanahalli, Bangalore E- Brochure.pdffaheemali990101
 
Call Girls in shastri nagar Delhi 8264348440 ✅ call girls ❤️
Call Girls in shastri nagar Delhi 8264348440 ✅ call girls ❤️Call Girls in shastri nagar Delhi 8264348440 ✅ call girls ❤️
Call Girls in shastri nagar Delhi 8264348440 ✅ call girls ❤️soniya singh
 
9990771857 Call Girls in Noida Sector 06 Noida (Call Girls) Delhi
9990771857 Call Girls in Noida Sector 06 Noida (Call Girls) Delhi9990771857 Call Girls in Noida Sector 06 Noida (Call Girls) Delhi
9990771857 Call Girls in Noida Sector 06 Noida (Call Girls) Delhidelhimodel235
 
Cashpay_Call Girls In Gaur City Mall Noida ❤️8860477959 Escorts Service In 24...
Cashpay_Call Girls In Gaur City Mall Noida ❤️8860477959 Escorts Service In 24...Cashpay_Call Girls In Gaur City Mall Noida ❤️8860477959 Escorts Service In 24...
Cashpay_Call Girls In Gaur City Mall Noida ❤️8860477959 Escorts Service In 24...lizamodels9
 
The Omaxe State Dwarka Delhi-broucher.pdf.pdf
The Omaxe State Dwarka Delhi-broucher.pdf.pdfThe Omaxe State Dwarka Delhi-broucher.pdf.pdf
The Omaxe State Dwarka Delhi-broucher.pdf.pdfkratirudram
 
Call Girls In Mayur Vihar-1 Delhi ❤️8860477959 Good Looking Escorts In 24/7 D...
Call Girls In Mayur Vihar-1 Delhi ❤️8860477959 Good Looking Escorts In 24/7 D...Call Girls In Mayur Vihar-1 Delhi ❤️8860477959 Good Looking Escorts In 24/7 D...
Call Girls In Mayur Vihar-1 Delhi ❤️8860477959 Good Looking Escorts In 24/7 D...lizamodels9
 
9990771857 Call Girls in Noida Sector 1 Noida (Call Girls) Delhi
9990771857 Call Girls in Noida Sector 1 Noida (Call Girls) Delhi9990771857 Call Girls in Noida Sector 1 Noida (Call Girls) Delhi
9990771857 Call Girls in Noida Sector 1 Noida (Call Girls) Delhidelhimodel235
 
Call girls in Jeewan Park .Delhi↫8447779280↬ ꧂Escorts Service In Delhi Ncr
Call girls in Jeewan Park .Delhi↫8447779280↬ ꧂Escorts Service In Delhi NcrCall girls in Jeewan Park .Delhi↫8447779280↬ ꧂Escorts Service In Delhi Ncr
Call girls in Jeewan Park .Delhi↫8447779280↬ ꧂Escorts Service In Delhi Ncrasmaqueen5
 

Recently uploaded (20)

call girls in Shahdara (DELHI) 🔝 >༒9953330565🔝 genuine Escort Service 🔝✔️✔️
call girls in Shahdara (DELHI) 🔝 >༒9953330565🔝 genuine Escort Service 🔝✔️✔️call girls in Shahdara (DELHI) 🔝 >༒9953330565🔝 genuine Escort Service 🔝✔️✔️
call girls in Shahdara (DELHI) 🔝 >༒9953330565🔝 genuine Escort Service 🔝✔️✔️
 
Model Call Girl in Shastri Nagar Delhi reach out to us at 🔝8264348440🔝
Model Call Girl in Shastri Nagar Delhi reach out to us at 🔝8264348440🔝Model Call Girl in Shastri Nagar Delhi reach out to us at 🔝8264348440🔝
Model Call Girl in Shastri Nagar Delhi reach out to us at 🔝8264348440🔝
 
SSPL The Strand Abodes Kharadi Pune Brochure.pdf
SSPL The Strand Abodes Kharadi Pune Brochure.pdfSSPL The Strand Abodes Kharadi Pune Brochure.pdf
SSPL The Strand Abodes Kharadi Pune Brochure.pdf
 
Call Girls In Hari Nagar Dadb Block {8447779280}Hari Nagar {West Delhi Escort...
Call Girls In Hari Nagar Dadb Block {8447779280}Hari Nagar {West Delhi Escort...Call Girls In Hari Nagar Dadb Block {8447779280}Hari Nagar {West Delhi Escort...
Call Girls In Hari Nagar Dadb Block {8447779280}Hari Nagar {West Delhi Escort...
 
Nanke Area Estate commercial ( Dir. Kat Kuo)
Nanke Area Estate commercial ( Dir. Kat Kuo)Nanke Area Estate commercial ( Dir. Kat Kuo)
Nanke Area Estate commercial ( Dir. Kat Kuo)
 
Building Dreams: Newman Leech's Visionary Approach to Real Estate Investment
Building Dreams: Newman Leech's Visionary Approach to Real Estate InvestmentBuilding Dreams: Newman Leech's Visionary Approach to Real Estate Investment
Building Dreams: Newman Leech's Visionary Approach to Real Estate Investment
 
Omaxe Dwarka In Delhi E Brochure Pdf
Omaxe Dwarka In Delhi E Brochure     PdfOmaxe Dwarka In Delhi E Brochure     Pdf
Omaxe Dwarka In Delhi E Brochure Pdf
 
Eco-Efficient Living: Redefining Sustainability through Leech's Green Design ...
Eco-Efficient Living: Redefining Sustainability through Leech's Green Design ...Eco-Efficient Living: Redefining Sustainability through Leech's Green Design ...
Eco-Efficient Living: Redefining Sustainability through Leech's Green Design ...
 
Call Girls in Janakpuri ↫8447779280↫Short 1500 Night 6000-Escorts Service In ...
Call Girls in Janakpuri ↫8447779280↫Short 1500 Night 6000-Escorts Service In ...Call Girls in Janakpuri ↫8447779280↫Short 1500 Night 6000-Escorts Service In ...
Call Girls in Janakpuri ↫8447779280↫Short 1500 Night 6000-Escorts Service In ...
 
Low Rate Call Girls in Triveni Complex Delhi Call 9990771857
Low Rate Call Girls in Triveni Complex Delhi Call 9990771857Low Rate Call Girls in Triveni Complex Delhi Call 9990771857
Low Rate Call Girls in Triveni Complex Delhi Call 9990771857
 
Call Girls in Model Town Delhi 💯Call Us 🔝8264348440🔝
Call Girls in Model Town Delhi 💯Call Us 🔝8264348440🔝Call Girls in Model Town Delhi 💯Call Us 🔝8264348440🔝
Call Girls in Model Town Delhi 💯Call Us 🔝8264348440🔝
 
9990771857 Call Girls in Noida Sector 03 Noida (Call Girls) Delhi
9990771857 Call Girls in Noida Sector 03 Noida (Call Girls) Delhi9990771857 Call Girls in Noida Sector 03 Noida (Call Girls) Delhi
9990771857 Call Girls in Noida Sector 03 Noida (Call Girls) Delhi
 
Purva Palm Hills Devanahalli, Bangalore E- Brochure.pdf
Purva Palm Hills Devanahalli, Bangalore E- Brochure.pdfPurva Palm Hills Devanahalli, Bangalore E- Brochure.pdf
Purva Palm Hills Devanahalli, Bangalore E- Brochure.pdf
 
Call Girls in shastri nagar Delhi 8264348440 ✅ call girls ❤️
Call Girls in shastri nagar Delhi 8264348440 ✅ call girls ❤️Call Girls in shastri nagar Delhi 8264348440 ✅ call girls ❤️
Call Girls in shastri nagar Delhi 8264348440 ✅ call girls ❤️
 
9990771857 Call Girls in Noida Sector 06 Noida (Call Girls) Delhi
9990771857 Call Girls in Noida Sector 06 Noida (Call Girls) Delhi9990771857 Call Girls in Noida Sector 06 Noida (Call Girls) Delhi
9990771857 Call Girls in Noida Sector 06 Noida (Call Girls) Delhi
 
Cashpay_Call Girls In Gaur City Mall Noida ❤️8860477959 Escorts Service In 24...
Cashpay_Call Girls In Gaur City Mall Noida ❤️8860477959 Escorts Service In 24...Cashpay_Call Girls In Gaur City Mall Noida ❤️8860477959 Escorts Service In 24...
Cashpay_Call Girls In Gaur City Mall Noida ❤️8860477959 Escorts Service In 24...
 
The Omaxe State Dwarka Delhi-broucher.pdf.pdf
The Omaxe State Dwarka Delhi-broucher.pdf.pdfThe Omaxe State Dwarka Delhi-broucher.pdf.pdf
The Omaxe State Dwarka Delhi-broucher.pdf.pdf
 
Call Girls In Mayur Vihar-1 Delhi ❤️8860477959 Good Looking Escorts In 24/7 D...
Call Girls In Mayur Vihar-1 Delhi ❤️8860477959 Good Looking Escorts In 24/7 D...Call Girls In Mayur Vihar-1 Delhi ❤️8860477959 Good Looking Escorts In 24/7 D...
Call Girls In Mayur Vihar-1 Delhi ❤️8860477959 Good Looking Escorts In 24/7 D...
 
9990771857 Call Girls in Noida Sector 1 Noida (Call Girls) Delhi
9990771857 Call Girls in Noida Sector 1 Noida (Call Girls) Delhi9990771857 Call Girls in Noida Sector 1 Noida (Call Girls) Delhi
9990771857 Call Girls in Noida Sector 1 Noida (Call Girls) Delhi
 
Call girls in Jeewan Park .Delhi↫8447779280↬ ꧂Escorts Service In Delhi Ncr
Call girls in Jeewan Park .Delhi↫8447779280↬ ꧂Escorts Service In Delhi NcrCall girls in Jeewan Park .Delhi↫8447779280↬ ꧂Escorts Service In Delhi Ncr
Call girls in Jeewan Park .Delhi↫8447779280↬ ꧂Escorts Service In Delhi Ncr
 

San Francisco Market Report for March 2020

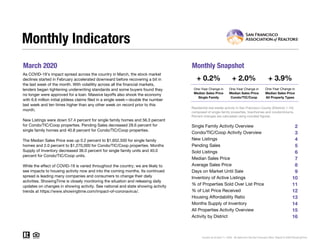
  • 1. March 2020 Monthly Snapshot One-Year Change in One-Year Change in Median Sales Price Single Family Median Sales Price Condo/TIC/Coop 2 3 4 5 6 7 8 9 10 11 12 13 14 15 16 Monthly Indicators + 0.2% + 2.0% + 3.9% One-Year Change in As COVID-19’s impact spread across the country in March, the stock market declines started in February accelerated downward before recovering a bit in the last week of the month. With volatility across all the financial markets, lenders began tightening underwriting standards and some buyers found they no longer were approved for a loan. Massive layoffs also shook the economy with 6.6 million initial jobless claims filed in a single week—double the number last week and ten times higher than any other week on record prior to this month. New Listings were down 57.4 percent for single family homes and 56.3 percent for Condo/TIC/Coop properties. Pending Sales decreased 28.6 percent for single family homes and 40.8 percent for Condo/TIC/Coop properties. The Median Sales Price was up 0.2 percent to $1,652,500 for single family homes and 2.0 percent to $1,270,000 for Condo/TIC/Coop properties. Months Supply of Inventory decreased 36.0 percent for single family units and 40.0 percent for Condo/TIC/Coop units. While the effect of COVID-19 is varied throughout the country, we are likely to see impacts to housing activity now and into the coming months. Its continued spread is leading many companies and consumers to change their daily activities. ShowingTime is closely monitoring the situation and releasing daily updates on changes in showing activity. See national and state showing activity trends at https://www.showingtime.com/impact-of-coronavirus/. Median Sales Price All Property Types Residential real estate activity in San Francisco County (Districts 1-10) composed of single-family properties, townhomes and condominiums. Percent changes are calculated using rounded figures. Single Family Activity Overview Months Supply of Inventory Current as of April 11, 2020. All data from the San Francisco MLS. Report © 2020 ShowingTime. Condo/TIC/Coop Activity Overview Inventory of Active Listings % of Properties Sold Over List Price % of List Price Received Housing Affordability Ratio All Properties Activity Overview New Listings Pending Sales Sold Listings Median Sales Price Average Sales Price Days on Market Until Sale Activity by District
  • 2. Single Family Activity Overview Key metrics by report month and for year-to-date (YTD) starting from the first of the year. Key Metrics Historical Sparkbars 3-2019 3-2020 Percent Change YTD 2019 YTD 2020 Percent Change Current as of April 11, 2020. All data from the San Francisco MLS. Report © 2020 ShowingTime. | 2 Months Supply 2.5 1.6 - 36.0% -- -- -- Affordability Ratio 30 32 + 6.7% % of List Price Received 110.5% 114.7% + 3.8% 110.0% 32 72.1% + 1.3% + 1.6% 33 + 3.1% 111.8% % of Properties Sold Over List Price 73.3% 79.5% + 8.5% 71.2% Active Listings 469 289 - 38.4% -- Avg. Sales Price $2,046,399 $2,096,326 + 2.4% $1,918,458 Days on Market 26 20 - 23.1% 30 26 - 13.3% $2,083,150 -- -- Median Sales Price $1,650,000 $1,652,500 + 0.2% $1,549,000 Sold Listings 172 157 - 8.7% 385 New Listings 242 103 - 57.4% 655 Pending Sales 210 150 - 28.6% - 12.6%443 387 - 25.6%487 367 - 4.7% $1,595,000 + 3.0% + 8.6% 3-2017 3-2018 3-2019 3-2020 3-2017 3-2018 3-2019 3-2020 3-2017 3-2018 3-2019 3-2020 3-2017 3-2018 3-2019 3-2020 3-2017 3-2018 3-2019 3-2020 3-2017 3-2018 3-2019 3-2020 3-2017 3-2018 3-2019 3-2020 3-2017 3-2018 3-2019 3-2020 3-2017 3-2018 3-2019 3-2020 3-2017 3-2018 3-2019 3-2020 3-2017 3-2018 3-2019 3-2020
  • 3. Condo/TIC/Coop Activity Overview Key metrics by report month and for year-to-date (YTD) starting from the first of the year. Key Metrics Historical Sparkbars 3-2019 3-2020 Percent Change YTD 2019 YTD 2020 Percent Change Current as of April 11, 2020. All data from the San Francisco MLS. Report © 2020 ShowingTime. | 3 Months Supply 3.0 1.8 - 40.0% -- -- -- Affordability Ratio 47 48 + 2.1% % of List Price Received 104.7% 104.5% - 0.2% 103.8% 49 53.8% + 3.7% - 0.2% 49 0.0% 103.6% % of Properties Sold Over List Price 55.8% 60.8% + 9.0% 51.9% Active Listings 715 420 - 41.3% -- Avg. Sales Price $1,335,673 $1,378,517 + 3.2% $1,310,721 Days on Market 35 27 - 22.9% 40 $1,250,000 + 6.8% + 4.6% 37 - 7.5% $1,370,741 -- -- Sold Listings 265 217 - 18.1% 543 546 + 0.6% Median Sales Price $1,245,000 $1,270,000 + 2.0% $1,170,000 - 22.3% Pending Sales 299 177 - 40.8% 648 570 - 12.0% New Listings 352 154 - 56.3% 1,016 789 3-2017 3-2018 3-2019 3-2020 3-2017 3-2018 3-2019 3-2020 3-2017 3-2018 3-2019 3-2020 3-2017 3-2018 3-2019 3-2020 3-2017 3-2018 3-2019 3-2020 3-2017 3-2018 3-2019 3-2020 3-2017 3-2018 3-2019 3-2020 3-2017 3-2018 3-2019 3-2020 3-2017 3-2018 3-2019 3-2020 3-2017 3-2018 3-2019 3-2020 3-2017 3-2018 3-2019 3-2020
  • 4. New Listings New Listings Single Family Year-Over-Year Change Condo/TIC/ Coop Year-Over-Year Change Apr-2019 252 -7.0% 377 -0.3% May-2019 275 +1.5% 367 -0.8% Jun-2019 233 -12.1% 285 -20.4% Jul-2019 197 -17.6% 320 +22.6% Aug-2019 245 -2.0% 328 +5.5% Sep-2019 305 -9.8% 506 +11.5% Oct-2019 242 -6.2% 340 -0.3% Nov-2019 129 -18.9% 152 -22.4% Dec-2019 79 -3.7% 128 +4.9% Jan-2020 186 -17.0% 309 -13.7% Feb-2020 198 +4.8% 326 +6.5% Mar-2020 103 -57.4% 154 -56.3% 12-Month Avg 204 -12.3% 299 -5.6% Historical New Listings by Month Current as of April 11, 2020. All data from the San Francisco MLS. Report © 2020 ShowingTime. | 4 A count of the properties that have been newly listed on the market in a given month. 278 379 242 352 103 154 Single Family Condo/TIC/Coop March 0 100 200 300 400 500 600 700 1-2005 1-2006 1-2007 1-2008 1-2009 1-2010 1-2011 1-2012 1-2013 1-2014 1-2015 1-2016 1-2017 1-2018 1-2019 1-2020 Single Family Condo/TIC/Coop 675 1,105 655 1,016 487 789 Single Family Condo/TIC/Coop Year to Date 2018 2019 2020 - 56.3%- 7.1%- 57.4%- 12.9% - 8.1%- 25.6%- 3.0% - 22.3% 2018 2019 2020 2018 2019 2020 2018 2019 2020 + 0.7% + 5.3% + 9.5%+ 8.3%
  • 5. Pending Sales Pending Sales Single Family Year-Over-Year Change Condo/TIC/ Coop Year-Over-Year Change Apr-2019 222 +7.2% 313 +9.1% May-2019 248 -9.8% 337 +13.5% Jun-2019 194 -4.9% 245 -18.9% Jul-2019 183 +10.9% 205 -17.0% Aug-2019 151 -11.2% 211 -9.1% Sep-2019 195 +1.0% 229 +4.6% Oct-2019 247 -1.6% 303 +4.1% Nov-2019 191 +2.1% 234 +5.4% Dec-2019 115 -5.0% 156 +6.1% Jan-2020 101 +13.5% 157 +29.8% Feb-2020 136 -5.6% 236 +3.5% Mar-2020 150 -28.6% 177 -40.8% 12-Month Avg 178 -3.7% 234 -3.1% Historical Pending Sales by Month A count of the properties on which offers have been accepted in a given month. Current as of April 11, 2020. All data from the San Francisco MLS. Report © 2020 ShowingTime. | 5 215 336 210 299 150 177 Single Family Condo/TIC/Coop March 0 100 200 300 400 1-2005 1-2006 1-2007 1-2008 1-2009 1-2010 1-2011 1-2012 1-2013 1-2014 1-2015 1-2016 1-2017 1-2018 1-2019 1-2020 Single Family Condo/TIC/Coop 460 740 443 648 387 570 Single Family Condo/TIC/Coop Year to Date 2018 2019 2020 - 40.8%- 11.0%- 28.6%- 2.3% - 12.4%- 12.6%- 3.7% - 12.0% 2018 2019 2020 2018 2019 2020 2018 2019 2020 + 0.9% + 4.3% + 12.5%+ 10.5%
  • 6. Sold Listings Sold Listings Single Family Year-Over-Year Change Condo/TIC/ Coop Year-Over-Year Change Apr-2019 226 +18.9% 319 +7.8% May-2019 239 -4.0% 337 +8.0% Jun-2019 190 -17.7% 265 -12.5% Jul-2019 213 +10.9% 244 -10.9% Aug-2019 168 -12.0% 207 -20.4% Sep-2019 126 -14.3% 192 +4.9% Oct-2019 255 +2.8% 259 -11.6% Nov-2019 200 -9.1% 272 +3.0% Dec-2019 175 +9.4% 215 +10.8% Jan-2020 96 -4.0% 150 +31.6% Feb-2020 114 +0.9% 179 +9.1% Mar-2020 157 -8.7% 217 -18.1% 12-Month Avg 180 -2.4% 238 -2.3% Historical Sold Listings by Month A count of the actual sales that closed in a given month. Current as of April 11, 2020. All data from the San Francisco MLS. Report © 2020 ShowingTime. | 6 200 289 172 265 157 217 Single Family Condo/TIC/Coop March 0 100 200 300 400 1-2005 1-2006 1-2007 1-2008 1-2009 1-2010 1-2011 1-2012 1-2013 1-2014 1-2015 1-2016 1-2017 1-2018 1-2019 1-2020 Single Family Condo/TIC/Coop 402 640 385 543 367 546 Single Family Condo/TIC/Coop Year to Date 2018 2019 2020 - 18.1%- 8.3%- 8.7%- 14.0% - 15.2%- 4.7%- 4.2% + 0.6% 2018 2019 2020 2018 2019 2020 2018 2019 2020 + 15.6% + 3.1% + 7.7%+ 0.7%
  • 7. Median Sales Price Median Sales Price Single Family Year-Over-Year Change Condo/TIC/ Coop Year-Over-Year Change Apr-2019 $1,612,500 -2.2% $1,225,000 -2.0% May-2019 $1,685,000 +4.1% $1,245,000 -1.0% Jun-2019 $1,750,000 +7.7% $1,299,000 +11.0% Jul-2019 $1,576,000 -3.1% $1,222,444 +6.3% Aug-2019 $1,602,500 +4.2% $1,281,250 +3.8% Sep-2019 $1,540,000 +2.7% $1,325,000 +15.2% Oct-2019 $1,650,000 +3.1% $1,325,000 +9.1% Nov-2019 $1,604,000 +12.4% $1,180,000 -1.1% Dec-2019 $1,450,000 -2.8% $1,200,000 +2.6% Jan-2020 $1,462,500 +5.3% $1,172,000 +12.7% Feb-2020 $1,610,000 +7.3% $1,300,000 +15.0% Mar-2020 $1,652,500 +0.2% $1,270,000 +2.0% 12-Month Avg* $1,607,500 +3.0% $1,250,000 +4.2% Historical Median Sales Price by Month Point at which half of the sales sold for more and half sold for less, not accounting for seller concessions, in a given month. * Median Sales Price for all properties from April 2019 through March 2020. This is not the average of the individual figures above. Current as of April 11, 2020. All data from the San Francisco MLS. Report © 2020 ShowingTime. | 7 $1,687,500 $1,250,000 $1,650,000 $1,245,000 $1,652,500 $1,270,000 Single Family Condo/TIC/Coop March $500,000 $750,000 $1,000,000 $1,250,000 $1,500,000 $1,750,000 $2,000,000 1-2005 1-2006 1-2007 1-2008 1-2009 1-2010 1-2011 1-2012 1-2013 1-2014 1-2015 1-2016 1-2017 1-2018 1-2019 1-2020 Single Family Condo/TIC/Coop $1,609,000 $1,170,000 $1,549,000 $1,170,000 $1,595,000 $1,250,000 Single Family Condo/TIC/Coop Year to Date 2018 2019 2020 + 2.0%- 0.4%+ 0.2%- 2.2% 0.0%+ 3.0%- 3.7% + 6.8% 2018 2019 2020 2018 2019 2020 2018 2019 2020 + 25.0% + 23.8% + 4.9%+ 9.9%
  • 8. Average Sales Price Avg. Sales Price Single Family Year-Over-Year Change Condo/TIC/ Coop Year-Over-Year Change Apr-2019 $2,235,456 +2.3% $1,363,254 +2.1% May-2019 $2,141,318 +6.0% $1,335,560 -4.5% Jun-2019 $2,148,466 +10.6% $1,431,991 +7.1% Jul-2019 $1,959,574 -0.5% $1,310,687 +5.8% Aug-2019 $1,872,478 +3.3% $1,386,808 +2.9% Sep-2019 $2,075,848 +14.1% $1,449,604 +15.4% Oct-2019 $1,912,555 -11.1% $1,447,421 +7.8% Nov-2019 $1,986,456 +6.6% $1,322,998 +4.7% Dec-2019 $1,948,749 +9.1% $1,265,139 -4.9% Jan-2020 $2,212,609 +26.3% $1,319,209 +12.1% Feb-2020 $1,956,102 +4.5% $1,404,496 +3.0% Mar-2020 $2,096,326 +2.4% $1,378,517 +3.2% 12-Month Avg* $2,042,250 +4.4% $1,367,229 +3.7% Historical Average Sales Price by Month Average sales price for all closed sales, not accounting for seller concessions, in a given month. * Avg. Sales Price for all properties from April 2019 through March 2020. This is not the average of the individual figures above. Current as of April 11, 2020. All data from the San Francisco MLS. Report © 2020 ShowingTime. | 8 $1,949,288 $1,371,131 $2,046,399 $1,335,673 $2,096,326 $1,378,517 Single Family Condo/TIC/Coop March $500,000 $1,000,000 $1,500,000 $2,000,000 $2,500,000 1-2005 1-2006 1-2007 1-2008 1-2009 1-2010 1-2011 1-2012 1-2013 1-2014 1-2015 1-2016 1-2017 1-2018 1-2019 1-2020 Single Family Condo/TIC/Coop $1,953,097 $1,325,939 $1,918,458 $1,310,721 $2,083,150 $1,370,741 Single Family Condo/TIC/Coop Year to Date 2018 2019 2020 + 3.2%- 2.6%+ 2.4%+ 5.0% - 1.1%+ 8.6%- 1.8% + 4.6% 2018 2019 2020 2018 2019 2020 2018 2019 2020 + 3.1% + 10.8% + 4.2%+ 6.9%
  • 9. Days on Market Until Sale Days on Market Single Family Year-Over-Year Change Condo/TIC/ Coop Year-Over-Year Change Apr-2019 26 +44.4% 38 +46.2% May-2019 22 +10.0% 29 +7.4% Jun-2019 22 +22.2% 31 +14.8% Jul-2019 23 +9.5% 33 +6.5% Aug-2019 25 +13.6% 33 -8.3% Sep-2019 28 +16.7% 34 +13.3% Oct-2019 22 -8.3% 28 +3.7% Nov-2019 24 -7.7% 34 -10.5% Dec-2019 31 -6.1% 48 +9.1% Jan-2020 38 -2.6% 62 +12.7% Feb-2020 25 -13.8% 29 -27.5% Mar-2020 20 -23.1% 27 -22.9% 12-Month Avg* 25 +3.0% 35 +5.0% Historical Days on Market Until Sale by Month Average number of days between when a property is listed and when an offer is accepted in a given month. * Days on Market for all properties from April 2019 through March 2020. This is not the average of the individual figures above. Current as of April 11, 2020. All data from the San Francisco MLS. Report © 2020 ShowingTime. | 9 22 2626 35 20 27 Single Family Condo/TIC/Coop March 0 20 40 60 80 100 120 1-2005 1-2006 1-2007 1-2008 1-2009 1-2010 1-2011 1-2012 1-2013 1-2014 1-2015 1-2016 1-2017 1-2018 1-2019 1-2020 Single Family Condo/TIC/Coop 25 36 30 40 26 37 Single Family Condo/TIC/Coop Year to Date 2018 2019 2020 - 22.9%+ 34.6%- 23.1%+ 18.2% + 11.1%- 13.3%+ 20.0% - 7.5% 2018 2019 2020 2018 2019 2020 2018 2019 2020 - 29.0% - 28.6% - 10.0%- 18.8%
  • 10. Inventory of Active Listings Active Listings Single Family Year-Over-Year Change Condo/TIC/ Coop Year-Over-Year Change Apr-2019 482 +11.3% 733 +4.1% May-2019 473 +16.5% 726 +0.3% Jun-2019 491 +14.2% 708 -1.1% Jul-2019 463 +0.2% 727 +10.7% Aug-2019 514 +4.5% 752 +12.2% Sep-2019 586 -1.2% 954 +12.2% Oct-2019 536 -1.1% 906 +8.5% Nov-2019 428 -7.8% 735 +2.9% Dec-2019 310 -5.8% 531 +4.7% Jan-2020 377 -15.7% 647 -6.0% Feb-2020 422 -8.3% 680 -5.3% Mar-2020 289 -38.4% 420 -41.3% 12-Month Avg* 448 -2.8% 710 +0.2% Historical Inventory of Active Listings by Month The number of properties available for sale in active status at the end of a given month. * Active Listings for all properties from April 2019 through March 2020. This is not the average of the individual figures above. Current as of April 11, 2020. All data from the San Francisco MLS. Report © 2020 ShowingTime. | 10 396 655 469 715 289 420 Single Family Condo/TIC/Coop March 0 250 500 750 1,000 1,250 1,500 1-2005 1-2006 1-2007 1-2008 1-2009 1-2010 1-2011 1-2012 1-2013 1-2014 1-2015 1-2016 1-2017 1-2018 1-2019 1-2020 Single Family Condo/TIC/Coop 2018 2019 2020 - 41.3%+ 9.2%- 38.4%+ 18.4% 2018 2019 2020 + 2.1% + 3.6%
  • 11. % of Properties Sold Over List Price % of Properties Sold Over List Price Single Family Year-Over-Year Change Condo/TIC/ Coop Year-Over-Year Change Apr-2019 73.9% -5.1% 55.2% -17.1% May-2019 79.9% -5.7% 65.0% -3.8% Jun-2019 81.1% -8.2% 64.5% -5.6% Jul-2019 82.6% -3.3% 70.5% +11.7% Aug-2019 82.1% +1.9% 58.9% +2.1% Sep-2019 74.6% -7.9% 59.4% -6.3% Oct-2019 80.8% -2.3% 65.3% -4.4% Nov-2019 77.5% +5.3% 64.3% +18.0% Dec-2019 66.3% -2.6% 47.9% +4.4% Jan-2020 60.4% +0.7% 33.3% -19.2% Feb-2020 71.9% -7.7% 62.6% +18.1% Mar-2020 79.5% +8.5% 60.8% +9.0% 12-Month Avg 77.0% -2.7% 60.0% -0.8% Historical % of Properties Sold Over List Price by Month Percentage found when dividing the number of properties sold by properties sold over its original list price, not accounting for seller concessions. * % of Properties Sold Over List Price for all properties from April 2019 through March 2020. This is not the average of the individual figures above. Current as of April 11, 2020. All data from the San Francisco MLS. Report © 2020 ShowingTime. | 11 77.0% 59.2% 73.3% 55.8% 79.5% 60.8% Single Family Condo/TIC/Coop March 0.0% 20.0% 40.0% 60.0% 80.0% 100.0% 1-2005 1-2006 1-2007 1-2008 1-2009 1-2010 1-2011 1-2012 1-2013 1-2014 1-2015 1-2016 1-2017 1-2018 1-2019 1-2020 Single Family Condo/TIC/Coop 76.4% 53.1% 71.2% 51.9% 72.1% 53.8% Single Family Condo/TIC/Coop Year to Date 2018 2019 2020 + 9.0%- 5.7%+ 8.5%- 4.8% - 2.3%+ 1.3%- 6.8% + 3.7% 2018 2019 2020 2018 2019 2020 2018 2019 2020 + 3.2% + 5.7% - 3.3%- 4.5%
  • 12. % of List Price Received % of List Price Received Single Family Year-Over-Year Change Condo/TIC/ Coop Year-Over-Year Change Apr-2019 112.4% -5.8% 104.9% -3.7% May-2019 113.2% -5.3% 107.4% -0.9% Jun-2019 115.3% -4.0% 107.2% -0.1% Jul-2019 115.4% -1.5% 107.6% +0.5% Aug-2019 115.3% +0.4% 105.8% +0.2% Sep-2019 112.7% -2.3% 105.2% -1.2% Oct-2019 114.0% 0.0% 105.9% -1.7% Nov-2019 111.9% +0.6% 105.1% +1.0% Dec-2019 109.7% -0.7% 103.2% +1.1% Jan-2020 107.1% +1.0% 100.4% -0.6% Feb-2020 111.8% -0.7% 105.2% +1.0% Mar-2020 114.7% +3.8% 104.5% -0.2% 12-Month Avg* 113.1% -1.6% 105.5% -0.6% Historical % of List Price Received by Month Percentage found when dividing a property’s sales price by its most recent list price, then taking the average for all properties sold in a given month, not accounting for seller concessions. * % of List Price Received for all properties from April 2019 through March 2020. This is not the average of the individual figures above. Current as of April 11, 2020. All data from the San Francisco MLS. Report © 2020 ShowingTime. | 12 117.5% 107.1%110.5% 104.7% 114.7% 104.5% Single Family Condo/TIC/Coop March 115.8% 105.2% 110.0% 103.8% 111.8% 103.6% Single Family Condo/TIC/Coop Year to Date 90.0% 100.0% 110.0% 120.0% 130.0% 1-2005 1-2006 1-2007 1-2008 1-2009 1-2010 1-2011 1-2012 1-2013 1-2014 1-2015 1-2016 1-2017 1-2018 1-2019 1-2020 Single Family Condo/TIC/Coop 2018 2019 2020 - 0.2%- 2.2%+ 3.8%- 6.0% 2018 2019 2020 + 4.5% + 2.1% 2018 2019 2020 - 0.2%- 1.3%+ 1.6%- 5.0% 2018 2019 2020 + 3.9% + 1.4%
  • 13. Housing Affordability Ratio Affordability Ratio Single Family Year-Over-Year Change Condo/TIC/ Coop Year-Over-Year Change Apr-2019 31 +6.9% 48 +6.7% May-2019 30 0.0% 47 +6.8% Jun-2019 29 -3.3% 45 -6.3% Jul-2019 33 +10.0% 49 0.0% Aug-2019 34 +9.7% 49 +8.9% Sep-2019 34 +9.7% 47 0.0% Oct-2019 33 +17.9% 48 +17.1% Nov-2019 33 +3.1% 52 +20.9% Dec-2019 36 +9.1% 51 +6.3% Jan-2020 37 +5.7% 54 0.0% Feb-2020 34 +3.0% 49 -3.9% Mar-2020 32 +6.7% 48 +2.1% 12-Month Avg* 33 +3.1% 31 +2.4% Historical Housing Affordability Ratio by Month This index measures housing affordability for the region. For example, an index of 120 means the median household income is 120% of what is necessary to qualify for the median-priced home under prevailing interest rates. A higher number means greater affordability. * Affordability Ratio for all properties from April 2019 through March 2020. This is not the average of the individual figures above. Current as of April 11, 2020. All data from the San Francisco MLS. Report © 2020 ShowingTime. | 13 29 46 30 47 32 48 Single Family Condo/TIC/Coop March 20 40 60 80 100 1-2005 1-2006 1-2007 1-2008 1-2009 1-2010 1-2011 1-2012 1-2013 1-2014 1-2015 1-2016 1-2017 1-2018 1-2019 1-2020 Single Family Condo/TIC/Coop 2018 2019 2020 + 2.1%+ 2.2%+ 6.7%+ 3.4% 2018 2019 2020 - 21.6% - 9.8% 31 49 32 49 33 49 Single Family Condo/TIC/Coop Year to Date 2018 2019 2020 0.0%0.0%+ 3.1%+ 3.2% 2018 2019 2020 - 20.5% - 5.8%
  • 14. Months Supply of Inventory Months Supply Single Family Year-Over-Year Change Condo/TIC/ Coop Year-Over-Year Change Apr-2019 2.6 +13.0% 3.0 +7.1% May-2019 2.6 +23.8% 2.9 0.0% Jun-2019 2.7 +17.4% 2.9 +3.6% Jul-2019 2.5 +4.2% 3.1 +19.2% Aug-2019 2.8 +7.7% 3.2 +23.1% Sep-2019 3.2 0.0% 4.0 +21.2% Oct-2019 2.9 0.0% 3.8 +15.2% Nov-2019 2.3 -8.0% 3.1 +10.7% Dec-2019 1.7 -5.6% 2.2 +10.0% Jan-2020 2.1 -12.5% 2.7 -3.6% Feb-2020 2.3 -8.0% 2.8 -3.4% Mar-2020 1.6 -36.0% 1.8 -40.0% 12-Month Avg* 2.4 -0.6% 3.0 +4.9% Historical Months Supply of Inventory by Month The inventory of homes for sale at the end of a given month, divided by the average monthly pending sales from the last 12 months. * Months Supply for all properties from April 2019 through March 2020. This is not the average of the individual figures above. Current as of April 11, 2020. All data from the San Francisco MLS. Report © 2020 ShowingTime. | 14 2.1 2.62.5 3.0 1.6 1.8 Single Family Condo/TIC/Coop March 0.0 2.0 4.0 6.0 8.0 10.0 1-2005 1-2006 1-2007 1-2008 1-2009 1-2010 1-2011 1-2012 1-2013 1-2014 1-2015 1-2016 1-2017 1-2018 1-2019 1-2020 Single Family Condo/TIC/Coop 2018 2019 2020 - 40.0%+ 15.4%- 36.0%+ 19.0% 2018 2019 2020 0.0% - 3.7%
  • 15. All Properties Activity Overview Key metrics by report month and for year-to-date (YTD) starting from the first of the year. Key Metrics Historical Sparkbars 3-2019 3-2020 Percent Change YTD 2019 YTD 2020 Percent Change Current as of April 11, 2020. All data from the San Francisco MLS. Report © 2020 ShowingTime. | 15 Months Supply 2.8 1.7 - 39.3% -- -- -- Affordability Ratio 36 37 + 2.8% % of List Price Received 107.0% 108.8% + 1.7% 106.3% 37 61.2% + 2.2% + 0.6% 37 0.0% 106.9% % of Properties Sold Over List Price 62.7% 68.6% + 9.4% 59.9% Active Listings 1,184 709 - 40.1% -- Avg. Sales Price $1,615,409 $1,678,727 + 3.9% $1,562,854 Days on Market 31 24 - 22.6% 36 $1,400,000 + 7.7% + 6.0% 33 - 8.3% $1,656,642 -- -- Sold Listings 437 374 - 14.4% 928 913 - 1.6% Median Sales Price $1,395,000 $1,450,000 + 3.9% $1,300,000 - 23.6% Pending Sales 509 327 - 35.8% 1,091 957 - 12.3% New Listings 594 257 - 56.7% 1,671 1,276 3-2017 3-2018 3-2019 3-2020 3-2017 3-2018 3-2019 3-2020 3-2017 3-2018 3-2019 3-2020 3-2017 3-2018 3-2019 3-2020 3-2017 3-2018 3-2019 3-2020 3-2017 3-2018 3-2019 3-2020 3-2017 3-2018 3-2019 3-2020 3-2017 3-2018 3-2019 3-2020 3-2017 3-2018 3-2019 3-2020 3-2017 3-2018 3-2019 3-2020 3-2017 3-2018 3-2019 3-2020
  • 16. Activity by District SF District 1: Northwest (Sea Cliff, Lake, Jordan Park / Laurel Heights, Outer Richmond, Central Richmond, Inner Richmond, Lone Mountain) SF District 2: Central West (Outer Sunset, Central Sunset, Inner Sunset, Outer Parkside, Parkside, Inner Parkside, Golden Gate Heights) SF District 3: Southwest (Pine Lake Park, Lake Shore, Merced Manor, Stonestown, Lakeside, Merced Heights, Ingleside, Ingleside Heights, Oceanview) SF District 4: Twin Peaks W (Forest Hill (& Ext), W Portal, St Francis Wd, Balboa Terr, Mt Dav Manor, Ingleside Terr, Monterey Hts, Wstwd Pk & H'lnds, Shrwd Fst, Miraloma Pk, Dmnd Hts, Mdtwn Terr) SF District 5: Central (Haight Ashbury, Cole Vly / Prnssus Hts, Clarndn Hts, Corona Hts, Twin Pks, Glen Pk, Noe Vly, Eureka Vly / Dolores Hts, Mission Dolores, Duboce Trngl, Buena Vista / Ashbury Hts) SF District 6: Central North (Lower Pacific Heights, Anza Vista, Western Addition, North Panhandle, Alamo Square, Hayes Valley) SF District 7: North (Marina, Cow Hollow, Presidio Heights, Pacific Heights) SF District 8: Northeast (North Waterfront, North Beach, Russian Hill, Telegraph Hill, Nob Hill, Financial District / Barbary Coast, Downtown, Van Ness / Civic Center, Tenderloin) SF District 9: Central East (Yerba Buena, South Beach, South of Market, Mission Bay, Inner Mission, Potrero Hill, Central Waterfront / Dogpatch, Bernal Heights) SF District 10: Southeast (Outer Mission, Mission Terr, Excelsior, Portola, Bayview, Silver Terr, Hunters Pt, Candlestick Pt, Bayview Hts, Little Hollywood, Visitation Vly, Crocker Amazon) 3-2019 3-2020 + / – 3-2019 3-2020 + / – 3-2019 3-2020 + / – 3-2019 3-2020 + / – 3-2019 3-2020 + / – Single Family 1 SF District 1 38 21 -44.7% 15 12 -20.0% $2,150,000 $2,350,000 +9.3% 19 13 -31.6% 2.3 1.4 -39.1% 2 SF District 2 63 29 -54.0% 33 31 -6.1% $1,605,000 $1,500,000 -6.5% 18 20 +11.1% 1.9 0.9 -52.6% 3 SF District 3 28 21 -25.0% 7 9 +28.6% $1,100,000 $1,150,000 +4.5% 25 21 -16.0% 2.3 1.7 -26.1% 4 SF District 4 51 27 -47.1% 25 25 0.0% $1,605,000 $1,940,000 +20.9% 23 15 -34.8% 1.8 1.1 -38.9% 5 SF District 5 75 48 -36.0% 31 24 -22.6% $2,350,000 $2,687,000 +14.3% 27 21 -22.2% 2.8 1.8 -35.7% 6 SF District 6 16 11 -31.3% 6 4 -33.3% $3,537,500 $2,650,000 -25.1% 30 6 -80.0% 4.3 3.3 -23.3% 7 SF District 7 35 22 -37.1% 8 10 +25.0% $5,200,000 $4,412,500 -15.1% 45 34 -24.4% 4.4 2.6 -40.9% 8 SF District 8 18 16 -11.1% 1 1 0.0% $5,600,000 $3,850,000 -31.3% 50 44 -12.0% 8.6 6.8 -20.9% 9 SF District 9 63 42 -33.3% 14 19 +35.7% $1,702,500 $1,550,000 -9.0% 17 25 +47.1% 3.2 2.2 -31.3% 10 SF District 10 82 52 -36.6% 32 22 -31.3% $1,145,000 $1,207,500 +5.5% 35 20 -42.9% 2.2 1.5 -31.8% Condo/TIC/Coop 1 SF District 1 31 24 -22.6% 14 10 -28.6% $1,300,000 $1,602,500 +23.3% 25 32 +28.0% 2.2 1.9 -13.6% 2 SF District 2 6 4 -33.3% 3 5 +66.7% $1,425,000 $1,070,000 -24.9% 27 19 -29.6% 1.4 0.9 -35.7% 3 SF District 3 12 3 -75.0% 1 1 0.0% $900,000 $875,000 -2.8% 14 88 +528.6% 4.3 0.9 -79.1% 4 SF District 4 16 6 -62.5% 4 5 +25.0% $751,250 $625,000 -16.8% 52 63 +21.2% 3.5 1.0 -71.4% 5 SF District 5 79 43 -45.6% 33 34 +3.0% $1,400,000 $1,425,000 +1.8% 21 22 +4.8% 2.3 1.2 -47.8% 6 SF District 6 67 27 -59.7% 26 17 -34.6% $1,048,524 $1,365,000 +30.2% 43 18 -58.1% 3.2 1.2 -62.5% 7 SF District 7 70 33 -52.9% 41 15 -63.4% $1,541,000 $1,640,000 +6.4% 32 26 -18.8% 2.8 1.3 -53.6% 8 SF District 8 163 79 -51.5% 46 34 -26.1% $1,040,000 $1,212,500 +16.6% 48 24 -50.0% 4.0 2.1 -47.5% 9 SF District 9 245 177 -27.8% 89 92 +3.4% $1,180,000 $1,250,000 +5.9% 32 29 -9.4% 2.8 2.2 -21.4% 10 SF District 10 26 24 -7.7% 8 4 -50.0% $675,500 $860,000 +27.3% 52 49 -5.8% 4.5 4.4 -2.2% Key metrics by report month for the districts of San Fransisco. Current as of April 11, 2020. All data from the San Francisco MLS. Report © 2020 ShowingTime. | 16 Active Listings Sold Listings Median Sales Price Days on Market Months Supply