Submit Search
Upload
Output
•
Download as DOCX, PDF
•
0 likes
•
124 views
R
Remarkable Shamun
Follow
Data, Eviews, Statistical
Read less
Read more
Education
Report
Share
Report
Share
1 of 2
Download now
Recommended
Sunil1
Sunil1
Rakesh Kumar
Pengujian Asumsi Klasik Menggunakan Eviews
Hillary Excelzy
[L'angolo del PhD] Sara Borroni - XXIII Ciclo - 2010
[L'angolo del PhD] Sara Borroni - XXIII Ciclo - 2010
accatagliato
Panel data methods for microeconometrics using Stata! Short and good one :)
Wondmagegn Tafesse
ICAR-IFPRI: Panel regression lecture 5 Devesh Roy
International Food Policy Research Institute- South Asia Office
Research Methodology study method
Mayur Khatri
panel data simple
panel data simple
pelangi sepi
Lampiran error correction model
Chenk Alie Patrician
Minhhoa bai giang kinh te luong
robodientu
табл гетероскедаст
табл гетероскедаст
lpbimo
Ujian ekonometrika
Ujian ekonometrika
Yolandafitri Zulvia
Data equation
Data equation
ressas
Econometrics Project
Uday Tharar
Lampiran error correction model
Chenk Alie Patrician
Lampiran uji kointegrasi
Chenk Alie Patrician
working data(Group5)
Kritika Gupta
Enflasyon forecast
Enflasyon forecast
mesut bayhan
Design of experiment methodology
CHUN-HAO KUNG
Cobb-douglas production function
Suniya Sheikh
Cobb-douglas production function
Suniya Sheikh
Appendix
Appendix
Oryza Sativa
GARCH
GARCH
pelangi sepi
Durbib- Watson D between 0-2 means there is a positive correlati
AlyciaGold776
Doe with response surface model
Mark Reich
Lampiran uji kointegrasi
Chenk Alie Patrician
Cross validationreport dataakuisisibaru9720031xv
farah mutik
Autoregressive integrated moving average
Muhammad Khoirul Fuddin
Pp Regresi. Jadippt
Pp Regresi. Jadippt
guesta81b5f
INDIA QUIZ 2024 RLAC DELHI UNIVERSITY.pptx
RAM LAL ANAND COLLEGE, DELHI UNIVERSITY.
Activity 01 - Artificial Culture (1).pdf
ciinovamais
More Related Content
Similar to Output
Minhhoa bai giang kinh te luong
robodientu
табл гетероскедаст
табл гетероскедаст
lpbimo
Ujian ekonometrika
Ujian ekonometrika
Yolandafitri Zulvia
Data equation
Data equation
ressas
Econometrics Project
Uday Tharar
Lampiran error correction model
Chenk Alie Patrician
Lampiran uji kointegrasi
Chenk Alie Patrician
working data(Group5)
Kritika Gupta
Enflasyon forecast
Enflasyon forecast
mesut bayhan
Design of experiment methodology
CHUN-HAO KUNG
Cobb-douglas production function
Suniya Sheikh
Cobb-douglas production function
Suniya Sheikh
Appendix
Appendix
Oryza Sativa
GARCH
GARCH
pelangi sepi
Durbib- Watson D between 0-2 means there is a positive correlati
AlyciaGold776
Doe with response surface model
Mark Reich
Lampiran uji kointegrasi
Chenk Alie Patrician
Cross validationreport dataakuisisibaru9720031xv
farah mutik
Autoregressive integrated moving average
Muhammad Khoirul Fuddin
Pp Regresi. Jadippt
Pp Regresi. Jadippt
guesta81b5f
Similar to Output
(20)
Minhhoa bai giang kinh te luong
табл гетероскедаст
табл гетероскедаст
Ujian ekonometrika
Ujian ekonometrika
Data equation
Data equation
Econometrics Project
Lampiran error correction model
Lampiran uji kointegrasi
working data(Group5)
Enflasyon forecast
Enflasyon forecast
Design of experiment methodology
Cobb-douglas production function
Appendix
Appendix
GARCH
GARCH
Durbib- Watson D between 0-2 means there is a positive correlati
Doe with response surface model
Lampiran uji kointegrasi
Cross validationreport dataakuisisibaru9720031xv
Autoregressive integrated moving average
Pp Regresi. Jadippt
Pp Regresi. Jadippt
Recently uploaded
INDIA QUIZ 2024 RLAC DELHI UNIVERSITY.pptx
RAM LAL ANAND COLLEGE, DELHI UNIVERSITY.
Activity 01 - Artificial Culture (1).pdf
ciinovamais
microwave assisted reaction. General introduction
Maksud Ahmed
Hybridoma Technology ( Production , Purification , and Application )
Sakshi Ghasle
Introduction to ArtificiaI Intelligence in Higher Education
pboyjonauth
How to Make a Pirate ship Primary Education.pptx
manuelaromero2013
Mastering the Unannounced Regulatory Inspection
SafetyChain Software
Presentation by Andreas Schleicher Tackling the School Absenteeism Crisis 30 ...
EduSkills OECD
Accessible design: Minimum effort, maximum impact
dawncurless
Student login on Anyboli platform.helpin
RaunakKeshri1
Mattingly "AI & Prompt Design: The Basics of Prompt Design"
National Information Standards Organization (NISO)
Grant Readiness 101 TechSoup and Remy Consulting
TechSoup
A Critique of the Proposed National Education Policy Reform
Chameera Dedduwage
Software Engineering Methodologies (overview)
eniolaolutunde
Industrial Policy - 1948, 1956, 1973, 1977, 1980, 1991
RKavithamani
Beyond the EU: DORA and NIS 2 Directive's Global Impact
PECB
Measures of Central Tendency: Mean, Median and Mode
Thiyagu K
“Oh GOSH! Reflecting on Hackteria's Collaborative Practices in a Global Do-It...
Marc Dusseiller Dusjagr
Z Score,T Score, Percential Rank and Box Plot Graph
Thiyagu K
Arihant handbook biology for class 11 .pdf
chloefrazer622
Recently uploaded
(20)
INDIA QUIZ 2024 RLAC DELHI UNIVERSITY.pptx
Activity 01 - Artificial Culture (1).pdf
microwave assisted reaction. General introduction
Hybridoma Technology ( Production , Purification , and Application )
Introduction to ArtificiaI Intelligence in Higher Education
How to Make a Pirate ship Primary Education.pptx
Mastering the Unannounced Regulatory Inspection
Presentation by Andreas Schleicher Tackling the School Absenteeism Crisis 30 ...
Accessible design: Minimum effort, maximum impact
Student login on Anyboli platform.helpin
Mattingly "AI & Prompt Design: The Basics of Prompt Design"
Grant Readiness 101 TechSoup and Remy Consulting
A Critique of the Proposed National Education Policy Reform
Software Engineering Methodologies (overview)
Industrial Policy - 1948, 1956, 1973, 1977, 1980, 1991
Beyond the EU: DORA and NIS 2 Directive's Global Impact
Measures of Central Tendency: Mean, Median and Mode
“Oh GOSH! Reflecting on Hackteria's Collaborative Practices in a Global Do-It...
Z Score,T Score, Percential Rank and Box Plot Graph
Arihant handbook biology for class 11 .pdf
Output
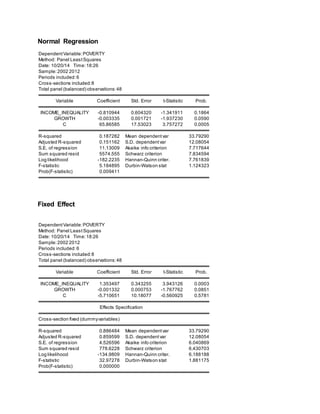
1.
Normal Regression DependentVariable:POVERTY Method: Panel
LeastSquares Date: 10/20/14 Time:18:26 Sample:2002 2012 Periods included:6 Cross-sections included:8 Total panel (balanced) observations:48 Variable Coefficient Std. Error t-Statistic Prob. INCOME_INEQUALITY -0.810944 0.604320 -1.341911 0.1864 GROWTH -0.003335 0.001721 -1.937230 0.0590 C 65.86585 17.53023 3.757272 0.0005 R-squared 0.187282 Mean dependentvar 33.79290 Adjusted R-squared 0.151162 S.D. dependentvar 12.08054 S.E. of regression 11.13009 Akaike info criterion 7.717644 Sum squared resid 5574.555 Schwarz criterion 7.834594 Log likelihood -182.2235 Hannan-Quinn criter. 7.761839 F-statistic 5.184895 Durbin-Watson stat 1.124323 Prob(F-statistic) 0.009411 Fixed Effect DependentVariable:POVERTY Method: Panel LeastSquares Date: 10/20/14 Time:18:26 Sample:2002 2012 Periods included:6 Cross-sections included:8 Total panel (balanced) observations:48 Variable Coefficient Std. Error t-Statistic Prob. INCOME_INEQUALITY 1.353497 0.343255 3.943126 0.0003 GROWTH -0.001332 0.000753 -1.767762 0.0851 C -5.710651 10.18077 -0.560925 0.5781 Effects Specification Cross-section fixed (dummyvariables) R-squared 0.886484 Mean dependentvar 33.79290 Adjusted R-squared 0.859599 S.D. dependentvar 12.08054 S.E. of regression 4.526596 Akaike info criterion 6.040869 Sum squared resid 778.6228 Schwarz criterion 6.430703 Log likelihood -134.9809 Hannan-Quinn criter. 6.188188 F-statistic 32.97278 Durbin-Watson stat 1.881175 Prob(F-statistic) 0.000000
2.
Random Effect DependentVariable:POVERTY Method: Panel
EGLS (Cross-section random effects) Date: 10/20/14 Time:18:27 Sample:2002 2012 Periods included:6 Cross-sections included:8 Total panel (balanced) observations:48 Swamy and Arora estimator ofcomponentvariances Variable Coefficient Std. Error t-Statistic Prob. INCOME_INEQUALITY 0.176665 0.297120 0.594591 0.5551 GROWTH -0.001965 0.000734 -2.679417 0.0103 C 32.28042 8.784750 3.674597 0.0006 Effects Specification S.D. Rho Cross-section random 2.579440 0.2451 Idiosyncratic random 4.526596 0.7549 Weighted Statistics R-squared 0.051060 Mean dependentvar 19.68061 Adjusted R-squared 0.008885 S.D. dependentvar 8.057974 S.E. of regression 8.022097 Sum squared resid 2895.932 F-statistic 1.210668 Durbin-Watson stat 1.120413 Prob(F-statistic) 0.307519 Unweighted Statistics R-squared 0.081349 Mean dependentvar 33.79290 Sum squared resid 6301.170 Durbin-Watson stat 0.847309
Download now