Separation of Lanthanides/ Lanthanides and Actinides
Interpreting data
1. INTERPRETING DATA
SET 1
1.
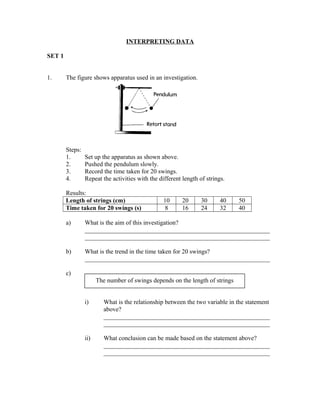
The figure shows apparatus used in an investigation.
Steps:
1.
2.
3.
4.
Set up the apparatus as shown above.
Pushed the pendulum slowly.
Record the time taken for 20 swings.
Repeat the activities with the different length of strings.
Results:
Length of strings (cm)
Time taken for 20 swings (s)
10
8
20
16
30
24
40
32
50
40
a)
What is the aim of this investigation?
___________________________________________________________
___________________________________________________________
b)
What is the trend in the time taken for 20 swings?
___________________________________________________________
c)
The number of swings depends on the length of strings
i)
What is the relationship between the two variable in the statement
above?
_____________________________________________________
_____________________________________________________
ii)
What conclusion can be made based on the statement above?
_____________________________________________________
_____________________________________________________
2. 2.
Diagram below shows an investigation carried out by Fiza. She puts three
different sizes of sponge in three containers. Each container contains 500 ml
water.
500 ml
water
500 ml
water
Container P
Container Q
Container R
After 15 minutes, she recorded the volume of water left in the container. The
result are shown in the table below.
Container
P
Q
R
Volume of water left / ml
400
250
100
a)
What is the aim of the investigation?
___________________________________________________________
___________________________________________________________
b)
What is the trend of change in the volume of water left?
___________________________________________________________
c)
State the relationship between the size of sponge and the volume of water
absorb by the sponge.
___________________________________________________________
___________________________________________________________
d)
What conclusion can you make based on the table above?
___________________________________________________________
___________________________________________________________
3. 3.
The table below shows the mass of sugar dissolved in the water.
Temperature of water /o C
35
45
55
65
75
Mass of sugar dissolved / g
25
50
75
100
125
a)
What is the trend in the mass of sugar dissolved?
__________________________________________________________
b)
What is the relationship between the two variables in the table?
__________________________________________________________
__________________________________________________________
c)
The time taken for the sugar to dissolve depends on the
volume of water used.
i)
Write the aim of investigation based on the statement above.
____________________________________________________
____________________________________________________
ii)
What conclusion can be made based on the statement above?
____________________________________________________
____________________________________________________
4. 4.
The graph below shows the observation of an experiment conducted by a group of
pupils.
Number of flower
15
12
9
6
3
Amout of
fertilizer / g
10
15
20
25
30
35
a)
What is the pattern in the number of flower grown?
__________________________________________________________
b)
What is the purpose of the experiment above?
__________________________________________________________
__________________________________________________________
c)
What is the relationship between the two factors recorded in the
experiment?
__________________________________________________________
__________________________________________________________
d)
What conclusion can you make based on the experiment above?
__________________________________________________________
__________________________________________________________
5. INTERPRETING DATA
SET 2
1.
The table below shows an observation of an experiment conducted by Arif.
Time / minutes
Temperature of liquid X / o C
0
25
5
31
10
42
15
55
20
68
25
75
30
82
a)
State the purpose of the experiment above.
__________________________________________________________
__________________________________________________________
b)
What is the pattern of the temperature shown?
_________________________________________________________
c)
State the relationship between the time taken and the temperature of liquid
S.
__________________________________________________________
__________________________________________________________
d)
What can be concluded from this experiment?
__________________________________________________________
__________________________________________________________
6. 2.
An investigation was carried out by a group of pupils in 5 Jauhari.
Distance
Torchlight
Ball
Shadow
Screen
Distance
Torchlight
Ball
a)
What do they want to find out?
_________________________________________________________
_________________________________________________________
b)
What is the trend in the size of shadow?
__________________________________________________________
__________________________________________________________
c)
What is the relationship between the two factors recorded in the
experiment?
__________________________________________________________
__________________________________________________________
d)
What conclusion can you make based on the experiment above?
__________________________________________________________
__________________________________________________________
7. 3.
The table below shows the weight of squid that has been caught in one month
Phase of moon
Weight of squid
caught / kg
30
100
250
300
a)
What is the purpose can made based on the table?
___________________________________________________________
___________________________________________________________
b)
What is the trend in the weight of squid caught?
__________________________________________________________
c)
State the relationship between the size of moon and the weight of squid
caught.
__________________________________________________________
__________________________________________________________
d)
What conclusion can be made based on the table?
__________________________________________________________
__________________________________________________________
8. 4.
A group of pupils carried out an experiment to find out if microorganisms can
grow. They sprinkled three pieces of bread with different amount of water. The
figure below shows the results after two weeks.
black patches
black patches
5 drops
water
15 drops
water
25 drops
water
a)
What is the aim of the investigation?
__________________________________________________________
__________________________________________________________
b)
Describe the changes in the size of black patches on the bread.
__________________________________________________________
c)
State the relationship between the amount of water sprinkle and the size of
black patches.
__________________________________________________________
__________________________________________________________
d)
What can be concluded through this experiment?
__________________________________________________________
__________________________________________________________
9. INTERPRETING DATA
SET 3
1.
The graph below shows the observation of an experiment conducted by a group of
pupils.
The distance of the
ball / cm
65
30
16
Carpet
Sandpaper
Glass
The type of
surface
a)
What is the pattern in the distance of the ball?
__________________________________________________________
b)
What is the purpose of the experiment above?
__________________________________________________________
__________________________________________________________
c)
What is the relationship between the two factors recorded in the
experiment?
__________________________________________________________
__________________________________________________________
d)
What conclusion can you make based on the experiment above?
__________________________________________________________
__________________________________________________________
10. 2.
The table below shows the number of elephants in forest Y from year 2000 to
year 2005.
Area of forest Y / km2
Number of elephants
3000
300
2500
270
2200
240
1800
210
1500
180
1000
150
a)
What is the purpose can made based on the table?
___________________________________________________________
___________________________________________________________
b)
What is the trend in the number of elephants?
__________________________________________________________
c)
State the relationship between the two factors in this investigation.
__________________________________________________________
__________________________________________________________
d)
What conclusion can be made based on the table?
__________________________________________________________
__________________________________________________________
11. 3.
The diagram below shows an investigation carried out by Arash.
Container E
Container F
Table below shows the results of the investigation.
Container
E
F
Height of young plants / cm
11
23
a)
What is the change in the height of young plants?
___________________________________________________________
___________________________________________________________
b)
What is aim of this investigation?
__________________________________________________________
c)
Make a conclusion for this investigation..
__________________________________________________________
__________________________________________________________
d)
The amount of water can affect the size of young plant
What hypothesis can be made from the statement?
__________________________________________________________
__________________________________________________________
12. 4.
Diagram below shows an investigation carried out by Arissa. Three circuits with
different number of batteries are used in this investigation.
Table below shows the brightness of the bulb in each circuits.
Number of batteries
Brightness of bulbs
1
Dim
2
Bright
3
Very bright
a)
What is the purpose of this investigation?
___________________________________________________________
___________________________________________________________
b)
What is the trend in the brightness of bulbs?
__________________________________________________________
c)
State the relationship between the number of batteries used and the
brightness of the bulbs.
__________________________________________________________
__________________________________________________________
d)
What conclusion can you made from this investigation?
__________________________________________________________
__________________________________________________________
13. ANSWER KEY
SET 1
QUESTION
1
2
3
4
ANSWER
a) To investigate the relationship between the length of strings
and the time taken for 20 swings.
b) Increase
c) The longer the length of strings, the less number of 20 swings.
d) If the lengths of strings increase, the number of 20 swings
increase.
a) To find out the relationship between the size of sponge and the
volume of water left.
b) Decrease
c) The bigger the size of sponge, the more volume of water
absorb by the sponge.
d) If the sizes of sponge increase, the volume of water left
decrease.
a) Increase
b) The higher the temperature of water, the more mass of sugar
dissolves.
c) To study the relationship between the volume of water and
the time taken for the sugar to dissolves.
d) If the volumes of water increase, the time taken for the sugar
to dissolves decrease.
a) Increase
b) To investigate the relationship between the amount of
fertilizer and the number of flower.
c) The more amount of fertilizer, the more number of flowers.
d) If the amounts of fertilizer increase, the number of flowers
increase.
14. SET 2
QUESTION
1
a)
b)
c)
d)
2
a)
b)
c)
d)
3
a)
b)
c)
d)
4
a)
b)
c)
d)
ANSWER
To find out the relationship between the time and the
temperature of liquid X.
Increase
If the time taken increase, the temperature of liquid X
increase.
As the time taken increase, the temperature of liquid X
increase.
To find out the relationship between the distance of ball from
light source and the size of the shadow.
Decrease
The longer the distance of ball from light source, the smaller
the size of shadow.
If the distances of ball from the light source increases, the
sizes of shadow decrease.
To study the relationship between the size of moon and the
weight of squid caught.
Increase
The bigger the size of moon, the more weight of squid caught.
If the sizes of moon increase, the weight of squid caught
increase.
To investigate the relationship between the amount of water
sprinkled and the sizes of black patches.
Increase
The more amount of water sprinkle, the bigger the size of
black patches.
If the amounts of water sprinkled increase, the size of black
patches increase.
15. SET 3
QUESTION
1
2
3
4
ANSWER
a) Increase
b) To investigate the relationship between the type of surface
and the distance of the ball.
c) The smoother the surface, the longer the distance of the ball.
d) If the surface smooth, the distance of the ball increases
a) To study the relationship between the area of forest and the
number of elephant.
b) Decrease
c) The lesser the area of forest, the lesser the number of
elephant.
d) As the area of forest decrease, the number of elephants
increases.
a) Increase
b) To investigate the relationship between the number of young
plant and the height of young plant.
c) If the numbers of young plant decrease, the heights of young
plants increase.
d) The more amount of water, the bigger size of young plant.
a) To find out the relationship between the number of batteries
and the brightness of bulbs.
b) Increase
c) The more the numbers of batteries, the more brightness of the
bulb.
d) If the numbers of batteries increase, the brightness of the
bulbs increases.